Article

Convective Drying of Fresh and Frozen Raspberries and Change of Their Physical and Nutritive Properties

by
Zoran Stamenković
1,
Ivan Pavkov
1,
Milivoj Radojčin
1,*,
Aleksandra Tepić Horecki
2,
Krstan Kešelj
1,
Danijela Bursać Kovačević
3 and
Predrag Putnik
3
1
Faculty of Agriculture, University of Novi Sad, Trg Dositeja Obradovića 8, 21000 Novi Sad, Serbia
2
Faculty of Technology, University of Novi Sad, Bulevarcara Lazara 1, 21000 Novi Sad, Serbia
3
Faculty of Food Technology and Biotechnology, University of Zagreb, Pierottijeva 6, 10000 Zagreb, Croatia
*
Author to whom correspondence should be addressed.
Foods 2019, 8(7), 251; https://doi.org/10.3390/foods8070251
Submission received: 7 June 2019 / Revised: 28 June 2019 / Accepted: 4 July 2019 / Published: 11 July 2019
(This article belongs to the Special Issue Safety, Quality and Processing of Fruits and Vegetables)

Abstract

:
Raspberries are one of Serbia’s best-known and most widely exported fruits. Due to market fluctuation, producers are looking for ways to preserve this fresh product. Drying is a widely accepted method for preserving berries, as is the case with freeze-drying. Hence, the aim was to evaluate convective drying as an alternative to freeze-drying due to better accessibility, simplicity, and cost-effectiveness of Polana raspberries and compare it to a freeze-drying. Three factors were in experimental design: air temperature (60, 70, and 80 °C), air velocity (0,5 and 1,5 m · s−1), and state of a product (fresh and frozen). Success of drying was evaluated with several quality criteria: shrinkage (change of volume), color change, shape, content of L-ascorbic acid, total phenolic content, flavonoid content, anthocyanin content, and antioxidant activity. A considerable influence of convective drying on color changes was not observed, as ΔE was low for all samples. It was obvious that fresh raspberries had less physical changes than frozen ones. On average, convective drying reduced L–ascorbic acid content by 80.00–99.99%, but less than 60% for other biologically active compounds as compared to fresh raspberries. Convective dried Polana raspberry may be considered as a viable replacement for freeze-dried raspberries.

1. Introduction

Raspberries (Rubus idaeus) are one of the most important fruits in Serbian agriculture. It has been recently reported that raspberry production in 2017 was 109,742 t, which positions Serbia as one from the three leading countries in raspberry world production [1]. Over 90% of produced Serbian raspberries are commonly frozen, while only 10% is immediately used for processing or sold on open markets [2]. At their full maturity, raspberries have high moisture content (84% w.b.), L-ascorbic acid content, and potassium, as well as proteins, fibers, and minerals [3,4,5,6,7]; moreover, they contain various biologically active compounds (BACs) with high antioxidant activity. BACs found in raspberries include anthocyanins (cyanidin-3-sambubioside, cyanidin-3-glucoside, cyanidin-3-xylosylrutinoside, and cyanidin-3-rutinoside), ellagic acid, hydrolysable tannins (derivatives of gallic and ellagic acid), proanthocyanidins, vecetin, quercetin and rutin [8,9,10], carotenoids (lutein, zeaxanthin, alpha carotene, and beta carotene), chlorophyll derivatives, and tocopherols [11], with antioxidative and anti-inflammatory potential [12,13].
In Serbia, raspberries are often processed to jelly, diary, or confectionery products able to be stored for a longer time [6,14,15,16,17], however it is difficult to preserve this berries with high level of natural properties. In industry, this problem is commonly tackled with some form of drying, where one of the most popular procedures is convective drying that is done at high temperatures and for a long processing time. This often leads to chemical and biochemical changes and loss of native quality of this fruits with changes of color, taste, aroma, and nutritive value [18]. Previous studies showed that convective drying of red raspberries changed their volume, color, shape, and the content of BACs, this is especially true for contents of L–ascorbic acid, flavonoids, anthocyanins, and others [6,19,20,21]. Therefore, freeze-drying has been established as a standard process in the industry, to preserve nutritive value and extend the shelf life. A downside, however, is that freeze-drying is an expensive technology, not only in terms of the initial investment, but also during processing, even though previous reports showed that freeze-dried fruits, in comparison to convective dried ones, have better preserved their physiochemical, nutritive, and sensory properties [22,23]. The choice of the drying method for a particular food product is a crucial step as the drying procedure and operating conditions have impact on the quality of the dried product and its cost [24]. Despite its simplicity and low investment cost, convective drying is the most common dehydration technique in the food industry with a focus on minimizing economic and environmental impacts. Energy consumption and energy saving potential of convective drying may be tempered by combining new technologies with traditional drying procedures. Bórquez et al. [6] evaluated quality changes during osmotic dehydration of raspberries in sucrose solution with vacuum pretreatment, and followed by microwave-vacuum drying. Obtained results showed acceptable results regarding the preservation of color, taste and structure of these berries. Unfortunately, L-ascorbic acid content decreased 5-fold (220 to 41 mg/100 g), therefore reutilization of sucrose solution with higher initial concentration of L-ascorbic acid is recommended to reduce the losses to 60%.
Kowalski et al. [20] tested different drying techniques of raspberries, i.e., hot air drying vs. combined hybrid drying consisting of simultaneous hot air, microwave, and ultrasound drying, on the kinetics, energy consumption, and product quality. Results revealed that combined hybrid drying significantly improved the drying kinetics and the energy utilization. However, the total CIELab color difference (ΔE) ranged from 12 to 15, which implies significant degradation of color in dried raspberries. In addition, when final product was compared to fresh raspberry, considerable volumetric shrinkage was recorded with slight changes in the shape, but only after convective drying.
Bustos et al. [25] studied the impact of convective drying at various temperatures on phenolic characterization in both, raspberries (Rubus idaeus var. Autumn Bliss) and boysenberries (Rubus ursinus × Rubus idaeus var. Black Satin). Berries were applied to different convective drying conditions: 50 °C for 48 h, 65 °C for 20 h or 130 °C for 2 h until a moisture content was below 15%. Obtained results indicated that drying regime at 65 °C during 20 h was optimum for the best preservation of color, polyphenol content and antioxidant activity in dried berries. Moreover, authors argued that conventional drying is more economical than freeze-drying, and with considerable increase of total polyphenolic content due to depolymerization of native polyphenols which lead to improved antioxidant activity. Different raspberry cultivars, have different sensitivity to convective drying mostly evident by changes in their physical (e.g., reduced rehydration), mechanical (e.g., initial shape), nutritive (e.g., loss of nutrients), and sensory properties (e.g., formation of unpleasant aroma). Furthermore, Pavkov et al. [17] found that physiochemical properties and rehydration capacity of Polana and Polka varieties could be partially preserved after convective drying.
Therefore, the aim of this research was to investigate the influence of convective drying on physiochemical properties and quality parameters of red Polana raspberry for fresh and frozen samples. Evaluated quality parameters included changes in volume and shape, color, L-ascorbic acid, total phenolic content, flavonoid content, anthocyanin content, and antioxidant activity. All results were controlled against freeze-dried raspberries.

2. Materials and Methods

2.1. Plant Material

Polana variety samples of red raspberries at full maturity were taken from the local farmers during August and October, 2017, at area of Novi Sad, Republic of Serbia. The raspberry fruits were harvested few hours prior to each experiment. The selected samples were approximately equal in size, volume, color, mass, and humidity. Average values of these properties were obtained from raspberry fruits subsample (n = 500) that were as following; (i) moisture content Xd.b = 5.45 ± 0.45 kgw/kgd.b.; (ii) mass m = 3.30 ± 0.24 g; (iii) length a = 21.26 ± 0.74 mm, width b = 20.08 ± 0.56 mm, and thickness c = 18.63 ± 0.62 mm; (iv) volume V = 3.17 ± 0.22 cm3; and (iv) water activity aw = 0.979 ± 0.001, at the temperature of 20 °C, total soluble solids of 6.6% and pH = 3.26 ± 0.02.

2.2. Convective Drying and Freeze-Drying of Raspberries

Raspberry fruits were dried as fresh or as frozen (with commercial freezer at −20 °C) with lab-scale convective dryer, designed and constructed to control for air flow (through the layer of processing material), air drying temperature, and continuous monitoring of the sample mass in processing [26]. The dryer chamber door was made up of glass, hence light could have some minimal impact on the quality drying products. In order to compare all results with controls, part of fresh fruits was freeze-dried with Martin Christ, Alpha 2-4 LDplus, without heating of the plates. Drying conditions were −83.8 °C on an ice condenser, with vacuum pressure of 0.0088 mbar in a drying chamber. Samples were dried for 48 h until average humidity at the end of the drying process of Xd.b = 0.07 kgw/kgd.b.

2.3. Experimental Design and Statistical Analysis

Convective raspberry drying was three-factor experiment with one qualitative and two quantitative factors. The qualitative factor represented the initial state of the raspberry fruit before drying with two levels (fresh and frozen raspberries). Quantitative factors of the experiment were drying temperatures (60, 70, to 80 °C) and air velocity (0.5 to 1.5 m·s−1). The absolute air humidity was approximately constant in the experiments with average value 0.011 ± 0.002 kgw/kgd.air. For each experimental run, the initial mass of the raspberries was approximately 500 g. Raspberry samples were set on perforated sieve in a thin stagnant layer and placed in a drying chamber. Air flew along or across the surface of the material in the dryer, and the samples were dried until the same value of moisture content of approximately Xd.b = 0.152 kgw/kgd.b. The experiment was conducted with three repetitions for each experimental run.

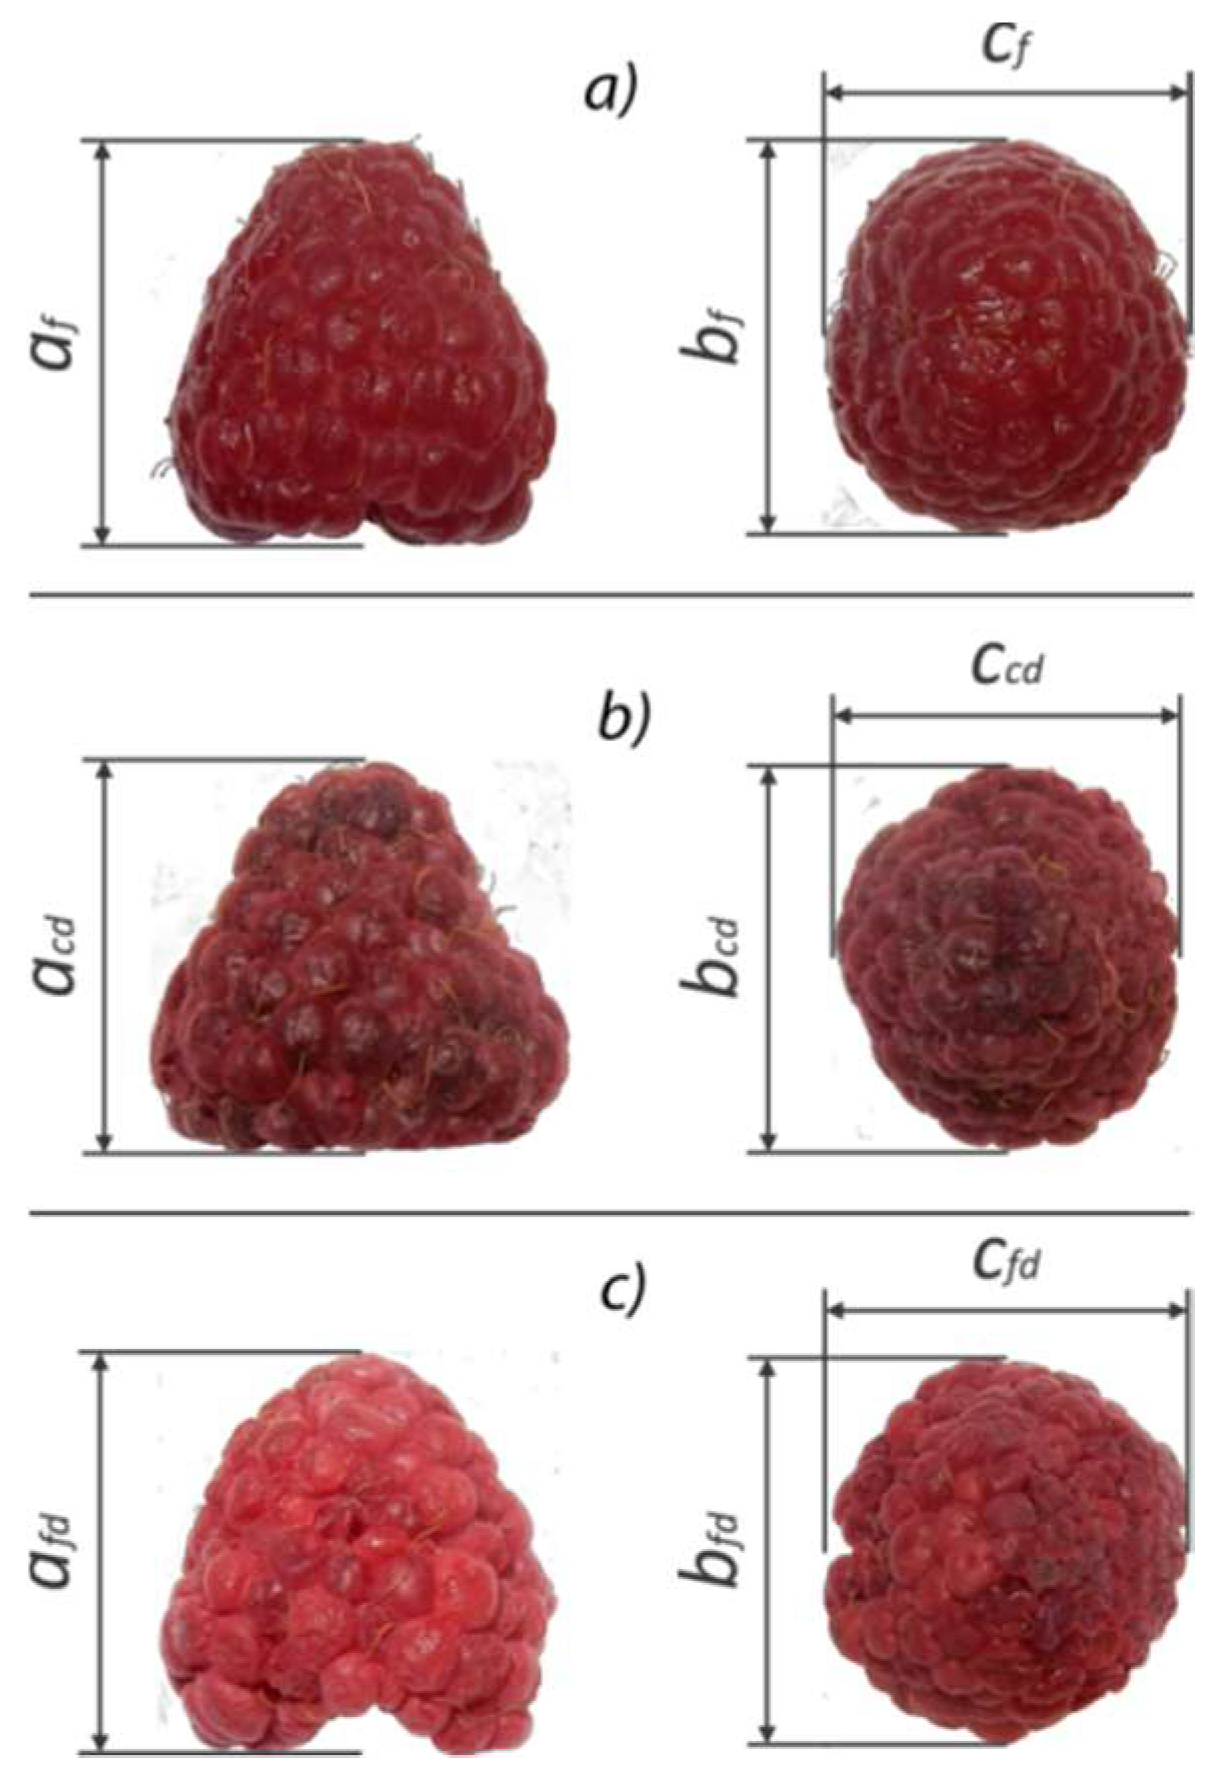
2.4. Measuring of Volume and Shrinkage Determination

When drying some biomaterial, volume shrinkage (Vsh) is one of the most common physical and quality indicators of the final product. Shrinkage is expressed by the ratio between the change of volume after drying and volume of sample before drying. The samples volume (n = 45) were measured by immersing the raspberries into 96% concentration of ethanol [27] according to
V0 = (m0 − ml)/ρt
where m0 is the mass of liquid and the immersed sample (kg), ml is the mass of liquid, and ρt is the liquid density (kg/m3). The volumetric shrinkage of raspberries (Vsh) was based on the following equation [28].
Vsh = ((V0 − Vi)/V0) × 100
where V0 is initial average volume and Vi is volume of each raspberry after drying.

2.5. Determination of Heywood Shape Factor

If observed independently, the volumetric shrinkage is not a sufficient indicator of the changes in dried material. For this reason, an additional indicator was used to monitor changes of shape, i.e., Heywood shape factor (k), able to detect the changes after drying [29,30,31]. This factor k = 0.523 and was calculated from the relation
k = Vp/da3
where Vp is the particle volume with equivalent diameter of the projected area of the particles. This was obtained by assigning the area of an equivalent circle with the same greater diameter as that of the fruit [32].

2.6. Color Measurement and Total Color Difference

Before and after each drying regime, CIELab color parameters were assessed for raspberry samples (n = 45) by colorimeter Konica Minolta CR400(C-light source and the observer angle of 2°). Where L* was whiteness/brightness, a* was redness/greenness, and b* represented yellowness/blueness. The total color difference (ΔE), hue angle (ho) and chromaticity (C*) were calculated by Equations (4)–(6) [33,34]:
ΔE = ((L* − L0)2+(a* − a0)2 + (b* − b0)2)1/2
h0 = arctan (b*/a*)
C* = ((a*)2 − (b*)2)1/2
where, L0, a0, and b0 are the color values before drying, while L*, a*, and b* are the color values after drying.

2.7. Analysis of Nutritiveproperties

2.7.1. Extraction Procedure

Methanol extract was prepared from the fresh/dried raspberry samples to determine the contents of total phenols, flavonoids, and radical scavenging capacity. Briefly, 50 mL of an extraction solvent (methanol, 99.8%) (Fisher Scientific, UK) was poured over the raspberry sample into an Erlenmeyer flask. The flasks were covered and placed on a laboratory stirrer for 24 h (in a dark place). After the extraction, the samples were transferred to volumetric flasks of determined volume, filtered, and stored in a dark and cool place until the analysis was carried out.

2.7.2. Determination of Total Phenolic Content (TPC)

The TPC in methanol extracts of fresh and dried raspberries was determined by Folin–Ciocalteu spectrophotometric method [35]. In a 50 mL volumetric flask with V = 0.5 mL of extract, 0.25 mL of Folin–Ciocalteu was mixed and 0.75 mL of 20% Na2CO3 (m/v). After 3 min of stirring, distilled water was added and made up to volume of 50 mL. Reaction mixture was left to stand at room temperature for 2h and absorbencies were measured at 765 nm by UV–Vis spectrophotometer. Based on the measured absorbance, the concentration (mg/mL) of TPC was calculated from the calibration curve of the standard solution of gallic acid. The results are expressed in g of gallic acid equivalents (GAE) per 100 g of fruit dried basis (gGAE/100gd.b).

2.7.3. Determination of Total Flavonoids Content (TFL)

The TFL was determined by previously described colorimetric method [36]. In short, the reaction mixture was prepared by mixing 1 mL of an extract with 4 mL of distilled water and 0.3 mL of a 5% NaNO2 solution (m/v). Then mixture was incubated at room temperature for five minutes, and then 0.3 mL of 10% AlCl3 (m/v) was added. After six minutes, when the solution became very yellow, 2 mL of NaOH was added. Distilled water was added to the reaction mixture and made up the volume to 10 mL in a volumetric flask. The absorbance was measured at 510 nm. The TF were calculated according to the catechin standard calibration curve and expressed in mg of catechin equivalents (CAE) per 100 g of fruit dried basis (mgCAE/100gd.b).

2.7.4. Determination of Radical Scavenging Capacity

The free radical scavenging capacity (RSC) of raspberry extracts was determined using a simple and fast spectrophotometric method described by Espin et al. [37]. Briefly, the prepared extracts were mixed with methanol (95%) and 90 μM 2,2-diphenyl-1-picryl-hydrazyl (DPPH) to give different final concentrations of extract. After 60 min at room temperature, the absorbance was measured at 517 nm. RSC was calculated according to Equation (7) and expressed as IC50 value, which represents the concentration of extract solution required for obtaining 50% of RSC.
RSC (%) = 100 − (Asample × 100)/Ablank
where Ablank is the absorbance of the blank and Asample is the absorbance of the sample. The obtained results were presented as a mass of dry sample material that is necessary for inhibition of 50% of DPPH (IC50 (mgd.b/mL)).

2.7.5. Determination of Monomeric Anthocyanin Content (AC)

The sample preparation for the content of total AC was conducted by previously described method [38]. Here an extraction solvent (ethanolic acid solution) [39] was poured over the samples (fresh or dried raspberries) and the mixture was thoroughly homogenized in a glass beaker. Afterwards, the beaker was covered with paraffin film and left to sit at 4 °C. After 24 h, the extraction mixture was kept at room temperature, filtered, and transferred to volumetric flask and made up to the volume of 100 mL with an extraction solvent. An aliquot of an extract was transferred into two volumetric flasks with added buffers at pH = 1.0 and pH = 4.5. After 15 min, the absorbencies were measured at 510 and 700 nm against distilled water as a blank. The content of AC was recalculated to cyanidin-3-glucoside by
AC = (A × Mw × Df × Vm × 1000)/(ɛ × m)
A = (A510 − A700)pH1,0 − (A510 − A 700)pH4,5
where AC = anthocyanin content (mg/100g); A510 = sample absorbance at λ = 510nm; A700 = sample absorbance at λ = 700nm; Mw = molecular weight of cyanidin-3-glucoside (449.2), Df = dilution factor = original solution volume; ɛ = molar extraction coefficient of cyanidin-3-glucoside (26900); and m = sample weight (g). The content of AC was expressed in mg per 100 g of fruit dried basis (mg/100gd.b).

2.7.6. Determination of Vitamin C Content

Separations and quantifications of vitamin C were performed by HPLC equipment (Thermo Scientific™ UltiMate 3000) on Nucleosil 100-5C18, 5 µm (250 × 4.6 mm I.D.) column (Phenomenex, Los Angeles, CA). Separation was performed with standard method BS EN 14130:2003 (Foodstuffs. Determination of vitamin C by HPLC). The content of AC was expressed in mg ascorbic acid (the sum of ascorbic acid and its oxidative form of dehydroascorbic acid) per 100 g of fruit dried basis (mg/100gd.b).

2.8. Statistical Analysis

For the purposes of statistical tests, analysis of variance was performed (ANOVA) with Statistica13 (Stat Soft, Inc., Oklahoma, United States). In order to define homogenous groups of samples an additional Duncan test was performed with statistical significance at p < 0.05.

3. Results and Discussion

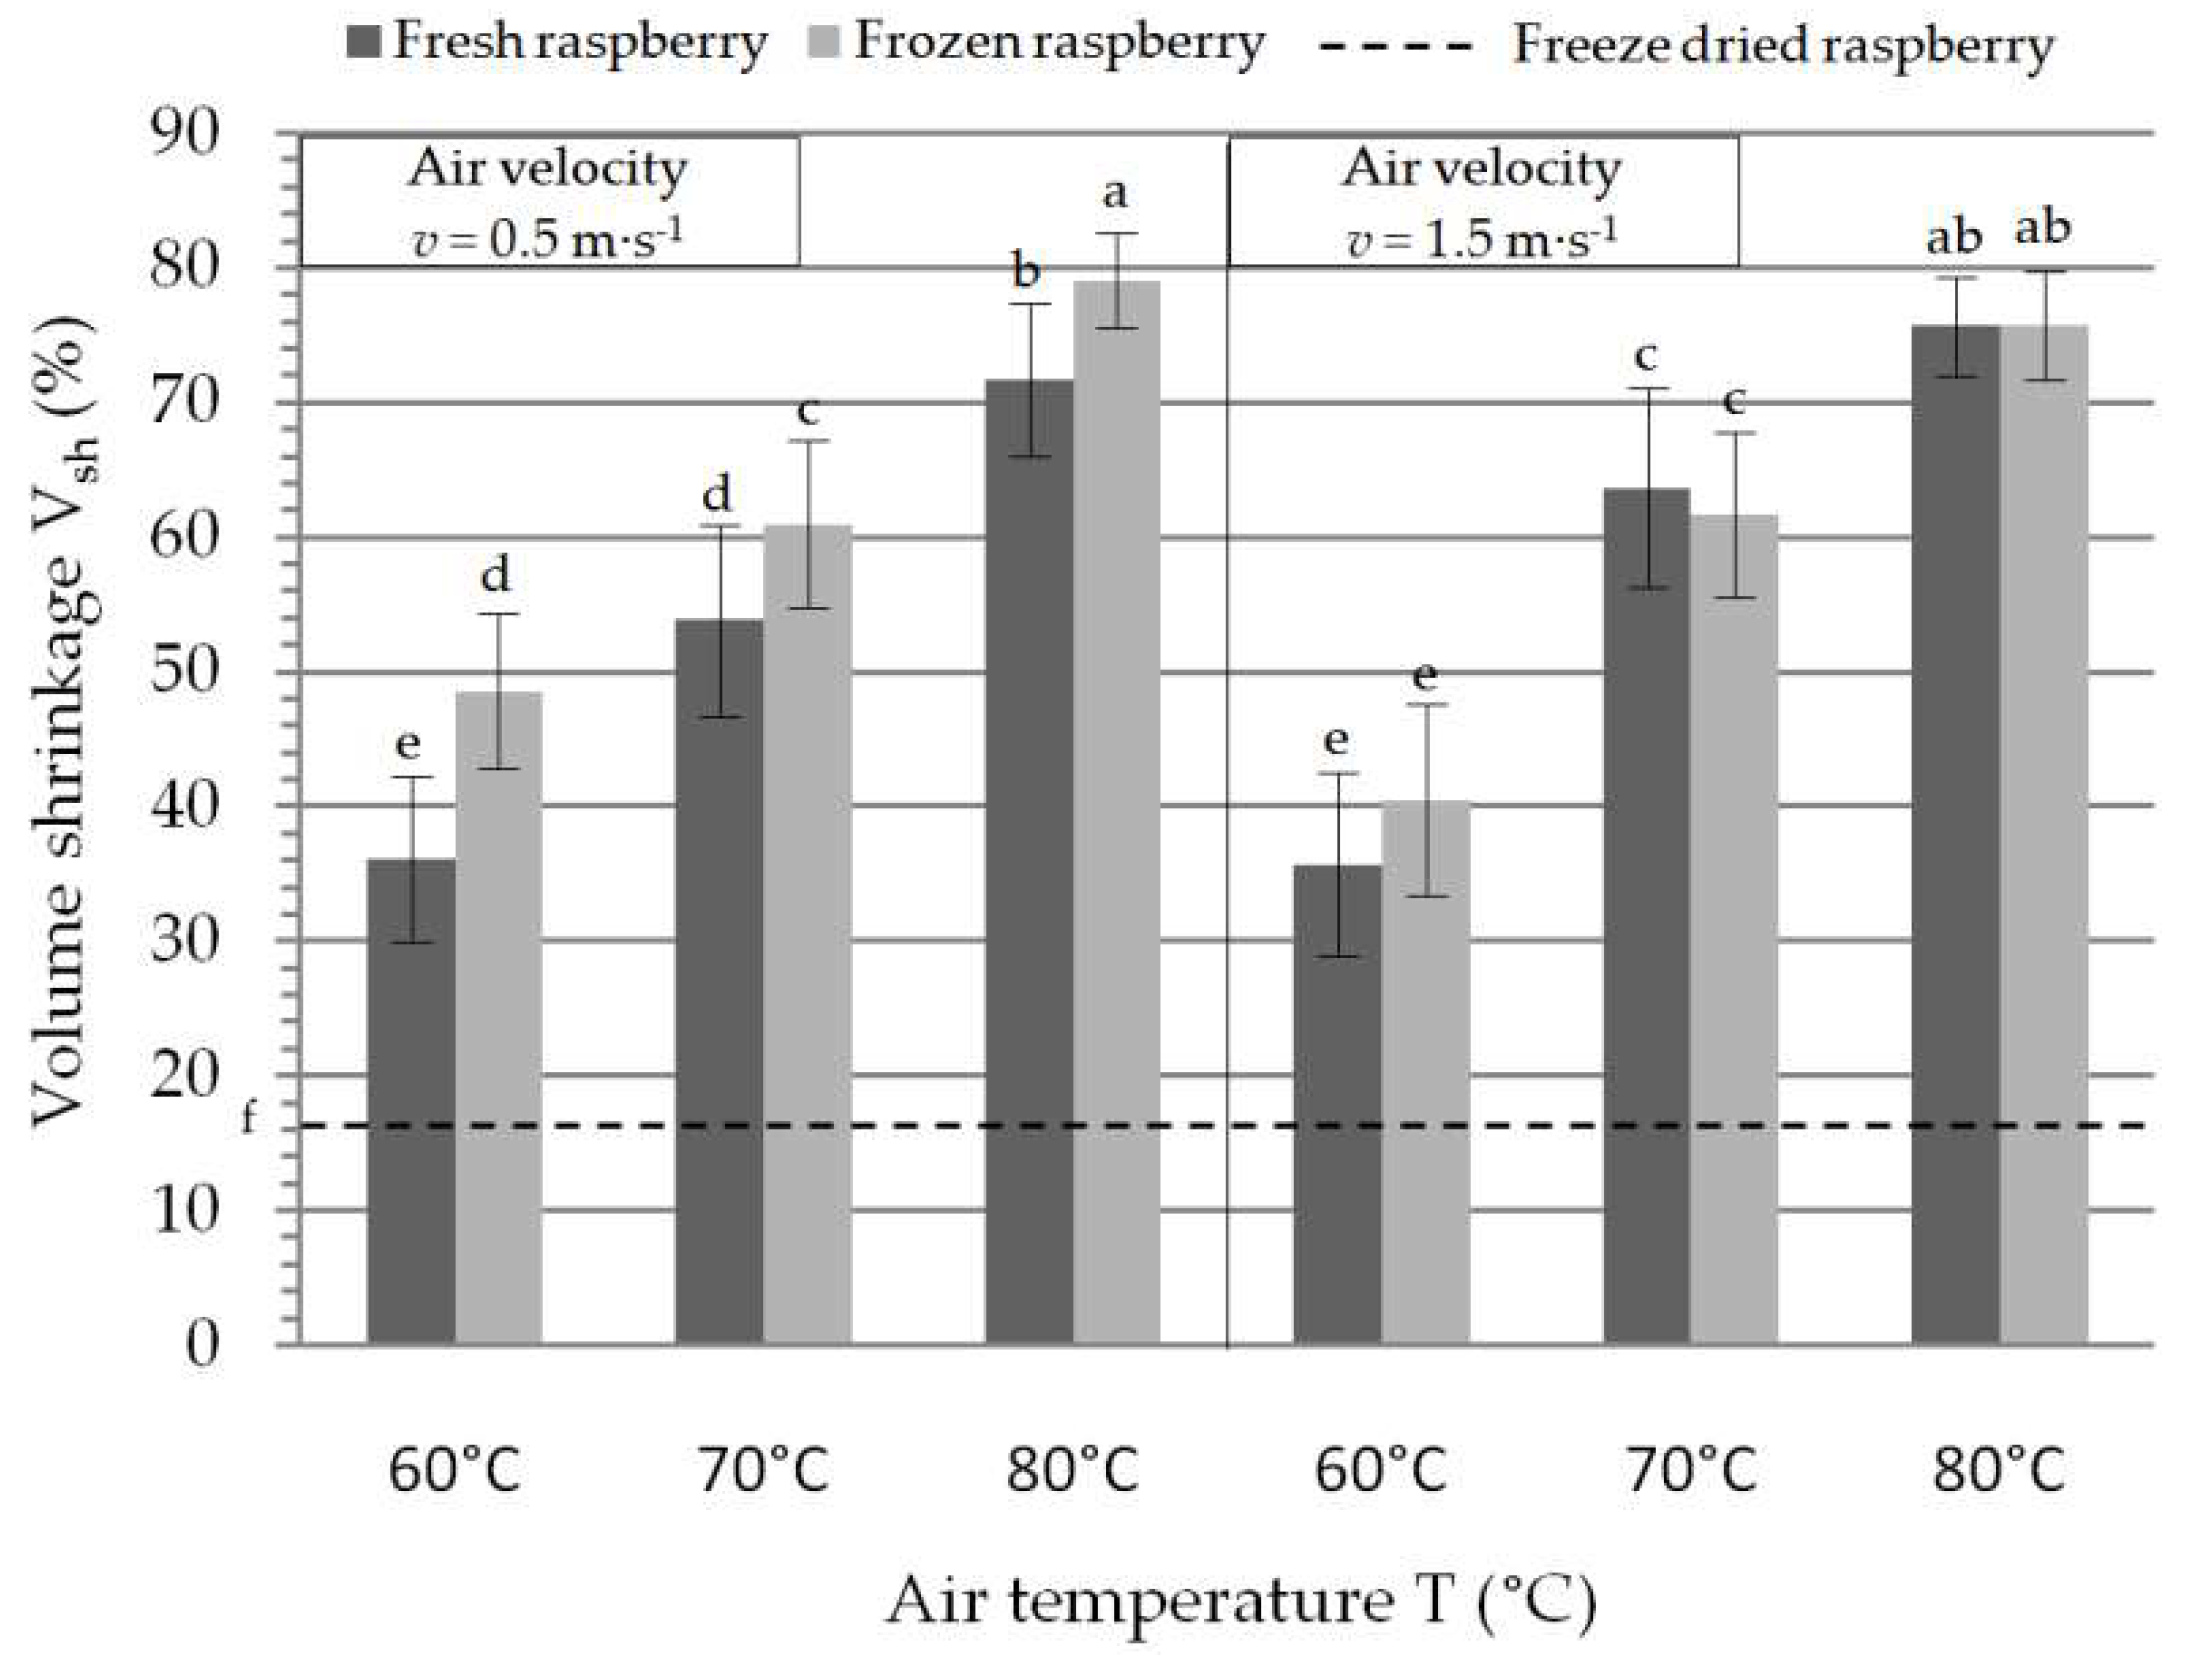
3.1. Volume Shrinkage

Comparison of convective and freeze-drying technique for fresh vs. frozen samples revealed that the least changes in volume had freeze-drying (Vsh = 16.49 ± 2.75%). For convective drying, the least changes in volume had fresh raspberry samples dried at T = 60 °C and air velocity of 1.5 m·s−1 (Vsh = 35.74 ± 6.78%). Pavkov et al. 2017 [17] reported results of air drying red Polana raspberry, dried at air temperature of 50, 60, 70, and 80 °C and constant air velocity of 1 m·s−1. Judging by the volume shrinkage during convective drying, air temperature of 50 °C will lead to a total collapse and loss of the product shape. Interestingly, the least volume shrinkage (23.17%) was achieved with air temperature at 70 °C. Drying with air temperature at 60 °C provoked shrinkage of 28.74%, what is still lower than it was obtained in the current study. Samples dried with air temperature of 80 °C reached volume shrinkage of 43.13%. Results obtained from these two experiments revealed that higher air temperatures do not necessarily lead to higher changes in volume shrinkage. This may be explained by the fact that higher air temperature have tendency to lean towards mechanical stabilization of the raspberry surface, thus limiting the degree of shrinkage.
Air temperature and initial state of the raspberry, prior to convective drying significantly changed the volume of dried raspberry. On the other hand, the air velocity did not have any impact on the change in raspberry volume (Table 1). The most considerable changes in volume occurred when drying frozen raspberries at T = 80 °C and air velocity of 0.5 m·s−1 (Vsh = 79.07 ± 4.07%). As previously reported, drying temperature of 80 °C had similar trend on volume shrinkage [17].
Additional for convective drying, some reports indicated variations in volume shrinkages with regards to raspberry varieties. Sette et al. [29] dehydrated with convective drying previously frozen Autumn Bliss raspberry, at T = 60 °C and air velocity of 1–1.5 m·s−1. Here they found higher volume shrinkage (Vsh = 81 ± 3%) than what was reported in the current study.
Initial raspberry state effected the shrinkage, which was not surprising as creation of the ice crystals tends to destabilize cellular structures and this is particularly emphasized with drying air velocity of 0.5 m·s−1. On the contrary, Duncan’s test revealed that there are no significant differences in the volume shrinkage of the samples which were dried at the same temperature and with velocity of1.5 m·s−1. The reason for this may be the faster drying rate in the first drying period, which can lead to a faster mechanical stabilization of the surface, hence the preservation of the volume. As expected, initial raspberry state had an effect on volume shrinkage, and the results after drying are presented in Figure 1. Figure 2 shows the shrinkage and the changes in fruit size after convective and freeze-drying of fresh raspberry at T = 60 °C and air velocity of 1.5 m·s−1.

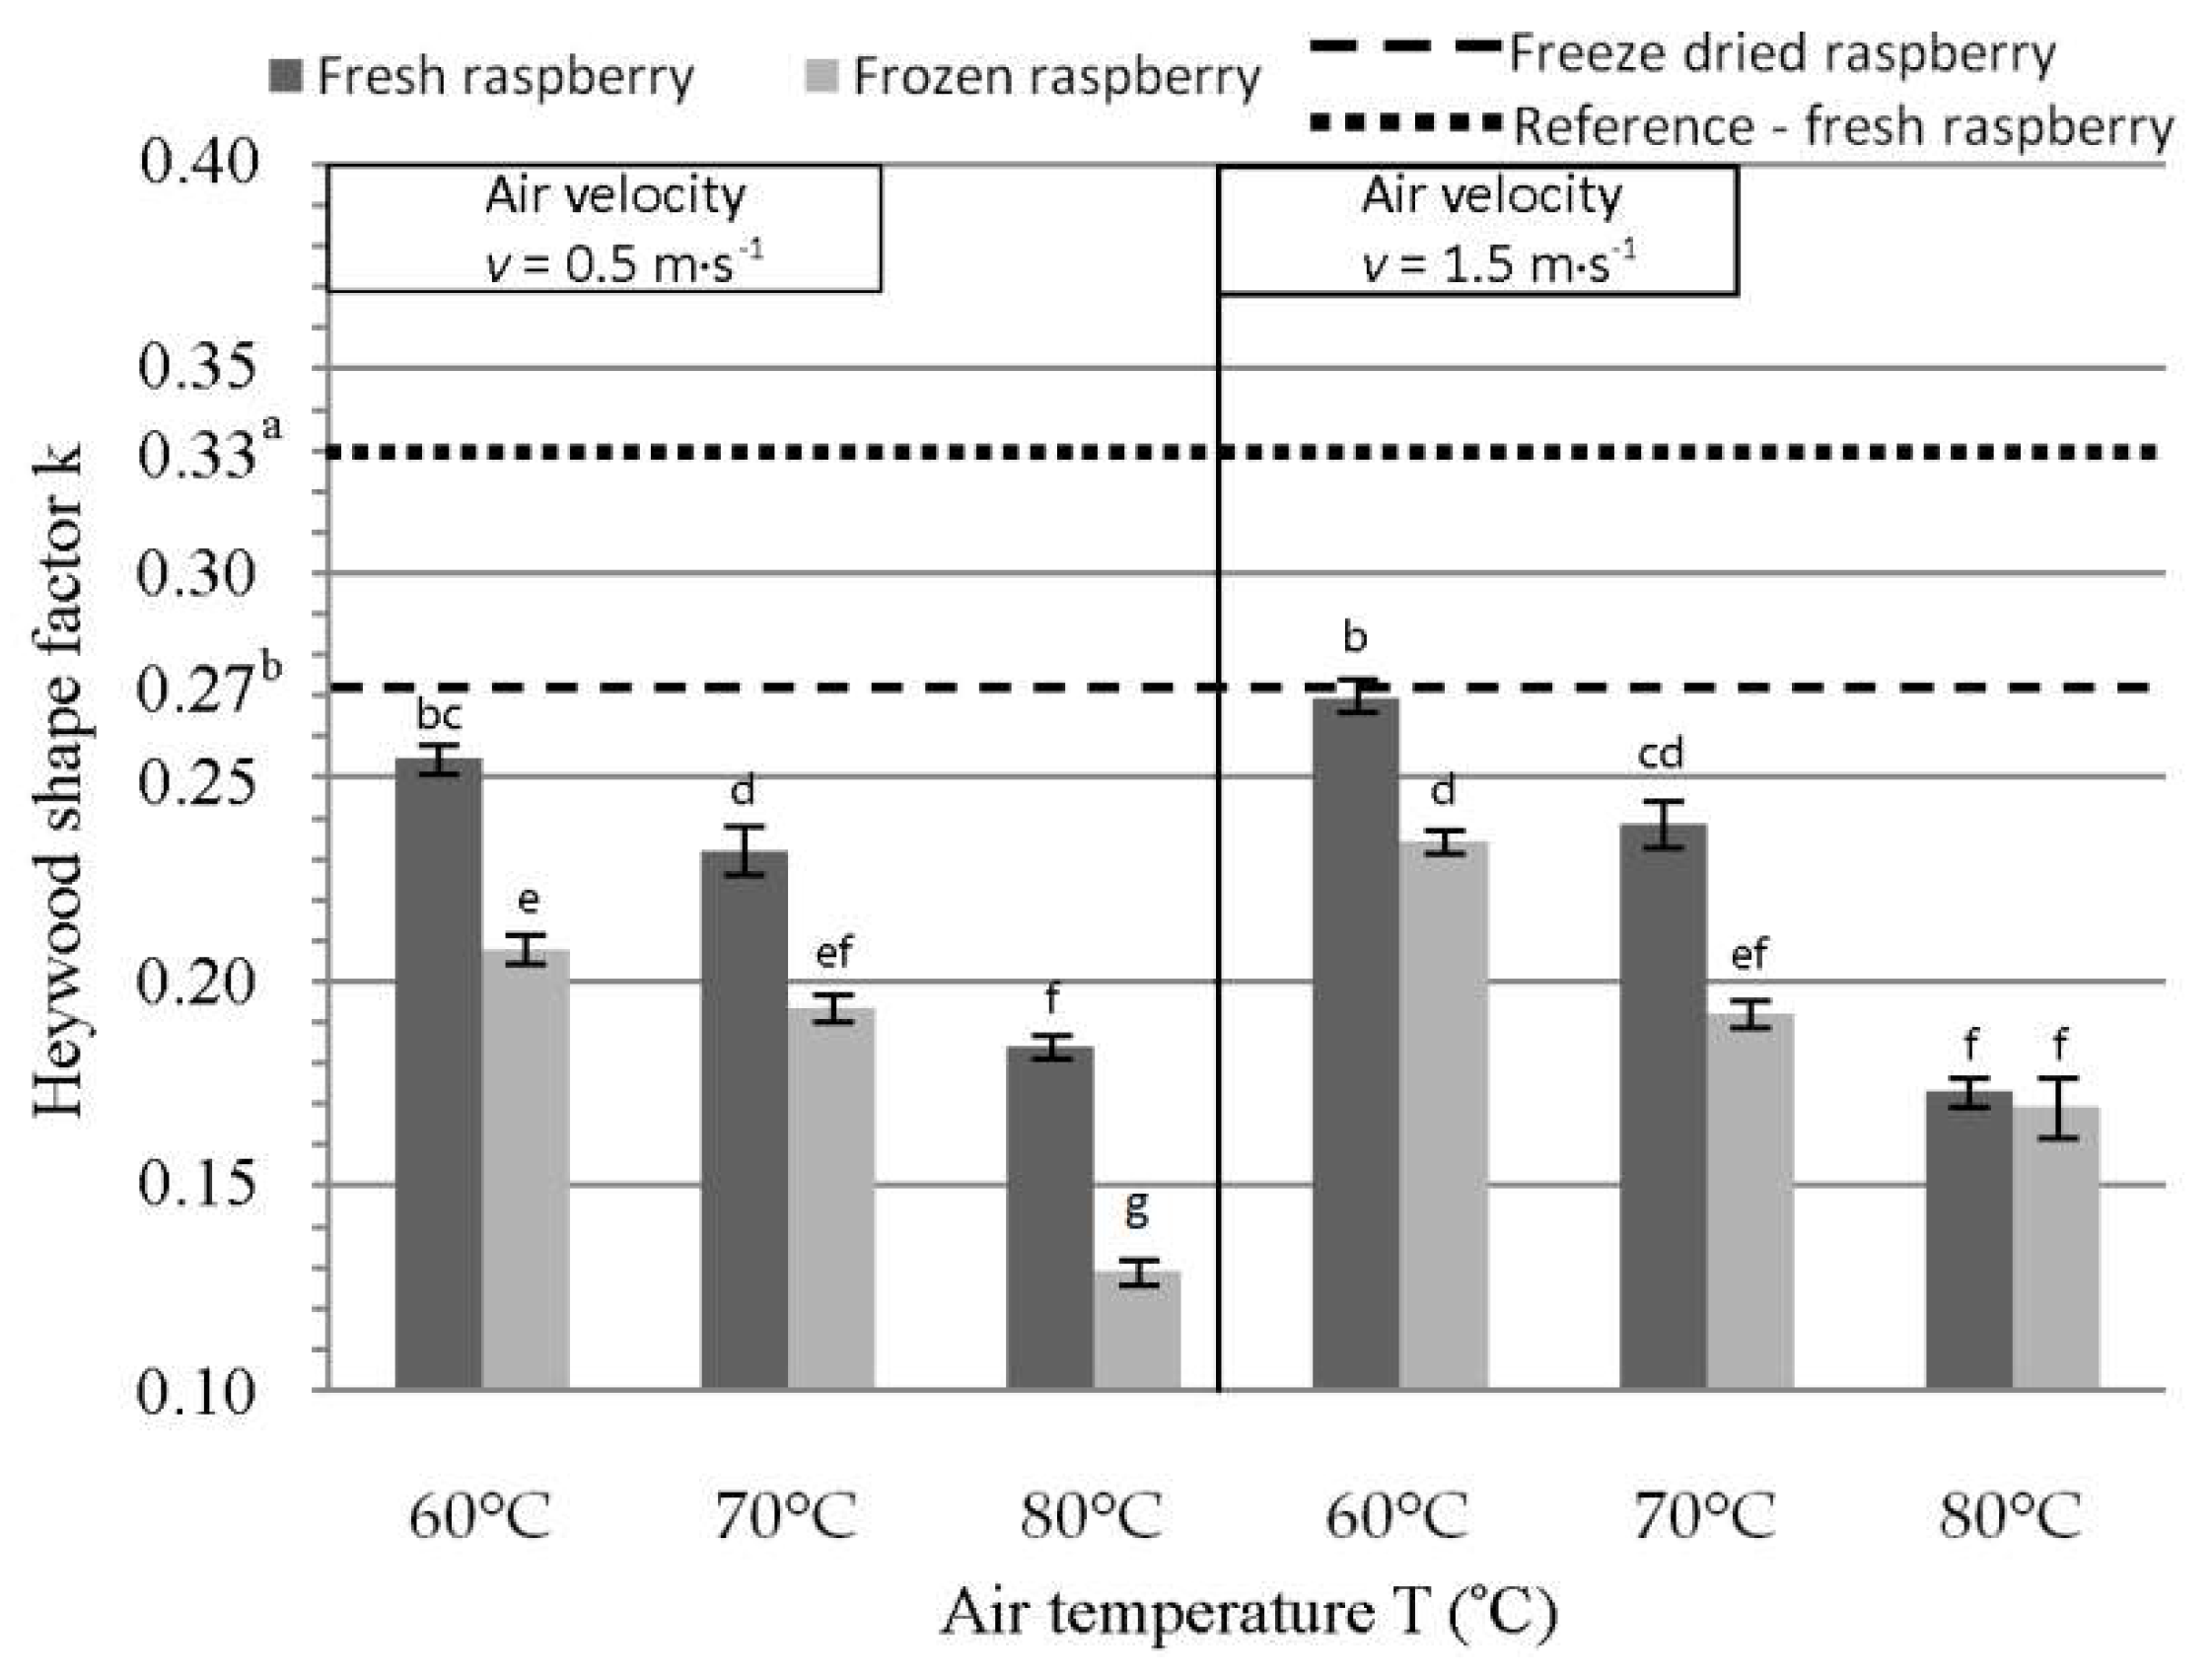
3.2. Heywood Shape Factor Results

The referent Heywood shape factor before drying of fresh raspberry was k = 0.3323 (Figure 3), and all three experimental factors were significant for the changes in Heywood shape factor. As compared to k of a fresh raspberry, the factor after freeze-drying equaled to k = 0.27. In case of convective drying, the lowest deviation from k occurred for fresh raspberries at T = 60 °C and air velocity of 1.5 m·s−1 (k = 0.2694 ± 0.003). Results showed that under the same experimental conditions, the convective dried frozen raspberries had greater deviation of size as compared to the fresh raspberries. Hence, Heywood shape factor corresponded with the results for volume shrinkage.

3.3. Color Change

CIE Lab color parameters L*, a*, b*, C*, h*, and ΔE* measured on fresh and dried raspberries at different drying conditions are shown in Table 2. Any considerable influences on color caused by the drying of raspberry was not detected, as total color change was roughly 10, except for freeze dried samples, and essentially lightness (L) remained similar to those of a fresh samples. Hence, changes in color were driven by the parameters a* and b*. Generally, convective dried raspberry samples slightly shifted towards maroon color, which can originate from decomposition of carotenoid pigments. Moreover, high temperature induces nonenzymatic Maillard browning with formation of brownish pigmentations [40]. Alternatively, this may be the consequences of high concentrations of preserved anthocyanins in dried samples [3]. A slight increase of a* and b* will have positive repercussions, as it will lean towards more saturated color of products, which corresponds well with increased chroma values.
Air temperature, air velocity, and initial state of raspberry before drying had statistically significant effect on color change (p < 0.05) (Table 1). The least color change (ΔE = 5.18) was observed with convective drying at T = 60 °C and air velocity of 1.5 m·s−1. This temperature remained optimal choice regarding ΔE, as it was not modified by different air velocities and initial state of material (fresh and frozen). The largest color change for this drying type was at T = 80 °C and air velocity of 0.5 m·s−1 for both frozen and fresh raspberry when ΔE was 11.17 and 10.12, respectively. Unexpectedly, freeze-dried raspberries had the largest color changes (ΔE = 19.60) that were caused by increase in all of the three-color parameters, and especially for a* (Δa = 18.04). Bustos et al. [25] reported similar findings for freeze-dried berries with higher values for redness (Δa = 25.62) as compared to convective samples. Also, study by Sette et al. [3] reported an increase of a* and emphasized that besides pigmentation, differences of internal structures should be considered among convective and freeze dried raspberries. For instance, after freeze-drying, free water from raspberry is replaced by air, so shifts in red color and lightness can be a consequence of different diffusion of light that passes throughout a material. This effect is likely more pronounced for fruits with defined and vibrant hues, as for the raspberries [3,41]. During the conventional air-drying, increasing drying temperatures reduce the drying time, whereas shorter drying times may result in reduced risks of food quality deterioration [23]. Increasing hot air temperature for convective drying of Cassia alata from 40 °C to 60 °C reduced drying time from 180 min to 120 min [42]. Consequently, from data obtained, it can be assumed that as the temperature and the drying time increase, the color change of dried raspberries will increased too.

3.4. Ascorbic Acid Reduction

The average amount of L-ascorbic acid in fresh samples before drying was 118.27 mg/100gd.b. (18.92 mg/100gw.b.) (Table 4), which was similar to quantities reported by Bobinaite et al. [12]. This content of L-ascorbic acid was significantly reduced during convective drying under all experimental conditions. This is expected as prolonged exposure to heightened temperatures and oxygen has tendency to reduce the content of this acidin fruits [21,43,44,45,46,47]. Figure 4 shows temperature kinetics of raspberry samples during convective drying from a fresh state. Type K thermocouple probes were used to monitor and control product temperature during the process, by placing probes inside the drupelet. For all experiments, the temperature at the beginning of the process is approximately 35 °C, but after 10 minutes of the drying, the raspberry temperature can reach 50 °C. Due to the reduced moisture content, during the last quarter of drying all samples have the same temperature as drying air. This means that drying time at T = 80 °C is 6–8 h, and depending of the air velocity can last almost three times longer at T = 60 °C. However, the highest content of L-ascorbic acid was after the shortest convective drying with air velocity of 1.5 m·s−1. This was regardless of the fact that the raspberry temperature reached T = 80 °C, and equaled to 27.46 ± 1.12 mg/100gd.b. and 22.54 ± 1.28 mg/100d.b., after drying of frozen and fresh raspberry, respectively (Table 4). Conversely, the degradation of 99% L-ascorbic acid was detected for longest drying with T = 60 °C and air velocity of 0.5 m·s−1. Accordingly, this might mean that L-ascorbic acid degradation is more induced by longer exposure to higher oxygen levels during the convective drying than to the drying temperature itself.
This reasoning is in accordance with Verbeyst et al. [43] research with thermal and high-pressure effects on vitamin C degradation in strawberries and raspberries. Here it was shown that ascorbic acid degradation from strawberry and raspberry is slightly temperature dependent for temperature range of 80 to 90 °C, and that oxygen presence plays the key role. As expected, the highest levels of L-ascorbic acid preservation was achieved by freeze-drying (115.48 ± 2.29 mg/100gd.b.), since there was neither thermal nor oxygen degradation involved.

3.5. Total Phenols Reduction

The average values for relevant nutritive profile of fresh raspberries are presented in Table 3. Average total amount of polyphenols in fresh raspberry was 1.63 g GAE/100gd.b. All three individual experimental factors had influence on the content of total phenols (Table 1).
When these samples were dried convectively the best preserved polyphenolic content was at T = 70 °C and air velocity of 1.5 m·s−1 (1.28 gGAE/100gd.b.). On the contrary, they were least preserved at 60 °C and air velocity of 0.5 m·s−1(0.92 gGAE/100gd.b.). Freeze-drying preserved 1.10 g GAE/100gd.b. of total phenols, and, as expected, convective drying reduced polyphenolic content in the samples. The exceptions were the samples freshly dried at air velocity of 1.5 m·s−1 and drying temperatures of 70 °C; and 80 °C in which higher total phenolic content was observed in comparison to freeze-dried samples. Similar results were recently reported where higher phenolic content was found in convectively hot air-dried Cassia alata in comparison to freeze-dried samples [42]. Hossain et al. has suggested that freeze-drying may not have completely deactivated degradative enzymes due to the low-temperature process. Therefore, reactivation of this degradative enzymes could be further occurred in freeze-dried samples thus result in lower phenolic content [48].
Vasco et al. [49] made classification of 17 fruit types from Ecuador based on their content of total phenols and according to this classification there are three main groups: one with low levels of total phenols (<0.1 gGAE/100gw.b.), one with medium level (0.2–0.5 gGAE/100gw.b.), and the third with high levels (>1.0 gGAE/g100gw.b.). This classification was accepted by others [50,51], and states that fresh Polana raspberry belongs to a high content group, as do freeze-dried and convectively dried samples from this study (under all experimental conditions).

3.6. Total Anthocyanin Reduction

Temperature had significant influence on the content of anthocyanin (Table 4), however air velocity had no effect on this group of compounds. Amount of anthocyanin in fresh raspberry was 511.7 mg/100gd.b. After convective drying, anthocyanin content was preserved from 40–56%. Anthocyanin content (287.0 mg/100d.b.) was best preserved with drying of fresh raspberries at T = 70 °C and air velocity of 0.5 m·s−1. Their least retention occurred after convective drying of frozen samples at T = 70 °C and air velocity of 0.5 m·s−1 (205.3 mg/100d.b.). Thermal degradation of anthocyanins and complementary oxidization is the origin of the maroon color that was detected with the CIELab analysis. After freeze-drying, the content of anthocyanin in raspberry was 410.4 mg/100gd.b. which is expected due to minimized considerable influence of temperature and oxygen.

3.7. Radical Scavenging Capacity

As expected, all experimental factors influenced the radical scavenging capacity (Table 4). As a smaller IC50 means higher radical scavenging capacity, the majority of convectively dried raspberries exhibited lower radical scavenging capacity in comparison to fresh or freeze-dried samples. The IC50 value of fresh raspberry was IC50 = 0.0534 mgd.b./mL. Freeze-dried samples had highly preserved radical scavenging capacity that was equal to 0.0641 mgd.b./mL, likely due to high preservation of all bioactive compounds. The lowest IC50 value (e.g. the highest radical scavenging capacity) had convective drying for frozen samples, of IC50 = 0.0845 mgd.b./mL which was obtained at T = 80 °C and air velocity of 0.5 m·s−1. The main reason for this may be the high preservation of total flavonoid content (0.97%) in dried samples with same convective drying regime. Raspberry belongs to a group of biomaterial with high radical scavenging capacity [12,50]. It is also believed that almost 20% of its total radical scavenging capacity is secured by the content of L-ascorbic acid [52]. As previously reported, heat and oxygen have influence on almost all bioactive compounds with some form of degradation, so it is not surprising that to find the loss of radical scavenging capacity due to convective drying.

4. Conclusions

Using physical properties, contents of various biologically active compounds and radical scavenging capacity proved to be useful in selecting alternatives for preservation of raspberries as in the case of convective and freeze-drying. For Polana variety, the most desirable results against freeze-drying as standard in terms of color, volume shrinkage, and Heywood shape factor change was achieved with convective drying of fresh raspberry at T = 60 °C with air velocity of 1.5 m·s−1. Convective drying of raspberry had influenced all measured biologically active compounds. In comparison to fresh samples, in convectively dried raspberries 60–78% of total phenols was preserved as well as 75–97% of flavonoids and 40–56% of anthocyanins. Consequently, lower radical scavenging capacity was found in convectively dries samples as compared to fresh or freeze-dried. The largest shortcoming for convective drying was observed in difference between freeze-dried for preservation levels of L-ascorbic acid. Freeze-drying preserved more than 97% of L–ascorbic acid, while convective drying samples had degradation of over 80% of this compound. This might not be as relevant where L–ascorbic acid is added in processing of raspberries (e.g., confectionery products, biscuits, cookies, dairy product etc.). In conclusion, Polana raspberry dried convectively with air temperature of 60 °C and air velocity of 1.5 m·s−1, may be considered as sufficient alternative to freeze-drying.

Author Contributions

Conceptualization, I.P., M.R., and Z.S.; Methodology, I.P., M.R., A.T.H., and Z.S.; Formal analysis, Z.S. and K.K.; Contributions to sample and analysis experiments, Z.S. and K.K.; writing—original draft preparation, Z.S.; writing—review and editing, I.P., M.R., A.T.H., P.P., and D.B.K.; supervision, P.P. and D.B.K.

Funding

This manuscript is a result of the research within the national project TR31058, 2011-2020, supported by the Ministry of Education, Science and Technology, Republic of Serbia.

Conflicts of Interest

The authors declare no conflicts of interest.

References

  1. Statistical Office of the Republic of Serbia. Statistical Yearbook; Statistical Office of the Republic of Serbia: Belgrade, Serbia, 2018; 51, p. 214.
  2. Paraušić, V.; Simeunović, I. Market analysis of Serbia’s raspberry sector and cluster development initiatives. Econ. Agricult. 2016, 63, 1417–1431. [Google Scholar]
  3. Sette, P.; Franceschinis, L.; Schebor, C.; Salvatori, D. Fruit snacks from raspberries: Influence of drying parameters on colour degradation and bioactive potential. Int. J. Food Sci. Technol. 2017, 52, 313–328. [Google Scholar] [CrossRef]
  4. Szadzińska, J.; Łechtańska, J.; Pashminehazar, R.; Kharaghani, A.; Tsotsas, E. Microwave- and ultrasound-assisted convective drying of raspberries: Drying kinetics and microstructural changes. Dry Technol. 2018, 37, 1–12. [Google Scholar] [CrossRef]
  5. Rodriguez, A.; Bruno, E.; Paola, C.; Campañone, L.; Mascheroni, R.H. Experimental study of dehydration processes of raspberries (Rubus Idaeus) with microwave and solar drying. Food Sci. Technol. 2018, 39. [Google Scholar] [CrossRef]
  6. Bórquez, R.M.; Canales, E.R.; Redon, J.P. Osmotic dehydration of raspberries with vacuum pretreatment followed by microwave-vacuum drying. J. Food Eng. 2010, 99, 121–127. [Google Scholar] [CrossRef]
  7. Wang, S.Y.; Lin, H.-S. Antioxidant activity in fruits and leaves of blackberry, raspberry, and strawberry varies with cultivar and developmental stage. J. Agr. Food Chem. 2000, 48, 140–146. [Google Scholar] [CrossRef]
  8. Verbeyst, L.; Crombruggen, K.V.; Van der Plancken, I.; Hendrickx, M.; Van Loey, A. Anthocyanin degradation kinetics during thermal and high pressure treatments of raspberries. J. Food Eng. 2011, 105, 513–521. [Google Scholar] [CrossRef]
  9. Summen, M.A.; Erge, H.S. Thermal degradation kinetics of bioactive compounds and visual color in raspberry pulp. J. Food Process Preserv. 2014, 38, 551–557. [Google Scholar] [CrossRef]
  10. Nile, S.H.; Park, S.W. Edible berries: Bioactive components and their effect on human health. Nutrition 2014, 30, 134–144. [Google Scholar] [CrossRef]
  11. Carvalho, E.; Fraser, P.D.; Martens, S. Carotenoids and tocopherols in yellow and red raspberries. Food Chem. 2013, 139, 744–752. [Google Scholar] [CrossRef]
  12. Bobinaitė, R.; Viškelis, P.; Venskutonis, P.R. Variation of total phenolics, anthocyanins, ellagic acid and radical scavenging capacity in various raspberry (Rubus spp.) cultivars. Food Chem. 2012, 132, 1495–1501. [Google Scholar] [CrossRef] [PubMed]
  13. Szymanowska, U.; Baraniak, B.; Bogucka-Kocka, A. Antioxidant, anti-inflammatory, and postulated cytotoxic activity of phenolic and anthocyanin-rich fractions from polana raspberry (Rubus idaeus L.) fruit and juice—In vitro study. Molecules 2018, 23, 1812. [Google Scholar] [CrossRef] [PubMed]
  14. Giuffrè, A.M.; Louadj, L.; Rizzo, P.; Poiana, M.; Sicari, V. Packaging and storage condition affect the physicochemical properties of red raspberries (Rubus idaeus L., cv. Erika). Food Control 2019, 97, 105–113. [Google Scholar] [CrossRef]
  15. Tamer, C.E. A research on raspberry and blackberry marmalades produced from different cultivars. J. Food Process Preserv. 2012, 36, 74–80. [Google Scholar] [CrossRef]
  16. Rajkovic, A.; Smigic, N.; Djekic, I.; Popovic, D.; Tomic, N.; Krupezevic, N.; Uyttendaele, M.; Jacxsens, L. The performance of food safety management systems in the raspberries chain. Food Control 2017, 80, 151–161. [Google Scholar] [CrossRef]
  17. Pavkov, I.; Stamenković, Z.; Radojčin, M.; Babić, M.; Bikić, S.; Mitrevski, V.; Lutovska, M. Convective and freeze drying of raspberry: Effect of experimental parameters on drying kinetics, physical properties and rehydration capacity. In Proceedings of the INOPTEP 5th International Conference Sustainable Postharvest and Food Technologies, Vršac, Serbia, 23–28 April 2017; pp. 261–266. [Google Scholar]
  18. Mierzwa, D.; Szadzińska, J.; Pawłowski, A.; Pashminehazar, R.; Kharaghani, A. Nonstationary convective drying of raspberries, assisted by microwaves and ultrasound. Dry Technol. 2019, 37, 988–1001. [Google Scholar] [CrossRef]
  19. Ratti, C. Hot air and freeze-drying of high-value foods: A review. J. Food Eng. 2001, 49, 311–319. [Google Scholar] [CrossRef]
  20. Kowalski, S.J.; Pawłowski, A.; Szadzińska, J.; Łechtańska, J.; Stasiak, M. High power airborne ultrasound assist in combined drying of raspberries. Innov. Food Sci. Emerg. 2016, 34, 225–233. [Google Scholar] [CrossRef]
  21. López, J.; Uribe, E.; Vega-Gálvez, A.; Miranda, M.; Vergara, J.; Gonzalez, E.; Di Scala, K. Effect of air temperature on drying kinetics, vitamin c, antioxidant activity, total phenolic content, non-enzymatic browning and firmness of blueberries variety O´Neil. Food Bioprocess Technol. 2010, 3, 772–777. [Google Scholar] [CrossRef]
  22. Zorić, Z.; Pedisić, S.; Kovačević, D.B.; Ježek, D.; Dragović-Uzelac, V. Impact of packaging material and storage conditions on polyphenol stability, colour and sensory characteristics of freeze-dried sour cherry (Prunus cerasus var. Marasca). J. Food Sci. Technol. 2015, 53, 1247–1258. [Google Scholar] [CrossRef]
  23. Sun, Y.; Zhang, M.; Mujumdar, A. Berry drying: Mechanism, pretreatment, drying technology, nutrient preservation, and mathematical models. Food Eng. Rev. 2019, 11, 61–77. [Google Scholar] [CrossRef]
  24. Sabarez, H.T. Airborne ultrasound for convective drying intensification. In Innovative Food Processing Technologies —Extraction, Separation, Component Modification and Process Intensification; Knoerzer, K., Juliano, P., Smithers, G., Eds.; CSIRO Food and Nutrition: Werribee, Australia, 2016; pp. 361–386. [Google Scholar]
  25. Bustos, M.C.; Rocha-Parra, D.; Sampedro, I.; de Pascual-Teresa, S.; León, A.E. The influence of different air-drying conditions on bioactive compounds and antioxidant activity of berries. J. Agric. Food Chem. 2018, 66, 2714–2723. [Google Scholar] [CrossRef] [PubMed]
  26. Pavkov, I. Combined Technology of Fruit Tissue Drying. Ph.D. Thesis, Faculty of Agriculture, University of Novi Sad, Serbia, Novi Sad, 2012. [Google Scholar]
  27. Mohsenin, N.N. Physical Properties of Plant and Animal Materials; Gordon and Breach Sci. Publ.: New York, NY, USA, 1986. [Google Scholar]
  28. Radojčin, M.; Babić, M.; Pavkov, I.; Stamenković, Z. Osmotic drying effects on the mass transfer and shrinkage of quince tissue. PTEP J. Process Energy Agric. 2015, 19, 113–119. [Google Scholar]
  29. Sette, P.; Salvatori, D.; Schebor, C. Physical and mechanical properties of raspberries subjected to osmotic dehydration and further dehydration by air- and freeze-drying. Food Bioprod. Process. 2016, 100, 156–171. [Google Scholar] [CrossRef] [Green Version]
  30. Panyawong, S.; Devahastin, S. Determination of deformation of a food product undergoing different drying methods and conditions via evolution of a shape factor. J. Food Eng. 2007, 78, 151–161. [Google Scholar] [CrossRef]
  31. Michelis, A.D.; Pirone, B.N.; Vullioud, M.B.; Ochoa, M.R.; Kesseler, A.G.; Márquez, C.A. Cambios de volumen, área superficial y factor de forma de Heywood durante la deshidratación de cerezas (Prunus avium). Ciência Tecnol. Aliment. 2008, 28, 317–321. [Google Scholar] [CrossRef]
  32. De Michelis, A. Effect of structural modifications on the drying kinetics of foods: Changes in volume, surface area and product shape. Int. J. Food Stud. 2013, 2, 188–211. [Google Scholar] [CrossRef]
  33. Radojčin, M.; Babić, M.; Babić, L.; Pavkov, I.; Stojanović, Č. Color parameters change of quince during combined drying. PTEP J. Process Energy Agric. 2010, 14, 81–84. [Google Scholar]
  34. Maskan, M. Kinetics of colour change of kiwifruits during hot air and microwave drying. J. Food Eng. 2001, 48, 169–175. [Google Scholar] [CrossRef]
  35. Singleton, V.L.; Rossi, J.A.J. Colorimetry of total phenolics with phosphomolybdic-phosphotungstic acid reagents. Am. J. Enol. Viticult. 1965, 16, 144–158. [Google Scholar]
  36. Harborne, J.B.; Williams, C.A. Advances in flavonoid research since 1992. Phytochemistry 2000, 55, 481–504. [Google Scholar] [CrossRef]
  37. Espín, J.C.; Soler-Rivas, C.; Wichers, H.J. Characterization of the total free radical scavenger capacity of vegetable oils and oil fractions using 2,2-diphenyl-1-picrylhydrazyl radical. J. Agric. Food Chem. 2000, 48, 648–656. [Google Scholar] [CrossRef] [PubMed]
  38. Giusti, M.M.; Wrolstad, R.E. Characterization and measurement of anthocyanins by UV-visible spectroscopy. Curr. Protoc. Food Anal. Chem. 2001, 00, F1.2.1–F1.2.13. [Google Scholar] [CrossRef]
  39. Fuleki, T.; Francis, F.J. Quantitative methods for anthocyanins. 1. Extraction and determination of total anthocyanin in cranberries. J. Food Sci. 1968, 33, 72–77. [Google Scholar] [CrossRef]
  40. Si, X.; Chen, Q.; Bi, J.; Yi, J.; Zhou, L.; Wu, X. Infrared radiation and microwave vacuum combined drying kinetics and quality of raspberry. J. Food Process Eng. 2016, 39, 377–390. [Google Scholar] [CrossRef]
  41. Saarela, J.M.S.; Heikkinen, S.M.; Fabritius, T.E.J.; Haapala, A.T.; Myllylä, R.A. Refractive index matching improves optical object detection in paper. Meas. Sci. Technol. 2008, 19, 055710. [Google Scholar] [CrossRef]
  42. Chua, L.Y.; Chua, B.L.; Figiel, A.; Chong, C.H.; Wojdyło, A.; Szumny, A.; Lech, K. Characterisation of the convective hot-air drying and vacuum microwave drying of Cassia alata: Antioxidant activity, essential oil volatile composition and quality studies. Molecules 2019, 24, 1625. [Google Scholar] [CrossRef]
  43. Verbeyst, L.; Bogaerts, R.; Van der Plancken, I.; Hendrickx, M.; Van Loey, A. Modelling of vitamin C degradation during thermal and high-pressure treatments of red fruit. Food Bioprocess. Technol. 2012, 6, 1015–1023. [Google Scholar] [CrossRef]
  44. Rodríguez, Ó.; Gomes, W.; Rodrigues, S.; Fernandes, F.A.N. Effect of acoustically assisted treatments on vitamins, antioxidant activity, organic acids and drying kinetics of pineapple. Ultrason Sonochem 2017, 35, 92–102. [Google Scholar] [CrossRef]
  45. Herbig, A.-L.; Renard, C.M.G.C. Factors that impact the stability of vitamin C at intermediate temperatures in a food matrix. Food Chem. 2017, 220, 444–451. [Google Scholar] [CrossRef]
  46. Santos, P.H.S.; Silva, M.A. Retention of vitamin C in drying processes of fruits and vegetables—A Review. Dry Technol. 2008, 26, 1421–1437. [Google Scholar] [CrossRef]
  47. Arancibia-Avila, P.; Namiesnik, J.; Toledo, F.; Werner, E.; Martinez-Ayala, A.L.; Rocha-Guzmán, N.E.; Gallegos-Infante, J.A.; Gorinstein, S. The influence of different time durations of thermal processing on berries quality. Food Control 2012, 26, 587–593. [Google Scholar] [CrossRef]
  48. Hossain, M.B.; Barry-Ryan, C.; Martin-Diana, A.B.; Brunton, N.P. Effect of drying method on the antioxidant capacity of six Lamiaceae herbs. Food Chem. 2010, 123, 85–91. [Google Scholar] [CrossRef]
  49. Vasco, C.; Ruales, J.; Kamal-Eldin, A. Total phenolic compounds and antioxidant capacities of major fruits from Ecuador. Food Chem. 2008, 111, 816–823. [Google Scholar] [CrossRef]
  50. De Souza, V.R.; Pereira, P.A.P.; da Silva, T.L.T.; de Oliveira Lima, L.C.; Pio, R.; Queiroz, F. Determination of the bioactive compounds, antioxidant activity and chemical composition of Brazilian blackberry, red raspberry, strawberry, blueberry and sweet cherry fruits. Food Chem. 2014, 156, 362–368. [Google Scholar] [CrossRef] [PubMed] [Green Version]
  51. Alibabić, V.; Skender, A.; Bajramović, M.; Šertović, E.; Bajrić, E. Evaluation of morphological, chemical, and sensory characteristicsof raspberry cultivars grown in Bosnia and Herzegovina. Turk. J. Agric. For. 2018, 42, 67–74. [Google Scholar] [CrossRef]
  52. Beekwilder, J.; Hall, D.R.; Ric de Vos, C.H. Identification and dietary relevance of antioxidants from raspberry. Biofactors 2005, 23, 197–205. [Google Scholar] [CrossRef]
Figure 1. Volume shrinkage after convective drying of raspberry variety Polana. Different lowercase letters indicate significant differences (p < 0.05).
Foods 08 00251 g001
Figure 2. Red raspberry, variety Polana: (a) fresh (af = 20.74±2.45mm; bf = 20.04 ± 1.96 mm; cf = 18.88 ± 1.72 mm), (b) after convective drying of fresh raspberry at T = 60 °C and air velocity of 1.5 m·s−1(acd = 16.97 ± 1.86 mm; bcd = 15.37 ± 1.65 mm; ccd = 15.34 ± 1.43 mm), and (c) after freeze-drying (afd = 20.62 ± 1.98 mm; bfd = 20.62 ± 2.66 mm; cfd = 18.58 ± 1.78 mm).
Foods 08 00251 g002
Figure 3. Of Heywood shape factor after convective drying of Polana raspberry. Different lowercase letters indicate significant differences (p < 0.05).
Foods 08 00251 g003
Figure 4. Raspberry temperature kinetics during convective drying from a previously fresh state.
Foods 08 00251 g004
Table 1. Statistical analysis of convective drying factor effect on all determined quality indicators.
Depend.
Value
Statistical
Indicators
Effect
InterceptATAVRSAT*AVAT*RSAV*RSAT*AV*RSError
Volume
shrinkage
SS16870399625511383428741686274310328630
MS168703948127113834143784327435159
F28814.82822.020.2065.4924.5414.4046.850.88
p0.00000.00000.65870.00000.00000.00000.00000.4166
Heywood
shape
factor
SS0.2083630.00440.00010.00150.00000.00000.00010.00010.0094
MS0.2083630.00220.00010.00150.00000.00000.00010.00000.0000
F10773.36115.3010.0879.201.591.167.794.55
p0.00000.00000.00150.00000.20570.31290.00540.0110
Color
change
SS17759.28576.4116.7868.1531.9256.310.571.77654.85
MS17759.28288.2016.7868.1515.9628.150.570.892.74
F6481.604105.1866.12624.8715.82510.2750.2070.323
p0.0000000.0000000.0140170.0000010.003300.0000520.6493120.724239
Ascorbic
acid
SS1689.9551357.504640.2176.840430.57791.1560.0087.2498.575
MS1689.955678.752640.2176.840215.28945.5780.0083.6250.357
F4729.8531899.6941791.84119.144602.551127.5640.02410.144
p0.0000000.0000000.0000000.0002030.0000000.0000000.8793360.000641
Total
phenolic content
SS40829272965965892452597808923366658024625810129
MS408292724829858924525974044116836580223129422
F96744.51114.44139.62124.639.5827.68155.9254.80
p0.00000.00000.00000.00000.00080.00000.00000.0000
Total
flavonoid content
SS379945765382505114980421435643625100
MS3799457326925051149402171862181213
F17879.7315.3811.795.4018.923.380.0310.26
p0.0000000.0000500.0021700.0288640.0000120.0510070.8635810.000602
Anthocyanin
content
SS21636732292571520147112315782918418331
MS216367311463715201435511577824592764
F2832.82115.0080.9362.6370.4651.5151.0246.012
p0.00000.00000.34280.1174560.63340.24000.32150.0076
Radical
scavenging
SS0.6969110.0033570.0001150.0115850.0272920.0082120.0090290.0157190.00044
MS0.6969110.0016780.0001150.0115850.0136460.0041060.0090290.0078600.00001
F37390.8990.056.18621.55732.14220.29484.40421.69
p0.0000000.0000000.0202590.0000000.0000000.0000000.0000000.000000
AT—Air Temperature; AV—Air Velocity; RS—Raspberry state before drying; SS—Sum of Squares; MS—Mean square; F—Fisher’s F-ratio; p— p-value.
Table 2. Results of CIE Lab parameters before and after all drying treatments: L* (whiteness/brightness), a* (redness/greenness), b* (yellowness/blueness), and ΔE (color change).
Experiment Factors Measured ValuesΔE
Before Drying (Fresh Samples) After Drying (Dried Samples)
L0a0b0h0oC0* L*a*b*hoC*
Fresh dried0.5 m·s−1Drying air temperature [°C]6024.82922.17211.09126.57524.791 23.84827.57011.92423.38830.0385.549 ± 1.67 h
7024.76820.93210.13425.83323.256 25.79929.65013.44824.39732.5579.383 ± 1.66 def
8026.22522.2519.556223.24224.216 22.60830.58914.02124.62533.64910.12 ± 1.10 bc
1.5 m·s−16024.40722.00910.55325.61724.408 23.05826.98211.10122.36329.1765.181 ± 0.95 h
7024.37222.51310.88625.80525.006 24.19430.22413.10023.43332.9408.024 ± 1.16 efg
8025.21222.12510.08424.50224.314 22.02930.39014.19325.03333.5409.763 ± 1.21 cde
Frozen dried0.5 m·s−16024.49121.03210.39726.30523.461 24.26428.32512.83424.37531.0967.692 ± 1.23 g
7024.07820.5099.41424.65522.566 24.09429.31412.89723.74732.0259.468 ± 1.62 def
8026.36822.38010.17224.44224.583 26.32932.67414.52923.97335.75811.17 ± 1.38 b
1.5 m·s−16025.14721.1069.86525.05123.297 24.51428.90412.89224.03831.6488.38 ± 1.43 fg
7025.12221.47710.32125.66723.828 23.60329.66513.73324.84132.6898.99 ± 0.80 def
8025.78522.71910.59324.99725.067 21.99130.36813.97724.71433.4309.18 ± 1.27 cd
Freeze dried24.55722.3679.77923.61524.411 28.14440.41216.56222.28543.67419.608 ± 1.63 a
Different lowercase letters indicate significant differences (p < 0.05).
Table 3. The content of BACs and radical scavenging capacityin fresh raspberry sample.
Compoundmg/100gd.b.
L-ascorbic acid118.27
Total phenolic content1,635.60
Flavonoid content386.19
Anthocyanin content513.55
Antioxidative activity IC50 [mgd.b./mL]0.0534
Table 4. Results of biologically active compounds in fresh raspberry and dried raspberry after all drying treatments.
Experimental FactorsMeasured Values
Ascorbic Acid
(mg/100gd.b.)
Total Phenolic Content
(gGAE/100gd.b.)
Total Flavonoid Content
(mgCAE/100gd.b.)
Anthocyanin Content
(mg/100gd.b.)
Radical Scavenging IC50 (mgd.b./Ml)
Fresh dried0.5 m·s−1Drying air temperature (°C)60<0.25 d0.921 ± 0.010 k315.1 ± 8.9 cde215.3 ± 8.6 hi0.097 ± 0.0011 g
702.45 ± 0.22 cd0.985 ± 0.018 ij298.8 ± 5.4 de287.0 ± 9.4 c0.218 ± 0.0015 a
804.04 ± 0.34 cd1.152 ± 0.020 d317.4 ± 6.5 cde256.1 ± 14.6 ef0.198 ± 0.0011 b
1.5 m·s−1602.53 ± 0.33 cd1.075 ± 0.003 ef299.3 ± 16.0 de235.5 ± 6.4 fg0.210 ± 0.0065 b
707.65 ± 0.27 cd1.281 ± 0.028 b352.7 ± 14.7 ab242.8 ± 12.5 fg0.101 ± 0.0025 g
8022.54 ± 1.28 b1.202 ± 0.003 c331.8 ± 15.6 bc248.5 ± 5.7 ef0.124 ± 0.0010 de
Frozen dried0.5 m·s−160<0.25 d0.994 ± 0.001 ij290.0 ± 15.0 e206.2 ± 16.7 i0.135 ± 0.0055 d
70<0.25d1.080 ± 0.002 ef302.1 ± 20.1 cde205.3 ± 5.9 i0.095 ± 0.0010 g
808.87 ± 0.90 c1.011 ± 0.006 hi375.5 ± 3.2 a276.0 ± 11.7 cd0.084 ± 0.0012 h
1.5 m·s−160<0.25 d0.976 ± 0.019 j322.4 ± 7.0 bcd227.1 ± 12.2 gh0.182 ± 0.0075 c
706.58 ± 0.46 cd1.029± 0.015 h361.7 ± 3.5 a238.3 ± 16.6 fg0.111 ± 0.0043 f
8027.46 ± 1.12 b1.067 ± 0.019 f331.1 ± 9.3 bc263.9 ± 3.4 de0.124 ± 0.0077 ef
Freeze dried115.48 ± 2.29 a1.103 ± 0.019 e327.8 ± 1.24 cde410.4 ± 9.4 b0.064 ± 0.0001 i
Fresh raspberry118.27 ± 2.88 a1.635 ± 0.025 a386.1 ± 21.1 a511.7 ± 5.0 a0.053 ± 0.0005 j
* Different lowercase letters indicate significant differences (p < 0.05).

