Article

Water Sorption Isotherm of Pea Starch Edible Films and Prediction Models

by
Bahareh Saberi
1,
Quan V. Vuong
1,
Suwimol Chockchaisawasdee
1,
John B. Golding
1,2,
Christopher J. Scarlett
1,* and
Costas E. Stathopoulos
3,*
1
School of Environmental and Life Sciences, University of Newcastle, Ourimbah NSW 2258, Australia
2
NSW Department of Primary Industries, Ourimbah NSW 2258, Australia
3
Division of Food and Drink, School of Science, Engineering and Technology, University of Abertay, Dundee DD1 1HG, UK
*
Authors to whom correspondence should be addressed.
Submission received: 8 October 2015 / Revised: 16 December 2015 / Accepted: 17 December 2015 / Published: 24 December 2015
(This article belongs to the Special Issue Food Coatings)

Abstract

:
The moisture sorption isotherm of pea starch films prepared with various glycerol contents as plasticizer was investigated at different storage relative humidities (11%–96% RH) and at 5 ± 1, 15 ± 1, 25 ± 1 and 40 ± 1 °C by using gravimetric method. The results showed that the equilibrium moisture content of all films increased substantially above aw = 0.6. Films plasticized with glycerol, under all temperatures and RH conditions (11%–96%), adsorbed more moisture resulting in higher equilibrium moisture contents. Reduction of the temperature enhanced the equilibrium moisture content and monolayer water of the films. The obtained experimental data were fitted to different models including two-parameter equations (Oswin, Henderson, Brunauer–Emmitt–Teller (BET), Flory–Huggins, and Iglesias–Chirife), three-parameter equations Guggenhiem–Anderson–deBoer (GAB), Ferro–Fontan, and Lewicki) and a four-parameter equation (Peleg). The three-parameter Lewicki model was found to be the best-fitted model for representing the experimental data within the studied temperatures and whole range of relative humidities (11%–98%). Addition of glycerol increased the net isosteric heat of moisture sorption of pea starch film. The results provide important information with estimating of stability and functional characteristics of the films in various environments.

1. Introduction

There has been an increased effort to reduce environmental impacts by using biodegradable polymers for packaging purposes, where edible coatings and films from renewable materials have been developed to improve the quality and shelf life of fresh and processed fruits and vegetables [1,2]. A main role of edible films is to decrease water loss between the food and the environment [3]. The macromolecular structure and permeability characteristics of most biodegradable films change with alterations in the relative humidities (RH) of the storage atmosphere [4]. The water binding capability of the films at a specific environmental relative humidity can be analyzed by water sorption isotherms [5]. Water sorption isotherm explains the equilibrium moisture content as a function of water activity (aw) at a constant temperature and pressure [6].
In most hydrophilic films, water functions as a plasticizer, and the relative humidity of environment determines water adsorption and desorption of films [7]. The moisture sorption behavior of foods is described by several mathematical models, some of them are according to principles of the sorption mechanism and others categorized into empirical and semi-empirical models [8,9]. There is no unique sorption isotherm model for different foods, since the single components of food products have particular hydroscopic characteristics and may change the structure or composition of the food effect on the moisture sorption isotherm [10]. Consequently, it is essential to seek for the most suitable isotherm equation for a particular biopolymer film. Several studies have investigated the sorption isotherms of starch biodegradable films [3,4,11,12,13,14,15,16,17,18]. However, there is still a lack of information on the effects of water and glycerol on the moisture sorption isotherm of pea starch films, which provides better understanding of the role of water in edible biopolymer films. The information of moisture sorption properties of edible films would assure to appropriately identify the circumstances of storage and packaging, to forecast shelf life, and to predict the physicochemical modifications in the processing of product.
This research aimed to study the moisture sorption isotherm of pea starch films with various glycerol concentrations (0%, 15%, 25% and 35% w/w) at different storage temperatures, and to fit the experimental data with prediction models.

2. Experimental Section

2.1. Materials

Canadian non-GMO yellow pea starch with 13.2% moisture, 0.2% protein, 0.5% fat and 0.3% ash, was used in all experiments (supplied by Yantai Shuangta Food Co., Jinling Town, China). All other chemicals were purchased from Merck Millipore Pty. Ltd., Victoria, Australia.

2.2. Preparation of Film

Aqueous dispersion (5%, w/w) of pea starch was prepared, and glycerol (plasticizer) was added to the dispersions at 0%, 15%, 25% and 35% (w/w, plasticizer/starch). The dispersions were heated in a water bath at 90 °C for 20 min with agitation to allow complete gelatinization of the starch. After gelatinization, the starch solutions were cooled to 50 to 60 °C. All the films were obtained by casting method; approximately 20 g of filmogenic suspensions were poured onto Petri dishes (10 cm in diameter). Films were formed by drying at 25 °C in an oven until reaching constant weight (about 24 h) [19].

2.3. Moisture Sorption Isotherm

Water sorption isotherms were measured through a gravimetrical method by exposing samples in the presence of different saturated salt solutions, which have recognized relative humidity at each specific temperature. Their aw at 5, 15, 25 and 40 °C were taken from Labuza et al. [20] and Rizvi [21] and were presented in Table 1. Each film (40 × 15 mm2) was pre-dried for 20 days over 0% RH at 25 °C to begin the sorption experiment. Samples of pre-dried sheets of 40 × 15 mm2 were put in small plastic cups and placed on mesh inside plastic jars containing the selected saturated solutions. The jars were then tightly closed and placed in a temperature-controlled chamber at 5, 15, 25 and 40 °C. The weight of each sample was checked using an analytical balance (with the precision of 0.0001 g) firstly after three days and then at one-day intervals until constant weight was achieved. Equilibrium was considered to be achieved when the difference between three consecutive sample weights was <1.0 mg per g of dry solid. The moisture content of the equilibrated samples was calculated after drying at 105 °C during 4 h. All tests were conducted in triplicate.
Table 1. The water activities (aw) of saturated salt solutions at 5, 15, 25 and 40 °C.*
Salt5 °C15 °C25 °C40 °C
LiCl0.1130.1130.1130.112
CH3COOK0.2910.2340.2250.216
K2CO30.4310.4320.4320.423
Mg(NO3)20.5890.5590.5290.484
NaNO20.6930.6930.6540.628
NaCl0.7570.7560.7530.747
KCl0.8760.8590.8430.823
KNO30.9630.9540.9360.890
* Source: Labuza, Kaanane and Chen [20] and Rizvi [21].

2.4. Mathematical Modeling

In this study the recognized Brunauer–Emmitt–Teller (BET) (Equation (1)), Guggenhiem–Anderson–deBoer (GAB) (Equation (2)), Peleg (Equation (3)), Oswin (Equation (4)), Ferro–Fontan (Equation (5)), Henderson (Equation (6)), Lewicki (Equation (7)), Iglesias–Chirife (Equation (8)) and Flory–Huggins (Equation (9)) equations were employed to fit the experimental data. These models are explained and rearranged as given below [3,18,22,23,24]:
M = M 0 . C . a w ( 1 a w ) ( 1 + C . a w a w )
M = M 0 . C . K . a w   ( 1     K .   a w ) ( 1 K . a w   +   C . K . a w )
M = K 1 a w n 1 +   K 2 a w n 2
M = K 0 ( a w 1 a w ) n 0
M = [ γ ln ( α a w ) ] 1 r
M = [ l n ( 1 a w ) A ] 1 B
M = [ F ( 1     a w ) G ] [ F ( 1   +   a w H ) ]
M = A [ a w ( 1 a w ) ] + B
M = A exp ( B a w )
where M is the equilibrium moisture content (% db); M0 is the monolayer moisture content; aw is the water activity; and C, K′, K1, K2, n1, n2, K0, γ, α, r, n0, A, B, F, G and H are model constants. Fitting of experimental data into the above equations was done using regression analysis MS Excel software (Microsoft Office, 2010) [3].
The suitability of the equations was estimated and compared using the correlation coefficient (R2) and the mean relative percentage deviation modulus (Me) [25]:
M e = 100 n i = 1 n | M i , e x p M i , p r e | M i , e x p
where Mi,exp is the experimental value, Mi,pre is the predicted value, and n is the population of experimental data.

2.5. Determination of the Net Isosteric Heat of Sorption

The net isosteric heat of sorption is a differential molar quantity based on the temperature dependence of the isotherm, which displays the energies for water molecules binding at a particular hydration level [26]. The net isosteric heat of sorption ( q n s ) , represents the difference between the isosteric heat (Qs) and pure water vaporization energy (Lr), was determined using the Clausius–Clapeyron equation:
[ d l n ( a w ) d T ] w = q n s R T 2
where aw is the water activity at the absolute temperature T (in kelvins) and R is the universal gas constant (8.314 J/mol K). Through Equation (11), q n s may be established by plotting ln(aw) at a specific moisture content vs. 1/T and measuring the slope [27].

2.6. Statistical Analysis

Glycerol was used in four levels of 0%, 15%, 25%, and 35% and replicated three times. All experiments were performed in a randomized design. Analysis of variance was carried out and the results were separated using the Multiple Ranges Duncan’s test (p < 0.05) using statistical software of Statistical Package for Social Science 16 (SPSS, Inc., Upper Saddle River, NJ, USA). All tests were performed at least in triplicate.

3. Results and Discussions

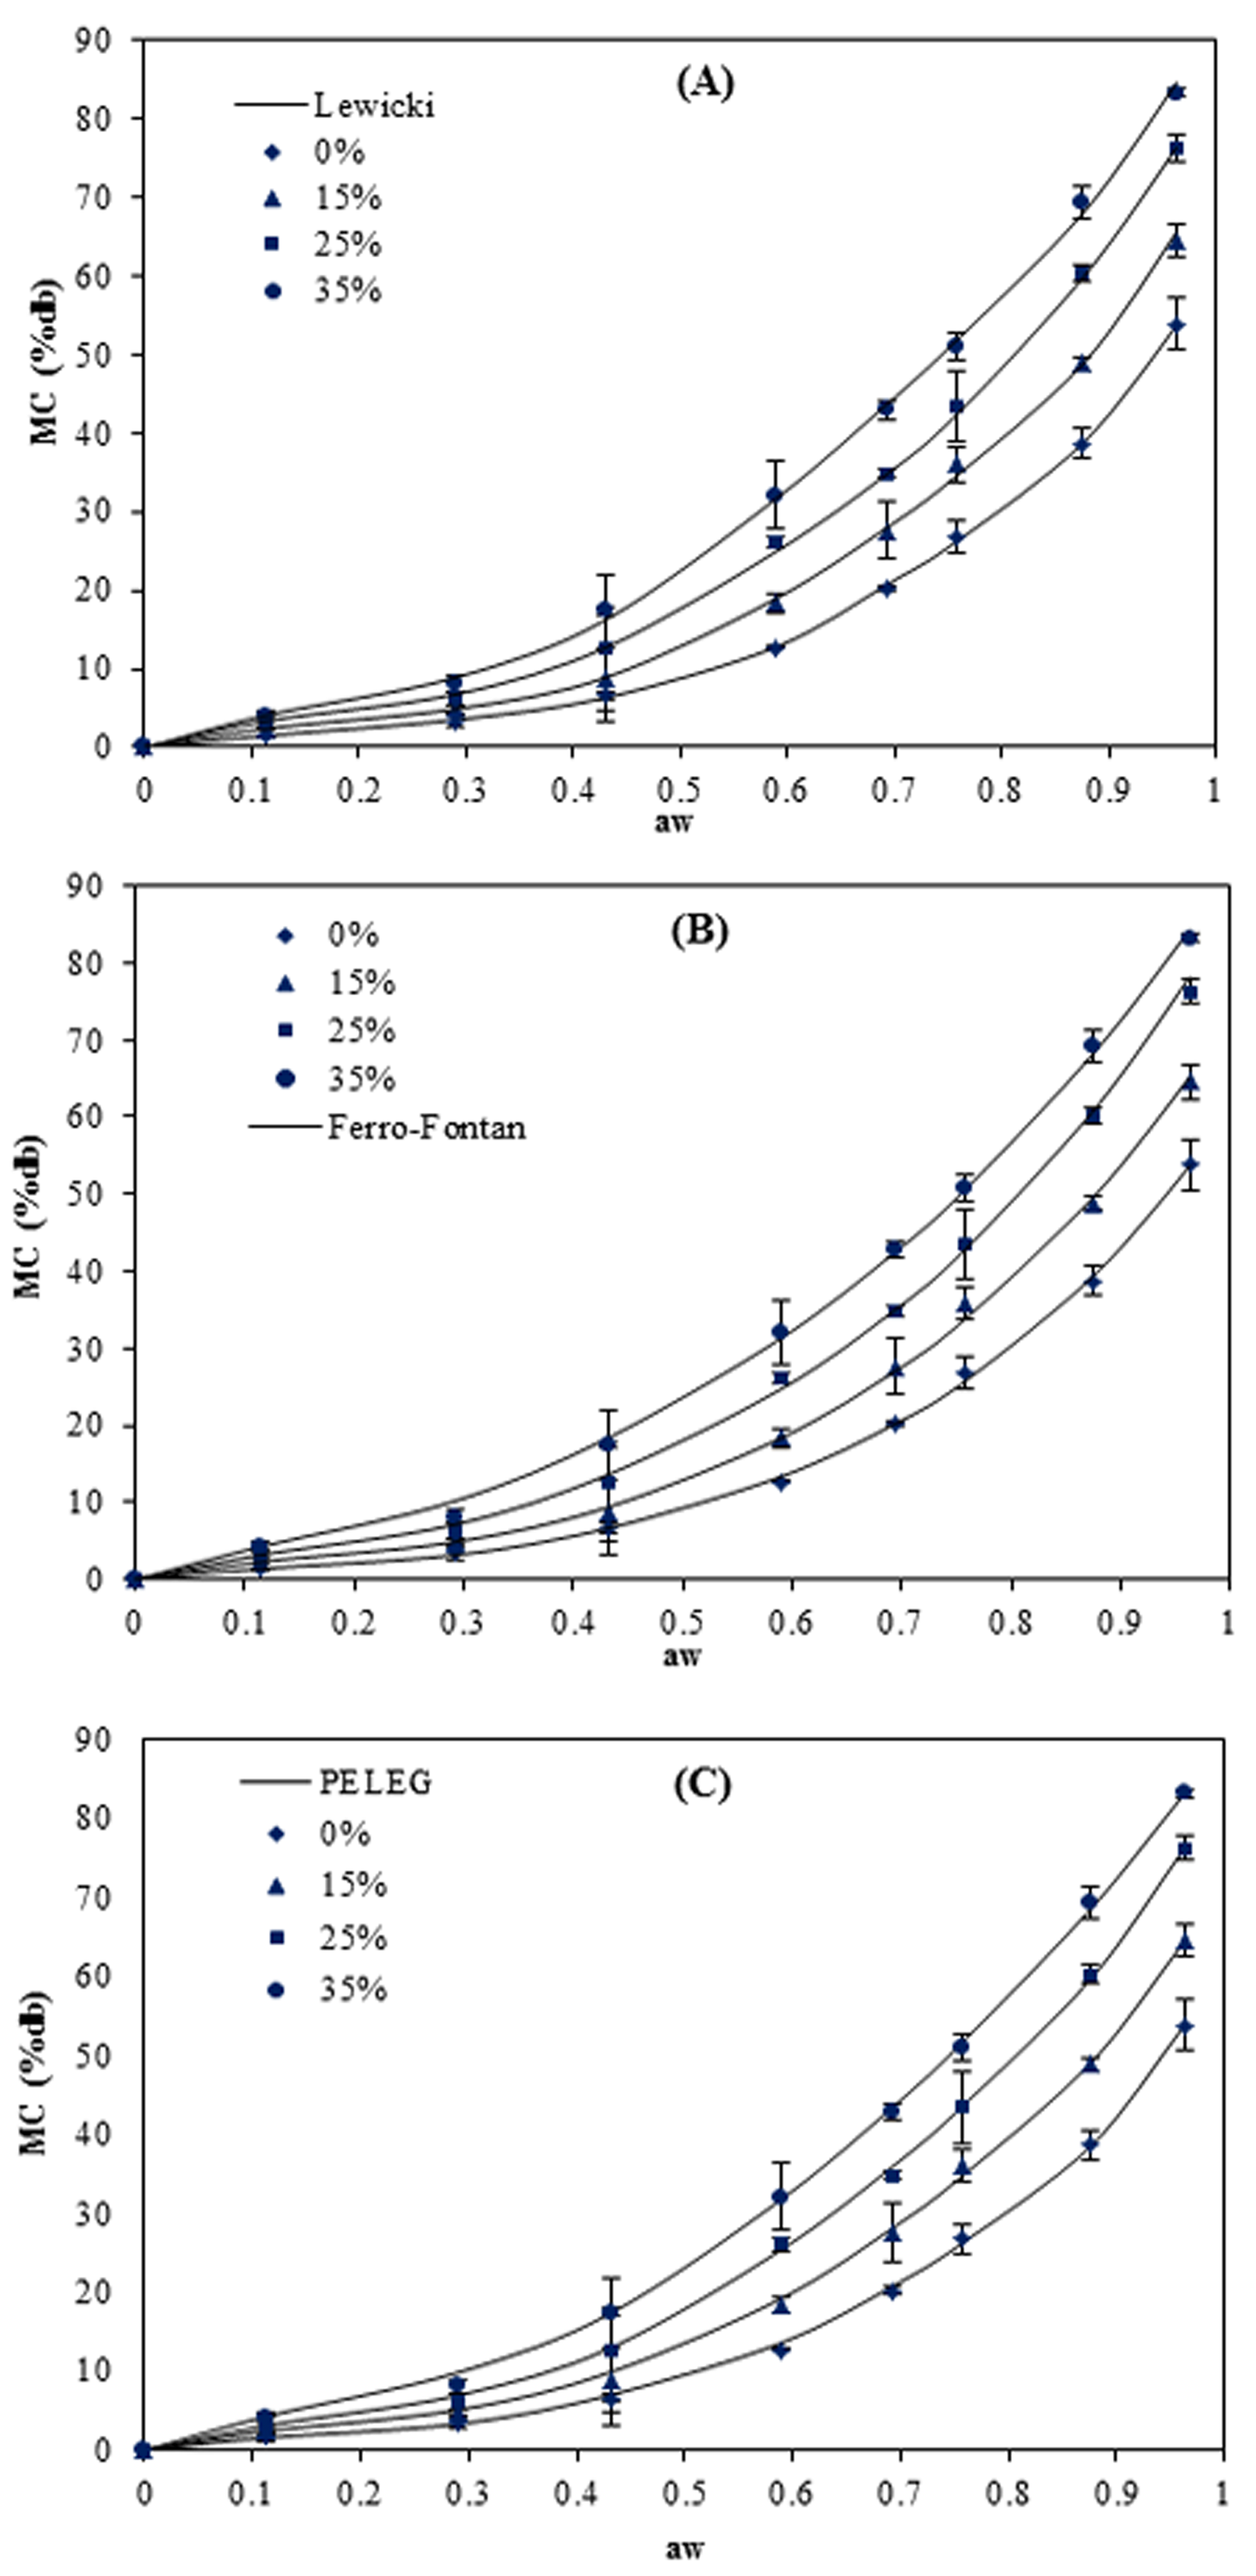
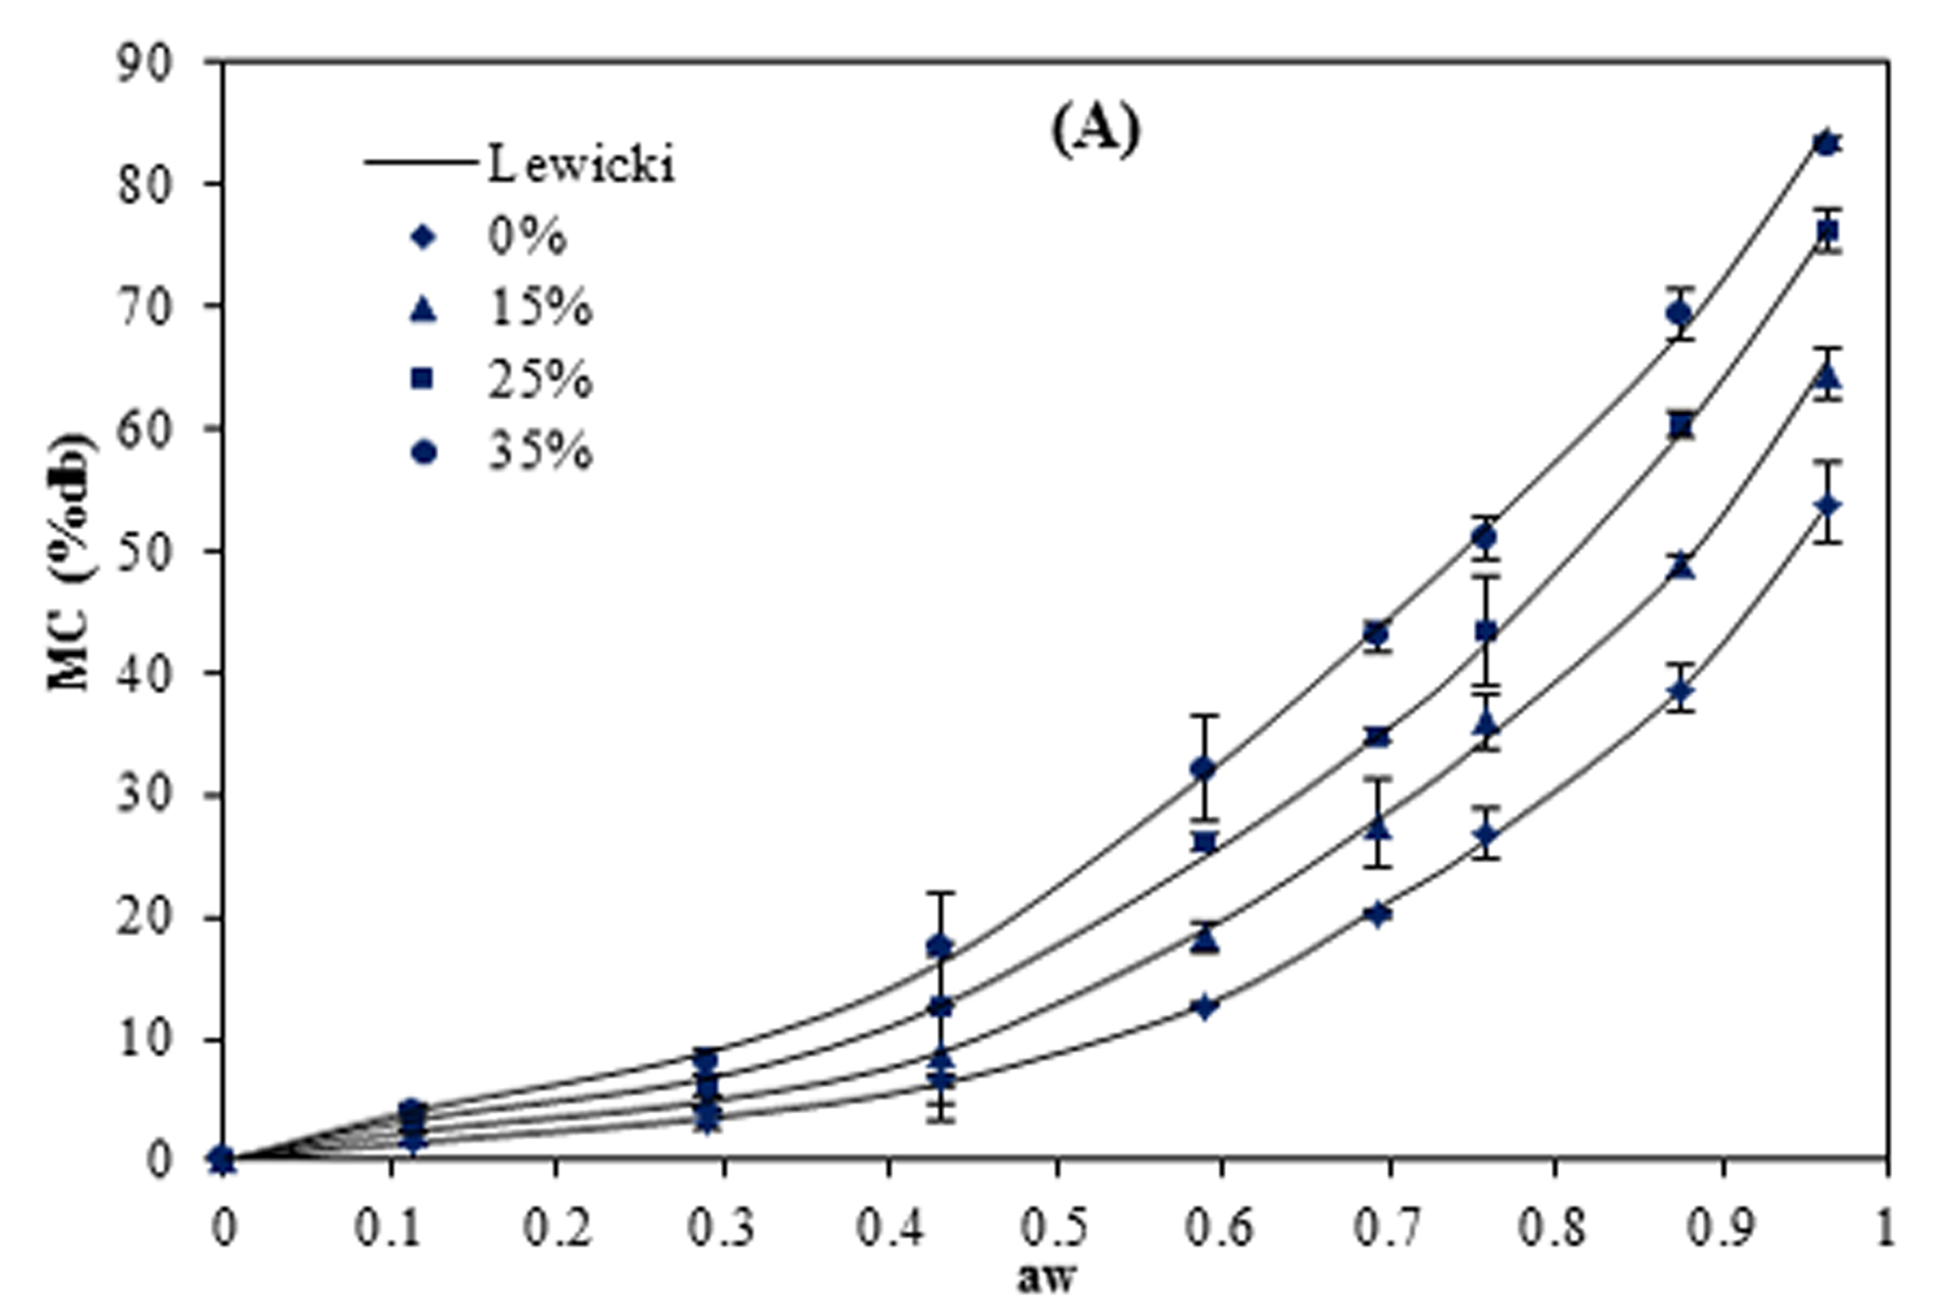
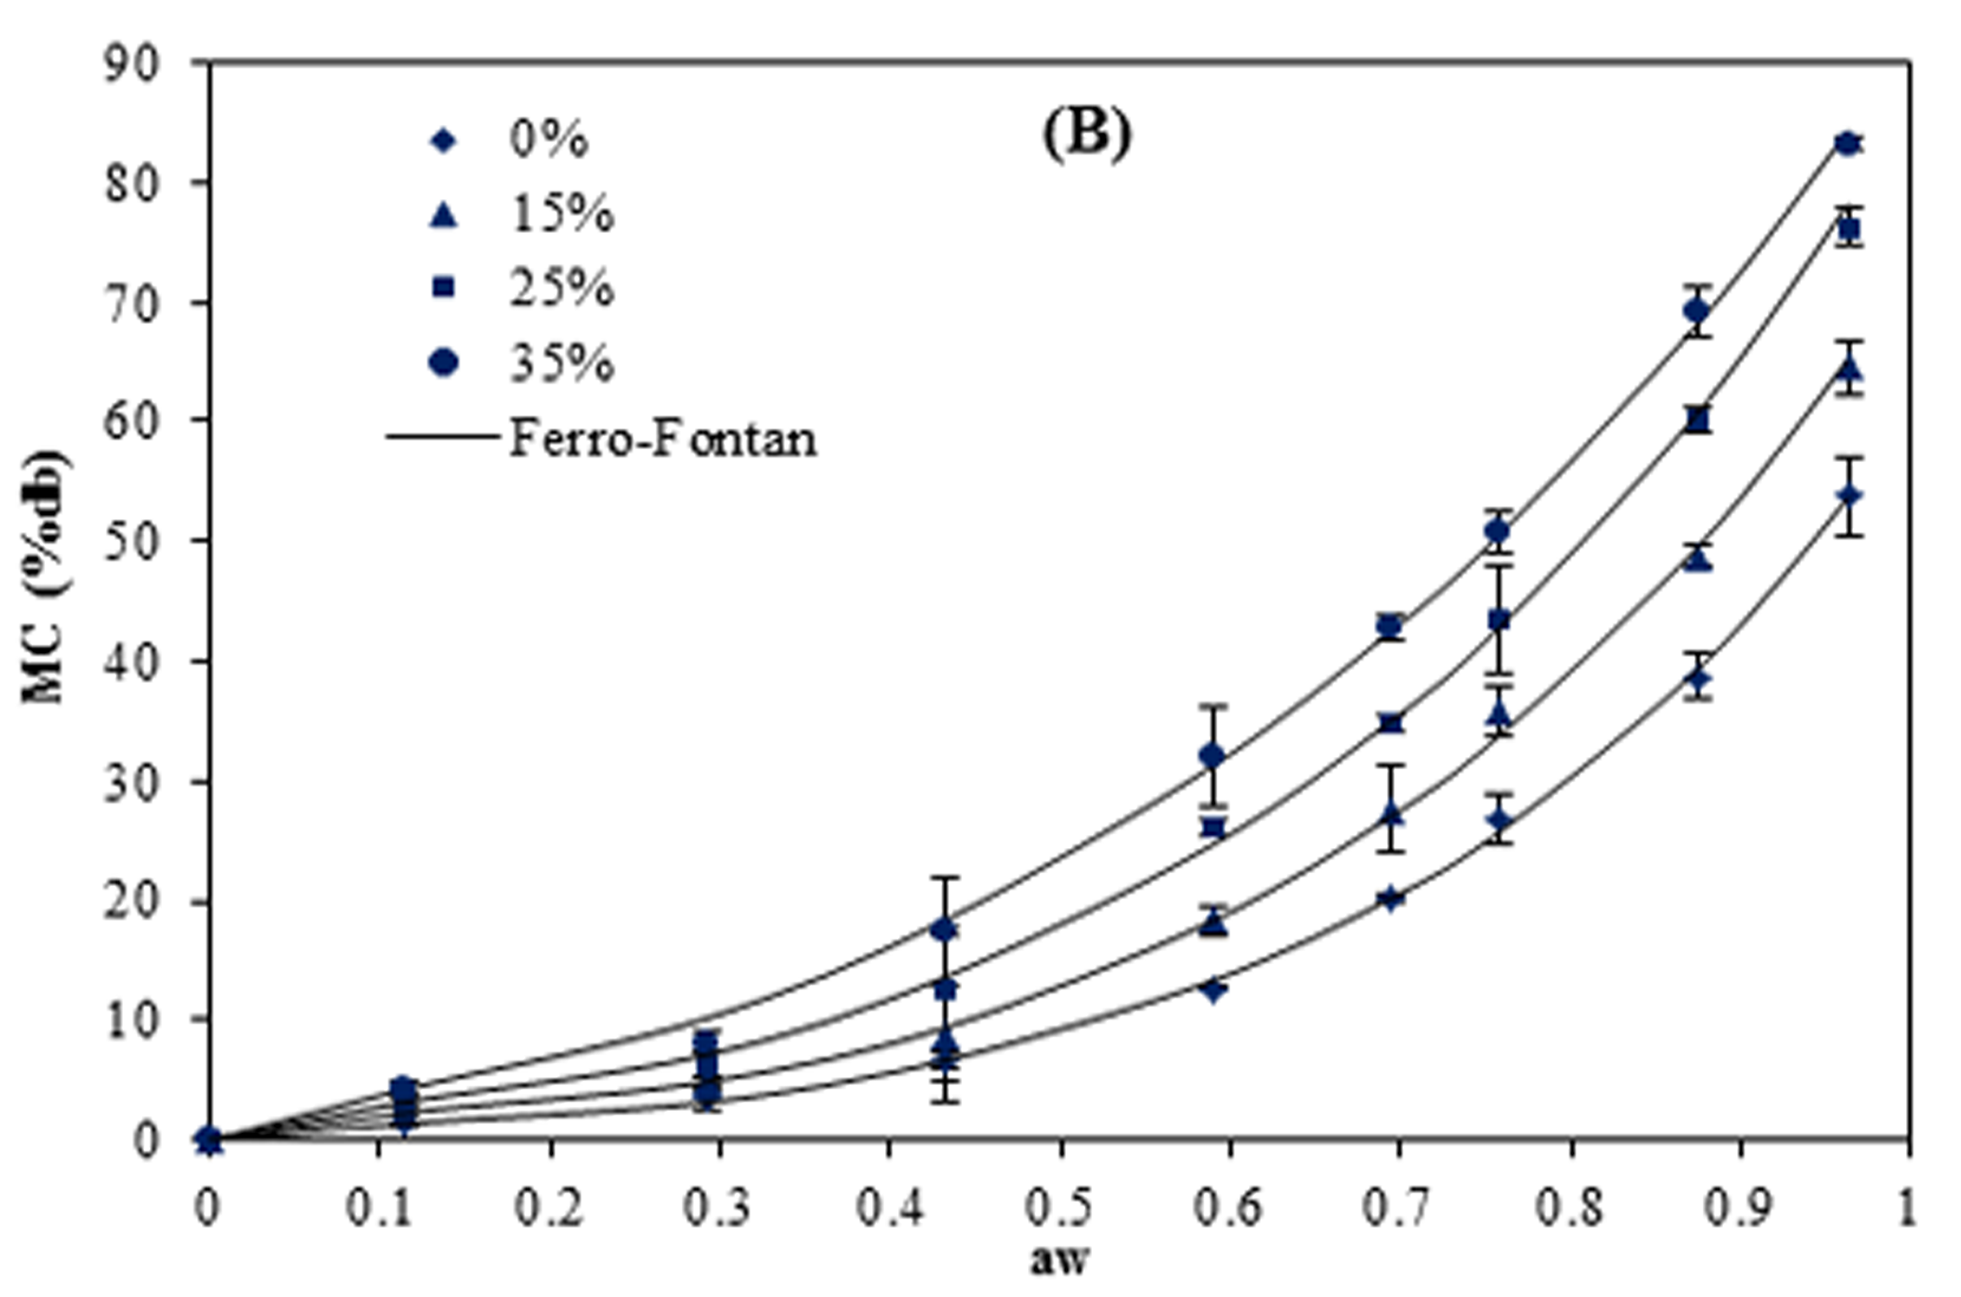
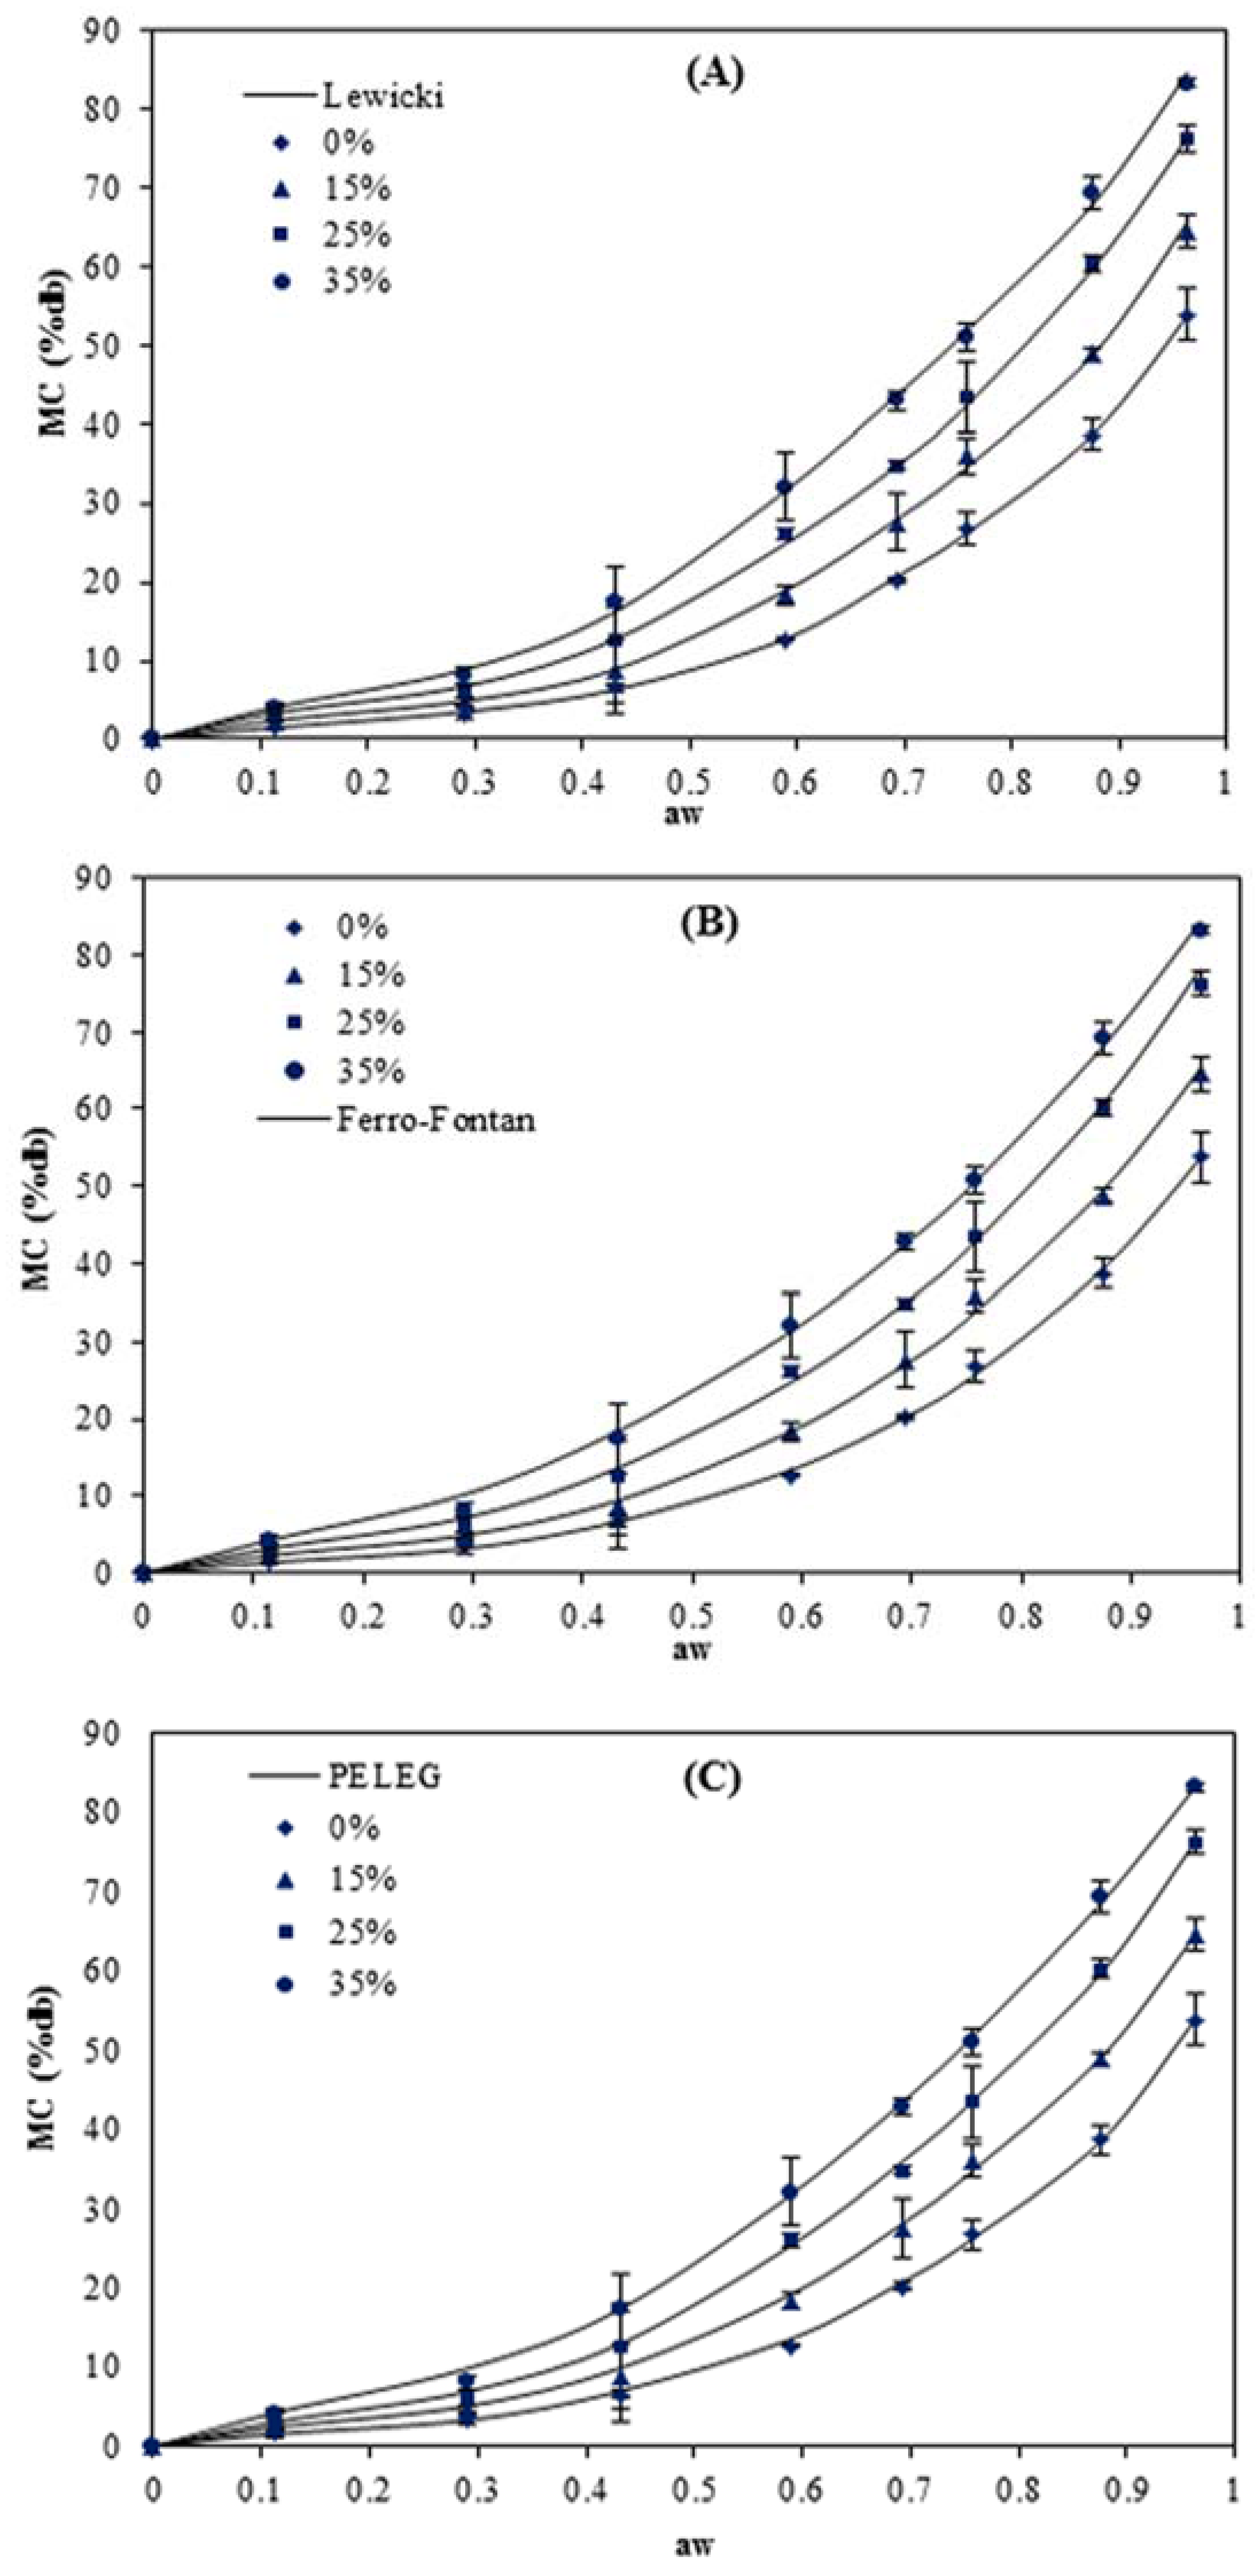
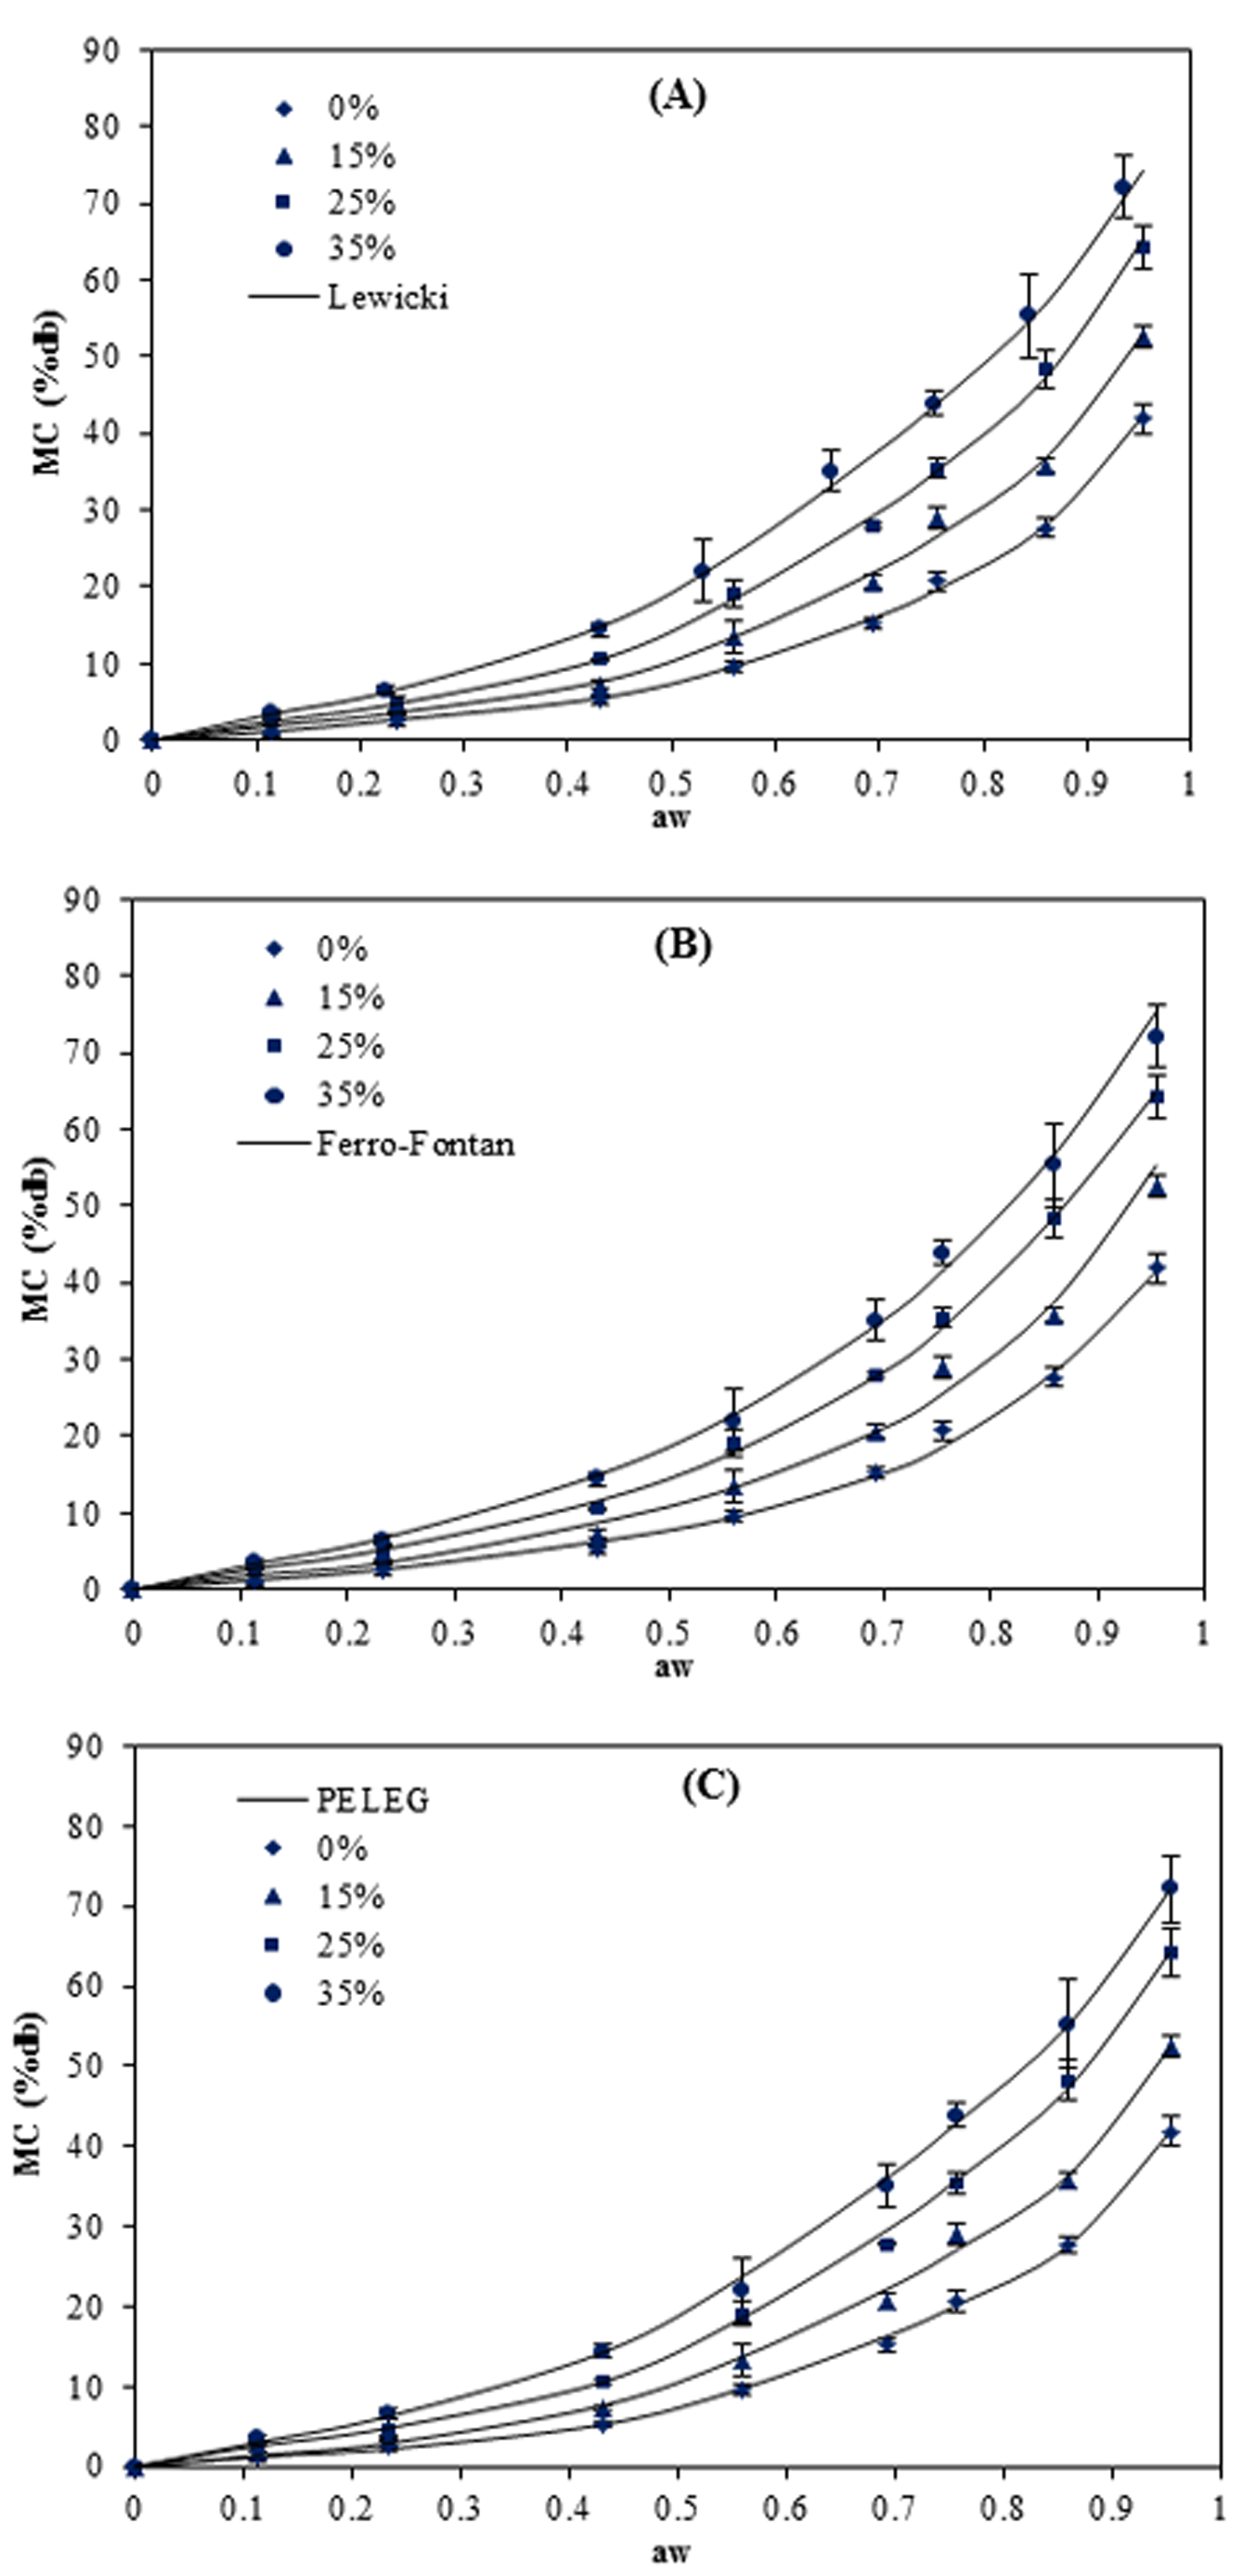
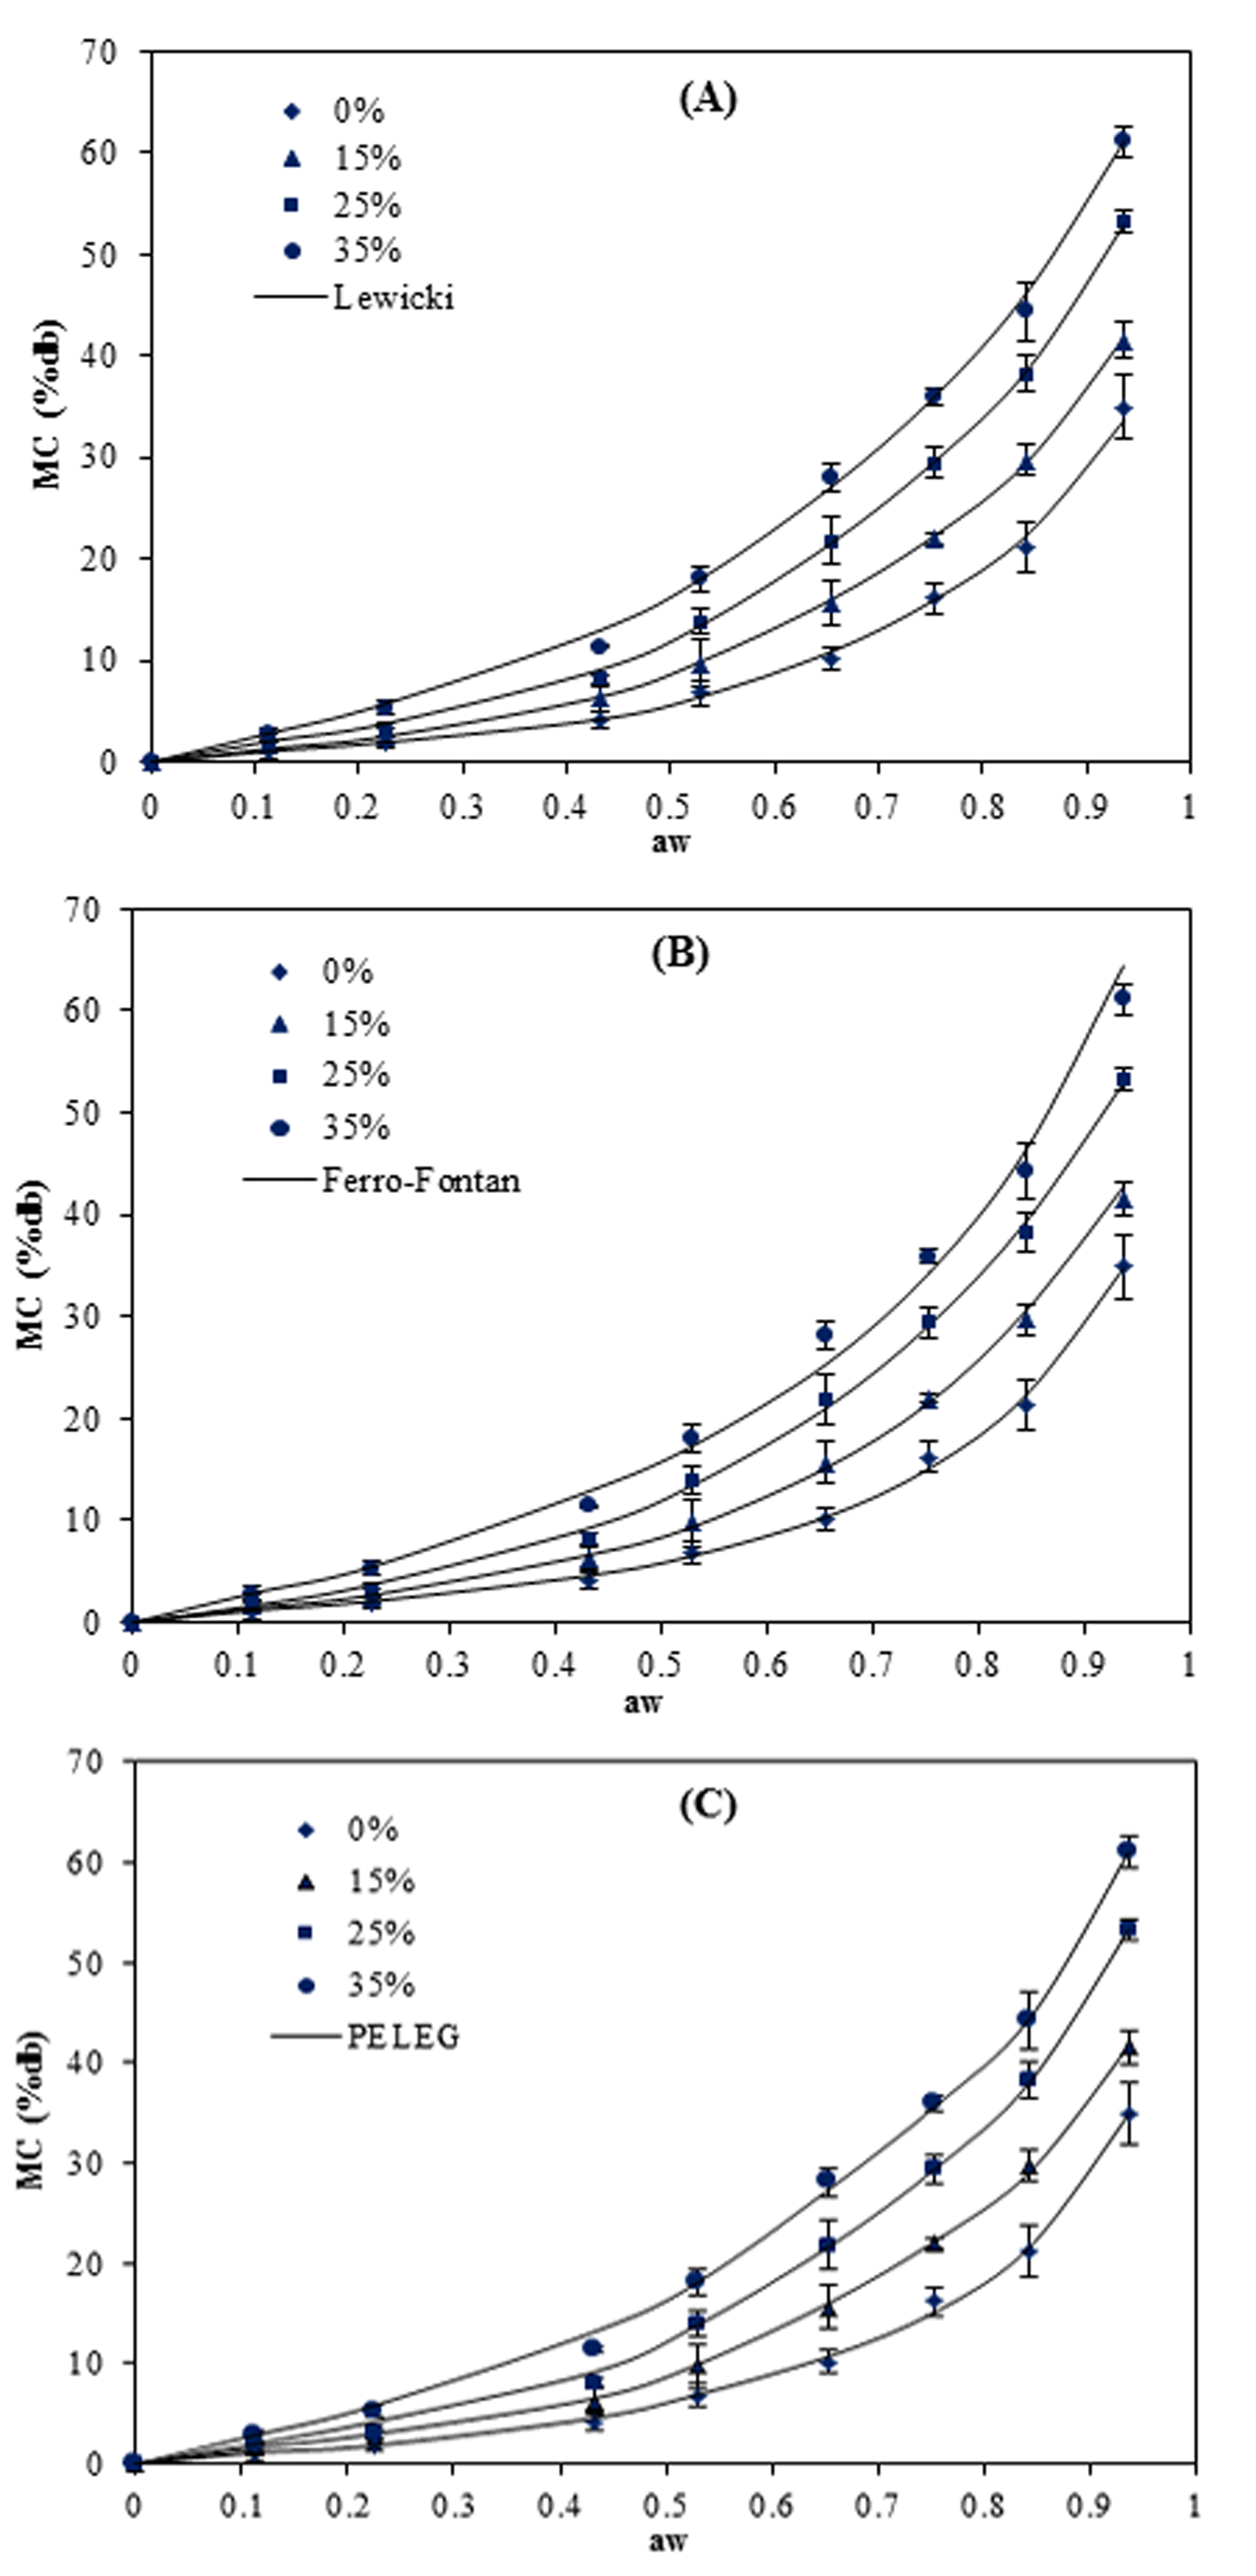
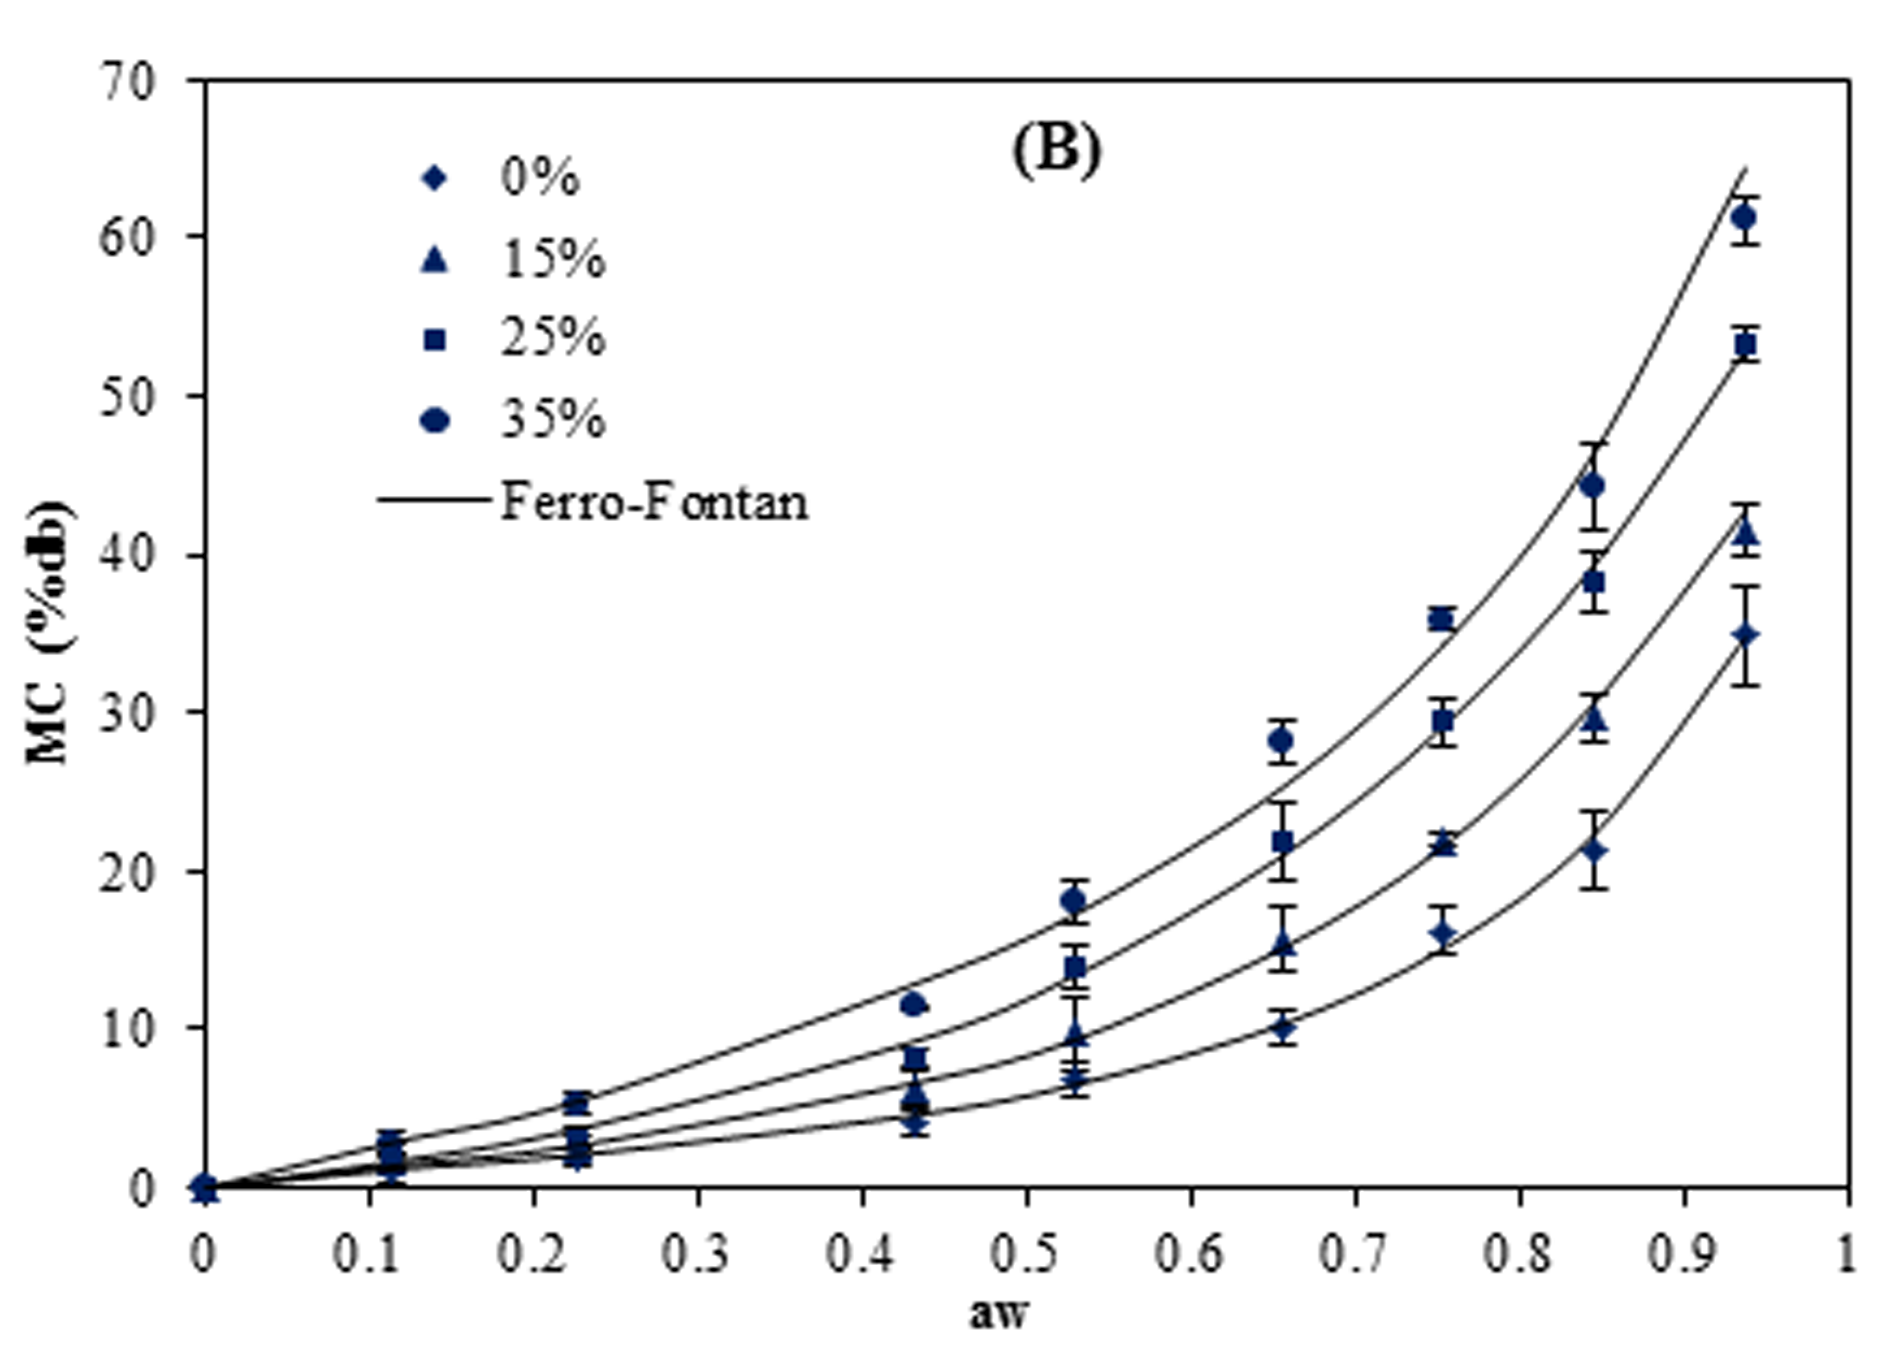
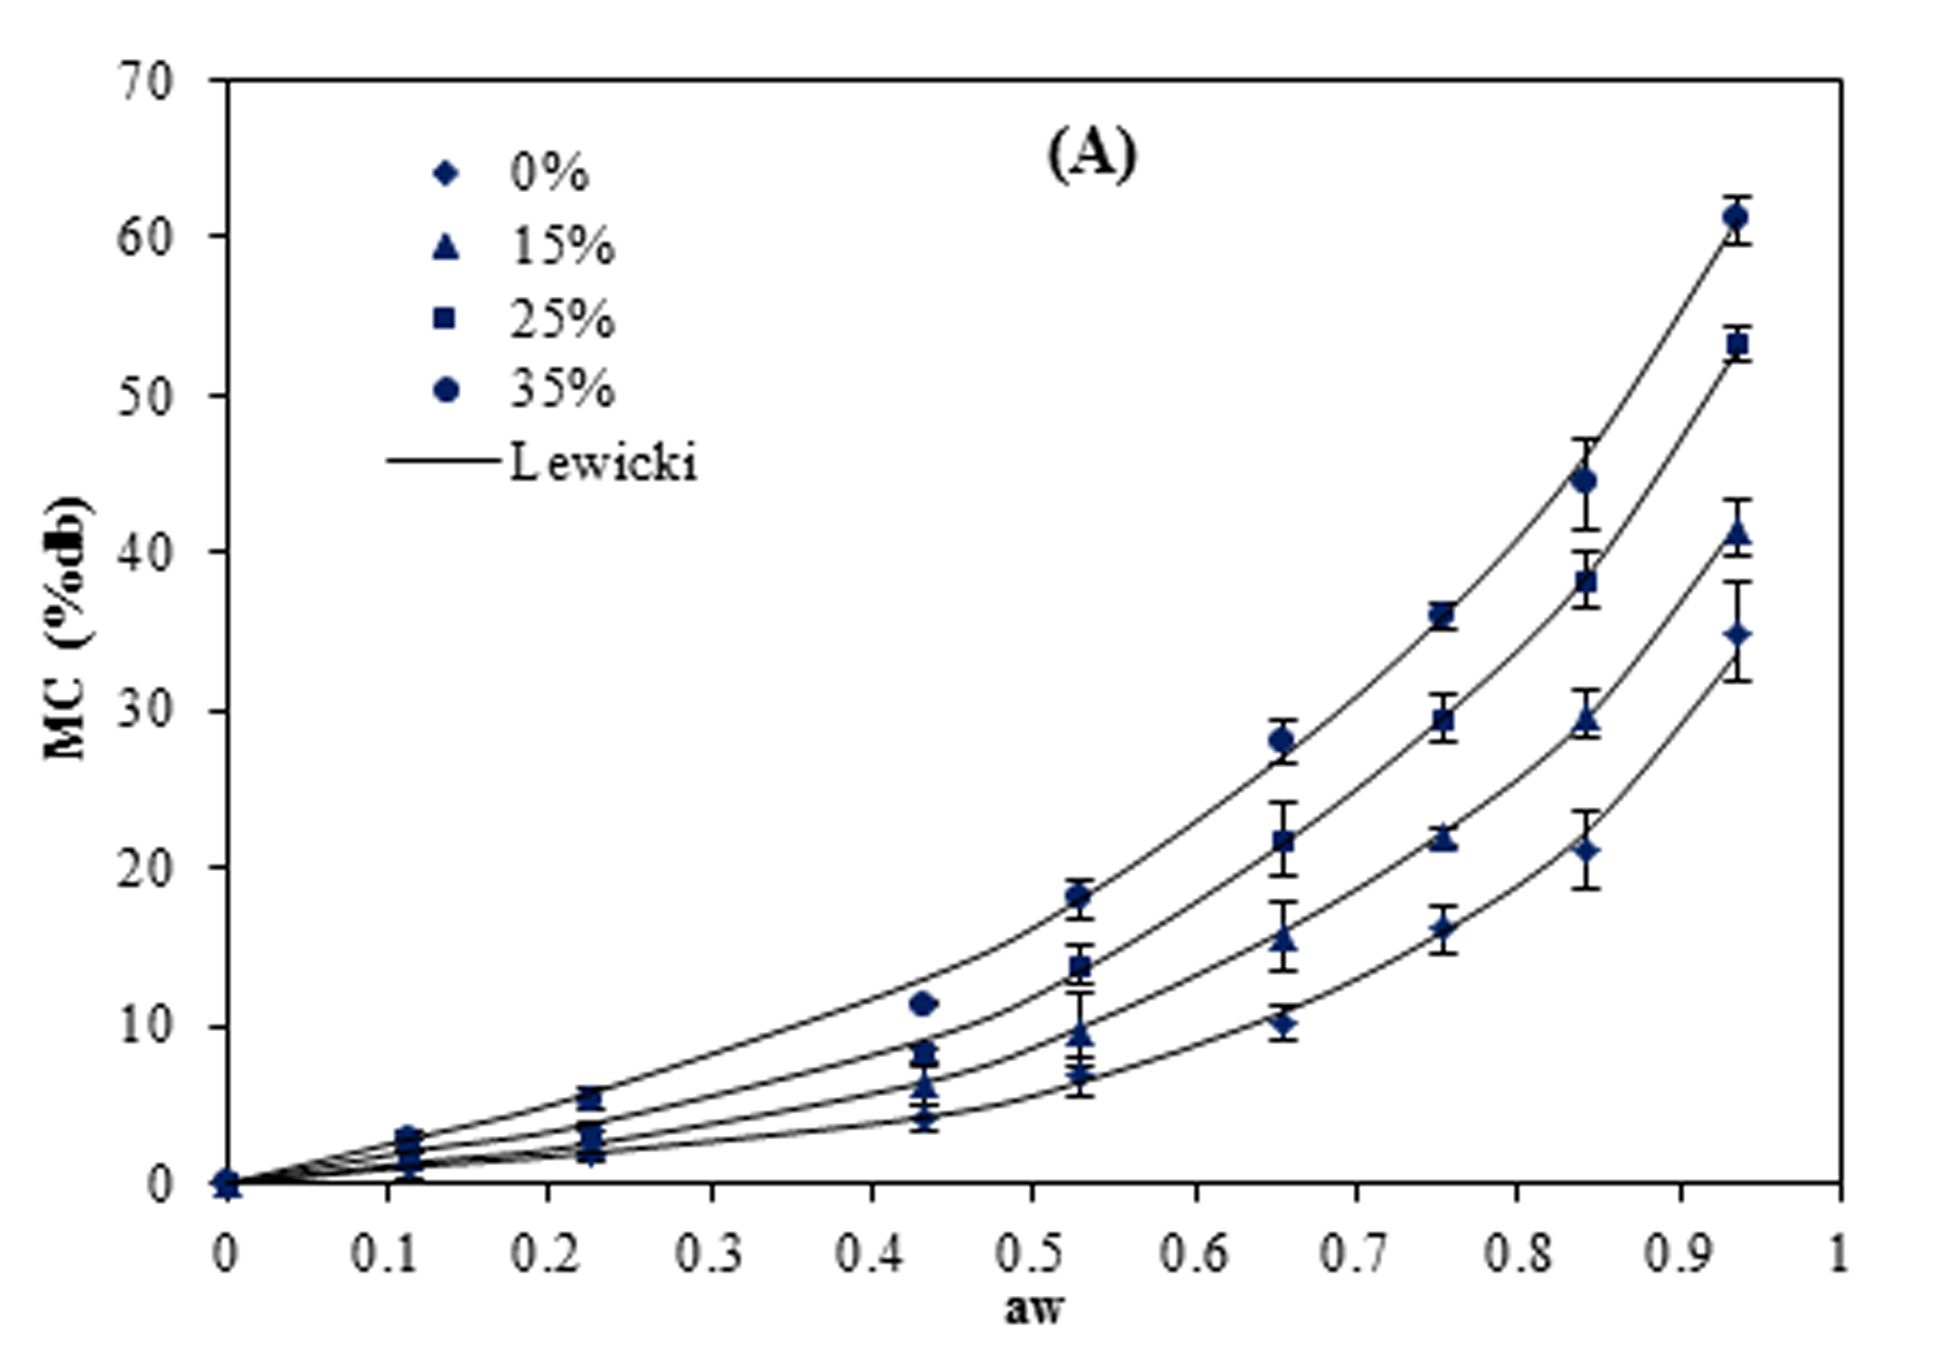
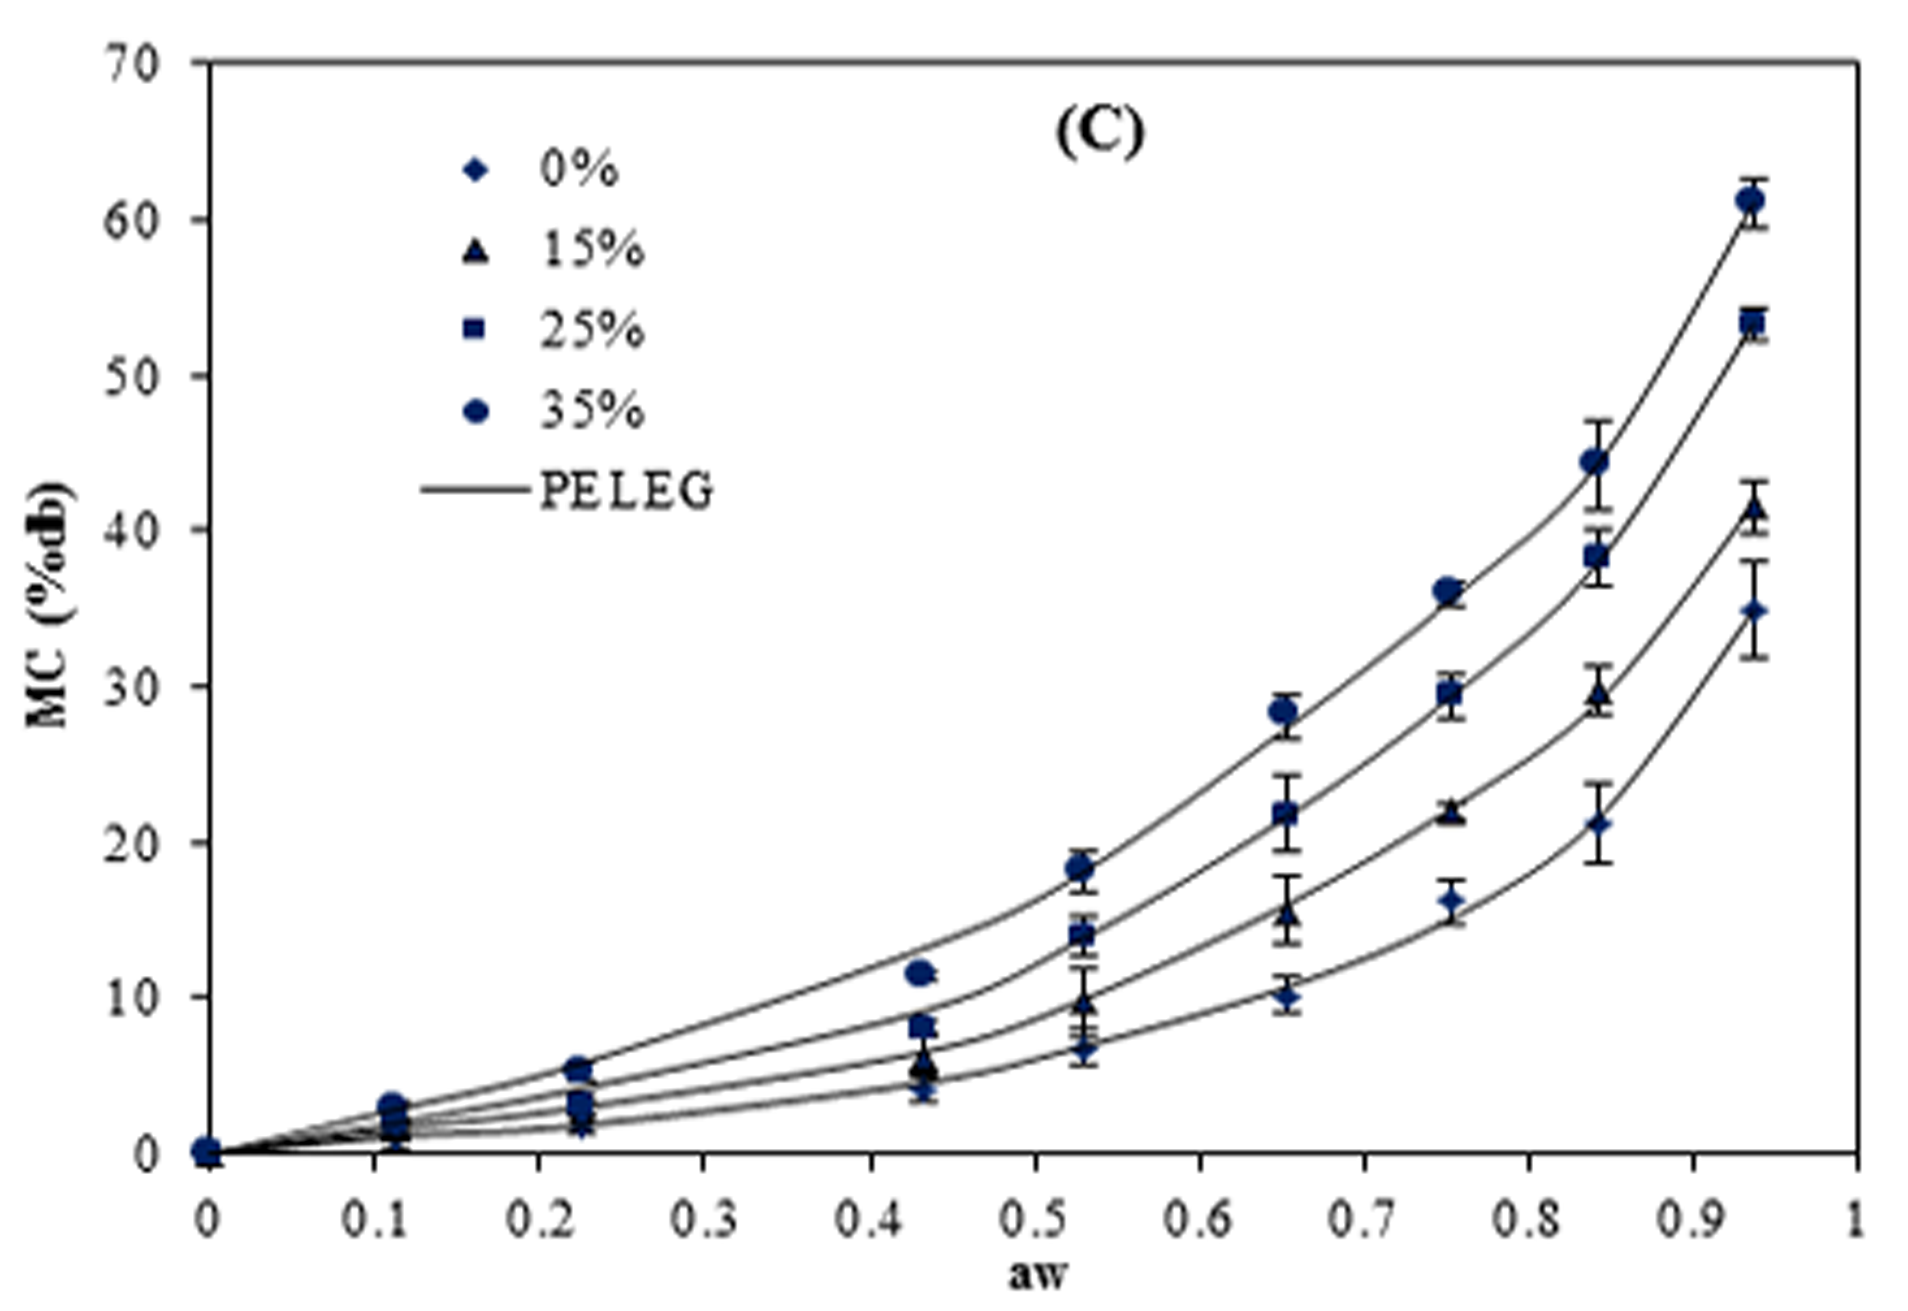
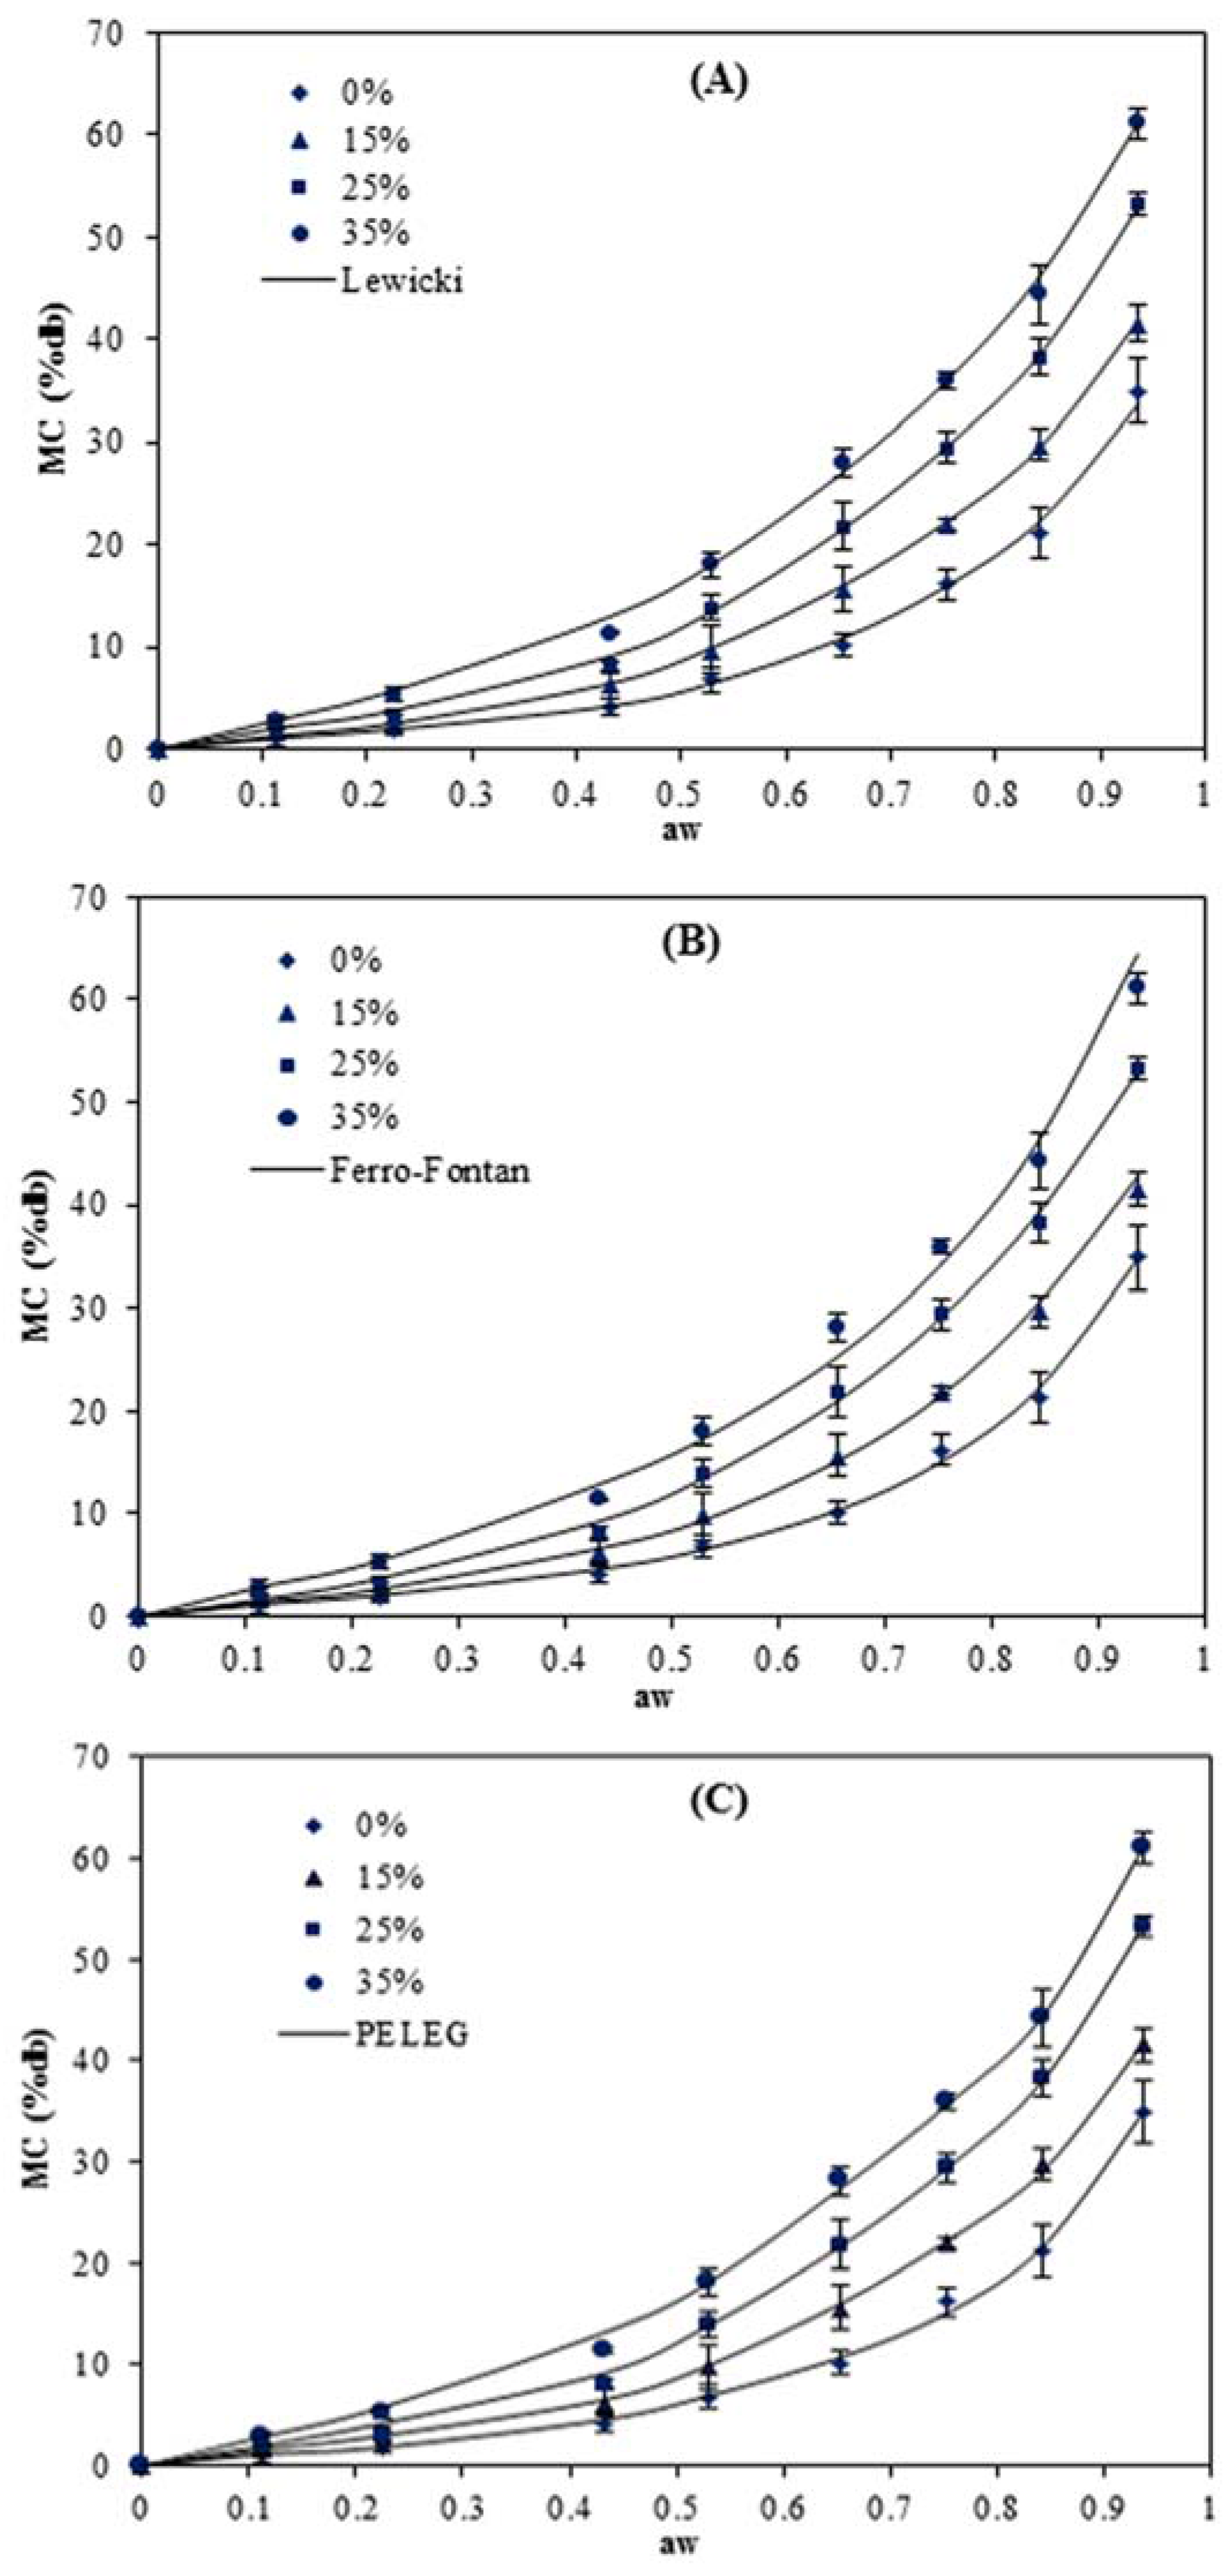
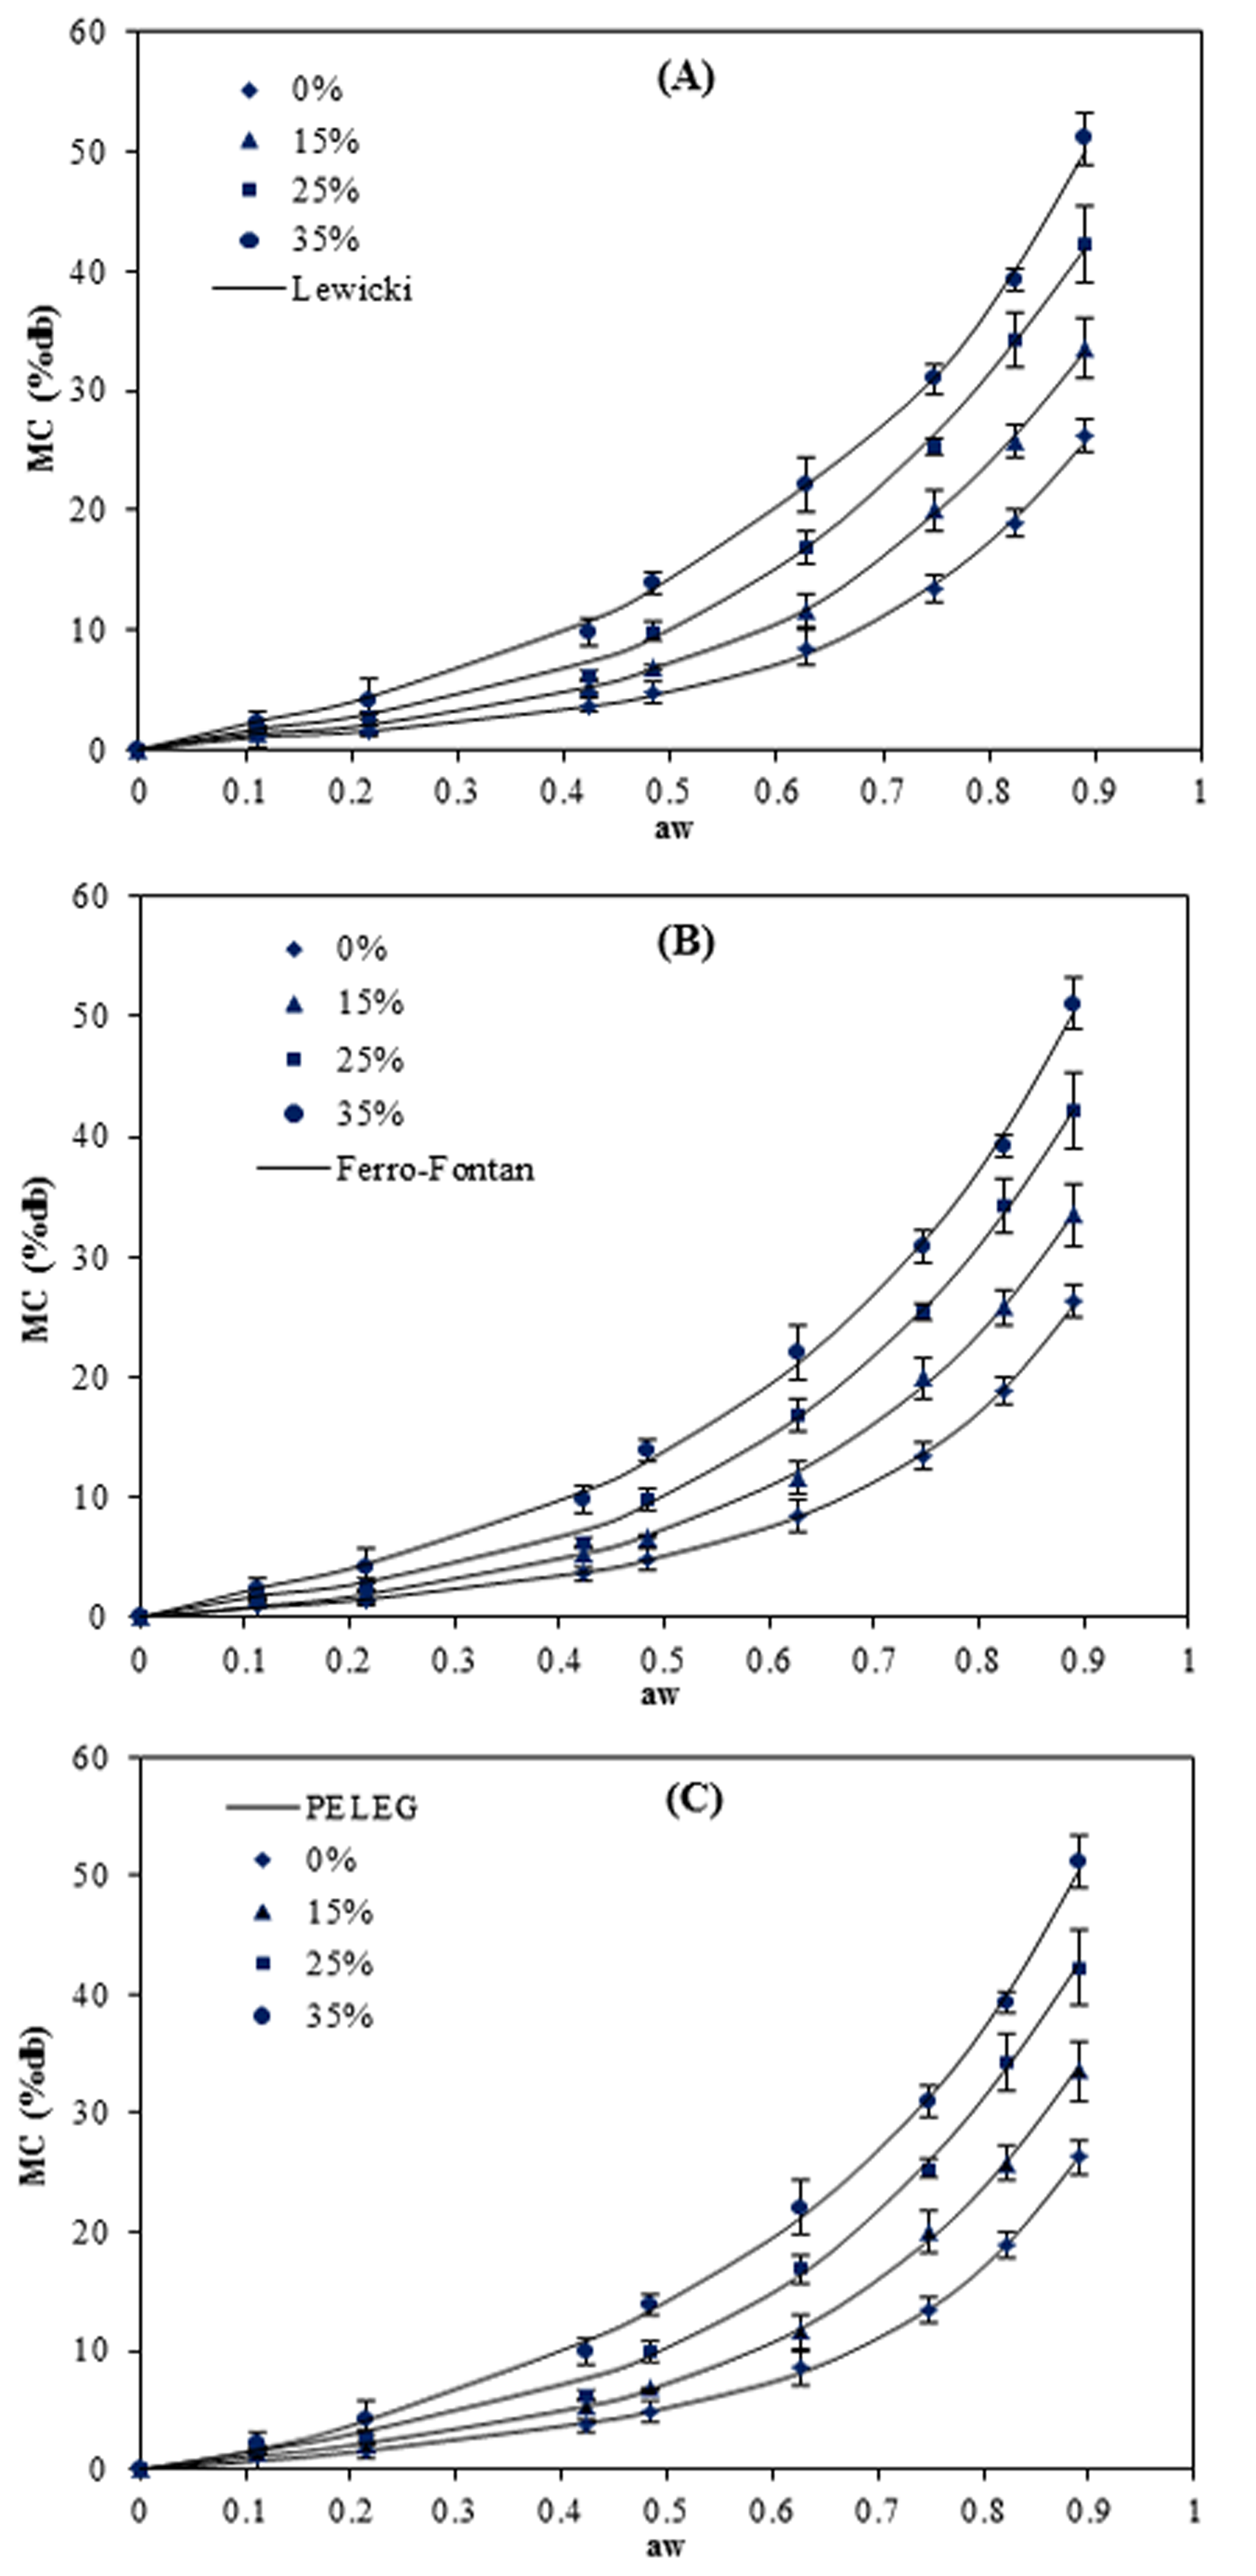
3.1. Moisture Sorption Isotherm

Moisture absorption is an important indicator of the sensitivity of material to moisture. The physical and barrier characteristics of starch-based films can be significantly affected by moisture content [15]. The moisture sorption curves of the pea starch films at 5, 15, 25 and 40 °C are presented in Figure 1, Figure 2, Figure 3 and Figure 4. The results show that these responses were a sigmoidal shape (Type III) consistent with the classification of Al-Muhtaseb et al. [28]. The J-shaped isotherm of glycerol-plasticized films has been reported by Enyinnaya Chinma et al. [29] and Coupland et al. [30]. The slope of the isotherms for pea starch films was smaller at lower aw (less than 0.60), with the raising in aw the slope increased quickly, which brought about large moisture adsorption with any increase in relative humidity [30]. At lower relative humidities, water strongly adsorbed to the binding sites of the film surface, while by increasing moisture content, owing to the swelling of the hydrophilic network of films [31], more new sites for water were available to bind, causing higher moisture content (MC) [32]. This is typical behavior of hydrophilic substances and is shown in water sorption isotherms of pea starch films, where similar results have been reported for other starch edible films [3,5,14,15,16,18,33,34].
Starch films are often semicrystalline, containing both amorphous and crystalline phases, similar to starch granules [35]. Hydrogen-bonding of water molecules to the accessible hydroxyl groups in the amorphous areas and on the surfaces of the crystallites, are responsible for starch sorption isotherm [36]. The amorphous regions show more inclination to water diffusion than the crystalline regions. Therefore, water influences the structure acting as a plasticizer of the amorphous regions. At low water activity, the plasticizing effect is very small and the movement of the amorphous regions is limited. While, at higher water activity, the accessibility of the hydroxyl groups to the water molecules increases due to the swelling of the biopolymer and reduction of crystallinity degree, so there is a rise in accessibility of the polar groups to the water molecules [22].
Figure 1. Equilibrium moisture sorption isotherm of pea starch film with different glycerol content (w/w) at 5 °C. The symbols are experimental data and the lines are from the equations obtained by fitting the experimental data to Lewicki (A), Ferro–Fontan (B) and PELEG (C) equations.
Foods 05 00001 g001
Figure 2. Equilibrium moisture sorption isotherm of pea starch film with different glycerol content (w/w) at 15 °C. The symbols are experimental data and the lines are from the equations obtained by fitting the experimental data to Lewicki (A), Ferro–Fontan (B) and PELEG (C) equations.
Foods 05 00001 g002
Figure 3. Equilibrium moisture sorption isotherm of pea starch film with different glycerol content (w/w) at 25 °C. The symbols are experimental data and the lines are from the equations obtained by fitting the experimental data to Lewicki (A), Ferro–Fontan (B) and PELEG (C) equations.
Foods 05 00001 g003
Figure 4. Equilibrium moisture sorption isotherm of pea starch film with different glycerol content (w/w) at 40 °C. The symbols are experimental data and the lines are from the equations obtained by fitting the experimental data to Lewicki (A), Ferro–Fontan (B) and PELEG (C) equation.
Foods 05 00001 g004
The results also showed that the MC decreased with increasing temperature, at the same aw, for each film, indicating that the starch films become less hygroscopic. At higher temperatures, the attraction forces between molecules reduce owing to an increase in kinetic energy of water molecules. So, at low temperatures, water molecules with lower energy levels are easily bound to available binding sites of the surface [22]. In addition, the incorporation of glycerol improved the capacity of films to absorb more water. In the absence of glycerol, the crystalline fraction of starch films holds a specific amount of water linked by hydrogen bonds, while amorphous regions have capacity to absorb relatively high amount of water molecules [37]. By incorporation of glycerol, the crystallization development may be partially prevented, because it can disturb the configuration of polymeric chains by interfering with amylose packing through the formation of glycerol–starch and glycerol–water interactions [38]. The increase of glycerol content resulted in weakening the cohesiveness of the polymer structure, creating the polymer network with greater interchain distances [39], thus facilitating more water molecules immobilizing into the pea starch film matrix [40]. The strong tendency of glycerol to water was associated with its high polarity [41]. Glycerol molecules, therefore, entrapped a large amount of water molecules inside the starch polymer matrix by increasing the free volume of the starch molecular network and flexibility of the polymeric chains [18]. Glycerol as a water-holding agent contributes to the formation of more hydrogen bonds in the film matrix and increases the MC in the film.

3.2. Modeling of Sorption Isotherms

The constants of the sorption models for pea starch films with different contents of glycerol, together with the correlation coefficient (R2) and the mean relative percentage deviation modulus (Me) are shown in Table 2, Table 3, Table 4 and Table 5.
Table 2. Estimated model constants and values of coefficients and mean relative percentage deviation moduli for different pea starch films at 5 °C.
Model ConstantsGlycerol
0%15%25%35%
BET (0.11–0.50)m00.0610.0860.1230.149
C6.2284.2763.1593.090
Me17.81317.01412.91011.407
R20.9140.9390.9760.978
GAB (0.11–0.96)m00.1050.1280.1530.200
C2.0961.8251.7790.632
K0.8930.8880.8480.670
Me9.6889.6697.3522.273
R20.9930.9920.9890.999
PELEG (0.11–0.96)k10.6410.7250.8980.986
k20.5000.6660.7940.808
n12.6992.5472.3391.971
n242.86144.04064.78253.221
Me2.9804.1083.3632.433
R21.0001.0000.9990.999
Oswin (0.11–0.96)K00.1650.1940.2590.331
n00.4100.4110.3710.317
Me36.74634.43534.66836.267
R20.9700.9750.9650.934
Ferro–Fontan (0.11–0.96)γ0.0700.1080.0980.125
α1.1621.1241.2481.291
r0.8440.9580.7910.796
Me5.4646.6626.7391.908
R20.9940.9920.9890.998
Henderson (0.11–0.96)A11.34912.82820.31937.910
B0.4180.4080.4110.426
Me39.75838.58140.85042.510
R20.9700.9730.9570.917
Lewicki (0.11–0.96)F0.4890.5130.7611.484
G0.1980.2210.1680.058
H3.1462.6752.4673.105
Me1.9081.4652.1070.895
R21.0001.0000.9991.000
Iglesias–Chirife (0.11–0.65)A0.0960.1150.1480.181
B1.5721.9333.3785.340
Me13.62211.0335.9885.072
R20.9870.9920.9970.996
Flory–Huggins (0.11–0.96)A0.9991.2102.6554.270
B4.4624.4283.7523.097
Me14.83315.2368.3194.775
R20.9850.9810.9840.998
Table 3. Estimated model constants and values of coefficients and mean relative percentage deviation moduli for different pea starch films at 15 °C.
Model ConstantsGlycerol
0%15%25%35%
BET (0.11–0.50)m00.0440.0610.0830.116
C13.8078.7808.3147.480
Me8.78513.3346.8405.579
R20.9520.9320.9770.993
GAB (0.11–0.96)m00.0790.0980.1020.180
C6.2232.6802.5103.144
K0.9180.9220.9120.869
Me10.3447.9617.0895.042
R20.9900.9950.9890.993
PELEG (0.11–0.96)k10.5490.6790.7060.900
k20.7820.8271.0831.519
n12.8372.8262.4452.210
n250.95578.35446.82344.471
Me4.3534.2174.2703.349
R21.0000.9990.9980.999
Oswin (0.11–0.96)K00.1270.1570.1870.268
n00.4790.4660.4580.396
Me25.31224.90017.41523.917
R20.9840.9810.9890.977
Ferro–Fontan (0.11–0.96)γ9.08213.13825.61113.993
α1.0771.0761.0521.193
r1.0521.1011.2650.901
Me7.9066.8756.2254.475
R20.9910.9940.9930.993
Henderson (0.11–0.96)A7.4319.02810.55518.236
B0.4040.3970.3900.397
Me29.14729.61522.42231.165
R20.9840.9790.9860.968
Lewicki (0.11–0.96)F0.2370.3520.2960.569
G0.3440.2970.3670.246
H0.4502.1620.9812.180
Me1.6642.6242.1331.708
R20.9991.0001.0001.000
Iglesias–Chirife (0.11–0.65)A0.0710.0850.0951.426
B1.8932.6624.6125.622
Me11.1148.5124.6131.998
R20.9910.9920.9950.999
Flory–Huggins (0.11–0.96)A0.5790.8741.0952.954
B4.9104.6494.5693.684
Me20.79818.66721.67911.052
R20.9770.9720.9720.987
Table 4. Estimated model constants and values of coefficients and mean relative percentage deviation moduli for different pea starch films at 25 °C.
Model ConstantsGlycerol
0%15%25%35%
BET (0.11–0.50)m00.0400.0510.0720.086
C12.08111.56210.2768.791
Me9.32111.2236.2017.380
R20.9420.9280.9780.974
GAB (0.11–0.96)m00.0570.0820.0970.158
C4.3544.1662.8382.099
K0.9370.9270.9220.881
Me6.6438.0054.7745.993
R20.9970.9970.9960.997
PELEG (0.11–0.96)k10.3770.5180.6170.801
k20.5580.5610.6410.749
n12.3752.5052.3612.426
n225.02124.45427.41624.179
Me4.8602.9134.4515.396
R21.0001.0000.9980.998
Oswin (0.11–0.96)K00.0990.1320.1660.218
n00.5250.5170.4900.450
Me15.81120.65016.13821.559
R20.9920.9880.9890.976
Ferro–Fontan (0.11–0.96)γ7.5517.56612.1868.768
α1.0601.0881.0831.195
r1.0810.9611.0470.811
Me3.5435.2313.5814.556
R20.9980.9980.9960.997
Henderson (0.11–0.96)A5.6546.8708.71612.130
B0.4020.3870.3840.385
Me18.28624.90921.40326.724
R20.9940.9890.9880.973
Lewicki (0.11–0.96)F0.1980.3010.3080.587
G0.3650.3240.3510.231
H3.2563.7032.5903.357
Me3.3642.6821.0542.841
R21.0001.0001.0001.000
Iglesias–Chirife (0.11–0.65)A0.0590.0810.0960.117
B1.9251.9293.4054.565
Me8.09010.8073.5053.961
R20.9930.9860.9900.996
Flory–Huggins (0.11–0.96)A0.3820.5570.9661.846
B5.1705.0434.6114.085
Me26.22323.08921.88914.115
R20.9780.9830.9810.992
Table 5. Estimated model constants and values of coefficients and mean relative percentage deviation moduli for different pea starch films at 40 °C.
Model ConstantsGlycerol
0%15%25%35%
BET (0.11–0.50)m00.0360.0450.0600.079
C11.61310.90710.7749.746
Me8.7129.2455.2413.756
R20.9560.9390.9880.988
GAB (0.11–0.96)m00.0500.0680.0820.121
C1.1750.8160.7930.483
K0.9160.8990.8660.862
Me6.4745.8996.4475.112
R20.9950.9960.9980.996
PELEG (0.11–0.96)k10.1680.1710.1840.203
k20.5500.7310.9110.946
n11.2970.9110.7640.633
n28.5687.5027.9456.300
Me7.9205.3384.3094.200
R20.9970.9981.0000.998
Oswin (0.11–0.96)K00.0920.1210.1390.189
n00.5610.5530.5640.503
Me17.29822.95813.42517.766
R20.9780.9730.9860.971
Ferro–Fontan (0.11–0.96)γ3.4113.5795.6136.280
α1.1531.2041.1201.202
r0.7310.6490.8130.735
Me5.0785.6775.7194.493
R20.9980.9980.9990.996
Henderson (0.11–0.96)A5.0166.0346.4229.177
B0.3930.3780.3670.372
Me19.36126.53017.22122.929
R20.9820.9760.9880.970
Lewicki (0.11–0.96)F0.6820.9480.7170.515
G0.1020.0870.1750.222
H9.0028.2279.1302.671
Me3.7785.2641.4861.308
R20.9990.9981.0001.000
Iglesias–Chirife (0.11–0.65)A0.0570.0750.750.102
B1.5411.6523.3704.311
Me7.1609.4392.4733.329
R20.9800.9790.9960.993
Flory–Huggins (0.11–0.96)A0.3030.4520.4491.196
B5.3815.2325.4144.504
Me27.92124.71628.82120.898
R20.9880.9910.9890.990
The most recognized models for calculation of monolayer moisture content (m0) of foods materials are BET and GAB. The monolayer value is evidence of the quantity of water that can be bound to a single layer per gram of dry film [42]. Since the GAB model is associated with the water sorption in the multi-layer and the BET model in the first layer region, it is expected that the GAB model results in higher values of monolayer moisture content than those measured by the BET model [32]. The results showed that the water content associated to the monolayer of pea starch film without plasticizer analyzed in the range of 5–40 °C, varied from 0.061 to 0.036 g water/g dry solids, when the BET model was considered and from 0.105 to 0.050 g water/g dry solids for the GAB model. Comparing with pea starch film content 15% and 35% w/w glycerol, the monolayer moisture content varied from 0.086 to 0.045 g water/g dry solids and 0.149 to 0.079 g water/g dry solids, respectively. When the BET model was considered for the pea starch film content 15% and 35% w/w glycerol, the results were from 0.128 to 0.068 g water/g dry solids and 0.200 to 0.121 g water/g dry solids for the GAB model, all in the range of 5 to 40 °C, respectively. It is proposed that the higher plasticizer content, the more active sites were available to bind water molecules [43]. In addition, the m0 values for all pea starch films showed an affinity to reduce with an increase in temperature because at higher temperatures some water molecules can escape from their sorption sites [44]. The reduction in the monolayer moisture content with increasing temperature has also been observed by Su et al. [45], Perdomo, Cova, Sandoval, García, Laredo and Müller [25], Peng et al. [46], [22], and McMinn, Al-Muhtaseb and Magee [23].
In addition to m0, the sorption energy constant, C, is also related to the monolayer heat sorption in the BET and GAB models [47]. The difference in heat of sorption between the monolayer (E1) and the multilayer or bulk water (EL) is related to CBET [48]. A reduction in the CBET means a decrease in the value of E1 (for monolayer), while EL (bulk liquid) would remain constant. In other words, the high value of this energy constant demonstrates that water molecules more strongly adsorbed in the active sites of the matrix [49]. Comparison of the pea starch films with different glycerol concentrations showed a decrease in this parameter when the glycerol content increased, suggesting that this polyol might occupy some of the sorption sites of the polymer. The difference in C from GAB and BET is mostly due to the fitting process; in terms of GAB it contains another parameter KGAB, contributing equally to CGAB in the model fitting. Theoretically, the GAB equation considers the sorption energies in both monolayer and multilayer domains in comparison with BET, which examines only the sorption heat for the monolayer, supposing similar energies linked to the multilayer. So, it is expected to achieve smaller values for CGAB compared to CBET [49]. Another energy constant of the GAB model is K. An increase in KGAB toward a value of 1 would suggest a smaller difference between the energy associated with the heat of sorption of the multilayer and the heat of condensation of pure water [49]. It is possible that hydroxyl groups of glycerol, on the sorption sites of the matrix, could increase the interaction energies between the water molecules, on the second and higher water layers, and the polymer. In this experiment, this value in all films formulations was near to 1 and independent of composition.
The Me of the GAB and the BET model changed between 2.3%–10.3% and 3.8%–17.8%, respectively. The BET was not considered as an appropriate model for fitting the data due to its restriction to aw below 0.5. GAB model has been recognized for predicting the sorption behavior of different starchy products [4,25,50,51,52,53]. However, in this case, the modeling showed that the GAB model was not the best model for describing the sorption isotherm experimental data.
The Peleg model can be applied as an alternative to the classic BET and GAB models to correctly represent sorption isotherms, due to the presence of an extra parameter in the equation. The lack of a theoretical background in its development is the drawback of using this model to represent a fundamental prediction of the differences in sorption isotherm behavior. In this model, k1 is a constant associated with mass transfer, the lower k1, the higher the initial water adsorption rate; k2 is a constant connected to maximum water adsorption capability and the lower the k2, the higher the adsorption capacity [54]. Unplasticized pea starch film had lower k1 values, indicating that this film adsorbed water at a higher initial rate with increasing % RH. Pea starch films with higher values of glycerol adsorbed water slower at low values of % RH (higher k1 value) and showed higher k2 values (indicating higher water adsorption capacity), which was probably due to the plasticizing effect [13,24,54]. As it can be observed, the Peleg model provided a good fit to the experimental data in the temperature range studied with as evidenced by high R2 and low Me values.
The Oswin and Henderson models were inadequate to describe the experimental data providing an average Me value above 25% and 29%, respectively. The similar results have been observed by Al-Muhtaseb, McMinn and Magee [22] and Perdomo, Cova, Sandoval, García, Laredo and Müller [25]. The Flory–Huggins model also failed to represent the experimental data with Me value ranging from 4.8% to 28.8%, and an average value of 16.8%. In the range of water activity 0.11< aw < 0.65, the Iglesias–Chirife model was displayed a satisfactory fit to the experimental data, providing an average Me value of 7.8% for adsorption data. The results were in agreement with sorption isotherm of polyethylene oxide-corn starch blended films [3].
Among the two other models (Ferro–Fontan and Lewicki) which were applied throughout the whole range of water activity (0.11–0.96), the smallest Me value (0.9%–5.3%) and higher values of R2 (0.999–1.000) at all the temperatures were achieved for the Lewicki model. Figure 1, Figure 2, Figure 3 and Figure 4 also confirmed that the Lewicki equation provided the best fit to the experimental data at all the investigated temperatures, followed by the Ferro–Fontan model. The mean relative percentage deviation modulus (Me), with a modulus value below 10% was indication of a close fit for experimental values [25]. The Lewicki model provided the lowest Me values with average value of 3.1%, in comparison with 4.9% for the Ferro–Fontan model. McMinn, Al-Muhtaseb and Magee [23] also reported that the three parameter Lewicki model is the most adequate model for predicting the sorption properties of raw potato, potato starch, starch–sugar and starch–salt gels within the temperature studied and water activity range.

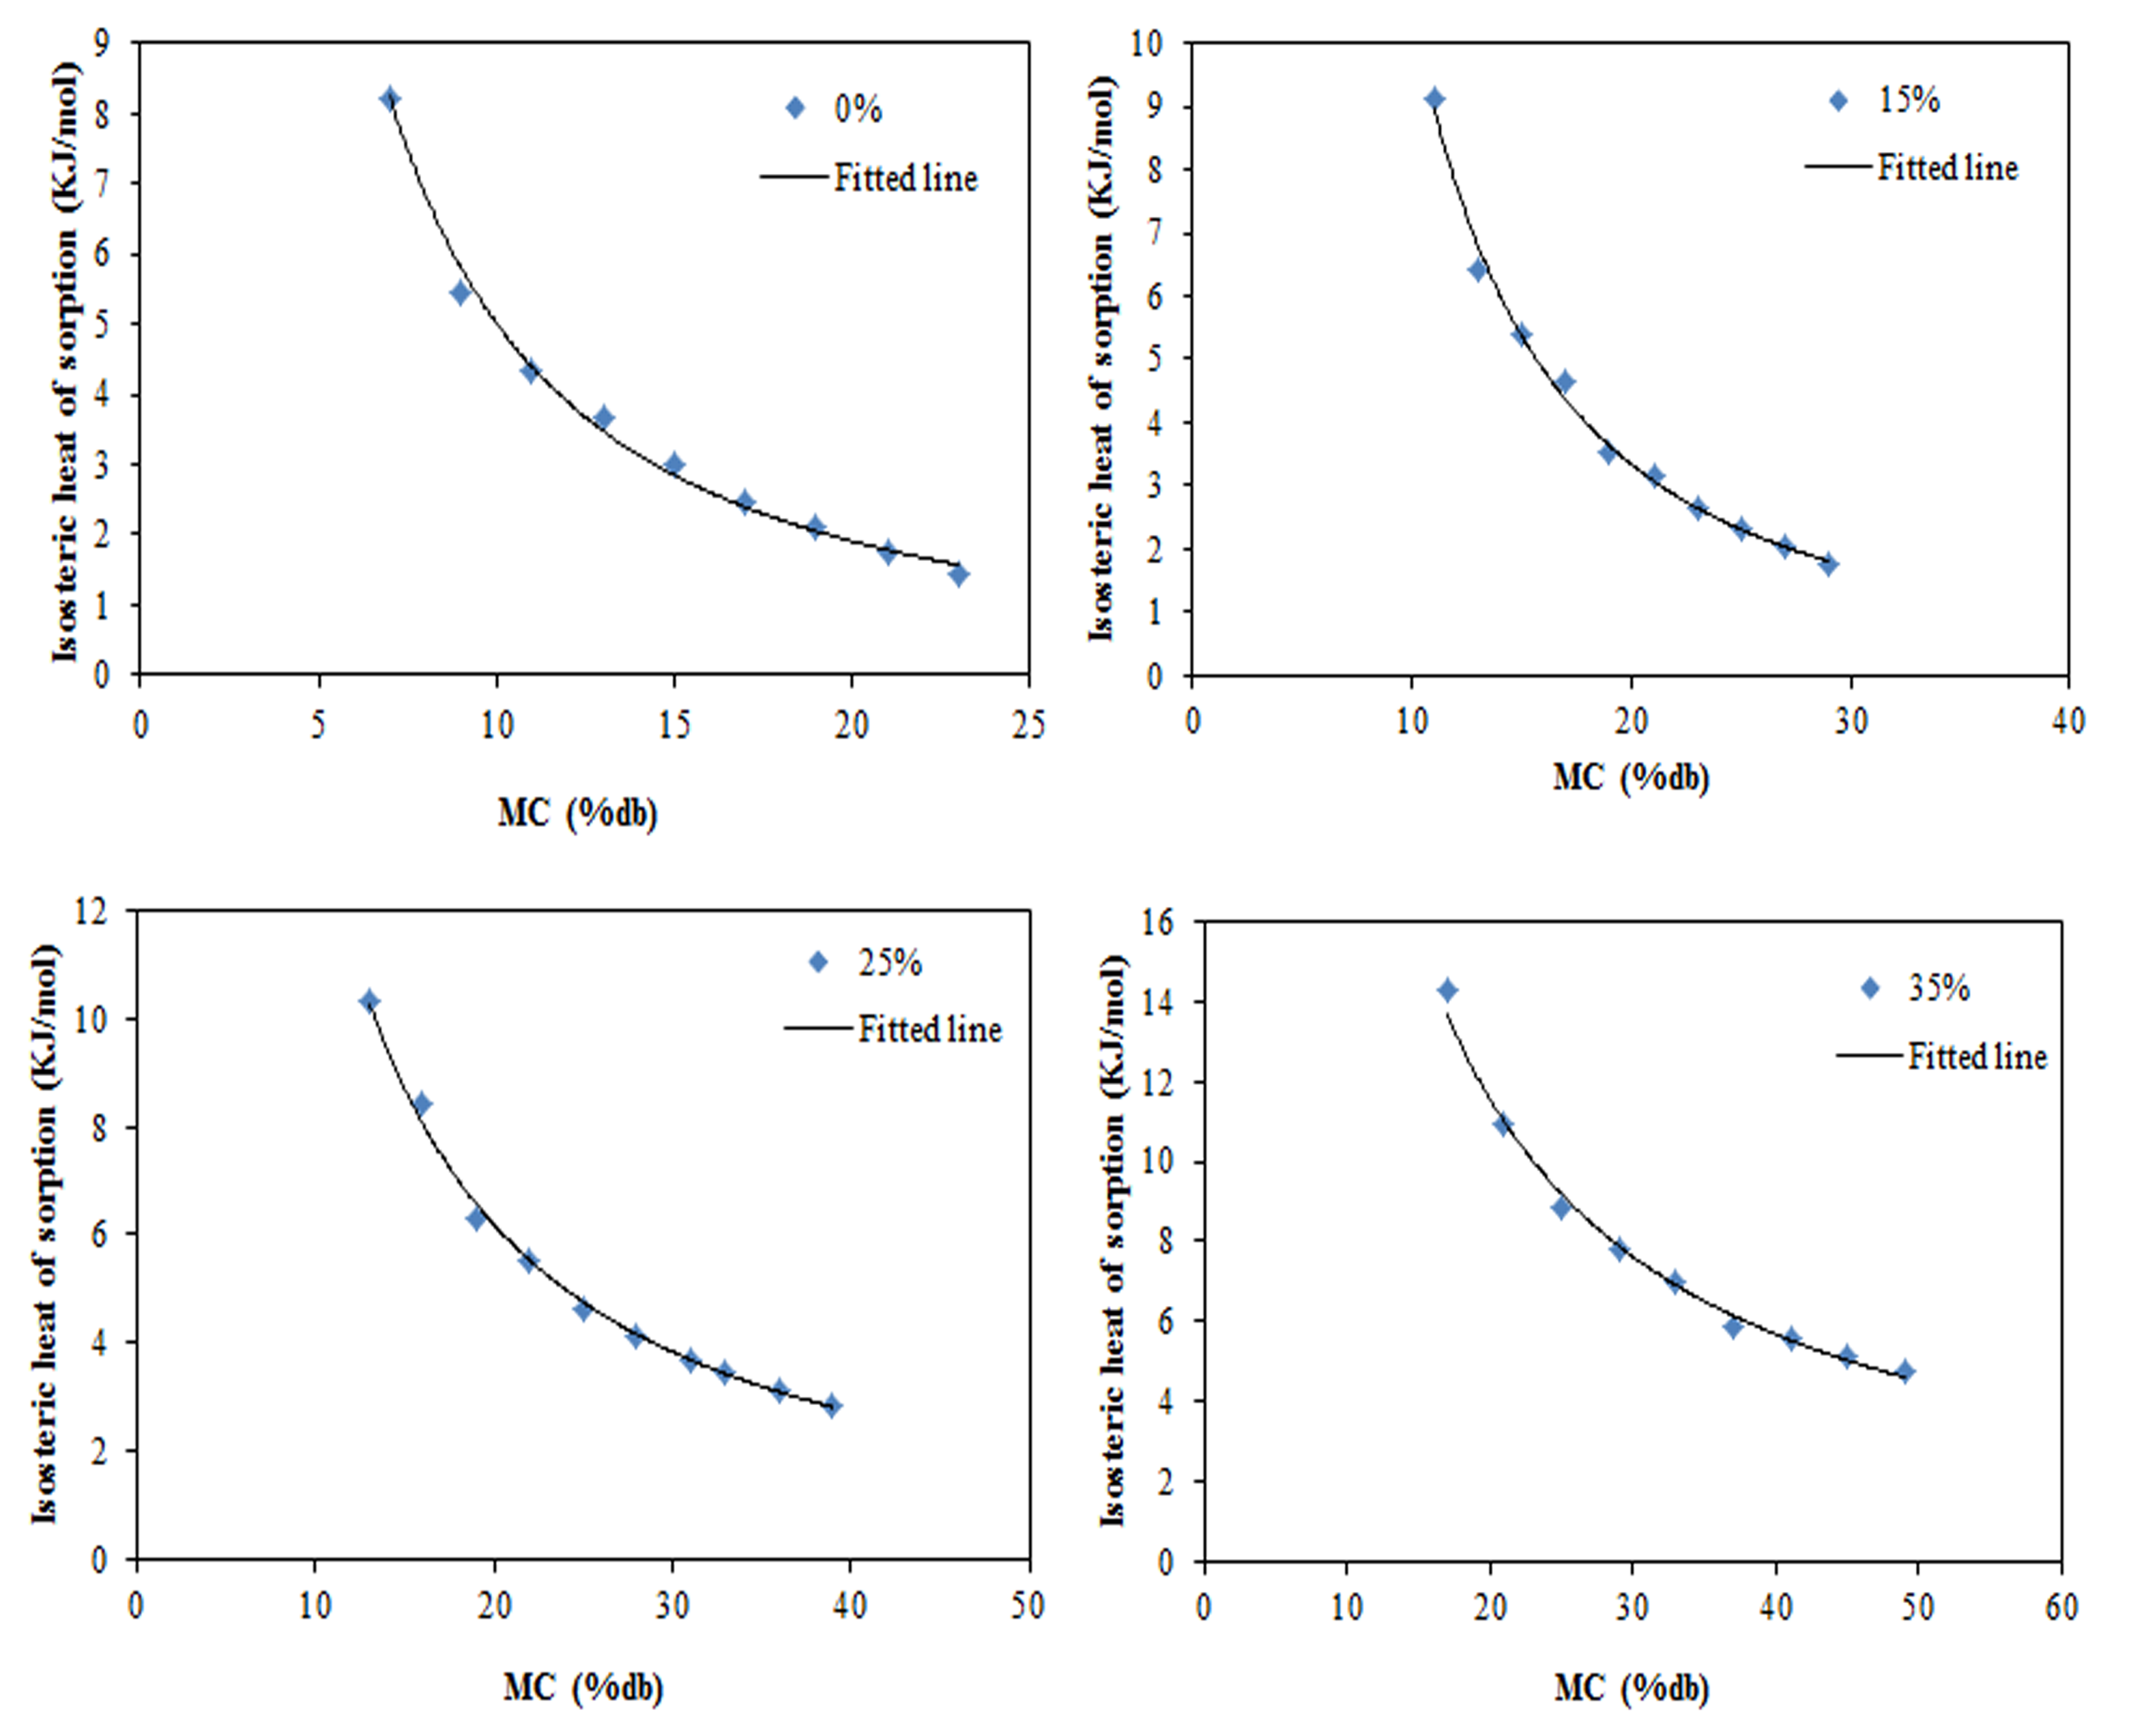
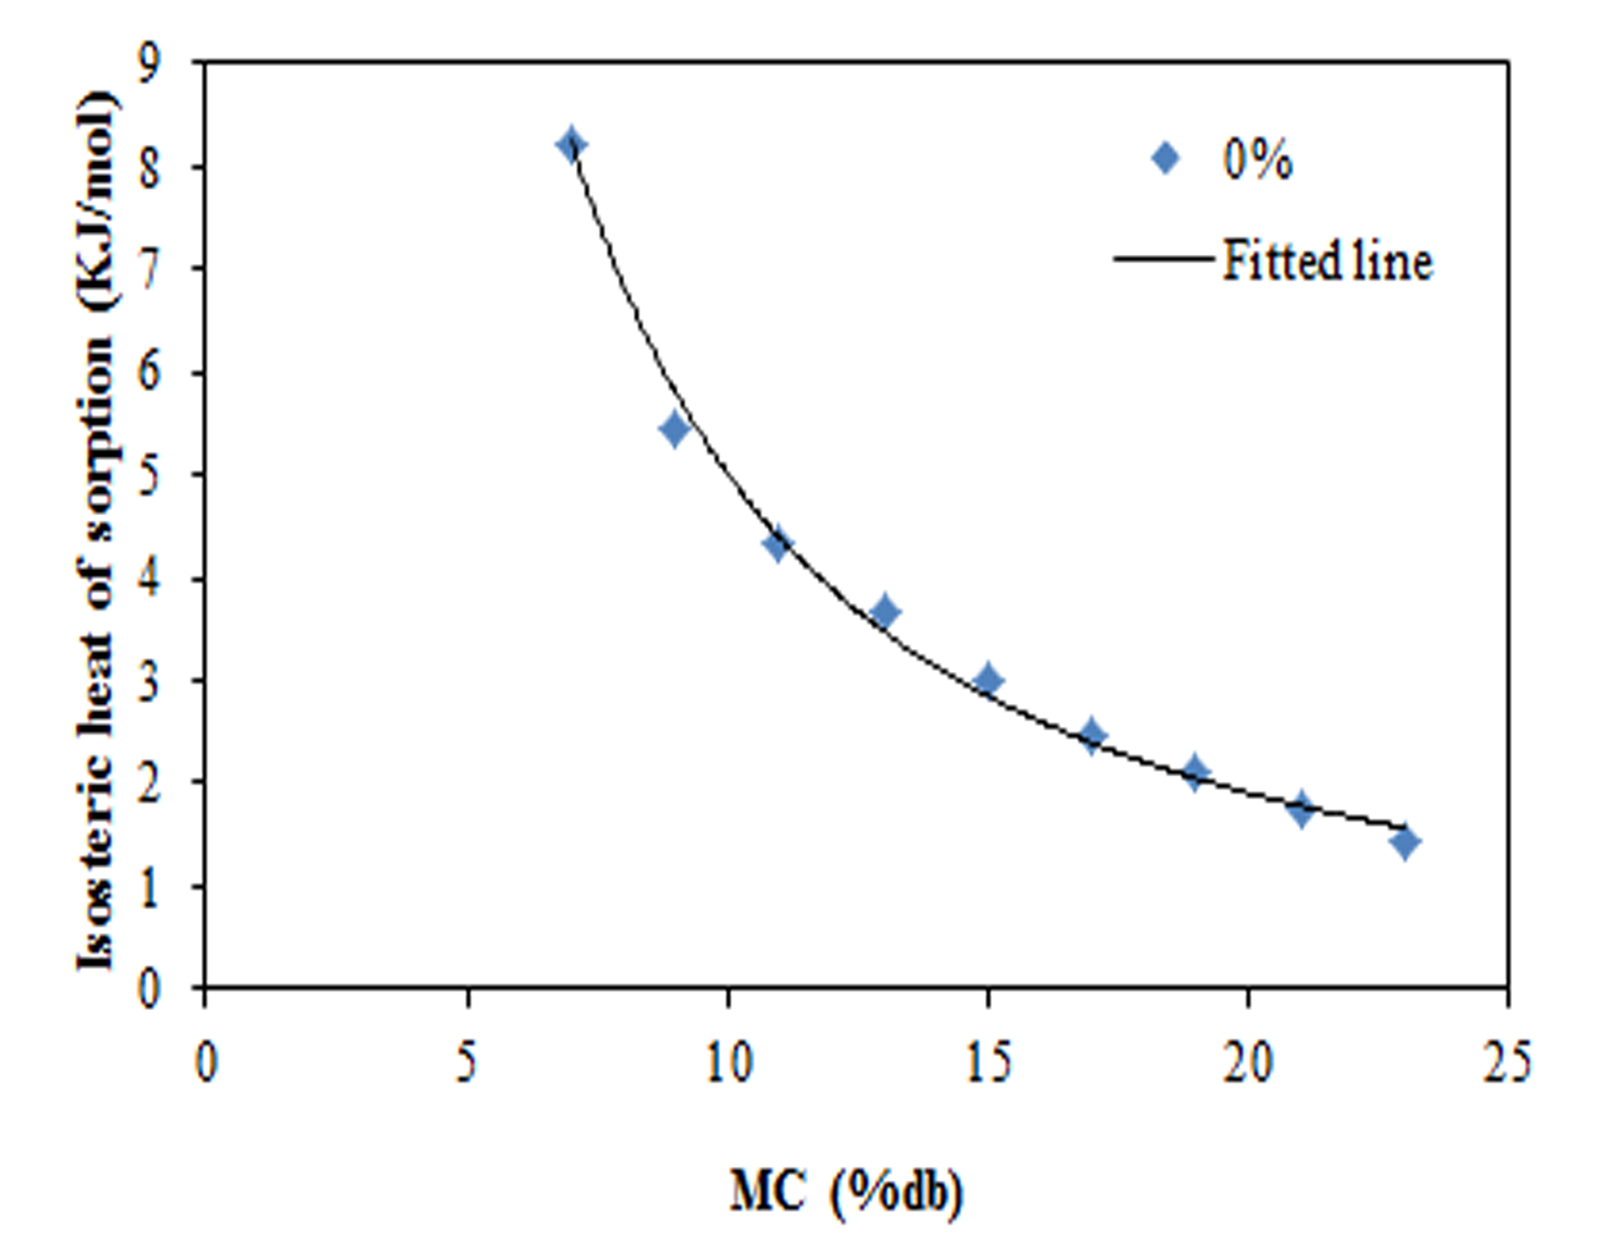
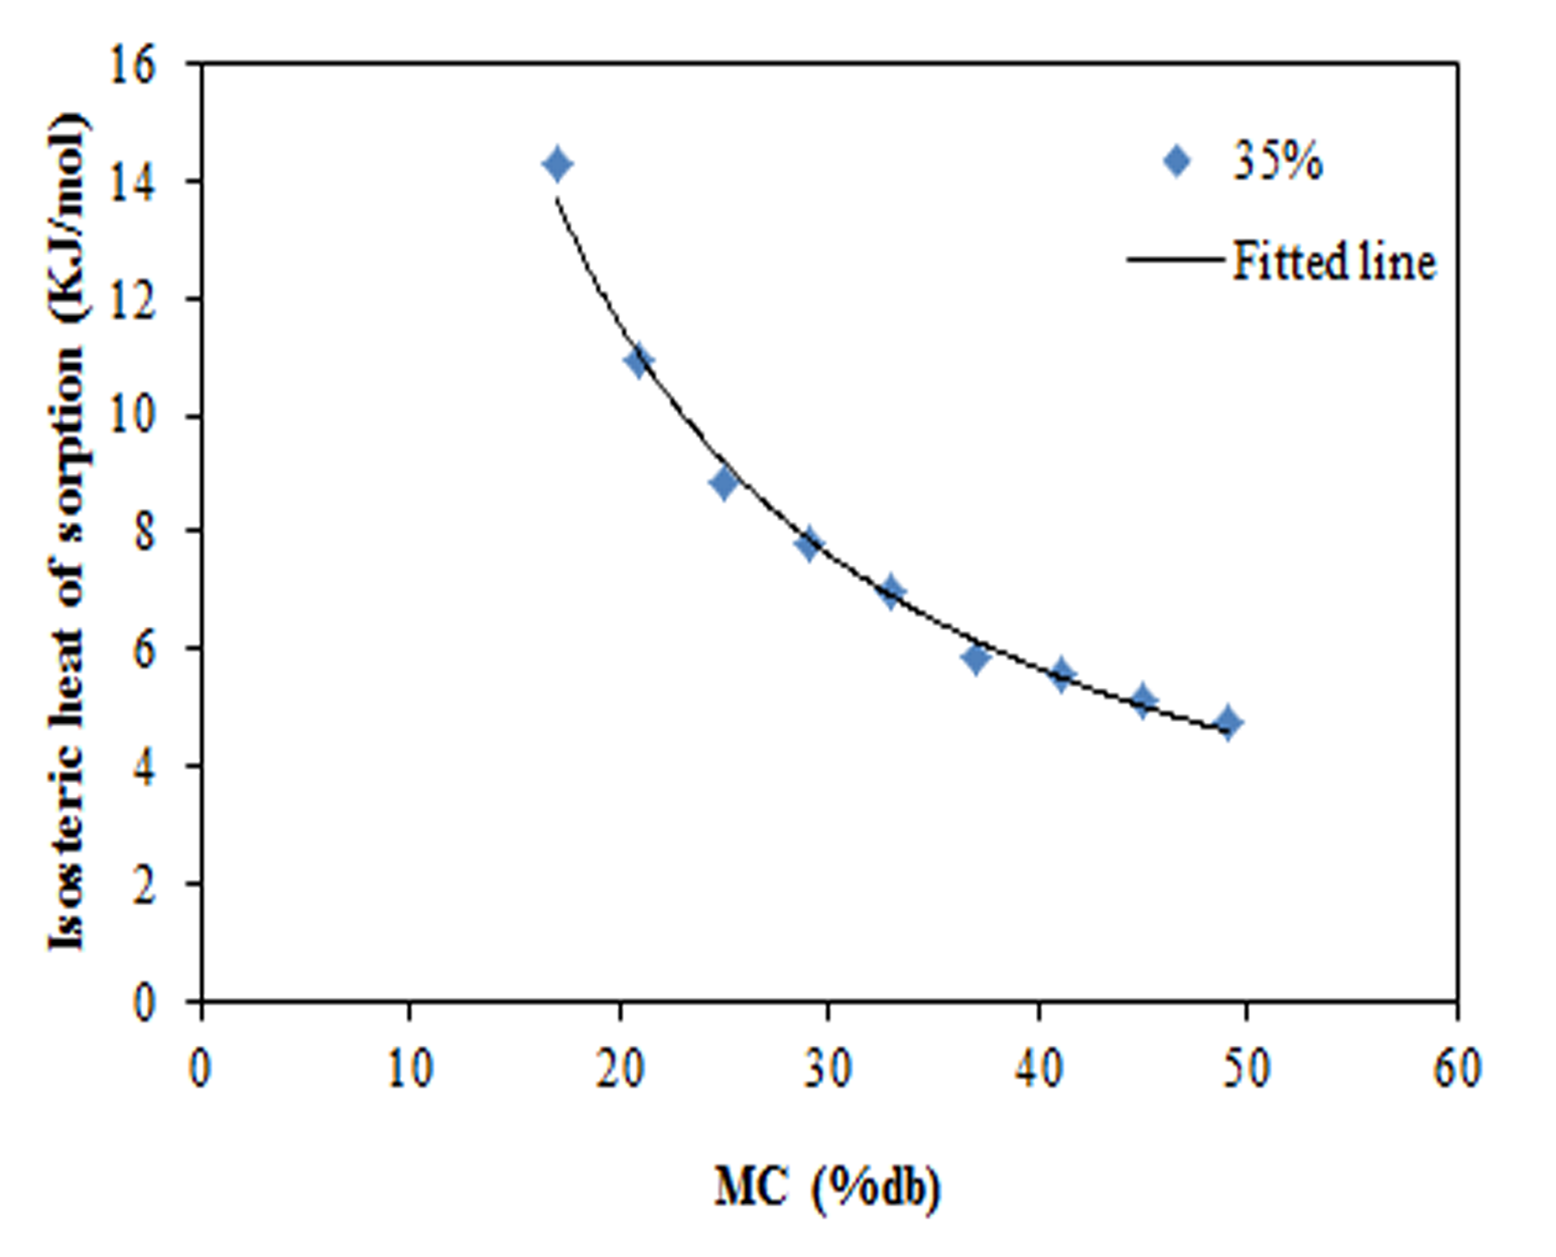
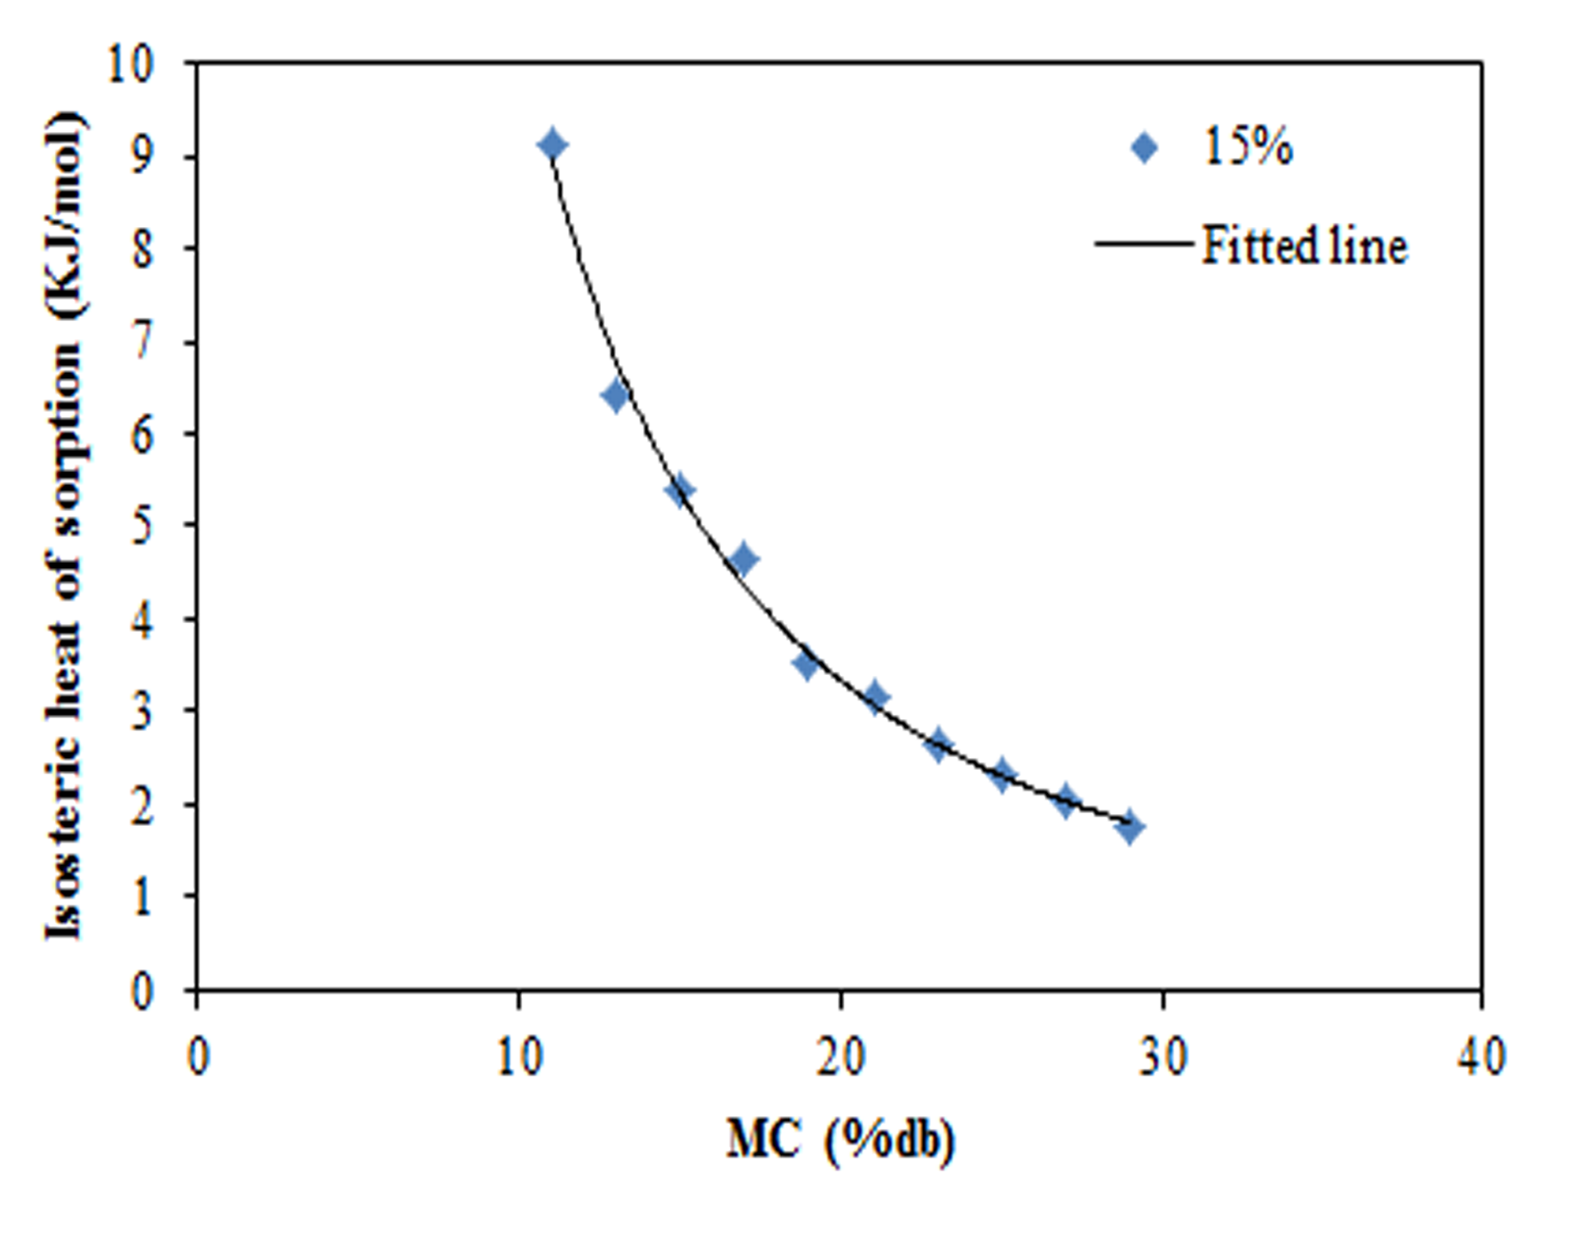
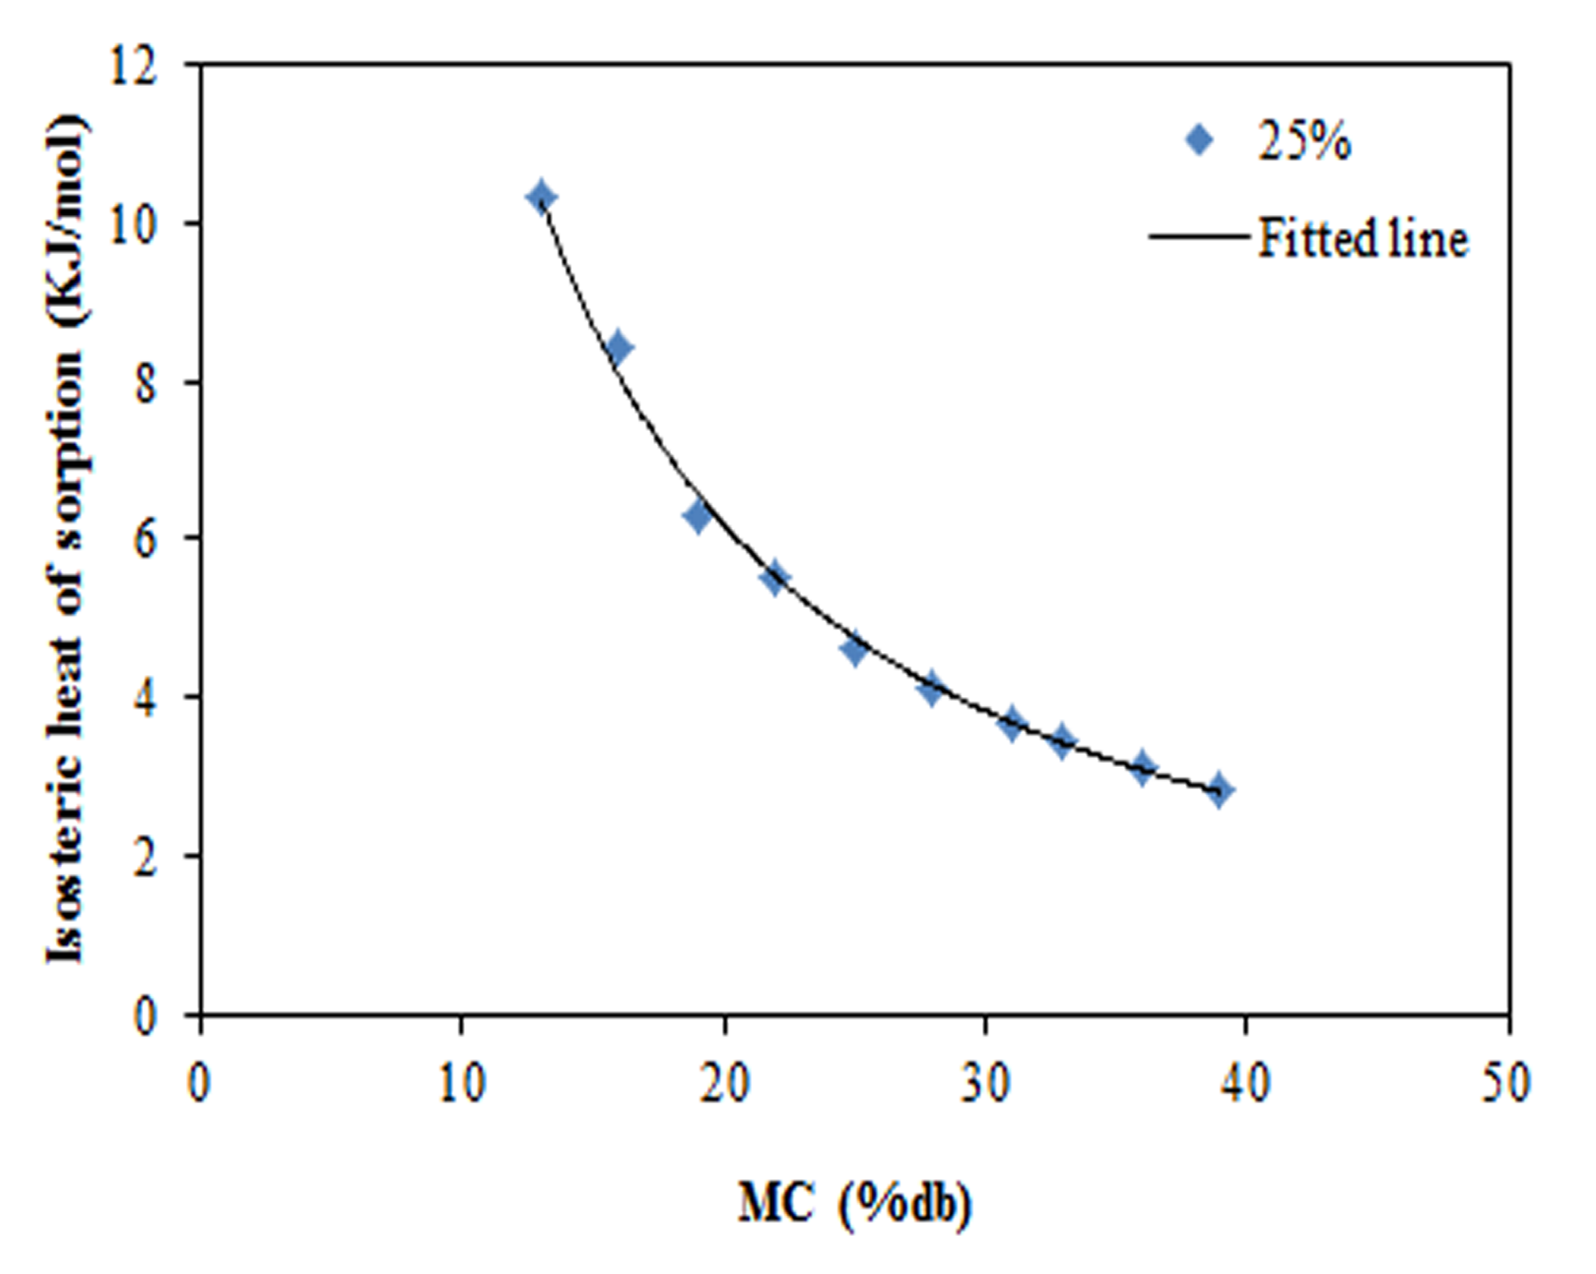
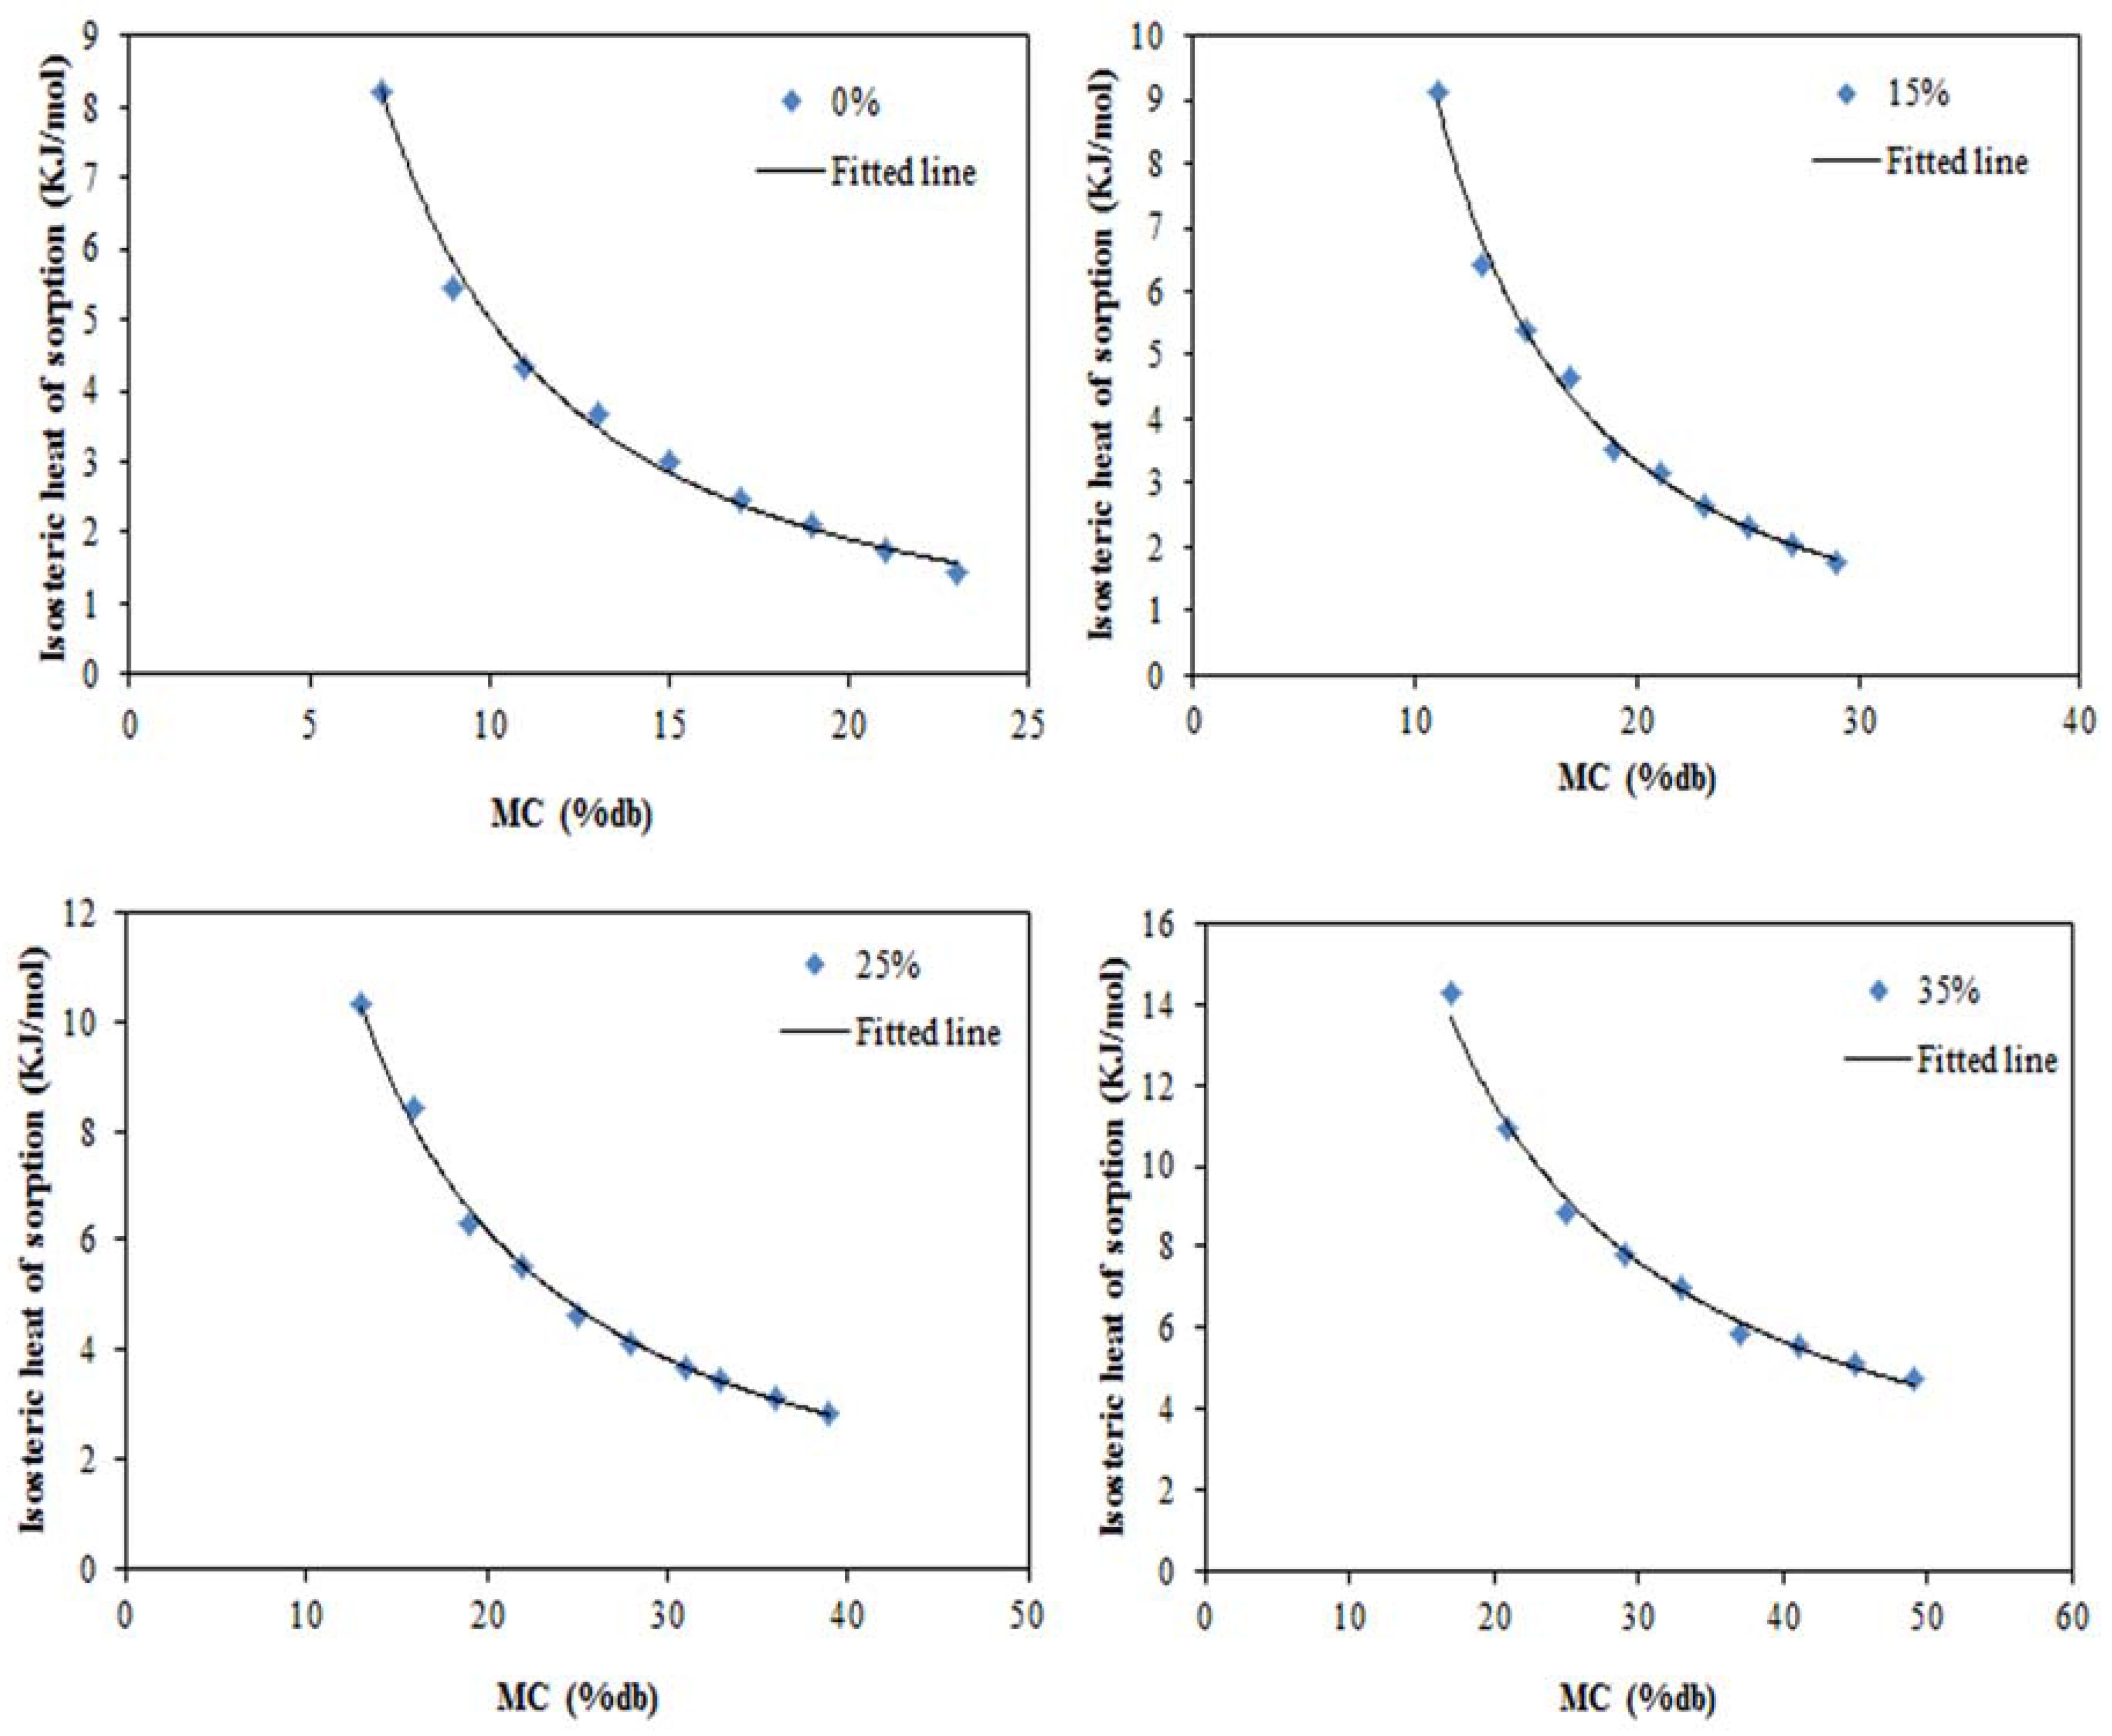
3.3. Net Isosteric Heat of Sorption

The net isoteric heat of sorption examined by applying the Clasusius–Clapeyron equation for pea starch films is exhibited in Figure 5. The net isoteric heat of sorption ( q n s ) , values were calculated from the slope of the plot between the values of ln(aw) and 1/T at a specific moisture content. It can be seen that the heat of sorption showed similar trend for all pea starch films. The isosteric heat is dependent on moisture content and on the energy required for sorption [55]. The amount of required energy to remove water from the solid is considered the isosteric heat of sorption, so the more tightly the water is bound, the higher is the isosteric heat of sorption [56]. The high value of the isosteric heat of sorption is a sign of the intermolecular attractive forces between the sorption sites and the water vapor at low moisture contents; this heat reduces with increase in the moisture contents [27]. At low moisture content, sorption happens on the most active sites, hydrophilic groups, while water molecules bind with less active site in higher moisture content resulting in lower isosteric heats of sorption [57,58]. The decreasing of net isosteric sorption heat with moisture content could be also associated with the interaction energy of water molecules with surface, which is decreased when coverage level of the surface is increased [59]. The net isosteric heat of sorption ranged from 8.23 kJ/mol at moisture content of 0.07 g/g dry matter to 1.43 kJ/mol at a moisture content of 0.27 g/g dry matter for control film and the corresponding value for pea starch film with 35% glycerol was 14.26 kJ/mol at moisture content of 0.17 g/g dry matter and 4.22 kJ/mol at moisture content of 0.49 g/g dry matter. The reducing behavior of the isosteric heat of sorption with increasing moisture content has been also reported in other starchy products [22,26,60,61]. The incorporation of glycerol increased the binding energy between water and the film surface led to increasing the isosteric heat of sorption. The isosteric heats versus moisture content results are sufficiently represented as power function of moisture content as follows:
Pea starch film :   q n s = 124.77 M e 1.398 ,   R 2 = 0.9912
Pea starch film + 15 %  glycerol :   q n s = 472.69 M e 1.653 ,   R 2 = 0.9957
Pea starch film + 25 %  glycerol :   q n s = 213.07 M e 1.181 ,   R 2 = 0.9972
Pea starch film + 35 %  glycerol :   q n s = 252.35 M e 1.029 ,   R 2 = 0.9942
Figure 5. Net isosteric heat of sorption of pea starch films as a function of MC: 0% is pea starch film, 15% is pea starch film content 15% w/w glycerol, 25% is pea starch film content 25% w/w glycerol, and 35% is pea starch film content 35% w/w glycerol.
Foods 05 00001 g005
These mathematical relationships may be used to calculate the heat of sorption of pea starch films for various moisture contents.

4. Conclusions

The moisture sorption of the pea starch films increased with increasing water activity at different temperatures (5, 15, 25, and 40 °C) and represented a Type III isotherm. The equilibrium moisture content and monolayer moisture contents (m0) reduced with increases in storage temperature at constant water activity. The results showed that the glycerol concentration had a significant effect on equilibrium moisture content and monolayer moisture content (m0) of films. Sorption isotherm studies, with data fitted to theoretical, kinetic, semi-empirical and empirical models, showed that high correlation coefficient of determination (R2) and the lowest average relative percentage deviation modulus (Me) were obtained from the Lewicki model indicating that it fits the best to the experimental data followed by Ferro–Fontan and Peleg equations for all films, at all temperatures, in the whole range of water activity. The net isosteric heat of sorption of the films was measured. It was found that this heat changed inversely with variation in the amount of the absorbed moisture. These fundamental data are important in assessing applicability of starch-based edible films in food and pharmaceutical industries, due to the influence of moisture content on water vapor permeability, physical and mechanical properties of starch-based edible films.

Acknowledgments

This study was funded by the University of Newcastle, NSW Australia.

Author Contributions

Bahareh Saberi, Quan V. Vuong, Suwimol Chockchaisawasdee, John B. Golding, Christopher J. Scarlett and Costas E. Stathopoulos designed the study. Bahareh Saberi, Quan V. Vuong, Suwimol Chockchaisawasdee, John B. Golding, Christopher J. Scarlett and Costas E. Stathopoulos analyzed and interpreted the results. All Authors prepared and approved the final version of the manuscript.

Conflicts of Interest

The authors declare no conflict of interest.

References

  1. Baldwin, E.A.; Nisperos-Carriedo, M.O.; Baker, R.A. Use of edible coatings to preserve quality of lightly (and slightly) processed products. Crit. Rev. Food Sci. Nutr. 1995, 35, 509–524. [Google Scholar] [CrossRef] [PubMed]
  2. Park, H.J. Development of advanced edible coatings for fruits. Trends Food Sci. Technol. 1999, 10, 254–260. [Google Scholar] [CrossRef]
  3. Jagadish, R.S.; Raj, B. Properties and sorption studies of polyethylene oxide-starch blended films. Food Hydrocoll. 2011, 25, 1572–1580. [Google Scholar] [CrossRef]
  4. Rachtanapun, P.; Tongdeesoontorn, W. Effect of naoh concentration on sorption isotherm of carboxymethyl rice starch films and prediction mmodels. Chiang Mai J. Sci. 2011, 38, 380–388. [Google Scholar]
  5. Chowdhury, T.; Das, M. Moisture sorption isotherm and isosteric heat of sorption of edible films made from blends of starch, amylose and methyl cellulose. Int. Food Res. J. 2012, 19, 669–1678. [Google Scholar]
  6. Kaymak-Ertekin, F.; Gedik, A. Sorption isotherms and isosteric heat of sorption for grapes, apricots, apples and potatoes. LWT Food Sci. Technol. 2004, 37, 429–438. [Google Scholar] [CrossRef]
  7. Van Soest, J.J.G.; Benes, K.; de Wit, D. The influence of acid hydrolysis of potato starch on the stress-strain propoerties of thermoplastic starch. Starch Stärke 1995, 47, 429–434. [Google Scholar] [CrossRef]
  8. Duckworth, R.B. Future needs in water sorption in food stuffs. In Physical Properties of Foods; Jowitt, R., Escher, F., Hallstrom, B., Mefert, H., Spiess, W., Vos, G., Eds.; Elsevier Applied Science: London, UK, 1983; pp. 93–102. [Google Scholar]
  9. Rizvi, S.S.H. Thermodynamics of foods in dehydration. In Engineering Properties of Food; Rao, M., Rizvi, S., Eds.; Marcel Dekker: New York, NY, USA, 1986; pp. 133–214. [Google Scholar]
  10. Sebti, I.; Delves-Broughton, J.; Coma, V. Physicochemical properties and bioactivity of nisin-containing cross-linked hydroxypropylmethylcellulose films. J. Agric. Food Chem. 2003, 51, 6468–6474. [Google Scholar] [CrossRef] [PubMed]
  11. Talja, R.A.; Helén, H.; Roos, Y.H.; Jouppila, K. Effect of various polyols and polyol contents on physical and mechanical properties of potato starch-based films. Carbohydr. Polym. 2007, 67, 288–295. [Google Scholar] [CrossRef]
  12. Talja, R.A.; Helén, H.; Roos, Y.H.; Jouppila, K. Effect of type and content of binary polyol mixtures on physical and mechanical properties of starch-based edible films. Carbohydr. Polym. 2008, 71, 269–276. [Google Scholar] [CrossRef]
  13. Myllärinen, P.; Partanen, R.; Seppälä, J.; Forssell, P. Effect of glycerol on behaviour of amylose and amylopectin films. Carbohydr. Polym. 2002, 50, 355–361. [Google Scholar] [CrossRef]
  14. Galdeano, M.C.; Mali, S.; Grossmann, M.V.E.; Yamashita, F.; García, M.A. Effects of plasticizers on the properties of oat starch films. Mater. Sci. Eng. C 2009, 29, 532–538. [Google Scholar] [CrossRef]
  15. Mali, S.; Sakanaka, L.S.; Yamashita, F.; Grossmann, M.V.E. Water sorption and mechanical properties of cassava starch films and their relation to plasticizing effect. Carbohydr. Polym. 2005, 60, 283–289. [Google Scholar] [CrossRef]
  16. Müller, C.M.O.; Yamashita, F.; Laurindo, J.B. Evaluation of the effects of glycerol and sorbitol concentration and water activity on the water barrier properties of cassava starch films through a solubility approach. Carbohydr. Polym. 2008, 72, 82–87. [Google Scholar] [CrossRef]
  17. Cervera, M.F.; Karjalainen, M.; Airaksinen, S.; Rantanen, J.; Krogars, K.; Heinamaki, J.; Colarte, A.I.; Yliruusi, J. Physical stability and moisture sorption of aqueous chitosan-amylose starch films plasticized with polyols. Eur. J. Pharm. Biopharm. 2004, 58, 69–76. [Google Scholar] [CrossRef] [PubMed]
  18. Zhang, Y.; Han, J.H. Sorption isotherm and plasticization effect of moisture and plasticizers in pea starch film. J. Food Sci. 2008, 73, E313–E324. [Google Scholar] [CrossRef] [PubMed]
  19. Farahnaky, A.; Saberi, B.; Majzoobi, M. Effect of glycerol on physical and mechanical properties of wheat starch edible films. J. Texture Stud. 2013, 44, 176–186. [Google Scholar] [CrossRef]
  20. Labuza, T.P.; Kaanane, A.; Chen, J.Y. Effect of temperature on the moisture sorption isotherms and water activity shift of two dehydrated foods. J. Food Sci. 1985, 50, 385–392. [Google Scholar] [CrossRef]
  21. Rizvi, S.S.H. Thermodynamic properties of foods in dehydration. In Engineering Properties of Foods; Rao, A., Rizvi, S.S.H., Datta, A.K., Eds.; CRC: Boca Raton, FL, USA, 2005. [Google Scholar]
  22. Al-Muhtaseb, A.H.; McMinn, W.A.M.; Magee, T.R.A. Water sorption isotherms of starch powders: Part 1: Mathematical description of experimental data. J. Food Eng. 2004, 61, 297–307. [Google Scholar] [CrossRef]
  23. McMinn, W.A.M.; Al-Muhtaseb, A.A.; Magee, T.R.A. Assessment of two- and three-parameter lewicki models for description of sorption phenomena of starch materials. J. Sci. Food Agric. 2004, 84, 1695–1700. [Google Scholar] [CrossRef]
  24. Suppakul, P.; Chalernsook, B.; Ratisuthawat, B.; Prapasitthi, S.; Munchukangwan, N. Empirical modeling of moisture sorption characteristics and mechanical and barrier properties of cassava flour film and their relation to plasticizing-antiplasticizing effects. LWT Food Sci. Technol. 2013, 50, 290–297. [Google Scholar] [CrossRef]
  25. Perdomo, J.; Cova, A.; Sandoval, A.J.; García, L.; Laredo, E.; Müller, A.J. Glass transition temperatures and water sorption isotherms of cassava starch. Carbohydr. Polym. 2009, 76, 305–313. [Google Scholar] [CrossRef]
  26. Brett, B.; Figueroa, M.; Sandoval, A.J.; Barreiro, J.A.; Müller, A.J. Moisture sorption characteristics of starchy products: Oat flour and rice flour. Food Biophys. 2009, 4, 151–157. [Google Scholar] [CrossRef]
  27. Bennaceur, S.; Draoui, B.; Touati, B.; Benseddik, A.; Saad, A.; Bennamoun, L. Determination of the moisture-sorption isotherms and isosteric heat of henna leaves. J. Eng. Phys. Thermophys. 2015, 88, 52–62. [Google Scholar] [CrossRef]
  28. Al-Muhtaseb, A.H.; McMinn, W.A.M.; Magee, T.R.A. Moisture sorption isotherm characteristics of food products: A review. Food Bioprod. Process. 2002, 80, 118–128. [Google Scholar] [CrossRef]
  29. Enyinnaya Chinma, C.; Chukwuma Ariahu, C.; Alakali, J. Moisture sorption and thermodynamic properties of cassava starch and soy protein concentrate based edible films. Int. J. Food Sci. Technol. 2013, 48, 2400–2407. [Google Scholar] [CrossRef]
  30. Coupland, J.N.; Shaw, N.B.; Monahan, F.J.; Dolores O’Riordan, E.; O’Sullivan, M. Modeling the effect of glycerol on the moisture sorption behavior of whey protein edible films. J. Food Eng. 2000, 43, 25–30. [Google Scholar] [CrossRef]
  31. Chen, C.H.; Kuo, W.S.; Lai, L.S. Rheological and physical characterization of film-forming solutions and edible films from tapioca starch/decolorized hsian-tsao leaf gum. Food Hydrocoll. 2009, 23, 2132–2140. [Google Scholar] [CrossRef]
  32. Shih, F.F.; Daigle, K.W.; Champagne, E.T. Effect of rice wax on water vapour permeability and sorption properties of edible pullulan films. Food Chem. 2011, 127, 118–121. [Google Scholar] [CrossRef]
  33. Ayadi, F.; Dole, P. Stoichiometric interpretation of thermoplastic starch water sorption and relation to mechanical behavior. J. Food Eng. 2011, 84, 872–880. [Google Scholar] [CrossRef]
  34. Godbillot, L.; Dole, P.; Joly, C.; Rogé, B.; Mathlouthi, M. Analysis of water binding in starch plasticized films. Food Chem. 2006, 96, 380–386. [Google Scholar] [CrossRef]
  35. Liu, Z. Edible films and coatings from starches. In Innovations in Food Packaging; Han, J., Ed.; Elsevier Science: London, UK, 2005; pp. 318–338. [Google Scholar]
  36. Urquhart, A.R. Sorption of water by cellulose and starch. In Recent Advances in the Chemistry of Cellulose and Starch; Honeyman, J., Ed.; Heywood & Company: London, UK, 1959; pp. 240–264. [Google Scholar]
  37. Flores, S.; Famá, L.; Rojas, A.M.; Goyanes, S.; Gerschenson, L. Physical properties of tapioca-starch edible films: Influence of filmmaking and potassium sorbate. Food Res. Int. 2007, 40, 257–265. [Google Scholar] [CrossRef]
  38. Famá, L.; Rojas, A.M.; Goyanes, S.; Gerschenson, L. Mechanical properties of tapioca-starch edible films containing sorbates. LWT Food Sci. Technol. 2005, 38, 631–639. [Google Scholar] [CrossRef]
  39. Cerqueira, M.A.; Souza, B.W.S.; Teixeira, J.A.; Vicente, A.A. Effect of glycerol and corn oil on physicochemical properties of polysaccharide films—A comparative study. Food Hydrocoll. 2012, 27, 175–184. [Google Scholar] [CrossRef] [Green Version]
  40. Kowalczyk, D.; Kordowska-Wiater, M.; Sołowiej, B.; Baraniak, B. Physicochemical and antimicrobial properties of biopolymer-candelilla wax emulsion films containing potassium sorbate—A comparative study. Food Bioprocess Technol. 2015, 8, 567–579. [Google Scholar] [CrossRef]
  41. Zhang, Y.; Han, J.H. Plasticization of pea starch films with monosaccharides and polyols. J. Food Sci. 2006, 71, E253–E261. [Google Scholar] [CrossRef]
  42. Strauss, U.P.; Porcja, R.J.; Chen, Y. Volume effects of starch water interactions. In Water Relationships in Foods; Levine, H., Slade, L., Eds.; Plenum Press: New York, NY, USA, 1991; pp. 351–364. [Google Scholar]
  43. Mali, S.; Grossmann, M.V.E.; García, M.A.; Martino, M.N.; Zaritzky, N.E. Effects of controlled storage on thermal, mechanical and barrier properties of plasticized films from different starch sources. J. Food Eng. 2006, 75, 453–460. [Google Scholar] [CrossRef]
  44. Palipane, K.B.; Driscoll, R.H. Moisture sorption characteristics of in-shell macadamia nuts. J. Food Eng. 1993, 18, 63–76. [Google Scholar] [CrossRef]
  45. Su, J.F.; Huang, Z.; Zhao, Y.H.; Yuan, X.Y.; Wang, X.Y.; Li, M. Moisture sorption and water vapor permeability of soy protein isolate/poly(vinyl alcohol)/glycerol blend films. Ind. Crop. Prod. 2010, 31, 266–276. [Google Scholar] [CrossRef]
  46. Peng, G.; Chen, X.; Wu, W.; Jiang, X. Modeling of water sorption isotherm for corn starch. J. Food Eng. 2007, 80, 562–567. [Google Scholar] [CrossRef]
  47. Talla, A. Predicting sorption isotherms and net isosteric heats of sorption of maize grains at different temperatures. Int. J. Food Eng. 2014, 10, 393–401. [Google Scholar] [CrossRef]
  48. Brunauer, S.; Emmett, P.H.; Teller, E. Adsorption of gases in multimolecular layers. J. Am. Chem. Soc. 1938, 60, 309–319. [Google Scholar] [CrossRef]
  49. Enrione, J.I.; Hill, S.E.; Mitchell, J.R. Sorption behavior of mixtures of glycerol and starch. J. Agric. Food Chem. 2007, 55, 2956–2963. [Google Scholar] [CrossRef] [PubMed]
  50. Chatakanonda, P.; Dickinson, L.C.; Chinachoti, P. Mobility and distribution of water in cassava and potato starches by 1 H and 2 H NMR. J. Agric. Food Chem. 2003, 51, 7445–7449. [Google Scholar] [CrossRef] [PubMed]
  51. Mishra, S.; Rai, T. Morphology and functional properties of corn, potato and tapioca starches. Food Hydrocoll. 2006, 20, 557–566. [Google Scholar] [CrossRef]
  52. Timmermann, E.O.; Chirife, J.; Iglesias, H.A. Water sorption isotherms of foods and foodstuffs: Bet or gab parameters? J. Food Eng. 2001, 48, 19–31. [Google Scholar] [CrossRef]
  53. Tongdeesoontorn, W.; Mauer, L.J.; Wongruong, S.; Rachtanapun, P. Water vapour permeability and sorption isotherms of cassava starch based films blended with gelatin and carboxymethyl cellulose. Asian J. Food Agro Ind. 2009, 2, 501–514. [Google Scholar]
  54. Turhan, M.; Sayar, S.; Gunasekaran, S. Application of peleg model to study water absorption in chickpea during soaking. J. Food Eng. 2002, 53, 153–159. [Google Scholar] [CrossRef]
  55. Yazdani, M.; Sazandehchi, P.; Azizi, M.; Ghobadi, P. Moisture sorption isotherms and isosteric heat for pistachio. Eur. Food Res. Technol. 2006, 223, 577–584. [Google Scholar] [CrossRef]
  56. Cadden, A.M. Moisture sorption characteristics of several food fibers. J. Food Sci. 1988, 53, 1150–1155. [Google Scholar] [CrossRef]
  57. Jayendra Kumar, A.; Singh, R.R.B.; Patil, G.R.; Patel, A.A. Effect of temperature on moisture desorption isotherms of kheer. LWT Food Sci. Technol. 2005, 38, 303–310. [Google Scholar] [CrossRef]
  58. Iglesias, H.A.; Chirife, J. Equilibrium moisture contents of air dried beef. Dependence on drying temperature. Int. J. Food Sci. Technol. 1976, 11, 565–573. [Google Scholar] [CrossRef]
  59. Bahloul, N.; Boudhrioua, N.; Kechaou, N. Moisture desorption-adsorption isotherms and isosteric heats of sorption of tunisian olive leaves (olea europaea L.). Ind. Crop. Prod. 2008, 28, 162–176. [Google Scholar] [CrossRef]
  60. Palou, E.; López-Malo, A.; Argaiz, A. Effect of temperature on the moisture sorption isotherms of some cookies and corn snacks. J. Food Eng. 1997, 31, 85–93. [Google Scholar] [CrossRef]
  61. Samapundo, S.; Devlieghere, F.; Meulenaer, B.D.; Atukwase, A.; Lamboni, Y.; Debevere, J.M. Sorption isotherms and isosteric heats of sorption of whole yellow dent corn. J. Food Eng. 2007, 79, 168–175. [Google Scholar] [CrossRef]

