
The Lipidic and Volatile Components of Coffee Pods and Capsules Packaged in an Alternative Multilayer Film

 , ,
, ,  and
and
Abstract
:
1. Introduction
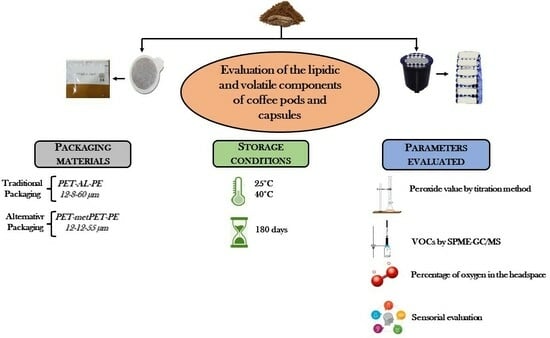
2. Materials and Methods
2.1. Chemicals
2.2. Samples
- -
- Polyethylene terephthalate at 12 microns, aluminum at 8 microns, and polyethylene at 60 microns (PET-AL-PE) with an Oxygen Transmission Rate (OTR) of <1.0 and 99 g/m2 grammage.
- -
- Polyethylene terephthalate at 12 microns, Metallized Polyethylene Terephthalate at 12 microns, and polyethylene of 55 microns thick (PET-MPET-PE) with an OTR of <1.5 and 90 g/m2 grammage.
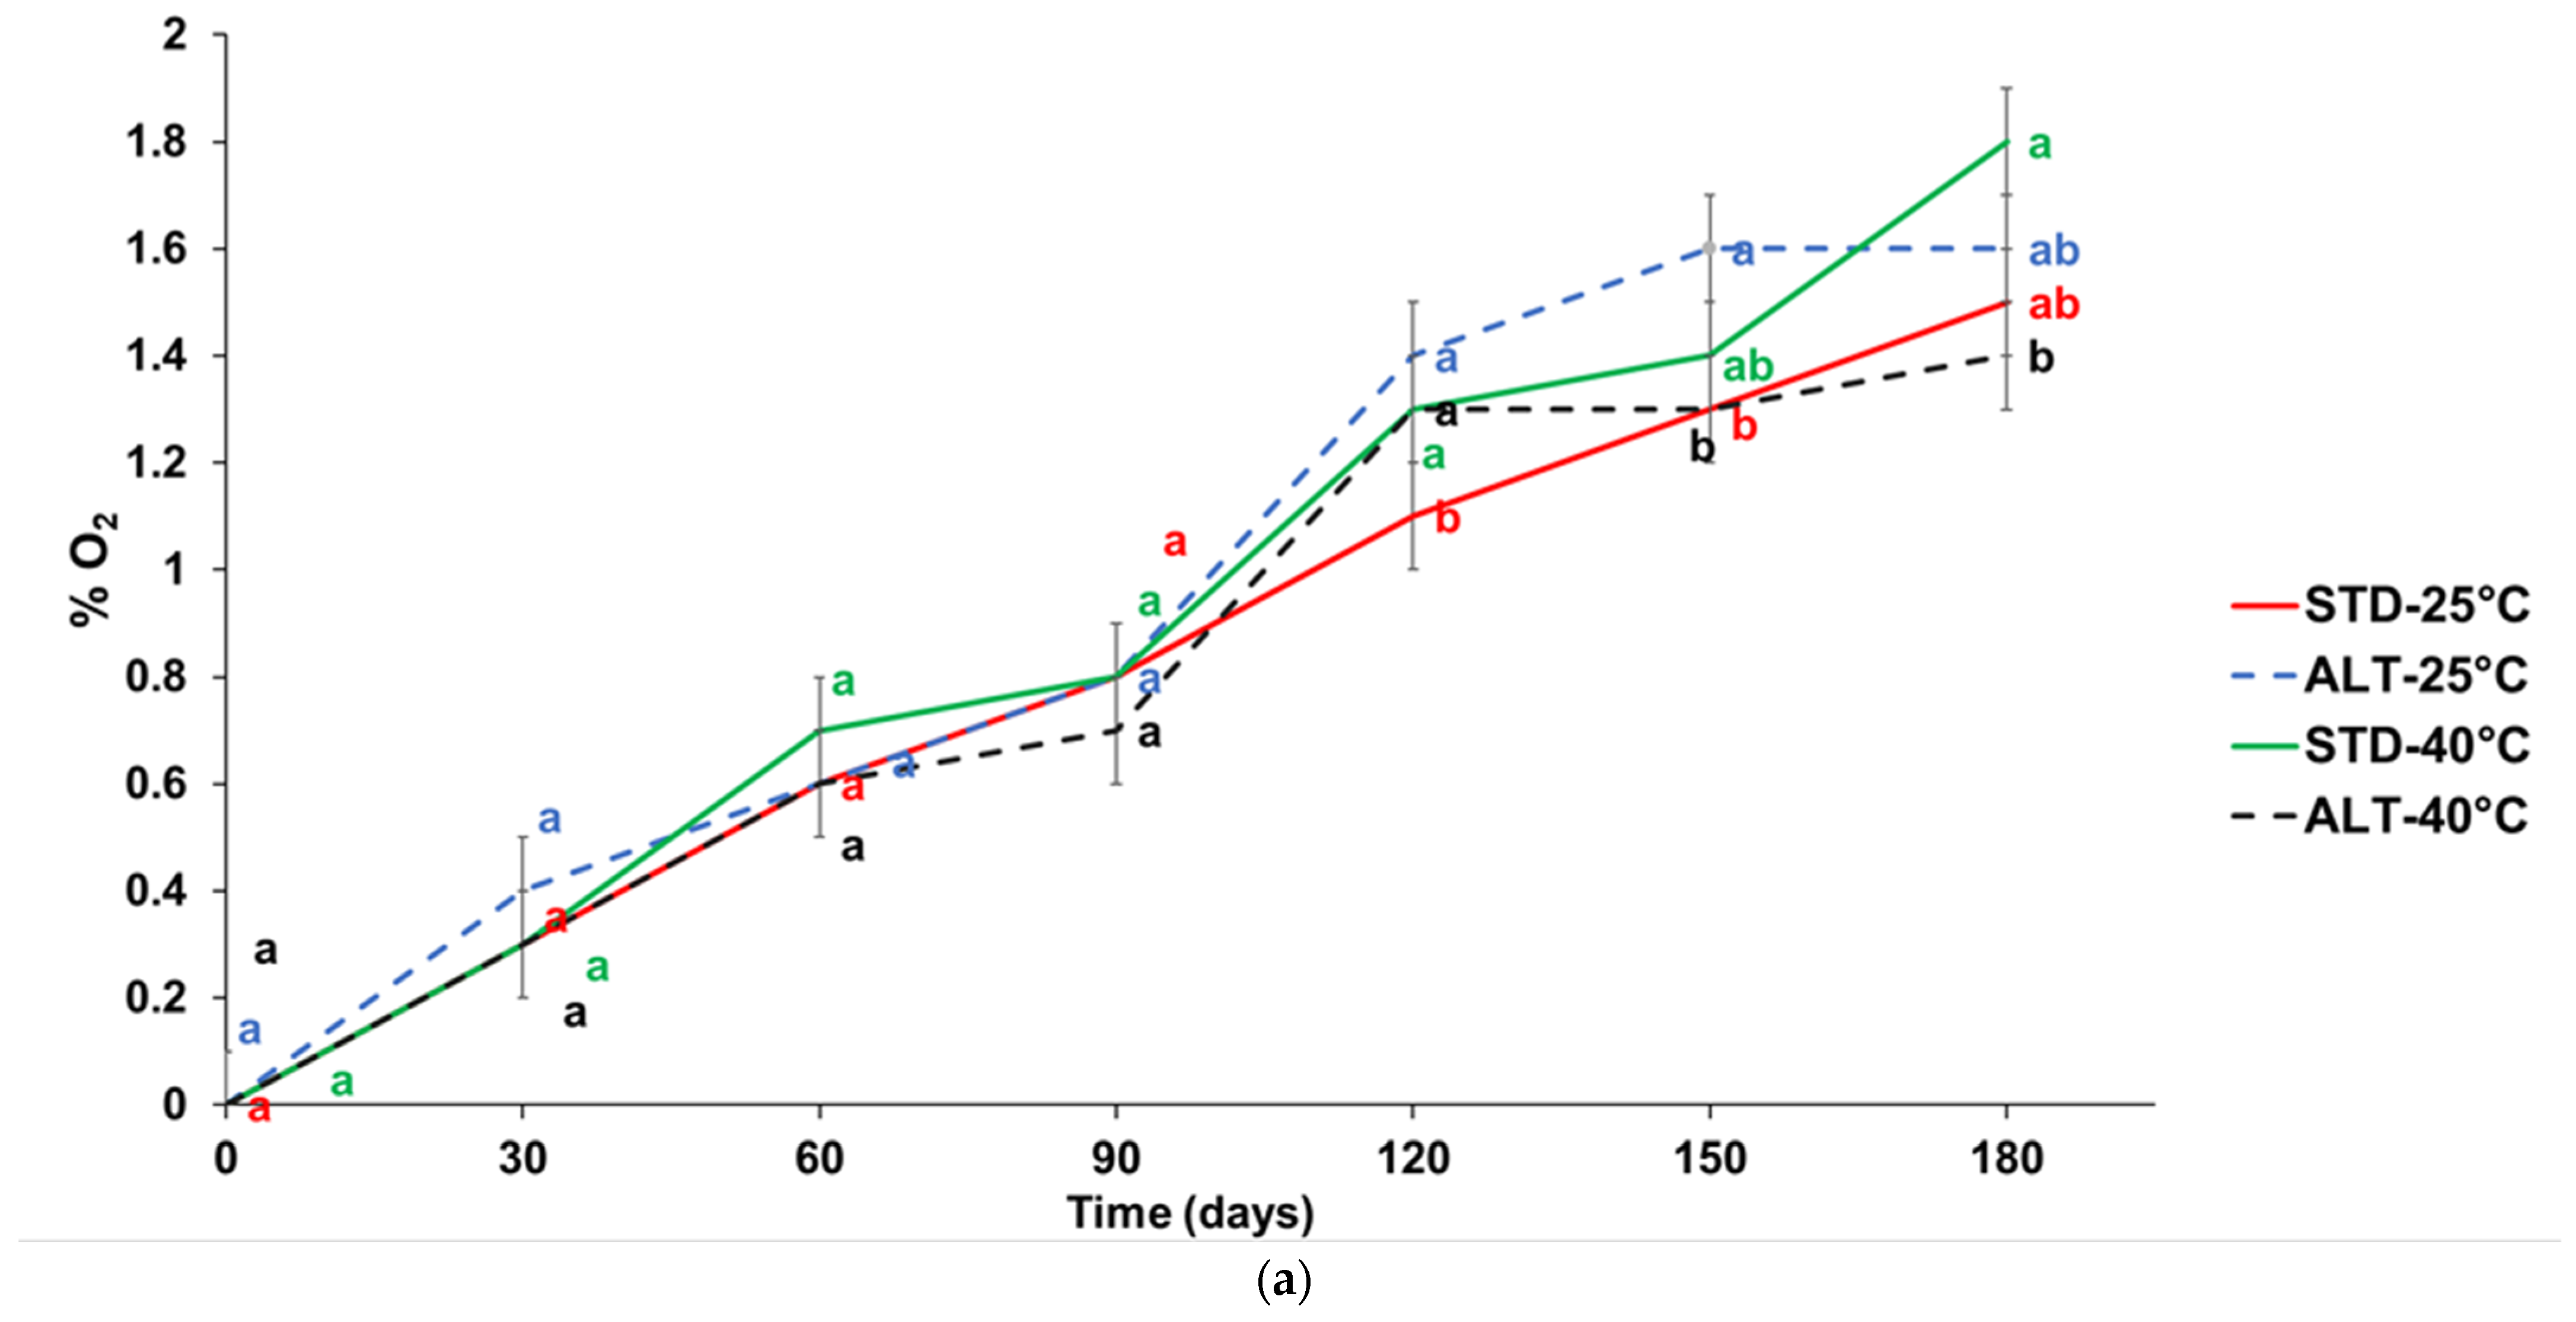
2.3. Evaluation of Oxygen Percentage during Shelf Life
2.4. Moisture Content
2.5. Fat Extraction
2.6. Peroxide Value
2.7. Volatile Organic Compounds
2.8. Sensory Evaluation
2.9. Statistical Analysis
3. Results
3.1. Percentage of Oxygen in the Headspace during Shelf Life
3.2. Moisture Content
3.3. Fat Yield
3.4. Peroxide Values
3.5. Volatile Organic Compounds
3.6. Sensory Evaluation
4. Conclusions
Author Contributions
Funding
Institutional Review Board Statement
Informed Consent Statement
Data Availability Statement
Conflicts of Interest
References
- Greco, G.; Núñez-Carmona, E.; Abbatangelo, M.; Fava, P.; Sberveglieri, V. How Coffee Capsules Affect the Volatilome in Espresso Coffee. Separations 2021, 8, 248. [Google Scholar] [CrossRef]
- Cincotta, F.; Tripodi, G.; Merlino, M.; Verzera, A.; Condurso, C. Variety and Shelf-Life of Coffee Packaged in Capsules. LWT 2020, 118, 108718. [Google Scholar] [CrossRef]
- Hicks, A.L. Environmental Implications of Consumer Convenience: Coffee as a Case Study. J. Ind. Ecol. 2018, 22, 79–91. [Google Scholar] [CrossRef]
- Robertson, G.L. Food Packaging and Shelf Life: A Practical Guide; CRC Press: Boca Raton, FL, USA, 2009. [Google Scholar]
- Nicoli, M.C.; Manzocco, L.; Calligaris, S. 11 Packaging and the Shelf Life of Coffee. Food Packag. Shelf Life 2010, 199. [Google Scholar]
- De Monte, M.; Padoano, E.; Pozzetto, D. Alternative Coffee Packaging: An Analysis from a Life Cycle Point of View. J. Food Eng. 2005, 66, 405–411. [Google Scholar] [CrossRef]
- Garrido-López, Á.; Tena, M.T. Study of Multilayer Packaging Delamination Mechanisms Using Different Surface Analysis Techniques. Appl. Surf. Sci. 2010, 256, 3799–3805. [Google Scholar] [CrossRef]
- Bayus, J.; Ge, C.; Thorn, B. A Preliminary Environmental Assessment of Foil and Metallized Film Centered Laminates. Resour. Conserv. Recycl. 2016, 115, 31–41. [Google Scholar] [CrossRef]
- Licciardello, F. Packaging, Blessing in Disguise. Review on Its Diverse Contribution to Food Sustainability. Trends Food Sci. Technol. 2017, 65, 32–39. [Google Scholar] [CrossRef]
- Licciardello, F.; Piergiovanni, L. 6—Packaging and Food Sustainability. In The Interaction of Food Industry and Environment; Galanakis, C., Ed.; Academic Press: Cambridge, MA, USA, 2020; pp. 191–222. [Google Scholar] [CrossRef]
- ICO. International Coffee Organization. Coffee Report and Outlook 24 2023. Available online: https://icocoffee.org/documents/cy2023-24/Coffee_Report_and_Outlook_December_2023_ICO.pdf (accessed on 21 February 2024).
- Abubakar, Y.; Gemasih, T.; Muzaifa, M.; Hasni, D.; Sulaiman, M.I. Effect of Blend Percentage and Roasting Degree on Sensory Quality of Arabica-Robusta Coffee Blend. IOP Conf. Ser. Earth Environ. Sci. 2020, 425, 012081. [Google Scholar] [CrossRef]
- Campuzano-Duque, L.F.; Herrera, J.C.; Ged, C.; Blair, M.W. Bases for the Establishment of Robusta Coffee (Coffea Canephora) as a New Crop for Colombia. Agronomy 2021, 11, 2550. [Google Scholar] [CrossRef]
- Nicoli, M.C.; Calligaris, S.; Manzocco, L. Shelf-Life Testing of Coffee and Related Products: Uncertainties, Pitfalls, and Perspectives. Food Eng. Rev. 2009, 1, 159–168. [Google Scholar] [CrossRef]
- Manzocco, L.; Calligaris, S.; Anese, M.; Nicoli, M.C. 13—The Stability and Shelf Life of Coffee Products. In The Stability and Shelf Life of Food, 2nd ed.; Subramaniam, P., Ed.; Woodhead Publishing Series in Food Science, Technology and Nutrition; Woodhead Publishing: Sawston, UK, 2016; pp. 375–398. [Google Scholar] [CrossRef]
- Cotter, A.R.; Hopfer, H. The Effects of Storage Temperature on the Aroma of Whole Bean Arabica Coffee Evaluated by Coffee Consumers and HS-SPME-GC-MS. Beverages 2018, 4, 68. [Google Scholar] [CrossRef]
- Kreuml, M.T.L.; Majchrzak, D.; Ploederl, B.; Koenig, J. Changes in Sensory Quality Characteristics of Coffee during Storage. Food Sci. Nutr. 2013, 1, 267–272. [Google Scholar] [CrossRef]
- Toledo, P.R.A.B.; Pezza, L.; Pezza, H.R.; Toci, A.T. Relationship Between the Different Aspects Related to Coffee Quality and Their Volatile Compounds. Compr. Rev. Food Sci. Food Saf. 2016, 15, 705–719. [Google Scholar] [CrossRef] [PubMed]
- Bellumori, M.; Angeloni, G.; Guerrini, L.; Masella, P.; Calamai, L.; Mulinacci, N.; Parenti, A.; Innocenti, M. Effects of Different Stabilization Techniques on the Shelf Life of Cold Brew Coffee: Chemical Composition, Flavor Profile and Microbiological Analysis. LWT 2021, 142, 111043. [Google Scholar] [CrossRef]
- Sunarharum, W.B.; Williams, D.J.; Smyth, H.E. Complexity of Coffee Flavor: A Compositional and Sensory Perspective. Food Res. Int. 2014, 62, 315–325. [Google Scholar] [CrossRef]
- Angeloni, S.; Mustafa, A.M.; Abouelenein, D.; Alessandroni, L.; Acquaticci, L.; Nzekoue, F.K.; Petrelli, R.; Sagratini, G.; Vittori, S.; Torregiani, E.; et al. Characterization of the Aroma Profile and Main Key Odorants of Espresso Coffee. Molecules 2021, 26, 3856. [Google Scholar] [CrossRef]
- Rubayiza, A.B.; Meurens, M. Chemical Discrimination of Arabica and Robusta Coffees by Fourier Transform Raman Spectroscopy. J. Agric. Food Chem. 2005, 53, 4654–4659. [Google Scholar] [CrossRef]
- Smrke, S.; Adam, J.; Mühlemann, S.; Lantz, I.; Yeretzian, C. Effects of Different Coffee Storage Methods on Coffee Freshness after Opening of Packages. Food Packag. Shelf Life 2022, 33, 100893. [Google Scholar] [CrossRef]
- Glöss, A.N.; Schönbächler, B.; Rast, M.; Deuber, L.; Yeretzian, C. Freshness Indices of Roasted Coffee: Monitoring the Loss of Freshness for Single Serve Capsules and Roasted Whole Beans in Different Packaging: FH—HES. CHIMIA 2014, 68, 179. [Google Scholar] [CrossRef]
- Giulia, S.; Eloisa, B.; Giulia, R.; Gloria, P.; Carlo, B.; Erica, L. Evaluation of the Behaviour of Phenols and Alkaloids in Samples of Roasted and Ground Coffee Stored in Different Types of Packaging: Implications for Quality and Shelf Life. Food Res. Int. 2023, 174, 113548. [Google Scholar] [CrossRef]
- Cong, S.; Dong, W.; Zhao, J.; Hu, R.; Long, Y.; Chi, X. Characterization of the Lipid Oxidation Process of Robusta Green Coffee Beans and Shelf Life Prediction during Accelerated Storage. Molecules 2020, 25, 1157. [Google Scholar] [CrossRef]
- Romano, R.; Filosa, G.; Pizzolongo, F.; Durazzo, A.; Lucarini, M.; Severino, P.; Souto, E.B.; Santini, A. Oxidative Stability of High Oleic Sunflower Oil during Deep-Frying Process of Purple Potato Purple Majesty. Heliyon 2021, 7, e06294. [Google Scholar] [CrossRef] [PubMed]
- Bertrand, B.; Boulanger, R.; Dussert, S.; Ribeyre, F.; Berthiot, L.; Descroix, F.; Joët, T. Climatic Factors Directly Impact the Volatile Organic Compound Fingerprint in Green Arabica Coffee Bean as Well as Coffee Beverage Quality. Food Chem. 2012, 135, 2575–2583. [Google Scholar] [CrossRef] [PubMed]
- Stokes, C.N.; O’Sullivan, M.G.; Kerry, J.P. Hedonic and Descriptive Sensory Evaluation of Instant and Fresh Coffee Products. Eur. Food Res. Technol. 2017, 243, 331–340. [Google Scholar] [CrossRef]
- Czerwiński, K.; Rydzkowski, T.; Wróblewska-Krepsztul, J.; Thakur, V.K. Towards Impact of Modified Atmosphere Packaging (MAP) on Shelf-Life of Polymer-Film-Packed Food Products: Challenges and Sustainable Developments. Coatings 2021, 11, 1504. [Google Scholar] [CrossRef]
- Piergiovanni, L.; Limbo, S. Ruolo del packaging nel controllo delle alterazioni microbiche degli alimenti. In Manuale di Microbiologia Predittiva: Concetti e Strumenti Per L’ecologia Microbica Quantitativa; Gardini, F., Parente, E., Eds.; Food; Springer Milan: Milano, Italy, 2013; pp. 185–211. [Google Scholar] [CrossRef]
- Baggenstoss, J.; Perren, R.; Escher, F. Water Content of Roasted Coffee: Impact on Grinding Behaviour, Extraction, and Aroma Retention. Eur. Food Res. Technol. 2008, 227, 1357–1365. [Google Scholar] [CrossRef]
- Sun, Z.; Cui, H.; Yang, N.; Ayed, C.; Zhang, X.; Fisk, I.D. Enhancement of Coffee Brew Aroma through Control of the Aroma Staling Pathway of 2-Furfurylthiol. Food Chem. 2020, 322, 126754. [Google Scholar] [CrossRef]
- Pittia, P.; Nicoli, M.C.; Sacchetti, G. Effect of Moisture and Water Activity on Textural Properties of Raw and Roasted Coffee Beans. J. Texture Stud. 2007, 38, 116–134. [Google Scholar] [CrossRef]
- Agustini, S.; Yusya, M.K. The Effect of Packaging Materials on the Physicochemical Stability of Ground Roasted Coffee. Curr. Res. Biosci. Biotechnol. 2020, 1, 66–70. [Google Scholar] [CrossRef]
- Hong, Q.D.; Dong, W.J.; Mei, L.B.; Long, Y.Z.; Hu, R.S.; Chu, Z.; Wang, H.R. Exploration of the Accelerated Oxidation Process and Change Rule of Bioactive Components from Green Coffee Based on Thermal In-Duction. Chin. J. Trop. Crops 2021, 42, 3327–3338. [Google Scholar]
- Turatti, J.M. Extração e Caracterização de Óleo de Café; Simpósio de Pesquisa dos Cafés do Brasil: Vitória, Brazil, 2001. [Google Scholar]
- Getachew, A.T.; Chun, B.-S. Optimization of Coffee Oil Flavor Encapsulation Using Response Surface Methodology. LWT 2016, 70, 126–134. [Google Scholar] [CrossRef]
- Frascareli, E.C.; Silva, V.M.; Tonon, R.V.; Hubinger, M.D. Effect of Process Conditions on the Microencapsulation of Coffee Oil by Spray Drying. Food Bioprod. Process. 2012, 90, 413–424. [Google Scholar] [CrossRef]
- Anese, M.; Manzocco, L.; Nicoli, M.C. Modeling the Secondary Shelf Life of Ground Roasted Coffee. J. Agric. Food Chem. 2006, 54, 5571–5576. [Google Scholar] [CrossRef] [PubMed]
- Liu, Y.; Kitts, D.D. Confirmation That the Maillard Reaction Is the Principle Contributor to the Antioxidant Capacity of Coffee Brews. Food Res. Int. 2011, 44, 2418–2424. [Google Scholar] [CrossRef]
- Pérez-Martínez, M.; Sopelana, P.; De Peña, M.-P.; Cid, C. Changes in Volatile Compounds and Overall Aroma Profile during Storage of Coffee Brews at 4 and 25 °C. J. Agric. Food Chem. 2008, 56, 3145–3154. [Google Scholar] [CrossRef]
- Gruczyńska, E.; Kowalska, D.; Kozłowska, M.; Majewska, E.; Tarnowska, K. Furan in Roasted, Ground and Brewed Coffee. Rocz. Panstw. Zakl. Hig. 2018, 69, 111–118. [Google Scholar]
- Marin, K.; Zlati, E.; Plestenjak, A. A New Aroma Index to Determine the Aroma Quality of Roasted and Ground Coffee During Storage. Food Technol. Biotechnol. 2008, 46, 442–447. [Google Scholar]
- Frankel, E.N. Lipid Oxidation, 2nd ed.; Oily Press: Bridgewater, UK, 2005. [Google Scholar]
- Coghe, S.; Derdelinckx, G.; Delvaux, F.R. Effect of Non-Enzymatic Browning on Flavour, Colour and Antioxidative Activity of Dark Specialty Malts—A Review. Monatsschr. Brauwiss. 2004, 57, 25–38. [Google Scholar]
- Korhoňová, M.; Hron, K.; Klimčíková, D.; Müller, L.; Bednář, P.; Barták, P. Coffee Aroma—Statistical Analysis of Compositional Data. Talanta 2009, 80, 710–715. [Google Scholar] [CrossRef]
- Verardo, G.; Cecconi, F.; Geatti, P.; Giumanini, A.G. New Procedures for Determination of Acids in Coffee Extracts, and Observations on the Development of Acidity upon Ageing. Anal. Bioanal. Chem. 2002, 374, 879–885. [Google Scholar] [CrossRef]
- Yeager, S.E.; Batali, M.E.; Guinard, J.-X.; Ristenpart, W.D. Acids in Coffee: A Review of Sensory Measurements and Meta-Analysis of Chemical Composition. Crit. Rev. Food Sci. Nutr. 2023, 63, 1010–1036. [Google Scholar] [CrossRef] [PubMed]
- Ginz, M.; Balzer, H.H.; Bradbury, A.G.W.; Maier, H.G. Formation of Aliphatic Acids by Carbohydrate Degradation during Roasting of Coffee. Eur. Food Res. Technol. 2000, 211, 404–410. [Google Scholar] [CrossRef]
- de Melo Pereira, G.V.; de Carvalho Neto, D.P.; Magalhães Júnior, A.I.; Vásquez, Z.S.; Medeiros, A.B.P.; Vandenberghe, L.P.S.; Soccol, C.R. Exploring the Impacts of Postharvest Processing on the Aroma Formation of Coffee Beans—A Review. Food Chem. 2019, 272, 441–452. [Google Scholar] [CrossRef]
- Toci, A.T.; Neto, V.J.M.F.; Torres, A.G.; Farah, A. Changes in Triacylglycerols and Free Fatty Acids Composition during Storage of Roasted Coffee. LWT—Food Sci. Technol. 2013, 50, 581–590. [Google Scholar] [CrossRef]
- Wang, X.; Wang, Y.; Hu, G.; Hong, D.; Guo, T.; Li, J.; Li, Z.; Qiu, M. Review on Factors Affecting Coffee Volatiles: From Seed to Cup. J. Sci. Food Agric. 2022, 102, 1341–1352. [Google Scholar] [CrossRef]
- Macheiner, L.; Schmidt, A.; Karpf, F.; Mayer, H.K. A Novel UHPLC Method for Determining the Degree of Coffee Roasting by Analysis of Furans. Food Chem. 2021, 341, 128165. [Google Scholar] [CrossRef]


| Temperature | 25 °C | 40 °C | |||||||
|---|---|---|---|---|---|---|---|---|---|
| Time (Days) | Time 0 | 90 Days | 180 Days | 90 Days | 180 Days | ||||
| Type of Packaging | STD | ALT | STD | ALT | STD | ALT | STD | ALT | |
| Pods | 1.09 ± 0.11 | 1.81 ± 0.23 | 1.70 ± 0.15 | 2.15 ± 0.25 | 2.30 ± 0.38 | 1.75 ± 0.50 | 1.09 ± 0.11 | 1.81 ± 0.23 | 1.70 ± 0.15 |
| Capsules | 1.15 ± 0.02 | 1.60 ± 0.22 | 1.88 ± 0.13 | 2.59 ± 0.12 | 2.70 ± 0.27 | 2.19 ± 0.04 | 2.22 ± 0.33 | 3.25 ± 0.15 | 3.13 ± 0.22 |
| 25 °C | 40 °C | ||||||||
|---|---|---|---|---|---|---|---|---|---|
| Time 0 | 90 Days | 180 Days | 90 Days | 180 Days | |||||
| Compound | STD | ALT | STD | ALT | STD | ALT | STD | ALT | |
| ∑ Furans | 36.47 ± 0.30 | 42.47 ± 0.06 b | 45.35 ± 0.08 a | 42.86 ± 0.15 b | 49.65 ± 0.06 a | 40.03 ± 0.10 b | 50.13 ± 0.15 a | 40.64 ± 0.20 b | 49.11 ± 0.20 a |
| 2-Furanmethanol | 18.88 ± 0.37 | 20.02 ± 0.08 b | 25.27 ± 0.10 a | 24.14 ± 0.36 b | 29.82 ± 0.03 a | 19.95 ± 0.20 b | 25.21 ± 0.01 a | 23.09 ± 0.67 b | 29.94 ± 0.32 a |
| Furfuryl acetate | 7.28 ± 0.59 | 9.82 ± 0.04 a | 7.93 ± 0.29 b | 8.76 ± 0.17 a | 7.35 ± 0.04 b | 9.08 ± 0.07 b | 10.62 ± 0.46 a | 8.86 ± 0.31 a | 8.51 ± 0.06 a |
| Furfuryl isovalerate | 0.13 ± 0.03 | 0.45 ± 0.01 a | 0.39 ± 0.01 b | 0.39 ± 0.04 a | 0.36 ± 0.02 a | 0.39 ± 0.03 a | 0.31 ± 0.01 b | 0.39 ± 0.01 a | 0.36 ± 0.02 a |
| Furfural | 4.51 ± 0.66 | 4.02 ± 0.13 a | 3.92 ± 0.13 a | 2.41 ± 0.05 b | 5.04 ± 0.17 a | 4.04 ± 0.10 b | 5.21 ± 0.08 a | 2.10 ± 0.06 b | 2.75 ± 0.04 a |
| Dihydro-2-methyl-3-furanone | 1.49 ± 0.31 | 0.89 ± 0.04 a | 0.84 ± 0.03 a | 1.00 ± 0.06 a | 0.90 ± 0.05 a | 3.93 ± 0.08 b | 6.33 ± 0.30 a | 3.41 ± 0.15 b | 5.11 ± 0.01 a |
| 5-methyl-Furfural | 3.37 ± 0.11 | 5.15 ± 0.01 b | 5.37 ± 0.01 a | 4.51 ± 0.14 a | 4.76 ± 0.06 a | 0.88 ± 0.03 a | 0.81 ± 0.02 a | 1.01 ± 0.05 a | 0.96 ± 0.01 a |
| 2,2′-Methylenebisfuran | 0.53 ± 0.03 | 1.71 ± 0.02 a | 1.24 ± 0.03 b | 1.32 ± 0.13 a | 0.95 ± 0.02 b | 1.45 ± 0.30 a | 1.25 ± 0.10 a | 1.41 ± 0.03 a | 1.08 ± 0.06 a |
| Difurfuryl ether | 0.16 ± 0.04 | 0.31 ± 0.01 a | 0.30 ± 0.02 a | 0.24 ± 0.01 b | 0.36 ± 0.01 a | 0.22 ± 0.02 a | 0.28 ± 0.02 a | 0.21 ± 0.04 a | 0.29 ± 0.01 a |
| Furfuryl methyl ether | 0.12 ± 0.07 | 0.10 ± 0.03 a | 0.09 ± 0.01 a | 0.09 ± 0.08 a | 0.11 ± 0.01 a | 0.09 ± 0.06 a | 0.11 ± 0.01 a | 0.16 ± 0.01 a | 0.11 ± 0.02 a |
| ∑ Pyrazines | 29.88 ± 0.34 | 27.46 ± 0.07 a | 24.41 ± 0.08 b | 22.04 ± 0.09 a | 19.89 ± 0.09 b | 27.36 ± 0.08 a | 25.12 ± 0.06 b | 25.20 ± 0.60 a | 23.30 ± 0.14 b |
| 2,5 dimethylpyrazine | 17.75 ± 0.59 | 13.73 ± 0.05 a | 12.39 ± 0.03 b | 8.90 ± 0.39 a | 7.24 ± 0.40 b | 13.32 ± 0.31 a | 12.64 ± 0.06 a | 10.65 ± 0.39 a | 10.71 ± 0.17 a |
| 2-Methylpyrazine | 5.47 ± 0.49 | 3.58 ± 0.17 a | 3.31 ± 0.08 a | 3.74 ± 0.03 a | 4.00 ± 0.18 a | 3.69 ± 0.07 b | 4.44 ± 0.04 a | 4.02 ± 0.10 b | 4.49 ± 0.07 a |
| 2-Ethyl-6-methylpyrazine | 2.87 ± 1.20 | 2.48 ± 0.09 a | 2.22 ± 0.15 a | 1.62 ± 0.01 a | 1.85 ± 0.05 a | 2.68 ± 0.05 a | 2.35 ± 0.11 a | 2.44 ± 0.94 a | 2.30 ± 0.50 a |
| 2,3,5-Trimethylpyrazine | 1.89 ± 0.04 | 3.05 ± 0.07 a | 2.41 ± 0.12 b | 3.14 ± 0.02 a | 2.56 ± 0.03 b | 3.31 ± 0.09 a | 2.25 ± 0.13 b | 3.44 ± 0.16 a | 2.27 ± 0.02 b |
| 2,5-Dimethyl-3-ethylpyrazine | 0.66 ± 0.01 | 1.38 ± 0.01 a | 1.11 ± 0.01 b | 1.50 ± 0.01 a | 1.08 ± 0.02 b | 1.43 ± 0.06 a | 1.02 ± 0.07 b | 1.40 ± 0.06 a | 1.03 ± 0.08 b |
| 3-Methoxy-2-isopropylpyrazine | 0.76 ± 0.15 | 1.48 ± 0.09 a | 1.33 ± 0.03 a | 1.51 ± 0.02 a | 1.20 ± 0.03 b | 1.16 ± 0.03 a | 1.04 ± 0.01 b | 1.11 ± 0.08 a | 0.96 ± 0.02 a |
| Isopropenylpyrazine | 0.22 ± 0.04 | 1.34 ± 0.02 a | 1.01 ± 0.02 b | 1.20 ± 0.03 a | 0.95 ± 0.05 b | 1.16 ± 0.04 a | 0.86 ± 0.03 b | 0.97 ± 0.04 a | 0.77 ± 0.04 b |
| 5-Methyl-6,7dihydro5-Hcyclopentapyrazine | 0.15 ± 0.02 | 0.34 ± 0.01 a | 0.24 ± 0.03 a | 0.30 ± 0.01 b | 0.49 ± 0.03 a | 0.34 ± 0.01 b | 0.42 ± 0.01 a | 0.64 ± 0.03 a | 0.48 ± 0.01 b |
| 2-methyl-5-(1-propenyl) Pyrazine | 0.14 ± 0.08 | 0.08 ± 0.02 b | 0.39 ± 0.01 a | 0.13 ± 0.05 b | 0.52 ± 0.05 a | 0.27 ± 0.03 a | 0.10 ± 0.01 b | 0.53 ± 0.04 a | 0.29 ± 0.01 b |
| ∑ Pyridines | 10.90 ± 0.46 | 7.26 ± 0.12 a | 7.08 ± 0.09 a | 8.29 ± 0.08 a | 7.03 ± 0.03 b | 8.21 ± 0.05 a | 3.81 ± 0.03 b | 7.76 ± 0.06 a | 3.97 ± 0.01 b |
| Pyridine | 9.67 ± 0.33 | 4.85 ± 0.36 a | 5.24 ± 0.20 a | 5.78 ± 0.18 a | 5.90 ± 0.06 a | 5.96 ± 0.10 a | 3.29 ± 0.07 b | 5.79 ± 0.12 a | 3.71 ± 0.01 b |
| 1-Methyl-1,2,3,6-tetrahydropyridine | 0.88 ± 0.12 | 2.06 ± 0.01 a | 1.54 ± 0.04 b | 2.17 ± 0.02 a | 0.86 ± 0.03 b | 1.89 ± 0.06 a | 0.37 ± 0.01 b | 1.63 ± 0.09 a | 0.13 ± 0.01 b |
| 3-Ethylpyridine | 0.36 ± 0.01 | 0.35 ± 0.03 a | 0.30 ± 0.02 a | 0.34 ± 0.04 a | 0.27 ± 0.01 b | 0.36 ± 0.03 a | 0.15 ± 0.01 b | 0.34 ± 0.04 a | 0.13 ± 0.01 b |
| ∑ Ketones | 11.03 ± 1.06 | 6.81 ± 0.02 b | 7.01 ± 0.06 a | 8.25 ± 0.03 a | 6.88 ± 0.03 b | 6.03 ± 0.05 a | 4.60 ± 0.05 b | 7.02 ± 0.04 a | 5.56 ± 0.04 b |
| 1-(Acetyloxy)-2-propanone | 8.27 ± 0.13 | 4.30 ± 0.03 a | 3.99 ± 0.21 a | 4.23 ± 0.05 a | 4.11 ± 0.05 b | 3.42 ± 0.18 a | 2.82 ± 0.15 b | 3.83 ± 0.06 a | 3.35 ± 0.08 b |
| Acetone | 1.42 ± 1.07 | 0.36 ± 0.04 b | 1.07 ± 0.02 a | 1.87 ± 0.01 a | 1.29 ± 0.04 b | 1.03 ± 0.04 a | 0.65 ± 0.03 b | 1.66 ± 0.10 a | 0.99 ± 0.04 b |
| 3-Hydroxy-2-butanone | 0.74 ± 0.13 | 0.65 ± 0.01 a | 0.45 ± 0.01 b | 0.63 ± 0.01 a | 0.44 ± 0.01 b | 0.53 ± 0.01 a | 0.31 ± 0.02 b | 0.59 ± 0.04 a | 0.32 ± 0.01 b |
| 2-Hydroxy-3-methyl-2-cyclopenten-1-one | 0.34 ± 0.04 | 0.80 ± 0.01 a | 0.86 ± 0.04 a | 0.89 ± 0.02 a | 0.57 ± 0.02 b | 0.50 ± 0.01 a | 0.45 ± 0.02 a | 0.48 ± 0.04 a | 0.54 ± 0.02 a |
| 3-Ethyl-2-hydroxy-2-cyclopentenone | 0.27 ± 0.06 | 0.70 ± 0.01 a | 0.64 ± 0.02 a | 0.63 ± 0.01 a | 0.47 ± 0.01 b | 0.55 ± 0.02 a | 0.37 ± 0.01 b | 0.46 ± 0.02 a | 0.36 ± 0.01 b |
| ∑Phenols | 1.61 ± 0.04 | 4.09 ± 0.02 a | 3.57 ± 0.06 b | 3.41 ± 0.03 a | 2.59 ± 0.03 b | 2.97 ± 0.07 a | 2.89 ± 0.08 a | 2.64 ± 0.03 a | 2.46 ± 0.04 b |
| Guaiacol | 0.74 ± 0.07 | 1.00 ± 0.01 b | 1.20 ± 0.16 a | 0.86 ± 0.05 a | 0.71 ± 0.02 b | 0.71 ± 0.21 a | 0.86 ± 0.27 a | 0.52 ± 0.02 a | 0.68 ± 0.02 b |
| 4-Vinylphenol | 0.42 ± 0.04 | 1.94 ± 0.04 a | 1.37 ± 0.02 b | 1.55 ± 0.01 a | 1.04 ± 0.03 b | 1.36 ± 0.02 a | 1.03 ± 0.02 b | 1.07 ± 0.04 a | 0.77 ± 0.03 b |
| 4-ethyl-2-methoxyphenol | 0.30 ± 0.02 | 0.82 ± 0.01 a | 0.75 ± 0.05 a | 0.72 ± 0.01 a | 0.49 ± 0.02 b | 0.74 ± 0.05 a | 0.63 ± 0.07 a | 0.77 ± 0.03 a | 0.59 ± 0.01 b |
| Phenol | 0.15 ± 0.03 | 0.33 ± 0.02 a | 0.25 ± 0.02 b | 0.28 ± 0.02 a | 0.35 ± 0.04 a | 0.16 ± 0.03 b | 0.37 ± 0.05 a | 0.28 ± 0.02 b | 0.42 ± 0.06 a |
| ∑Pyrroles | 1.82 ± 0.30 | 3.72 ± 0.03 a | 3.15 ± 0.03 b | 4.03 ± 0.04 a | 3.73 ± 0.02 b | 4.30 ± 0.03 a | 3.33 ± 0.03 b | 4.15 ± 0.05 a | 4.04 ± 0.04 a |
| 1-Furfurylpyrrole | 0.76 ± 0.01 | 0.98 ± 0.04 a | 0.76 ± 0.03 b | 1.70 ± 0.08 a | 1.34 ± 0.01 b | 1.58 ± 0.01 a | 0.79 ± 0.02 b | 1.56 ± 0.06 a | 1.46 ± 0.04 a |
| 2-Acetyl-1-methylpyrrole | 0.75 ± 0.24 | 1.47 ± 0.05 a | 1.18 ± 0.05 b | 1.33 ± 0.03 a | 1.07 ± 0.01 b | 1.59 ± 0.03 a | 1.38 ± 0.03 b | 1.61 ± 0.06 a | 1.27 ± 0.03 b |
| 2-Acetylpyrrole | 0.31 ± 0.06 | 0.99 ± 0.02 a | 0.99 ± 0.03 a | 0.77 ± 0.02 b | 1.09 ± 0.02 a | 0.94 ± 0.01 a | 1.01 ± 0.02 a | 0.81 ± 0.06 b | 1.12 ± 0.05 a |
| 1H-pyrrole-2-carboxaldehyde | n.d. | 0.28 ± 0.02 a | 0.22 ± 0.01 b | 0.23 ± 0.01 a | 0.23 ± 0.02 a | 0.19 ± 0.01 a | 0.15 ± 0.03 a | 0.17 ± 0.02 a | 0.19 ± 0.04 a |
| ∑ Aldehydes | 0.76 ± 0.29 | 1.68 ± 0.03 a | 1.20 ± 0.02 b | 1.82 ± 0.02 a | 1.05 ± 0.03 b | 1.72 ± 0.01 a | 0.88 ± 0.01 b | 1.92 ± 0.05 a | 0.79 ± 0.02 b |
| 2-Butenal | 0.45 ± 0.06 | 1.19 ± 0.06 a | 1.20 ± 0.02 a | 1.24 ± 0.01 a | 1.05 ± 0.03 b | 1.27 ± 0.01 a | 0.88 ± 0.01 b | 1.13 ± 0.06 a | 0.79 ± 0.02 b |
| Benzaldehyde | 0.31 ± 0.23 | 0.49 ± 0.01 b | n.d. | 0.58 ± 0.02 a | n.d. | 0.45 ± 0.01 a | n.d. | 0.79 ± 0.04 a | n.d. |
| ∑ Others | 7.58 ± 0.39 | 6.52 ± 0.02 b | 8.23 ± 0.07 a | 9.30 ± 0.09 a | 9.18 ± 0.04 a | 9.38 ± 0.07 a | 9.24 ± 0.14 a | 10.66 ± 0.10 a | 10.77 ± 0.03 a |
| Acetic acid | 7.11 ± 0.34 | 5.26 ± 0.04 b | 6.98 ± 0.25 a | 8.24 ± 0.31 a | 8.50 ± 0.08 a | 8.73 ± 0.20 a | 8.87 ± 0.46 a | 10.11 ± 0.35 a | 10.27 ± 0.05 a |
| Maltol | 0.43 ± 0.07 | 1.21 ± 0.02 a | 1.21 ± 0.01 a | 0.99 ± 0.01 a | 0.63 ± 0.01 b | 0.61 ± 0.02 a | 0.32 ± 0.06 b | 0.50 ± 0.02 a | 0.44 ± 0.05 a |
| 3,4-Dimethoxystyrene | 0.04 ± 0.05 | 0.05 ± 0.03 a | 0.04 ± 0.02 b | 0.07 ± 0.03 a | 0.05 ± 0.01 a | 0.04 ± 0.03 a | 0.05 ± 0.01 a | 0.05 ± 0.02 a | 0.06 ± 0.01 a |
| 4-Ethyl-decane | n.d. | n.d. | n.d. | n.d. | n.d. | n.d. | n.d. | n.d. | n.d. |
| 25 °C | 40 °C | ||||||||
|---|---|---|---|---|---|---|---|---|---|
| Time 0 | 90 Days | 180 Days | 90 Days | 180 Days | |||||
| Compound | STD | ALT | STD | ALT | STD | ALT | STD | ALT | |
| ∑ Furans | 27.40 ± 0.30 | 37.3 ± 0.09 a | 36.11 ± 0.14 a | 34.65 ± 0.07 b | 34.69 ± 0.09 a | 36.69 ± 0.04 b | 42.91 ± 0.10 a | 34.65 ± 0.07 b | 44.06 ± 0.03 a |
| 2-Furanmethanol | 11.68 ± 2.28 | 19.13 ± 0.04 a | 17.57 ± 0.30 b | 16.34 ± 0.06 a | 20.26 ± 0.07 b | 13.53 ± 0.06 b | 22.49 ± 0.28 a | 16.34 ± 0.06 b | 24.10 ± 0.03 a |
| Furfuryl acetate | 6.44 ± 1.81 | 8.74 ± 0.15 b | 9.24 ± 0.05 a | 6.84 ± 0.13 a | 5.18 ± 0.25 b | 7.99 ± 0.02 a | 5.95 ± 0.06 b | 6.84 ± 0.13 a | 6.76 ± 0.04 b |
| Furfuryl isovalerate | 1.15 ± 0.18 | 2.90 ± 0.05 a | 1.91 ± 0.04 b | 3.99 ± 0.12 a | 2.71 ± 0.06 b | 9.59 ± 0.01 a | 6.34 ± 0.03 b | 3.99 ± 0.12 b | 5.72 ± 0.04 a |
| Furfural | 3.36 ± 0.17 | 1.21 ± 0.09 b | 2.50 ± 0.07 a | 2.53 ± 0.16 a | 1.28 ± 0.06 b | 1.96 ± 0.03 b | 3.00 ± 0.17 a | 2.53 ± 0.16 b | 3.24 ± 0.06 a |
| Dihydro-2-methyl-3-furanone | 2.66 ± 0.84 | 2.58 ± 0.08 a | 2.11 ± 0.06 b | 2.06 ± 0.09 a | 2.07 ± 0.08 b | 2.20 ± 0.08 a | 2.20 ± 0.01 a | 2.06 ± 0.09 a | 1.97 ± 0.02 a |
| 5-methyl-Furfural | 1.35 ± 0.28 | 1.62 ± 0.02 a | 1.78 ± 0.08 a | 1.84 ± 0.14 b | 2.03 ± 0.10 a | 1.94 ± 0.06 a | 1.48 ± 0.09 b | 1.84 ± 0.14 a | 1.40 ± 0.05 b |
| 2,2′-Methylenebisfuran | 0.29 ± 0.12 | 0.47 ± 0.01 a | 0.50 ± 0.01 a | 0.45 ± 0.01 b | 0.50 ± 0.01 a | 0.98 ± 0.02 a | 0.60 ± 0.01 b | 0.45 ± 0.01 a | 0.50 ± 0.02 a |
| Difurfuryl ether | 0.32 ± 0.06 | 0.56 ± 0.01 a | 0.34 ± 0.03 b | 0.46 ± 0.04 a | 0.30 ± 0.01 b | 0.31 ± 0.01 a | 0.32 ± 0.02 a | 0.46 ± 0.04 a | 0.25 ± 0.03 b |
| Furfuryl methyl ether | 0.15 ± 0.05 | 0.09 ± 0.01 b | 0.16 ± 0.01 a | 0.14 ± 0.02 a | 0.16 ± 0.02 a | 0.19 ± 0.02 b | 0.50 ± 0.01 a | 0.14 ± 0.02 a | 0.12 ± 0.01 a |
| ∑ Pyrazines | 34.22 ± 0.23 | 28.62 ± 0.22 b | 32.42 ± 0.09 a | 31.84 ± 0.18 a | 30.38 ± 0.11 b | 33.37 ± 0.11 a | 29.28 ± 0.04 b | 31.84 ± 0.18 a | 27.11 ± 0.03 b |
| 2,5 dimethylpyrazine | 15.08 ± 0.86 | 9.49 ± 0.03 b | 14.66 ± 0.10 a | 13.91 ± 0.16 a | 13.02 ± 0.47 a | 14.65 ± 0.45 a | 13.14 ± 0.03 b | 13.91 ± 0.16 a | 10.86 ± 0.01 b |
| 2-Methylpyrazine | 6.08 ± 1.45 | 2.42 ± 0.15 b | 3.59 ± 0.05 a | 1.89 ± 0.05 b | 3.21 ± 0.02 a | 1.97 ± 0.07 a | 1.38 ± 0.02 b | 1.89 ± 0.05 a | 1.62 ± 0.03 b |
| 2-Ethyl-6-methylpyrazine | 4.35 ± 0.60 | 7.86 ± 0.38 a | 6.60 ± 0.11 b | 7.62 ± 0.24 a | 7.14 ± 0.17 a | 8.00 ± 0.08 a | 7.50 ± 0.12 b | 7.62 ± 0.24 a | 7.19 ± 0.02 b |
| 2,3,5-Trimethylpyrazine | 4.68 ± 1.34 | 2.94 ± 0.06 a | 2.19 ± 0.08 b | 2.71 ± 0.17 a | 2.01 ± 0.03 b | 2.79 ± 0.01 a | 1.96 ± 0.08 b | 2.71 ± 0.17 a | 2.93 ± 0.07 b |
| 2,5-Dimethyl-3-ethylpyrazine | 1.90 ± 0.31 | 2.61 ± 0.02 a | 2.26 ± 0.02 b | 2.51 ± 0.05 a | 2.16 ± 0.03 b | 2.66 ± 0.08 a | 1.71 ± 0.03 b | 2.51 ± 0.05 a | 1.80 ± 0.04 b |
| 3-Methoxy-2-isopropylpyrazine | 0.91 ± 0.11 | 1.32 ± 0.06 a | 1.05 ± 0.03 b | 1.16 ± 0.03 a | 0.90 ± 0.09 a | 1.36 ± 0.04 b | 1.77 ± 0.01 a | 1.16 ± 0.03 a | 1.16 ± 0.01 a |
| Isopropenylpyrazine | 0.41 ± 0.18 | 0.31 ± 0.04 b | 0.55 ± 0.02 a | 0.36 ± 0.02 b | 0.51 ± 0.03 a | 0.39 ± 0.02 a | 0.44 ± 0.05 a | 0.36 ± 0.02 a | 0.23 ± 0.01 a |
| 5-Methyl-6.7dihydro5-Hcyclopentapyrazine | 0.46 ± 0.06 | 1.28 ± 0.08 a | 1.19 ± 0.02 a | 1.29 ± 0.03 a | 1.08 ± 0.04 b | 1.14 ± 0.02 a | 1.15 ± 0.03 a | 1.29 ± 0.03 a | 1.05 ± 0.04 b |
| 2-methyl-5-(1-propenyl) Pyrazine | 0.35 ± 0.05 | 0.39 ± 0.01 a | 0.33 ± 0.02 b | 0.39 ± 0.03 a | 0.35 ± 0.02 a | 0.41 ± 0.04 a | 0.23 ± 0.02 b | 0.39 ± 0.03 a | 0.27 ± 0.03 b |
| ∑Pyridines | 14.29 ± 1.52 | 10.87 ± 0.04 a | 9.92 ± 0.08 b | 10.89 ± 0.15 b | 11.32 ± 0.05 a | 9.71 ± 0.07 a | 8.96 ± 0.04 b | 10.89 ± 0.15 a | 8.28 ± 0.02 b |
| Pyridine | 13.03 ± 1.18 | 8.32 ± 0.06 a | 7.63 ± 0.02 b | 8.44 ± 0.24 b | 8.96 ± 0.07 a | 7.59 ± 0.15 a | 7.68 ± 0.07 a | 8.44 ± 0.24 a | 7.84 ± 0.03 b |
| 1-Methyl-1.2.3.6-tetrahydropyridine | 0.97 ± 0.11 | 1.98 ± 0.06 a | 1.77 ± 0.11 b | 1.89 ± 0.04 a | 1.93 ± 0.02 a | 1.49 ± 0.01 a | 0.83 ± 0.03 b | 1.89 ± 0.04 a | 0.16 ± 0.01 b |
| 3-Ethylpyridine | 0.30 ± 0.03 | 0.57 ± 0.01 a | 0.52 ± 0.02 a | 0.56 ± 0.02 a | 0.43 ± 0.02 b | 0.63 ± 0.04 a | 0.45 ± 0.01 b | 0.56 ± 0.02 a | 0.28 ± 0.03 b |
| ∑ Ketones | 7.30 ± 0.35 | 6.33 ± 0.07 a | 5.91 ± 0.05 b | 5.69 ± 0.08 a | 5.78 ± 0.08 a | 4.20 ± 0.02 b | 4.88 ± 0.04 a | 5.69 ± 0.08 a | 3.57 ± 0.02 b |
| 1-(Acetyloxy)-2-propanone | 5.20 ± 0.06 | 3.73 ± 0.19 a | 3.43 ± 0.09 a | 3.40 ± 0.22 a | 3.32 ± 0.17 a | 2.72 ± 0.02 a | 2.84 ± 0.07 a | 3.40 ± 0.22 a | 2.19 ± 0.01 b |
| Acetone | 1.04 ± 0.14 | 0.98 ± 0.04 a | 0.96 ± 0.03 a | 1.06 ± 0.05 a | 0.99 ± 0.16 a | 0.78 ± 0.03 b | 1.09 ± 0.09 a | 1.06 ± 0.05 a | 0.73 ± 0.04 b |
| 3-Hydroxy-2-butanone | 0.47 ± 0.13 | 0.63 ± 0.05 a | 0.60 ± 0.02 a | 0.46 ± 0.02 b | 0.69 ± 0.05 a | 0.32 ± 0.03 a | 0.37 ± 0.02 a | 0.46 ± 0.02 a | 0.19 ± 0.01 b |
| 2-Hydroxy-3-methyl-2-cyclopenten-1-one | 0.40 ± 0.01 | 0.61 ± 0.05 a | 0.57 ± 0.03 a | 0.47 ± 0.03 a | 0.54 ± 0.03 a | 0.38 ± 0.02 a | 0.38 ± 0.01 a | 0.47 ± 0.03 a | 0.26 ± 0.02 b |
| 3-Ethyl-2-hydroxy-2-cyclopentenone | 0.19 ± 0.01 | 0.38 ± 0.01 a | 0.35 ± 0.02 a | 0.30 ± 0.01 a | 0.24 ± 0.01 b | n.d. | 0.20 ± 0.04 a | 0.30 ± 0.01 a | 0.20 ± 0.02 b |
| ∑ Phenols | 5.46 ± 1.68 | 8.03 ± 0.07 a | 7.71 ± 0.02 b | 8.27 ± 0.05 a | 7.29 ± 0.04 b | 4.52 ± 0.02 a | 4.01 ± 0.03 b | 8.27 ± 0.05 a | 3.83 ± 0.01 b |
| Guaiacol | 2.28 ± 0.05 | 2.62 ± 0.12 a | 2.54 ± 0.02 a | 2.16 ± 0.06 a | 2.21 ± 0.06 a | 1.91 ± 0.03 a | 1.97 ± 0.06 a | 2.16 ± 0.06 a | 1.88 ± 0.02 b |
| 4-Vinylphenol | 1.47 ± 0.03 | 2.89 ± 0.07 a | 2.86 ± 0.02 a | 3.90 ± 0.02 a | 3.40 ± 0.06 b | 0.76 ± 0.02 a | 0.47 ± 0.03 b | 3.90 ± 0.02 a | 0.59 ± 0.01 b |
| 4-ethyl-2-methoxyphenol | 0.95 ± 0.21 | 1.91 ± 0.05 a | 1.69 ± 0.01 b | 1.87 ± 0.07 a | 1.20 ± 0.03 b | 1.50 ± 0.04 a | 1.05 ± 0.01 b | 1.87 ± 0.07 a | 0.83 ± 0.01 b |
| Phenol | 0.77 ± 0.19 | 0.61 ± 0.06 a | 0.62 ± 0.02 a | 0.34 ± 0.03cb | 0.48 ± 0.02 a | 0.35 ± 0.01 b | 0.52 ± 0.01 a | 0.34 ± 0.03 b | 0.53 ± 0.01 a |
| ∑ Pyrroles | 3.13 ± 0.16 | 3.17 ± 0.02 a | 2.71 ± 0.02 b | 3.05 ± 0.04 a | 2.96 ± 0.04 b | 3.18 ± 0.02 a | 3.06 ± 0.02 a | 3.05 ± 0.04 b | 3.23 ± 0.03 a |
| 1-Furfurylpyrrole | 0.97 ± 0.34 | 0.70 ± 0.01 a | 0.73 ± 0.01 a | 0.61 ± 0.02 b | 0.90 ± 0.04 a | 0.71 ± 0.01 a | 0.44 ± 0.02 b | 0.61 ± 0.02 b | 0.83 ± 0.04 a |
| 2-Acetyl-1-methylpyrrole | 1.49 ± 0.54 | 1.47 ± 0.03 a | 0.86 ± 0.02 b | 1.56 ± 0.04 a | 1.27 ± 0.04 b | 1.50 ± 0.04 b | 1.81 ± 0.04 a | 1.56 ± 0.04 b | 1.75 ± 0.07 a |
| 2-Acetylpyrrole | 0.57 ± 0.01 | 0.91 ± 0.03 a | 0.84 ± 0.02 a | 0.79 ± 0.07 a | 0.67 ± 0.04 b | 0.87 ± 0.05 a | 0.72 ± 0.04 b | 0.79 ± 0.07 a | 0.57 ± 0.04 b |
| 1H-pyrrole-2-carboxaldehyde | 0.10 ± 0.02 | 0.09 ± 0.01 b | 0.28 ± 0.01 a | 0.09 ± 0.02 b | 0.12 ± 0.03 b | 0.10 ± 0.05 a | 0.09 ± 0.01 a | 0.09 ± 0.02 a | 0.08 ± 0.07 a |
| ∑ Aldehydes | 0.61 ± 0.02 | 0.95 ± 0.03 b | 1.12 ± 0.03 a | 1.08 ± 0.01 a | 1.00 ± 0.02 b | 0.93 ± 0.02 a | 0.49 ± 0.01 b | 1.08 ± 0.01 a | 0.66 ± 0.02 b |
| 2-Butenal | 0.36 ± 0.10 | 0.45 ± 0.02 b | 0.71 ± 0.02 a | 0.68 ± 0.01 a | 0.57 ± 0.04 b | 0.60 ± 0.04 a | 0.20 ± 0.01 b | 0.68 ± 0.01 a | 0.34 ± 0.02 b |
| Benzaldehyde | 0.25 ± 0.02 | 0.50 ± 0.07 a | 0.41 ± 0.03 b | 0.40 ± 0.01 a | 0.43 ± 0.01 a | 0.33 ± 0.01 a | 0.29 ± 0.01 a | 0.40 ± 0.01 a | 0.32 ± 0.01 b |
| ∑ Others | 7.59 ± 2.98 | 4.73 ± 0.07 a | 4.10 ± 0.06 b | 4.52 ± 0.17 b | 6.57 ± 0.04 a | 5.38 ± 0.04 a | 6.46 ± 0.04 b | 4.52 ± 0.17 b | 9.27 ± 0.03 a |
| Acetic acid | 6.37 ± 1.60 | 3.09 ± 0.13 a | 3.05 ± 0.08 a | 3.71 ± 0.29 b | 5.84 ± 0.09 a | 4.69 ± 0.08 b | 5.82 ± 0.05 a | 3.71 ± 0.29 b | 8.83 ± 0.05 a |
| Maltol | 0.70 ± 0.20 | 0.66 ± 0.05 a | 0.53 ± 0.03 b | 0.42 ± 0.01 a | 0.39 ± 0.05 a | 0.23 ± 0.02 b | 0.36 ± 0.02 a | 0.42 ± 0.01 a | 0.15 ± 0.04 b |
| 3.4-Dimethoxystyrene | 0.36 ± 0.02 | 0.69 ± 0.02 a | 0.24 ± 0.01 b | 0.12 ± 0.05 a | 0.13 ± 0.01 a | 0.19 ± 0.03 a | 0.10 ± 0.02 b | 0.12 ± 0.05 a | 0.11 ± 0.03 a |
| 4-Ethyl-decano | 0.16 ± 0.09 | 0.29 ± 0.01 a | 0.28 ± 0.01 a | 0.27 ± 0.01 a | 0.21 ± 0.02 b | 0.27 ± 0.03 a | 0.18 ± 0.01 b | 0.27 ± 0.01 a | 0.18 ± 0.01c |
| Temperature | 25 °C | ||||
|---|---|---|---|---|---|
| Time (Days) | Time 0 | 90 Days | 180 Days | ||
| Type of Packaging | STD | ALT | STD | ALT | |
| Pods | 8.50 a ± 0.50 | 8.50 a ± 1.00 | 8.50 a ± 0.50 | 8.00 a ± 1.00 | 8.00 a ± 0.50 |
| Capsules | 7.50 b ± 0.50 | 7.50 b ± 0.50 | 7.50 b ± 0.50 | 7.00 b ± 0.50 | 7.00 b ± 0.50 |
Disclaimer/Publisher’s Note: The statements, opinions and data contained in all publications are solely those of the individual author(s) and contributor(s) and not of MDPI and/or the editor(s). MDPI and/or the editor(s) disclaim responsibility for any injury to people or property resulting from any ideas, methods, instructions or products referred to in the content. |
© 2024 by the authors. Licensee MDPI, Basel, Switzerland. This article is an open access article distributed under the terms and conditions of the Creative Commons Attribution (CC BY) license (https://creativecommons.org/licenses/by/4.0/).
Share and Cite
Basile, G.; De Luca, L.; Calabrese, M.; Lambiase, G.; Pizzolongo, F.; Romano, R. The Lipidic and Volatile Components of Coffee Pods and Capsules Packaged in an Alternative Multilayer Film. Foods 2024, 13, 759. https://doi.org/10.3390/foods13050759
Basile G, De Luca L, Calabrese M, Lambiase G, Pizzolongo F, Romano R. The Lipidic and Volatile Components of Coffee Pods and Capsules Packaged in an Alternative Multilayer Film. Foods. 2024; 13(5):759. https://doi.org/10.3390/foods13050759
Chicago/Turabian StyleBasile, Giulia, Lucia De Luca, Martina Calabrese, Gianfranco Lambiase, Fabiana Pizzolongo, and Raffaele Romano. 2024. "The Lipidic and Volatile Components of Coffee Pods and Capsules Packaged in an Alternative Multilayer Film" Foods 13, no. 5: 759. https://doi.org/10.3390/foods13050759