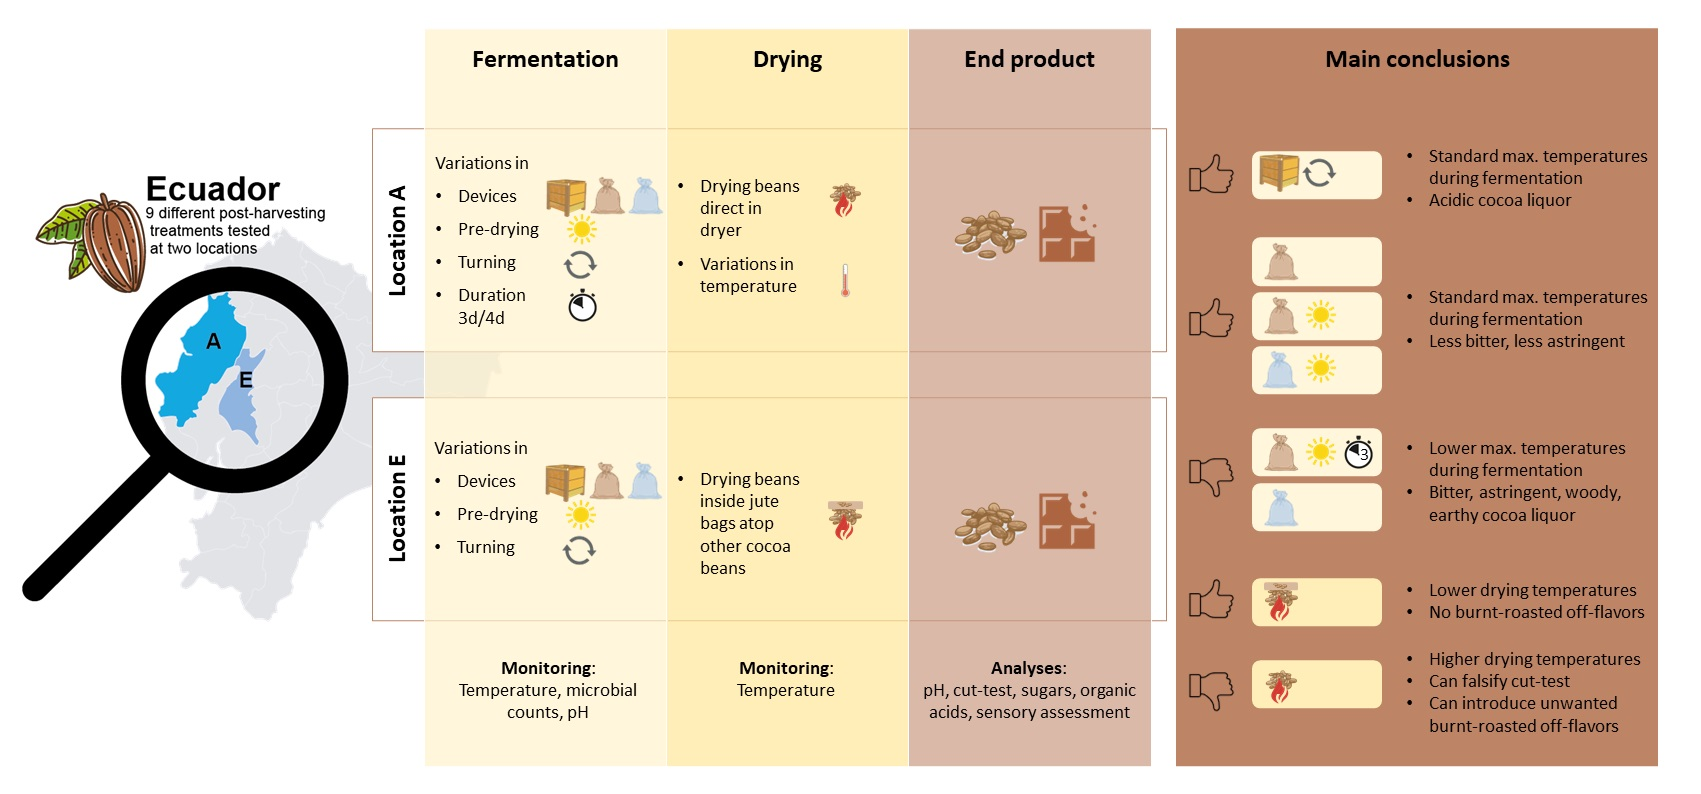
Figure 1.
(a) Mixing of fresh cocoa beans from different farmers on day 1 at location A; (b) wooden box with slits between the boards for pulp drainage, used for variation Wt; (c) different used plastic bags for day 1 until day 2 for all variations except for Wt and the following days for variations P, Pp, and PpT; (d) used jute bags for the fermentation variations J, Jt, Jp, Jpt, JpT, and JpsT.
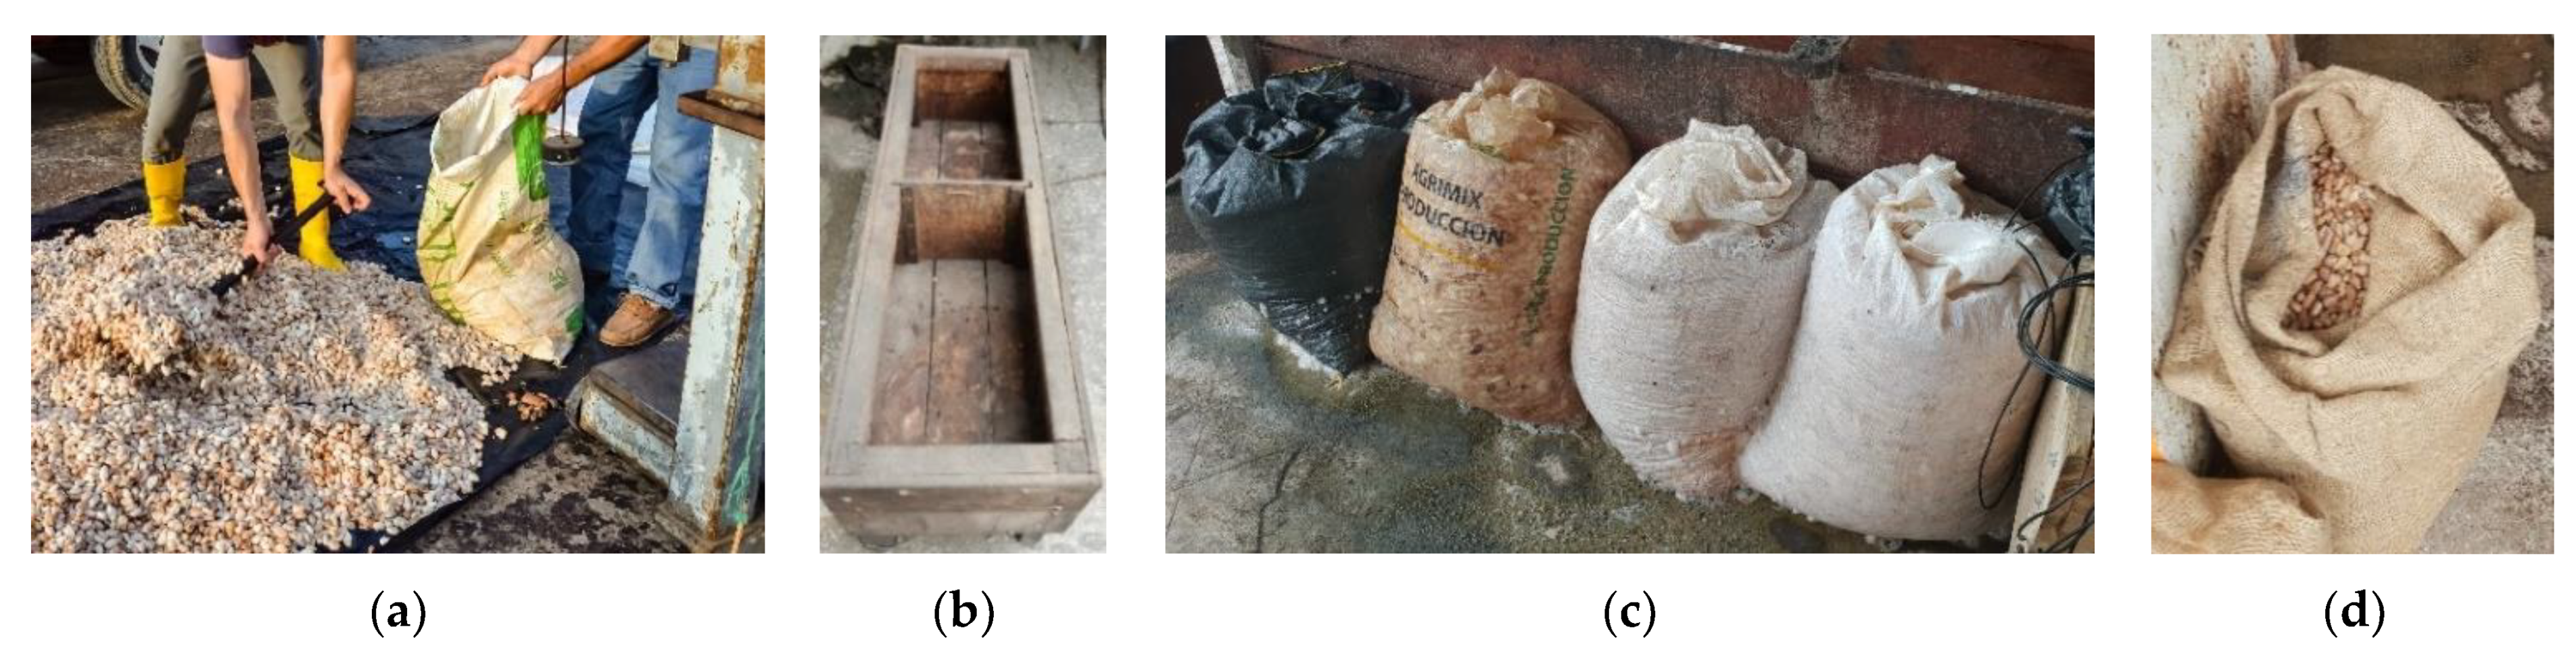
Figure 2.
(a) Pre-drying on concrete floor on day 2; (b) sun-drying on concrete floor on day 3 or 4; (c) artificial drying at location A, variations separated with wooden sticks; (d) beans covered with jute bags during artificial drying at location A; (e) beans drying in jute bags on top of other cocoa beans at location E.
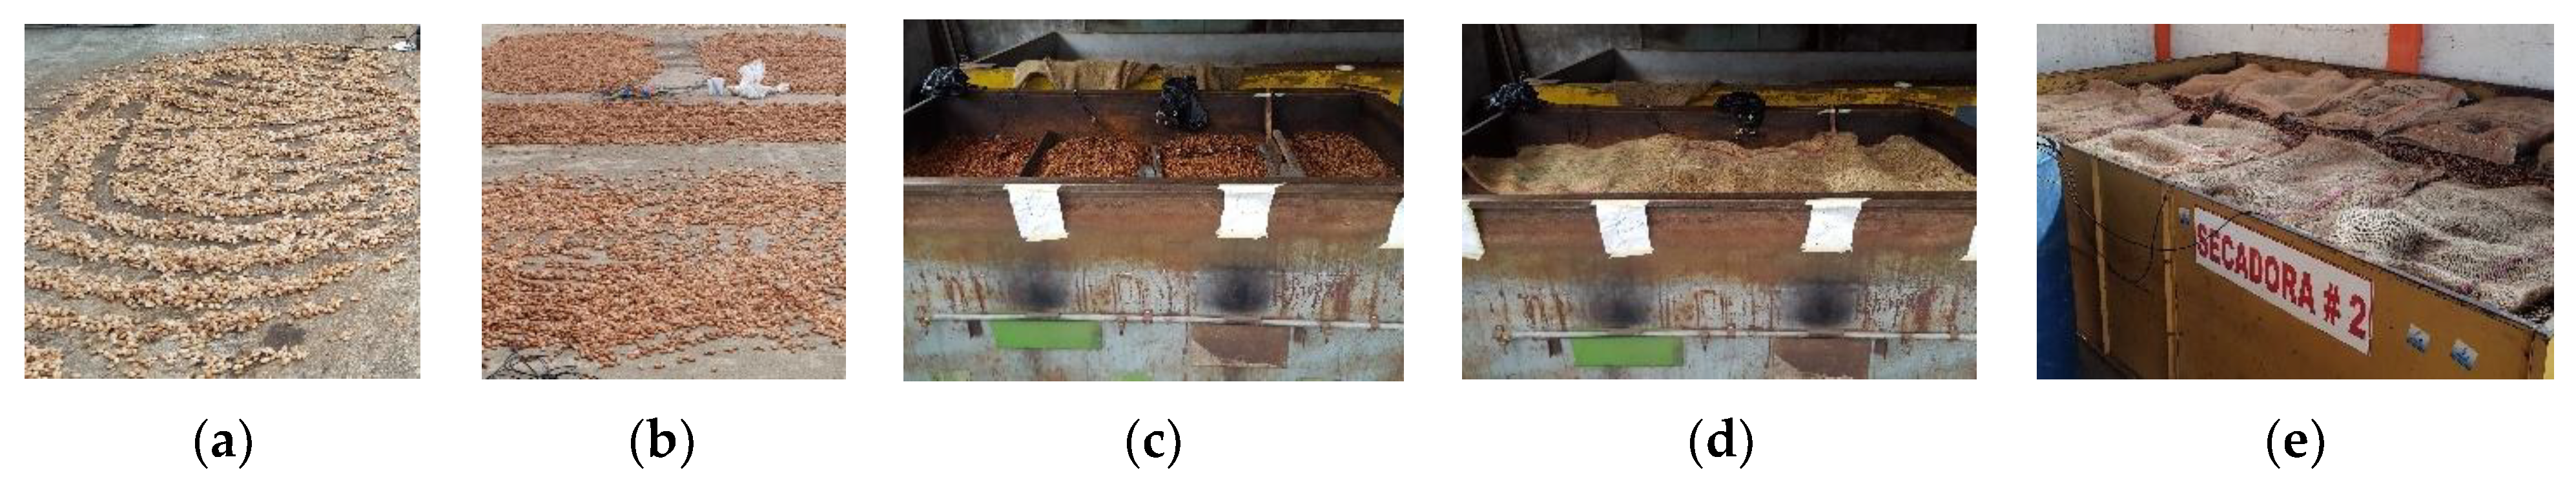
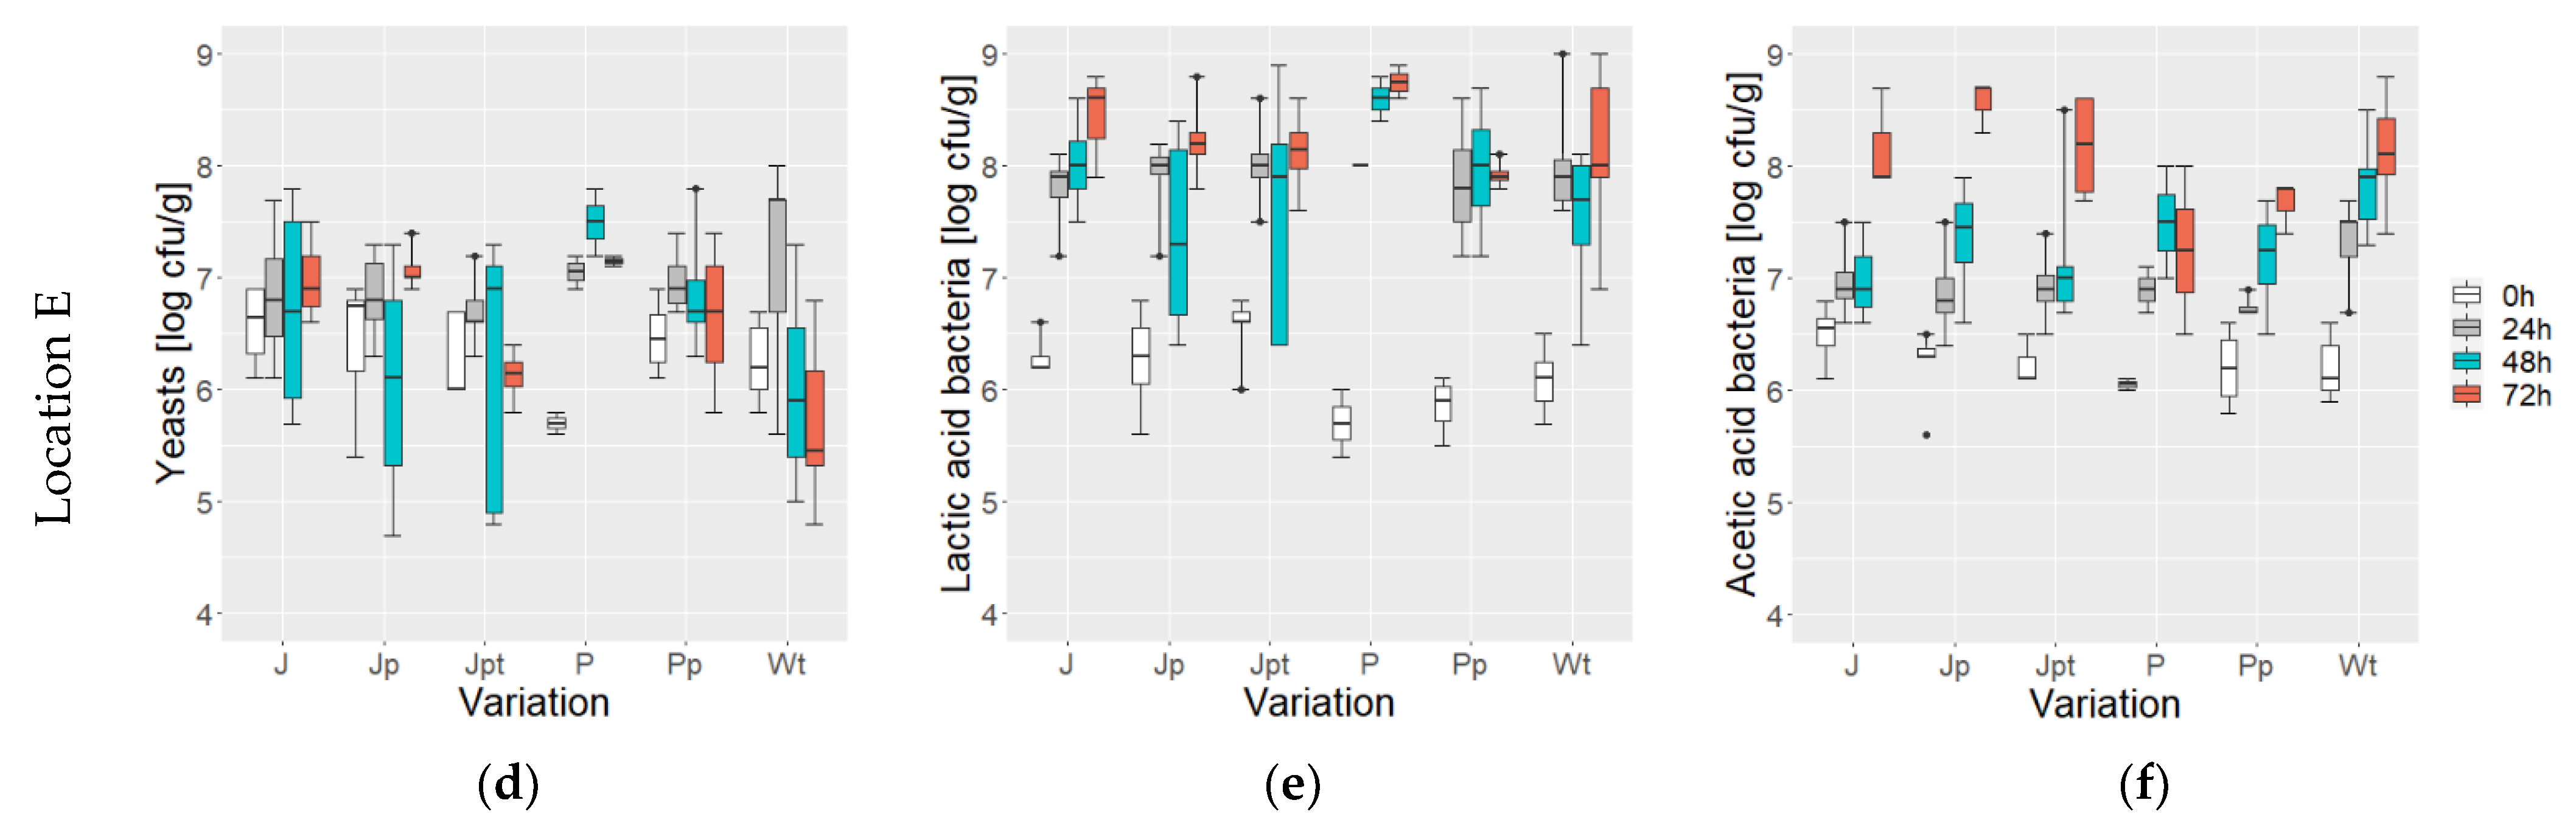
Figure 3.
Cell counts (log cfu/g) of yeast (a,d), lactic acid bacteria (b,e), and acetic acid bacteria (c,f) at the two locations A (a–c) and E (d–f) from variations J (jute bag without pre-drying, without turning), Jp (jute bag with pre-drying)/JpT (jute bag with pre-drying and high drying temperature), JpsT (jute bag with pre-drying, shorter fermentation time and higher drying temperature), Jpt (jute bag with pre-drying and turning), P (plastic bag without pre-drying nor turning), and Pp (plastic bag with pre-drying)/PpT (plastic bag with pre-drying and high drying temperature) recorded after 0 h, 24 h, 48 h, and 72 h of fermentation; n = 1–7.
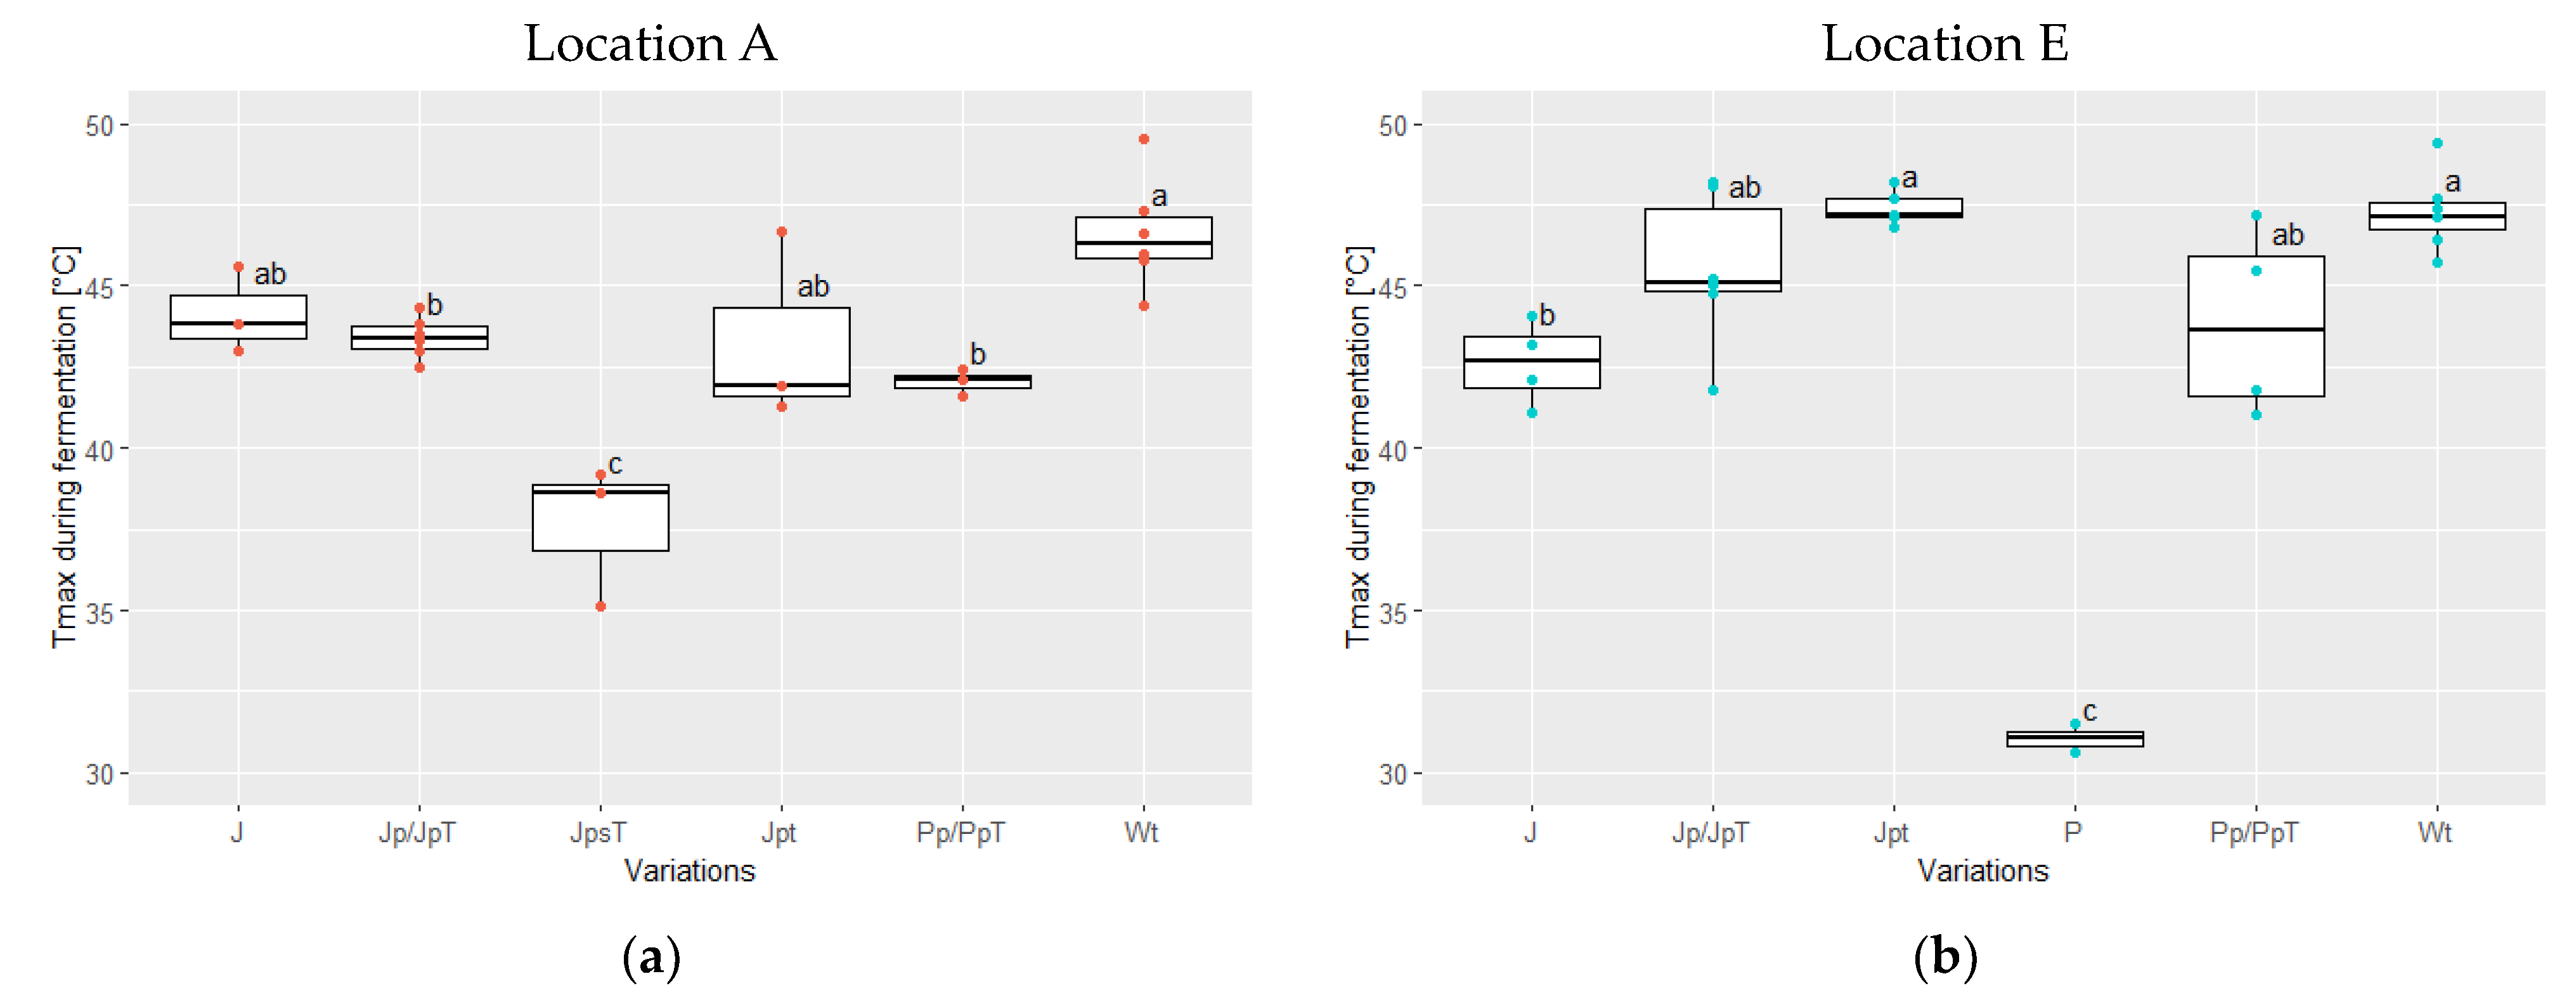
Figure 4.
Reached maximum temperature Tmax (°C) during the fermentations at location A in red (a) and at location E in blue (b) for the following variations: J (jute bag without pre-drying, without turning; location A: n = 3, E: n = 4), Jp (jute bag with pre-drying; E: n = 6)/JpT (jute bag with pre-drying and high drying temperature; A: n = 3), JpsT (jute bag with pre-drying, shorter fermentation time and higher drying temperature; A: n = 3), Jpt (jute bag with pre-drying and turning; A: n = 3, E: n = 5), P (plastic bag without pre-drying nor turning; E: n = 2), Pp (plastic bag with pre-drying; E: n = 4)/PpT (plastic bag with pre-drying and high drying temperature; A: n = 3), and Wt (wooden box with turning; A: n = 6; E: n = 7) (ANOVA with Tukey HSD). Values that do not share the same letter differ significantly (p < 0.05).
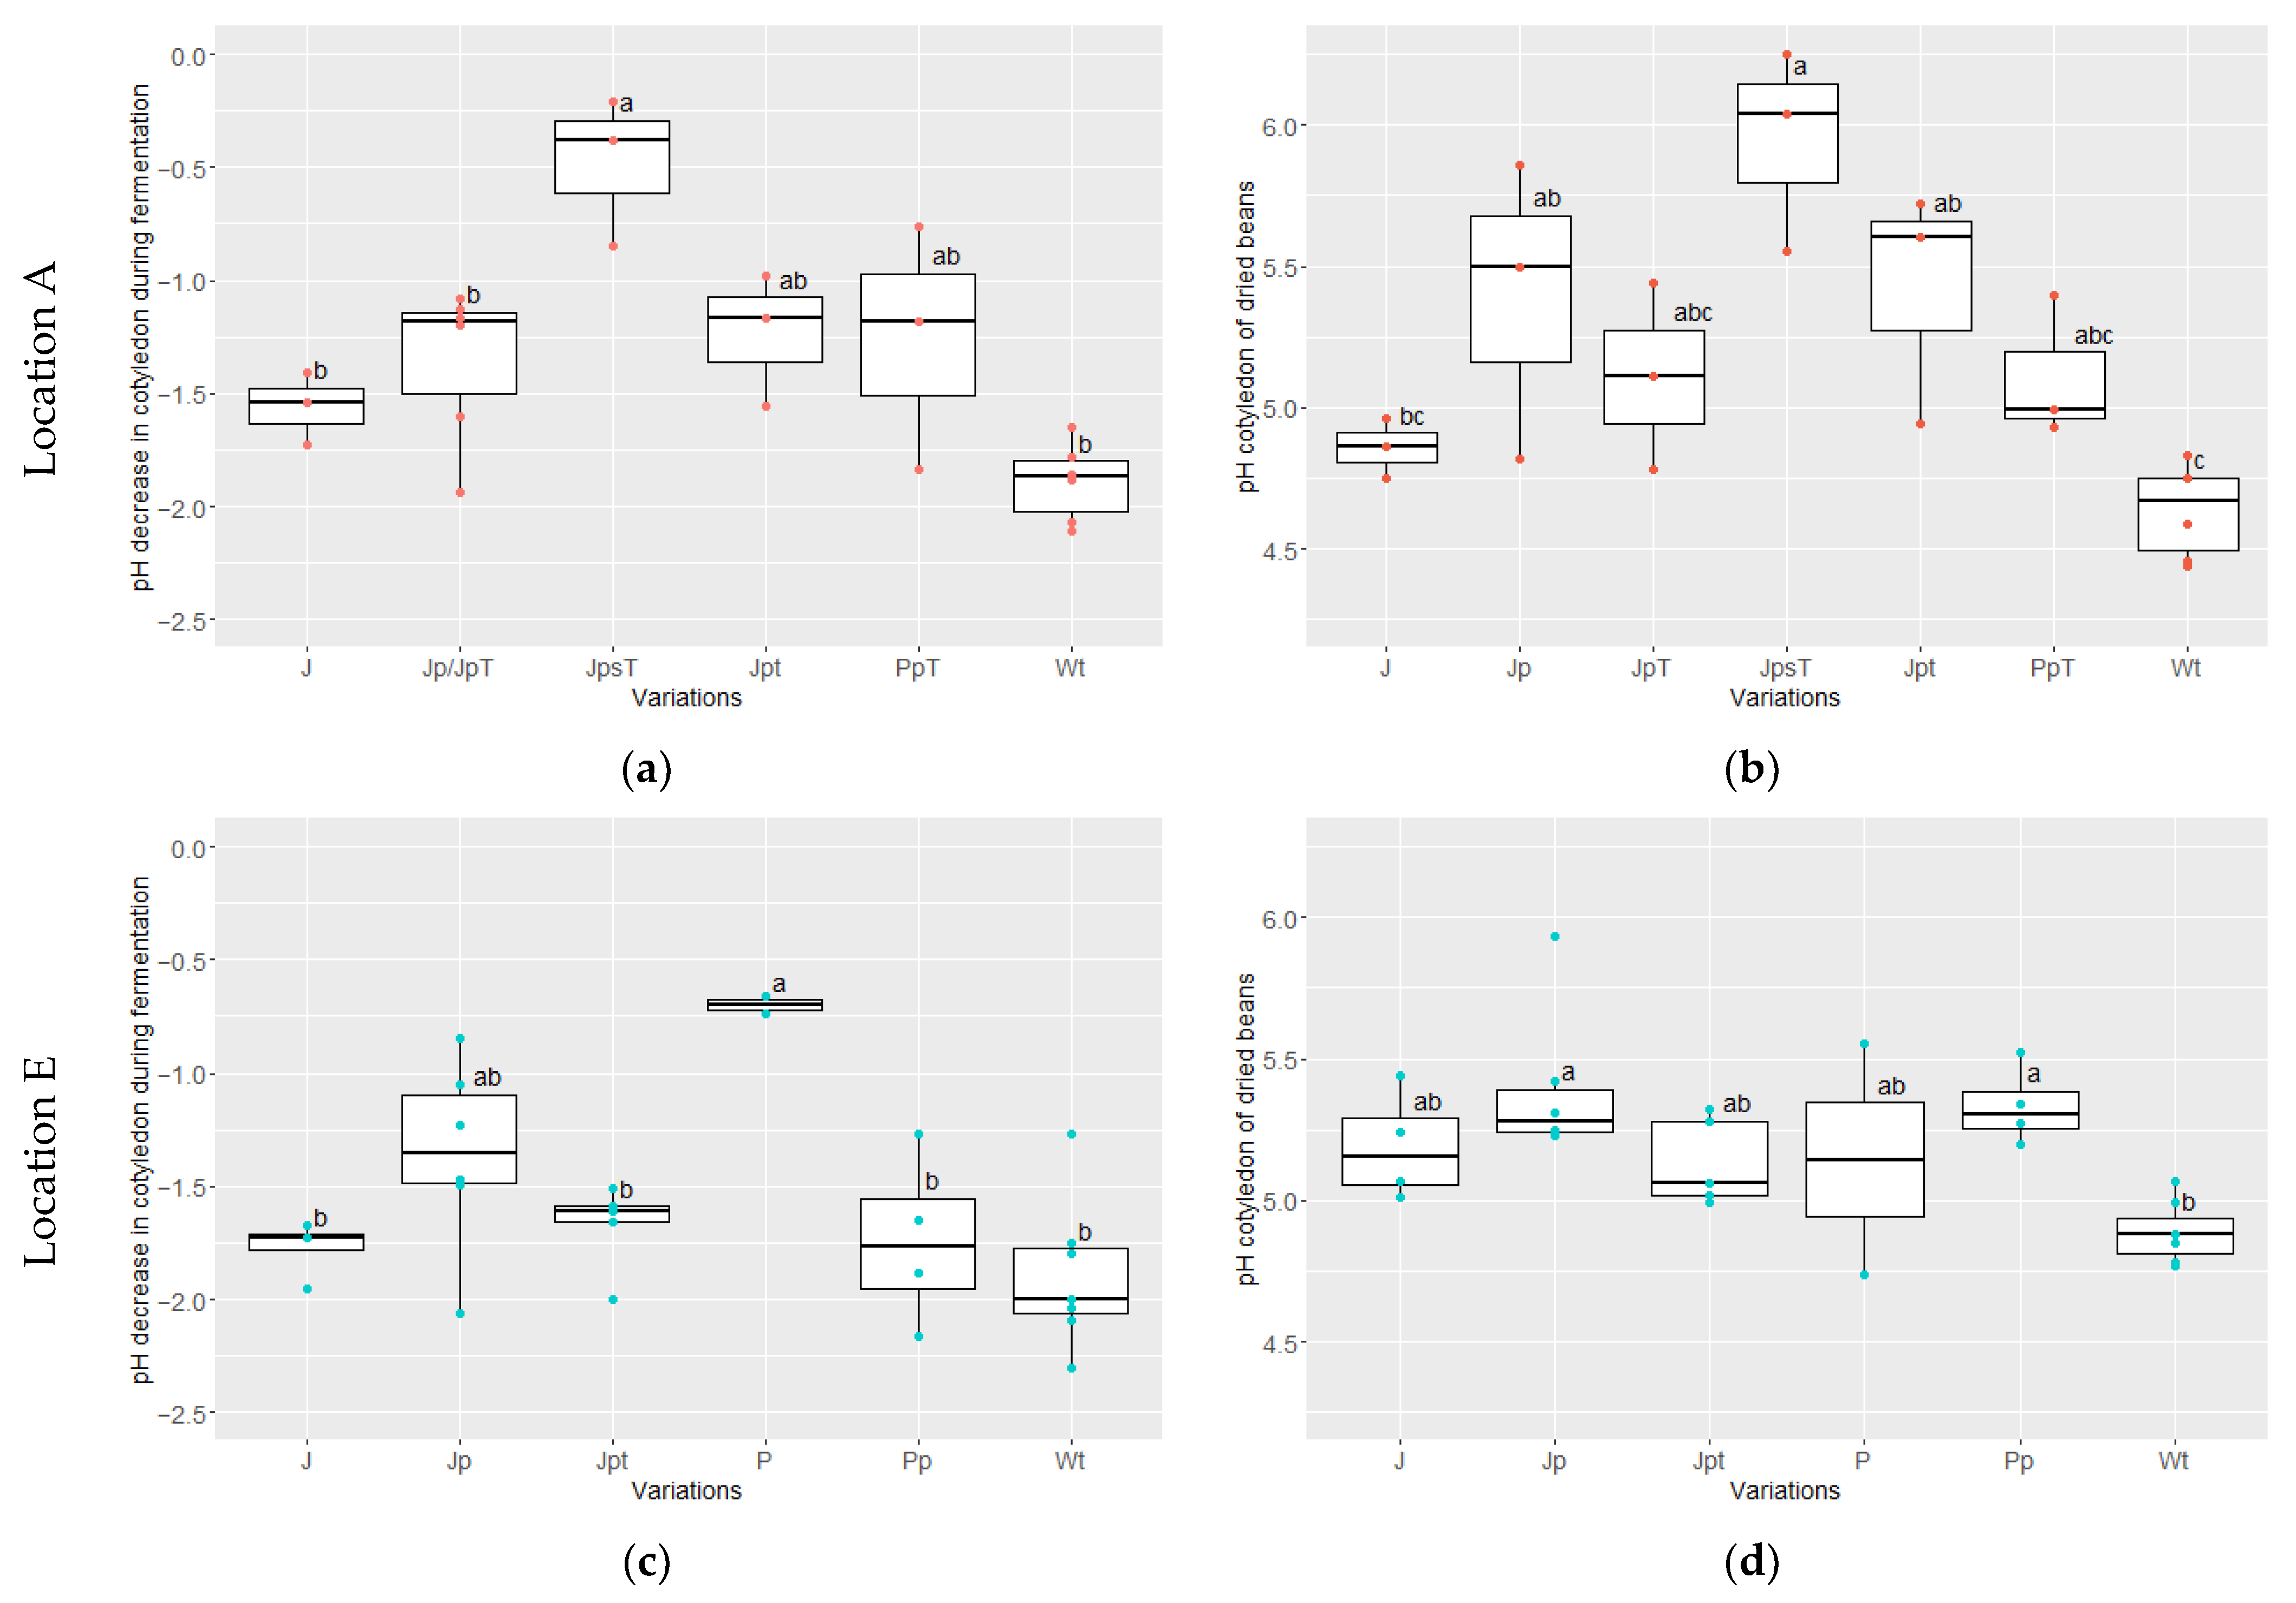
Figure 5.
pH decrease in cotyledon during fermentation (pH final–pH initial) at location A (a) and E (c); pH cotyledon of dried beans at location A in red (b) and E in blue (d) for the following variations: J (jute bag without pre-drying, without turning; location A: n = 3, E: n = 4), Jp (jute bag with pre-drying; E: n = 6)/JpT (jute bag with pre-drying and high drying temperature; A: n = 3), JpsT (jute bag with pre-drying, shorter fermentation time and higher drying temperature; A: n = 3), Jpt (jute bag with pre-drying and turning; A: n = 3, E: n = 5), P (plastic bag without pre-drying nor turning; E: n = 2), Pp (plastic bag with pre-drying; E: n = 4)/PpT (plastic bag with pre-drying and high drying temperature; A: n = 3), and Wt (wooden box with turning; A: n = 6; E: n = 7) at locations A (red) and E (blue) (ANOVA with Tukey HSD). Values that do not share the same letter differ significantly (p < 0.05).
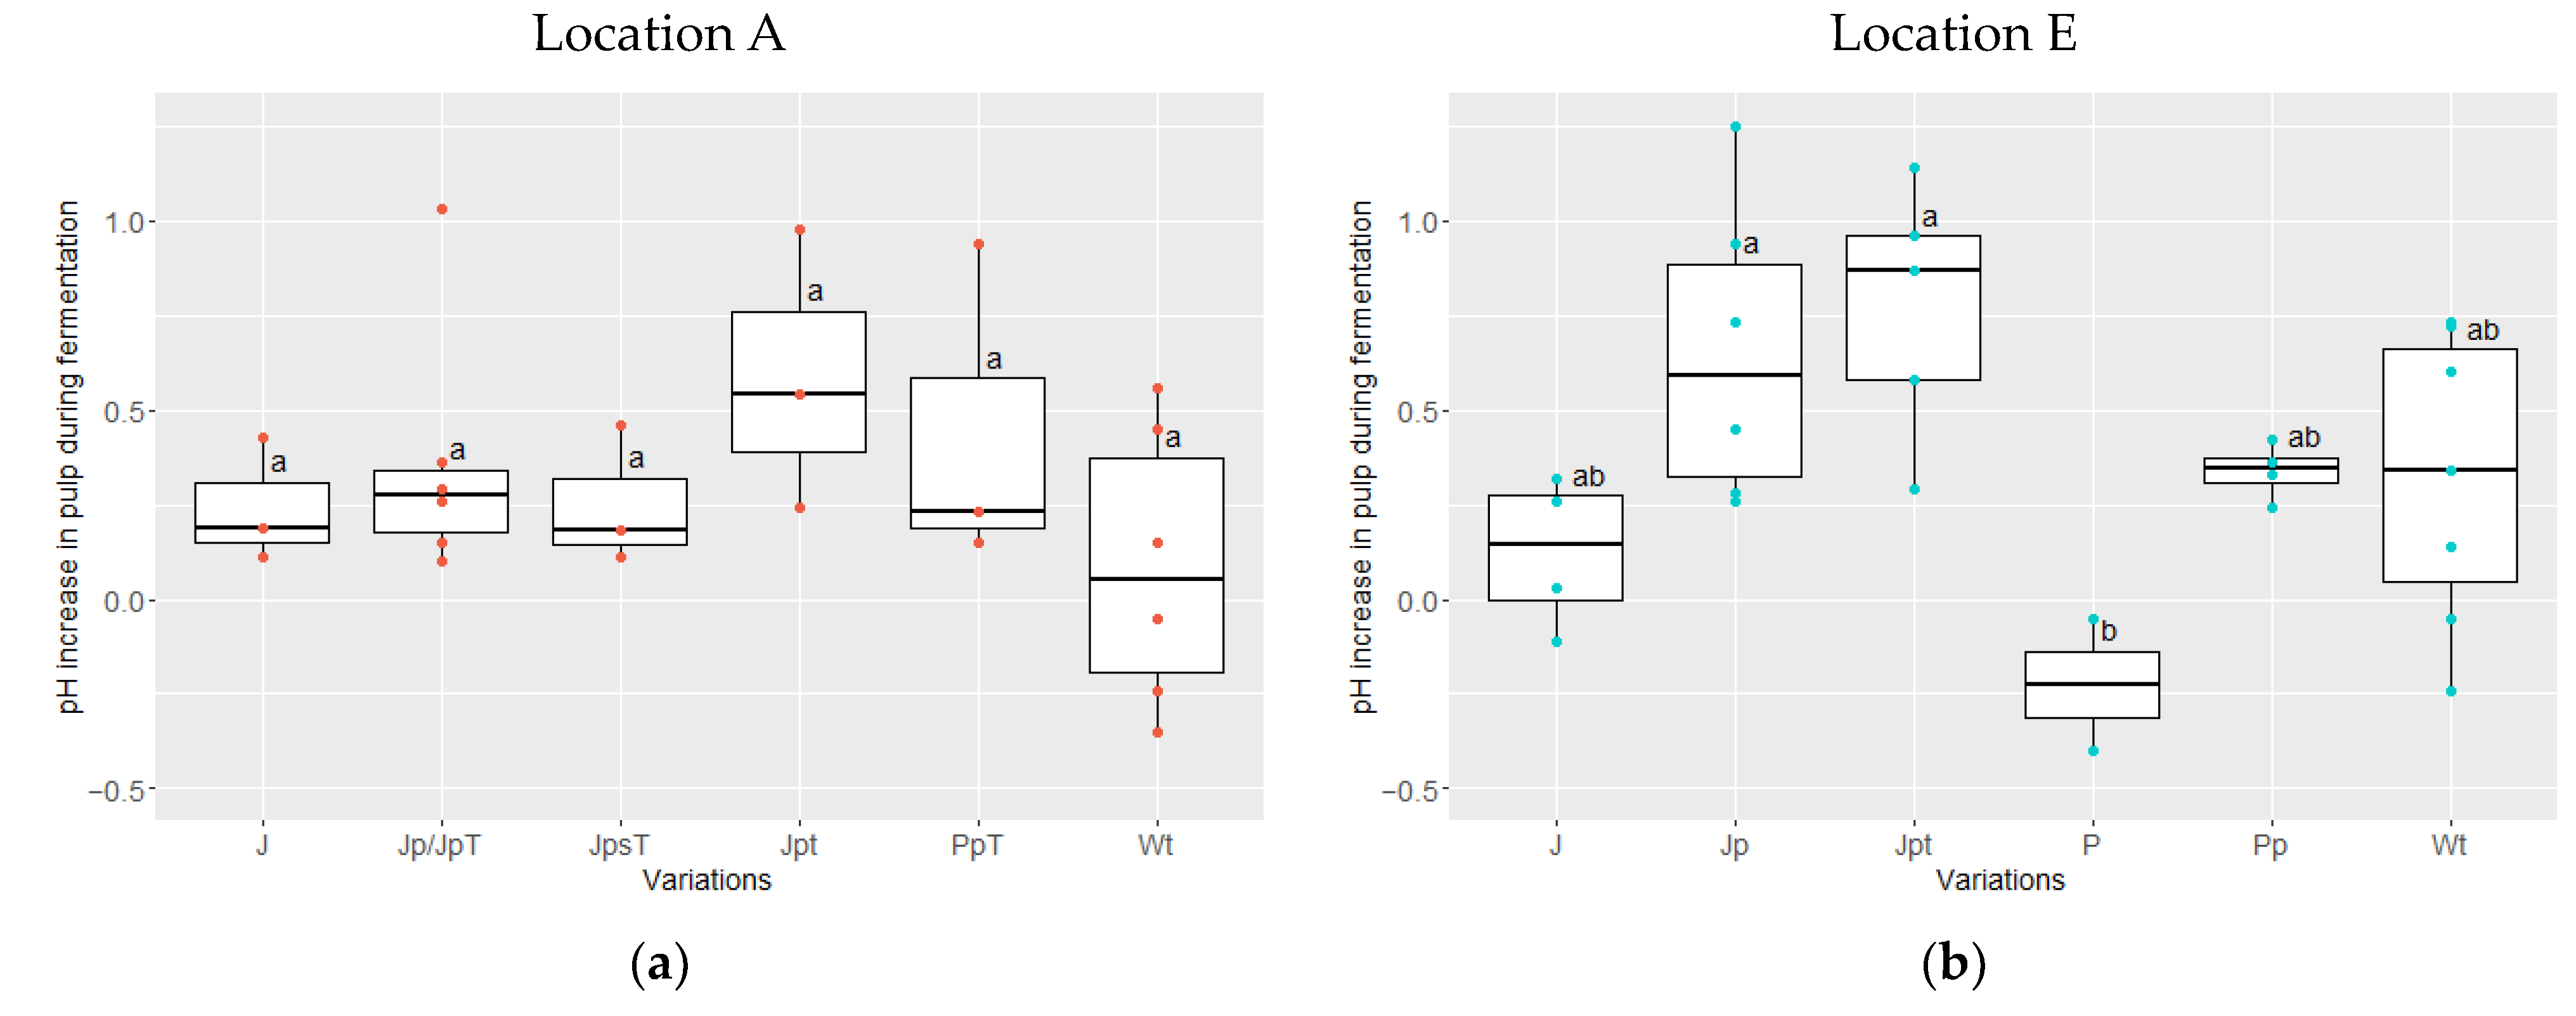
Figure 6.
pH increase in pulp during fermentation (pH final–pH initial) at location A in red (a) and E in blue (b) for the following variations: J (jute bag without pre-drying, without turning; location A: n = 3, E: n = 4), Jp (jute bag with pre-drying; E: n = 6)/JpT (jute bag with pre-drying and high drying temperature; A: n = 3), JpsT (jute bag with pre-drying, shorter fermentation time and higher drying temperature; A: n = 3), Jpt (jute bag with pre-drying and turning; A: n = 3, E: n = 5), P (plastic bag without pre-drying nor turning; E: n = 2), Pp (plastic bag with pre-drying; E: n = 4)/PpT (plastic bag with pre-drying and high drying temperature; A: n = 3), and Wt (wooden box with turning; A: n = 6; E: n = 7) (ANOVA with Tukey HSD). Values that do not share the same letter differ significantly (p < 0.05).
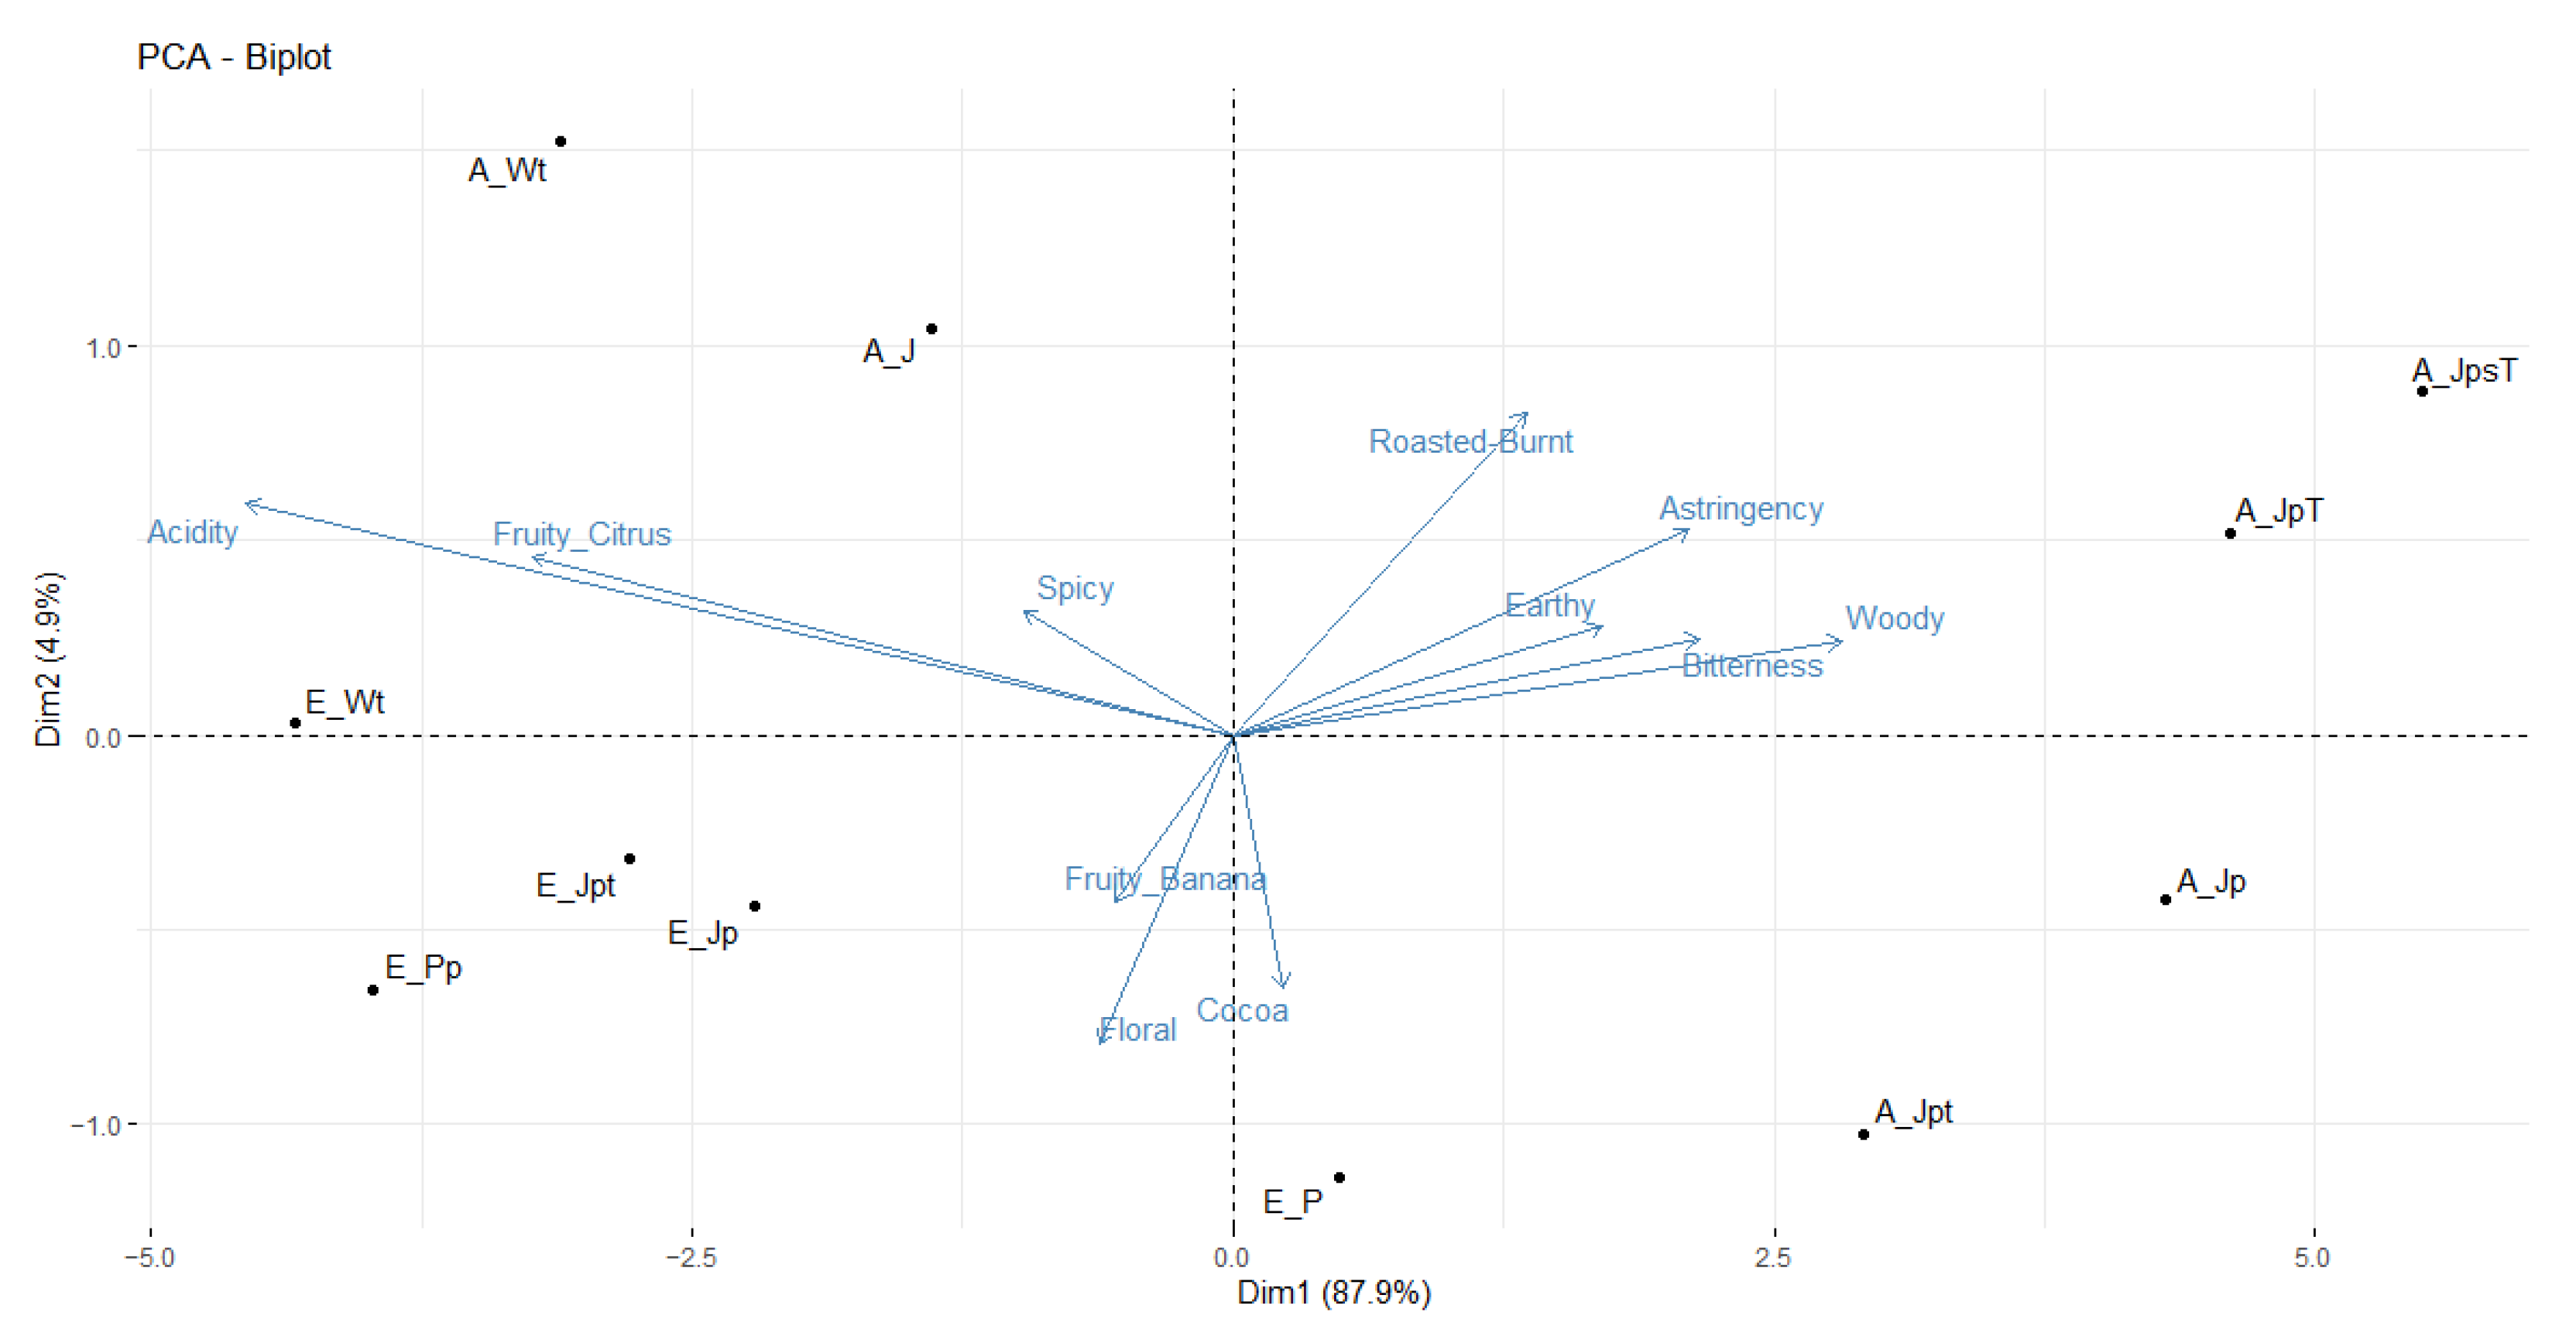
Figure 7.
Principle component analysis (PCA) based on sensory descriptors that discriminated samples (J (jute bag without pre-drying, without turning), Jp (jute bag with pre-drying), JpT (jute bag with pre-drying and high drying temperature), JpsT (jute bag with pre-drying, shorter fermentation time and higher drying temperature), Jpt (jute bag with pre-drying and turning), P (plastic bag without pre-drying nor turning), Pp (plastic bag with pre-drying), and Wt (wooden box with turning) at locations A and E) significantly.
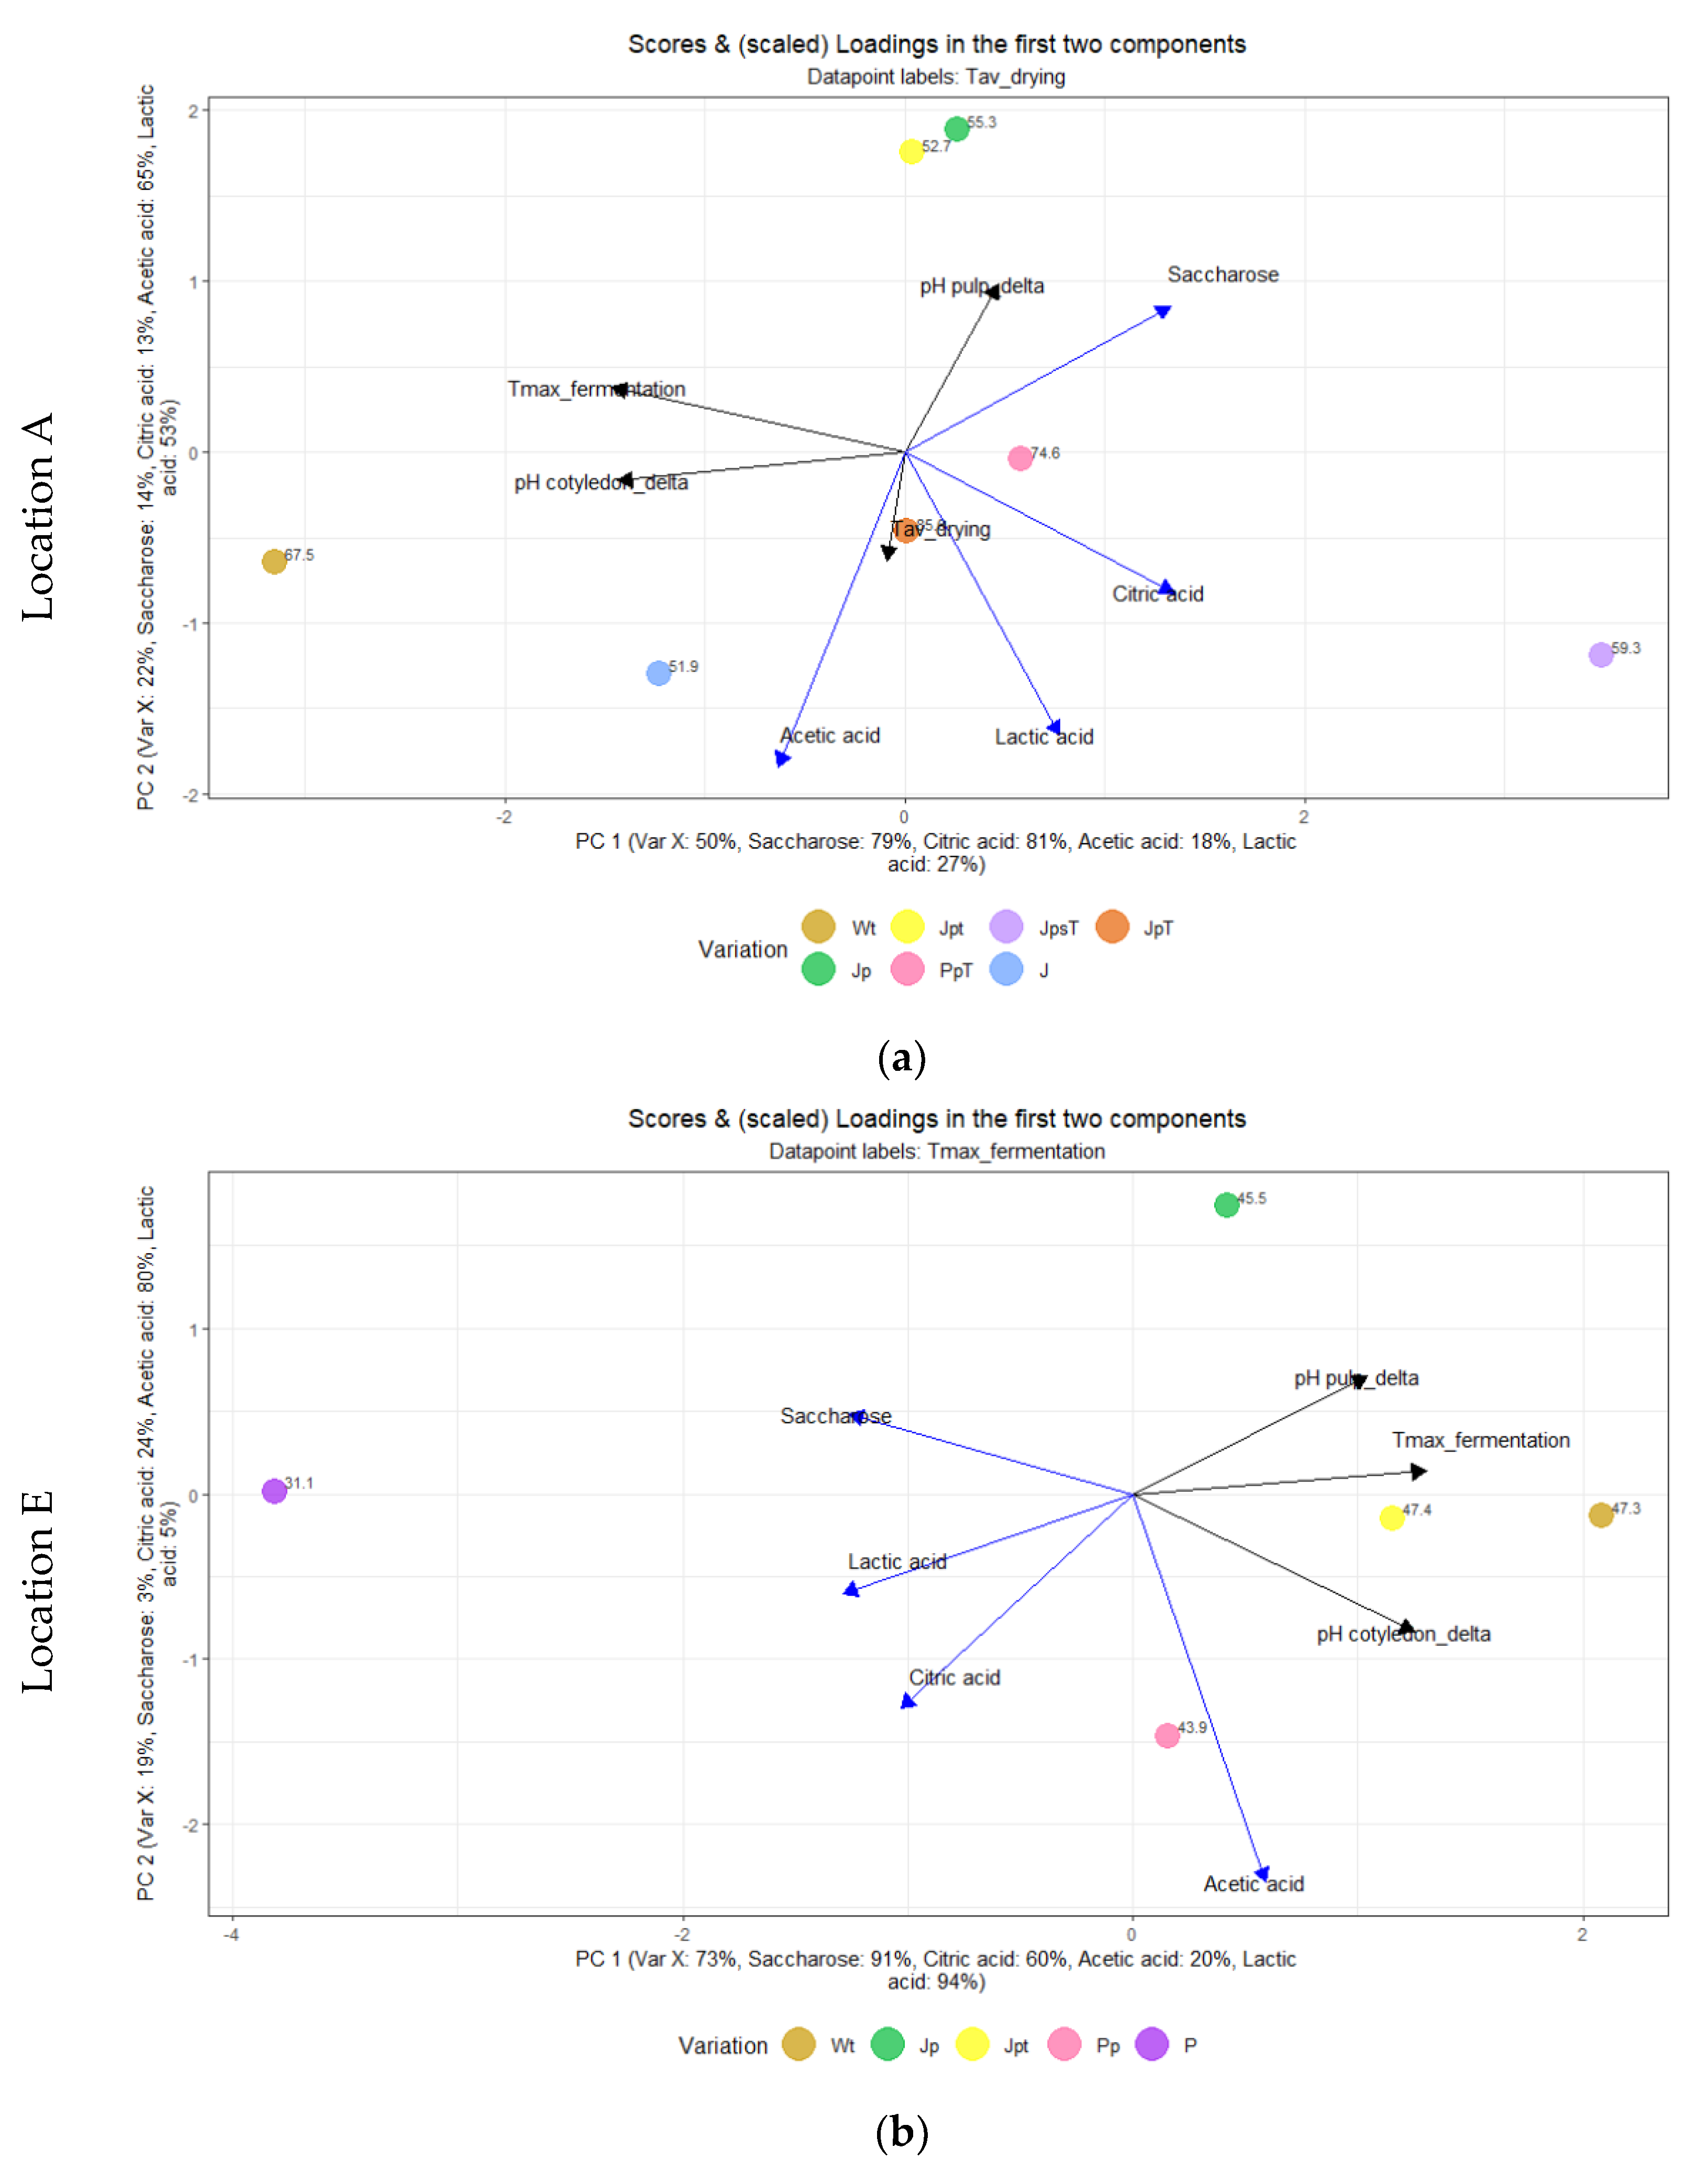
Figure 8.
(a) Partial least squares (PLS) of predictors (black; Tmax during fermentation, Tav during drying, pH cotyledon_delta between initial and end of fermentation, and pH pulp_delta between initial and end of fermentation) and response variables (blue; Citric acid, Lactic acid, Acetic acid, and Saccharose) of fermentation variations J, Jp, JpsT, Jpt, JpT, PpT, and Wt at location A; (b) Partial least squares (PLS) of predictors (black; Tmax during fermentation, pH cotyledon_delta between initial and end of fermentation, and pH pulp_delta between initial and end of fermentation) and response variables (blue; Citric acid, Lactic acid, Acetic acid, and Saccharose) of fermentation variations Jp, Jpt, P, Pp, and Wt at location E.
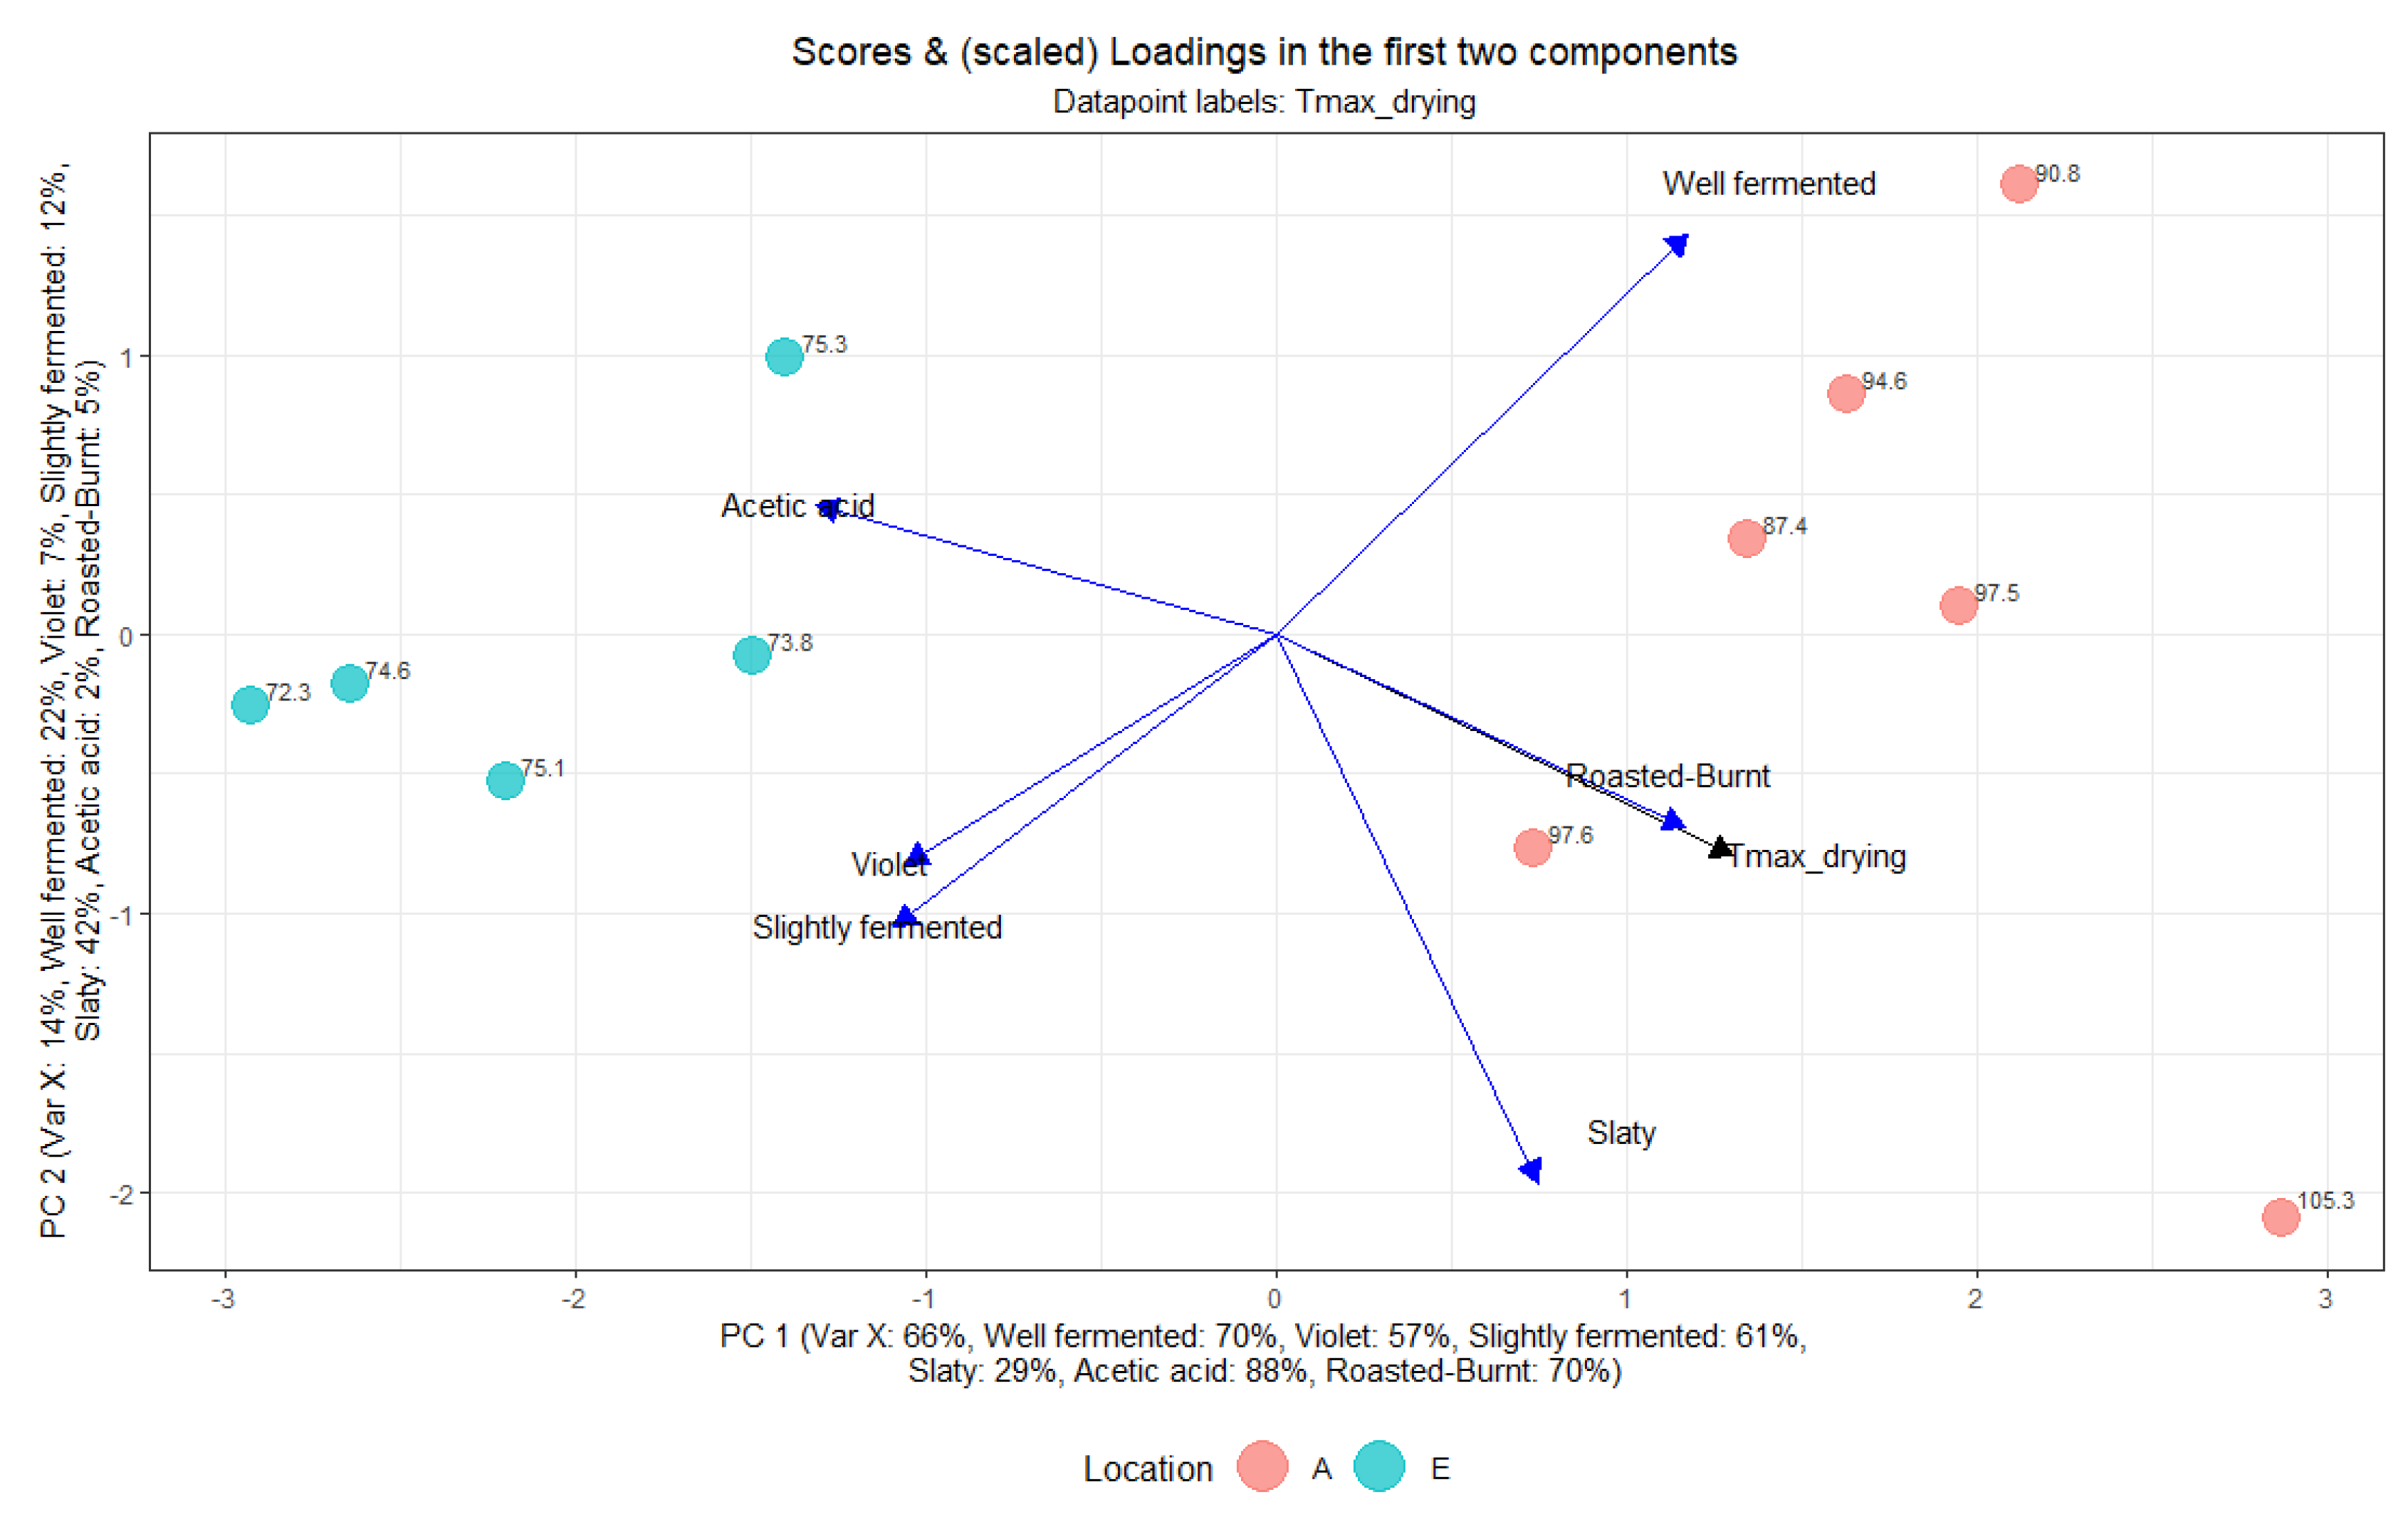
Figure 9.
Partial least squares (PLS) of predictor (black; Tmax during drying) and response variables (blue; Well fermented, Slaty, Violet, Slightly fermented, Acetic acid, and Roasted-Burnt) at locations A and E.
Figure 9.
Partial least squares (PLS) of predictor (black; Tmax during drying) and response variables (blue; Well fermented, Slaty, Violet, Slightly fermented, Acetic acid, and Roasted-Burnt) at locations A and E.
Table 1.
Overview of investigated post-harvest process variations.
Table 1.
Overview of investigated post-harvest process variations.
| Fermentation Variation | Total Runs 1 per Location | Device 2 | Pre-Drying on Day 1 | Turning on Day 2 | Drying Temperature 3 | Fermentation Time 4 |
|---|
| Wt (control) | A: n = 6, E: n = 7 | Wooden Box | without | with 5 | low | d1–d4 |
| J | A: n = 3, E: n = 4 | Plastic + Jute | without | without | low | d1–d4 |
| Jp | A: n = 3, E: n = 6 | Plastic + Jute | with | without | low | d1–d4 |
| JpT | A: n = 3 | Plastic + Jute | with | without | high | d1–d4 |
| JpsT | A: n = 3 | Plastic + Jute | with | without | high | d1–d3 |
| Jpt | A: n = 3, E: n = 5 | Plastic + Jute | with | with | low | d1–d4 |
| P | E: n = 2 | Plastic + Plastic | without | without | low | d1–d4 |
| Pp | E: n = 4 | Plastic + Plastic | with | without | low | d1–d4 |
| PpT | A: n = 3 | Plastic + Plastic | with | without | high | d1–d4 |
Table 2.
Definition of flavor attributes and scales.
Table 2.
Definition of flavor attributes and scales.
| Attribute | Definition | Scale |
|---|
| Acidic | Basic taste, triggered, e.g., by citric, acetic, or lactic acid solution | Very weak–very strong |
| Bitter | Basic taste, triggered, e.g., by caffeine solution |
| Fruity-Citrus | Aroma reminiscent of citrus fruits such as lemon or orange |
| Fruity-Banana | Aroma reminiscent of banana (dried) |
| Floral | Aroma reminiscent of dried flowers (hay flower), tea (orange blossom), or orange blossom soap |
| Nutty | Aroma reminiscent of unroasted nuts with or without skins as well as raw cocoa bean (without pungent acidity) |
| Woody | Aroma and mouthfeel reminiscent of wet wood (wooden ice cream sticks) |
| Spicy | Aroma reminiscent of pepper |
| Cocoa | Aroma reminiscent of dark chocolate |
| Roasted-burnt | Aroma reminiscent of toasted/slightly burnt cacao nibs or burnt bread | Not roasted–roasted-burnt |
| Earthy | Aroma that is musty, reminiscent of wet earth | Very weak–very strong |
| Astringent | Dry, rough, or furry mouthfeel on the tongue and palate, triggered, e.g., by alum or tannin solution |
Table 3.
Drying temperatures (maximal measured temperature Tmax and average temperature Tav) at location A and E and from lower (Wt, J, Jp, and Jpt) and higher dried (PpT, JpT, and JpsT) samples at location A.
Table 3.
Drying temperatures (maximal measured temperature Tmax and average temperature Tav) at location A and E and from lower (Wt, J, Jp, and Jpt) and higher dried (PpT, JpT, and JpsT) samples at location A.
| Location/Samples | Tmax during Drying 1 | Tav during Drying 2 |
|---|
| A | 95.2 ± 13.7 °C | 64.3 ± 14.7 °C |
| E | 74.7 ± 6.5 °C | 48.0 ± 4.2 °C |
| A_Wt, J, Jp, Jpt | 94.5 ± 15.3 °C | 59.0 ± 12.8 °C |
| A_PpT, JpT, JpsT | 96.3 ± 11.3 °C | 73.2 ± 13.8 °C |
Table 4.
Sugars (Saccharose, Glucose, Fructose) and organic acids (citric acid, lactic acid, acetic acid) in mg/g in dried cocoa bean samples from variations J (jute bag without pre-drying, without turning; location A: n = 2), Jp (jute bag with pre-drying; A: n = 1, E: n = 2)/JpT (jute bag with pre-drying and high drying temperature; A: n = 2), JpsT (jute bag with pre-drying, shorter fermentation time and higher drying temperature; A: n = 2), Jpt (jute bag with pre-drying and turning; A, E: n = 2), P (plastic bag without pre-drying nor turning; E: n = 2), Pp (plastic bag with pre-drying; E: n = 2)/PpT (plastic bag with pre-drying and high drying temperature; A: n = 2), and Wt (wooden box with turning; A, E: n = 2) at locations A and E.
| Location | Variation | Saccharose | Glucose | Fructose | Citric Acid | Lactic Acid | Acetic Acid |
|---|
| A | Wt | 6.1 ± 2.9 | 2.4 ± 0.8 | 7.5 ± 2.6 | 3.3 ± 0.2 | 1 ± 0.1 | 14.8 ± 3.4 |
| J | 10.1 ± 0.6 | 2.5 ± 0.8 | 5.5 ± 1 | 3.5 ± 0.0 | 2 ± 0.7 | 15.7 ± 1.6 |
| Jp | 17.4 | 0.9 | 1.2 | 3.5 | 1.2 | 3.3 |
| Jpt | 15.3 ± 1.0 | 2.3 ± 1.1 | 5.9 ± 1.9 | 3.6 ± 0.4 | 1 ± 0.1 | 7.6 ± 1.2 |
| JpT | 13.8 ± 2.2 | 1.1 ± 1.1 | 3.3 ± 2.1 | 3.8 ± 0.6 | 2 ± 0.6 | 9.8 ± 2.9 |
| PpT | 17.5 ± 3.5 | 1.6 ± 0.2 | 5.3 ± 0.1 | 4.1 ± 0.4 | 1.4 ± 0.2 | 12.9 ± 3.9 |
| JpsT | 18.4 ± 1.2 | 1.8 ± 0.2 | 3.3 ± 1.3 | 5.2 ± 0.6 | 2.2 ± 0.2 | 10.1 ± 6.3 |
| E | Wt | 1.9 ± 1.9 | 0.7 ± 0.7 | 5.2 ± 5.2 | 13.5 ± 4.4 | 1.9 ± 0.7 | 36.6 ± 12.7 |
| Jp | 8.6 ± 2.2 | 3.3 ± 0.5 | 8.2 ± 0.9 | 15 ± 7.1 | 2.7 ± 1.4 | 24.1 ± 6.2 |
| Jpt | 6.2 ± 2.1 | 3.4 ± 0.4 | 7.8 ± 1.4 | 17.9 ± 2.5 | 2.6 ± 1.3 | 35 ± 0.6 |
| P | 14.2 ± 0.8 | 1.7 ± 0.8 | 8.8 ± 1.5 | 21.2 ± 2.6 | 8.6 ± 1.6 | 27.9 ± 9.6 |
| Pp | 7 ± 1.2 | 2.9 ± 0.0 | 8.1 ± 1.4 | 19.8 ± 0.1 | 4.8 ± 0.1 | 40.3 ± 5.8 |
Table 5.
Cut-test performed with 100 dried beans from variations J (jute bag without pre-drying, without turning; location A: n = 3, E: n = 4), Jp (jute bag with pre-drying; E: n = 6)/JpT (jute bag with pre-drying and high drying temperature; A: n = 3), JpsT (jute bag with pre-drying, shorter fermentation time and higher drying temperature; A: n = 3), Jpt (jute bag with pre-drying and turning; A: n = 3, E: n = 5), P (plastic bag without pre-drying nor turning; E: n = 2), Pp (plastic bag with pre-drying; E: n = 4)/PpT (plastic bag with pre-drying and high drying temperature; A: n = 3), and Wt (wooden box with turning; A: n = 6; E: n = 7) at locations A and E. The beans were classified as well-fermented, slightly fermented, violet, slaty, or moldy. Well-fermented and slightly fermented values (%) are colored from green to red according to the highest and lowest mean, respectively. Violet, slaty, and moldy values (%) are colored from green to red according to the lowest and highest mean, respectively.
| Location | Variation | Well-Fermented | Slightly Fermented | Violet | Slaty | Moldy |
|---|
| A | Wt | 62.7 ± 27 | 30.5 ± 27 | 6.2 ± 7 | 0.7 ± 1.1 | 0 |
| J | 62.7 ± 32.4 | 24.3 ± 22.9 | 12 ± 9.8 | 1 ± 1.4 | 0 |
| Jp | 55.3 ± 29 | 27.7 ± 17.1 | 10 ± 13.4 | 3.7 ± 2.6 | 0 |
| Jpt | 72.3 ± 20.2 | 20 ± 13.6 | 7.3 ± 7.1 | 0.3 ± 0.5 | 0 |
| JpT | 56 ± 23.3 | 37.3 ± 16.4 | 6 ± 7.1 | 0.7 ± 0.9 | 0 |
| PpT | 61 ± 28.6 | 33 ± 25.2 | 3 ± 4.2 | 0.3 ± 0.5 | 0 |
| JpsT | 39 ± 29.7 | 53.3 ± 25 | 7.3 ± 9 | 0.3 ± 0.5 | 0 |
| E | Wt | 34.4 ± 17.7 | 48.4 ± 19.4 | 16 ± 12.1 | 0.3 ± 0.5 | 0.1 ± 0.3 |
| J | 28 ± 9.1 | 51.8 ± 12.8 | 18.8 ± 14.5 | 1 ± 1.7 | 0.3 ± 0.4 |
| Jp | 31.5 ± 12.6 | 53 ± 15.8 | 15.3 ± 13.1 | 0.2 ± 0.4 | 0 |
| Jpt | 49.4 ± 12.7 | 39.8 ± 16.3 | 10 ± 5.8 | 0.4 ± 0.5 | 0.2 ± 0.4 |
| P | 42.5 ± 24.5 | 41 ± 12 | 15.5 ± 11.5 | 0.5 ± 0.5 | 0.5 ± 0.5 |
| Pp | 30.3 ± 5.4 | 57.3 ± 11.4 | 12.3 ± 8.8 | 0.5 ± 0.9 | 0 |
Table 6.
Sensory assessment and sensory description of samples from variations J (jute bag without pre-drying, without turning), Jp (jute bag with pre-drying), JpT (jute bag with pre-drying and high drying temperature), JpsT (jute bag with pre-drying, shorter fermentation time and higher drying temperature), Jpt (jute bag with pre-drying and turning), P (plastic bag without pre-drying nor turning), Pp (plastic bag with pre-drying), and Wt (wooden box with turning) at locations A and E, n = 2. The ratings refer to a 10-cm/10-point scale. Values followed by the same superscript letter within row of each description are not significantly different (p < 0.001).
| Location | Variations | Acidity | Bitterness | Fruity, Citrus | Fruity, Banana | Floral | Nutty | Woody | Spicy | Cocoa | Roasted-Burnt | Earthy | Astringency |
|---|
| <0.001 | <0.001 | <0.001 | 0.007 | 0.013 | 0.272 | <0.001 | 0.015 | 0.001 | <0.001 | <0.001 | <0.001 |
|---|
| A | Wt | 7.3 ab | 4.6 cde | 4.3 a | 1.1 a | 2.4 a | 3.2 | 2.1 cd | 3.1 a | 2.4 ab | 4.0 ab | 1.2 c | 4.4 bcde |
| J | 5.7 bc | 4.3 cde | 3.6 ab | 1.4 a | 2.2 a | 3 | 2.2 cd | 2.6 a | 2.8 ab | 4.6 ab | 1.4 bc | 5.1 bcde |
| Jp | 1.6 d | 5.9 abc | 0.6 d | 0.9 a | 2.2 a | 4.2 | 4.4 ab | 1.7 a | 3.3 ab | 4.5 ab | 2.5 abc | 5.8 abc |
| Jpt | 2.5 d | 5.8 abcd | 1.0 cd | 0.9 a | 2.8 a | 3.9 | 3.4 bc | 1.6 a | 3.7 a | 4.0 ab | 2.2 abc | 5.5 abcd |
| JpT | 2.1 d | 6.6 ab | 0.7 d | 1.4 a | 2.3 a | 4.8 | 5.1 ab | 1.8 a | 2.4 ab | 5.0 a | 3.1 ab | 6.1 ab |
| JpsT | 1.9 d | 7.1 a | 0.6 d | 1.1 a | 2.6 a | 4.6 | 5.4 a | 1.6 a | 2.1 b | 4.9 a | 3.8 a | 7.1 a |
| E | Wt | 7.4 a | 4.0 de | 4.6 a | 1.5 a | 3.5 a | 3.6 | 1.2 d | 2.9 a | 2.4 ab | 3.0 b | 1.2 c | 3.5 e |
| Jp | 6.1 ab | 3.6 e | 2.8 abc | 1.3 a | 2.7 a | 3.4 | 1.9 cd | 2.3 a | 2.9 ab | 3.4 ab | 1.4 bc | 3.8 de |
| Jpt | 6.3 ab | 4.8 bcde | 3.7 ab | 2.0 a | 3.5 a | 3.6 | 1.6 cd | 2.9 a | 2.1 b | 2.7 b | 1.3 c | 4.3 cde |
| P | 4.3 c | 5.3 abcde | 2.3 bd | 2.4 a | 4.0 a | 3.6 | 3.4 bc | 2.3 a | 3.3 ab | 3.7 ab | 1.9 bc | 5.0 bcde |
| Pp | 7.0 ab | 3.8 e | 4.6 a | 2.4 a | 3.7 a | 3.9 | 1.9 cd | 2.3 a | 2.7 ab | 2.8 b | 1.0 c | 3.7 e |

 ,
, 


