
Effect of Heat Transfer Medium and Rate on Freezing Characteristics, Color, and Cell Structure of Chestnut Kernels
Abstract
:
1. Introduction
2. Materials and Methods
2.1. Sample Preparation
2.2. Regents
2.3. Freezing Characterization
2.4. Heat Transfer Characteristics
2.5. Weight Loss (WL) and Distribution of Water States
2.6. Color Analysis
2.7. Hardness Quality
2.8. Nutritional Ingredient
2.9. Polyphenol Oxidase (PPO) Activity and Peroxidase (POD) Activity
2.10. Microscopic Observations
2.11. Statistical Analysis
3. Results
3.1. Thermal Transition of Fresh Chestnut Kernels Containing Freezable Water
3.2. Freezing Characteristics
3.3. Weight Loss and the Distribution of Water States
3.4. Change in Color-Related Factors
3.5. Vc and Soluble Sugar Changes
3.6. Hardness and Microstructure Changes
3.7. Multivariate Data Analysis
4. Conclusions
Author Contributions
Funding
Institutional Review Board Statement
Informed Consent Statement
Data Availability Statement
Conflicts of Interest
References
- Li, Q.; Shi, X.; Zhao, Q.; Cui, Y.; Ouyang, J.; Xu, F. Effect of cooking methods on nutritional quality and volatile compounds of Chinese chestnut (Castanea mollissima Blume). Food Chem. 2016, 201, 80–86. [Google Scholar] [CrossRef]
- Li, D.; Zhu, Z.; Sun, D.-W. Effects of freezing on cell structure of fresh cellular food materials: A review. Trends Food Sci. Technol. 2018, 75, 46–55. [Google Scholar] [CrossRef]
- Zhu, Z.; Zhou, Q.; Sun, D.-W. Measuring and controlling ice crystallization in frozen foods: A review of recent developments. Trends Food Sci. Technol. 2019, 90, 13–25. [Google Scholar] [CrossRef]
- Zhang, P.; Zhu, Z.; Sun, D.-W. Using power ultrasound to accelerate food freezing processes: Effects on freezing efficiency and food microstructure. Crit. Rev. Food Sci. Nutr. 2018, 58, 2842–2853. [Google Scholar] [CrossRef] [PubMed]
- Lim, C.L.; Adam, N.M.; Ahmad, K.A. Cryogenic pipe flow simulation for liquid nitrogen with vacuum insulated pipe (VIP) and Polyurethane (PU) foam insulation under steady-state conditions. Therm. Sci. Eng. Prog. 2018, 7, 302–310. [Google Scholar] [CrossRef]
- Zhu, Z.; Luo, W.; Sun, D.-W. Effects of liquid nitrogen quick freezing on polyphenol oxidase and peroxide activities, cell water states and epidermal microstructure of wolfberry. LWT 2020, 120, 108923. [Google Scholar] [CrossRef]
- Kono, S.; Kon, M.; Araki, T.; Sagara, Y. Effects of relationships among freezing rate, ice crystal size and color on surface color of frozen salmon fillet. J. Food Eng. 2017, 214, 158–165. [Google Scholar] [CrossRef]
- Cheng, L.; Wu, W.; An, K.; Xu, Y.; Yu, Y.; Wen, J.; Wu, J.; Zou, Y.; Liu, H.; Zhu, J. Advantages of Liquid Nitrogen Quick Freezing Combine Gradient Slow Thawing for Quality Preserving of Blueberry. Crystals 2020, 10, 368. [Google Scholar] [CrossRef]
- Jensen, K.N.; Jørgensen, B.M.; Nielsen, J. Low-temperature transitions in cod and tuna determined by differential scanning calorimetry. LWT Food Sci. Technol. 2003, 36, 369–374. [Google Scholar] [CrossRef]
- Mahato, S.; Zhu, Z.; Sun, D.-W. Glass transitions as affected by food compositions and by conventional and novel freezing technologies: A review. Trends Food Sci. Technol. 2019, 94, 1–11. [Google Scholar] [CrossRef]
- Tian, Y.; Li, D.; Luo, W.; Zhu, Z.; Li, W.; Qian, Z.; Li, G.; Sun, D.-W. Rapid freezing using atomized liquid nitrogen spray followed by frozen storage below glass transition temperature for Cordyceps sinensis preservation: Quality attributes and storage stability. LWT 2020, 123, 109066. [Google Scholar] [CrossRef]
- Pascual-Pineda, L.A.; Rascón, M.P.; Quintanilla-Carvajal, M.X.; Castillo-Morales, M.; Marín, U.R.; Flores-Andrade, E. Effect of porous structure and spreading pressure on the storage stability of red onion microcapsules produced by spray freezing into liquid cryogenic and spray drying. J. Food Eng. 2019, 245, 65–72. [Google Scholar] [CrossRef]
- Vallespir, F.; Rodríguez, Ó.; Eim, V.S.; Rosselló, C.; Simal, S. Effects of freezing treatments before convective drying on quality parameters: Vegetables with different microstructures. J. Food Eng. 2019, 249, 15–24. [Google Scholar] [CrossRef]
- Espinoza Rodezno, L.A.; Sundararajan, S.; Solval, K.M.; Chotiko, A.; Li, J.; Zhang, J.; Alfaro, L.; Bankston, J.D.; Sathivel, S. Cryogenic and air blast freezing techniques and their effect on the quality of catfish fillets. LWT Food Sci. Technol. 2013, 54, 377–382. [Google Scholar] [CrossRef]
- Yang, B.; Prasad, K.N.; Jiang, Y. Structure identification of a polysaccharide purified from litchi (Litchi chinensis Sonn.) pulp. Carbohydr. Polym. 2016, 137, 570–575. [Google Scholar] [CrossRef] [PubMed]
- Yu, Y.; Jin, T.Z.; Fan, X.; Wu, J. Biochemical degradation and physical migration of polyphenolic compounds in osmotic dehydrated blueberries with pulsed electric field and thermal pretreatments. Food Chem. 2018, 239, 1219–1225. [Google Scholar] [CrossRef]
- Sokół-Łętowska, A.; Kucharska, A.Z.; Wińska, K.; Szumny, A.; Nawirska-Olszańska, A.; Mizgier, P.; Wyspiańska, D. Composition and antioxidant activity of red fruit liqueurs. Food Chem. 2014, 157, 533–539. [Google Scholar] [CrossRef]
- Martynenko, A.; Chen, Y. Degradation kinetics of total anthocyanins and formation of polymeric color in blueberry hydrothermodynamic (HTD) processing. J. Food Eng. 2016, 171, 44–51. [Google Scholar] [CrossRef]
- Zhao, J.-H.; Liu, F.; Wen, X.; Xiao, H.-W.; Ni, Y.-Y. State diagram for freeze-dried mango: Freezing curve, glass transition line and maximal-freeze-concentration condition. J. Food Eng. 2015, 157, 49–56. [Google Scholar] [CrossRef]
- Al-Farsi, K.A.; Al-Habsi, N.A.; Rahman, M.S. State Diagram of Crystallized Date-Syrup: Freezing Curve, Glass Transition, Crystals-Melting and Maximal-Freeze-Concentration Condition. Thermochim. Acta 2018, 666, 166–173. [Google Scholar] [CrossRef]
- Sun, D.-W. Handbook of Frozen Food Processing and Packaging, 2nd ed.; CRC Press: Boca Raton, FL, USA; Taylor & Francis: Abingdon, UK, 2011; p. 880. [Google Scholar]
- George, R.M. Freezing proceseses used in the food industry. Trends Food Sci. Technol. 1993, 4, 134–138. [Google Scholar] [CrossRef]
- Cheng, L.; Sun, D.W.; Zhu, Z.; Zhang, Z. Emerging techniques for assisting and accelerating food freezing processes: A review of recent research progresses. Crit. Rev. Food Sci. Nutr. 2017, 57, 769–781. [Google Scholar] [CrossRef] [PubMed]
- Lopkulkiaert, W.; Prapatsornwattana, K.; Rungsardthong, V. Effects of sodium bicarbonate containing traces of citric acid in combination with sodium chloride on yield and some properties of white shrimp (Penaeus vannamei) frozen by shelf freezing, air-blast and cryogenic freezing. LWT Food Sci. Technol. 2009, 42, 768–776. [Google Scholar] [CrossRef]
- Qiao, S.; Tian, Y.; Song, P.; He, K.; Song, S. Analysis and detection of decayed blueberry by low field nuclear magnetic resonance and imaging. Postharvest Biol. Technol. 2019, 156, 110951. [Google Scholar] [CrossRef]
- Holzwarth, M.; Korhummel, S.; Carle, R.; Kammerer, D.R. Evaluation of the effects of different freezing and thawing methods on color, polyphenol and ascorbic acid retention in strawberries (Fragaria×ananassa Duch.). Food Res. Int. 2012, 48, 241–248. [Google Scholar] [CrossRef]
- Bernaś, E.; Jaworska, G. Use of onion extract to prevent enzymatic browning of frozen Agaricus bisporus mushrooms. Int. J. Refrig. 2015, 57, 257–264. [Google Scholar] [CrossRef]
- Cano, M.P.; de Ancos, B.A.; Lobo, G. Peroxidase and Polyphenoloxidase Activities in Papaya During Postharvest Ripening and After Freezing/Thawing. J. Food Sci. 1995, 60, 815–817. [Google Scholar] [CrossRef]
- Charoenrein, S.; Owcharoen, K. Effect of freezing rates and freeze-thaw cycles on the texture, microstructure and pectic substances of mango. Int. Food Res. J. 2016, 23, 613. [Google Scholar]
- Kaale, L.D.; Eikevik, T.M.; Bardal, T.; Kjorsvik, E.; Nordtvedt, T.S. The effect of cooling rates on the ice crystal growth in air-packed salmon fillets during superchilling and superchilled storage. Int. J. Refrig. 2013, 36, 110–119. [Google Scholar] [CrossRef]
- Tian, Y.; Zhang, P.; Zhu, Z.; Sun, D.-W. Development of a single/dual-frequency orthogonal ultrasound-assisted rapid freezing technique and its effects on quality attributes of frozen potatoes. J. Food Eng. 2020, 286, 110112. [Google Scholar] [CrossRef]
- Wang, Z.; Yan, Y.; Nisar, T.; Zou, L.; Yang, X.; Niu, P.; Sun, L.; Guo, Y. Comparison and multivariate statistical analysis of anthocyanin composition in Lycium ruthenicum Murray from different regions to trace geographical origins: The case of China. Food Chem. 2018, 246, 233–241. [Google Scholar] [CrossRef] [PubMed]
- Tian, Y.; Gou, X.; Niu, P.; Sun, L.; Guo, Y. Multivariate Data Analysis of the Physicochemical and Phenolic Properties of Not from Concentrate Apple Juices to Explore the Alternative Cultivars in Juice Production. Food Anal. Methods 2018, 11, 1735–1747. [Google Scholar] [CrossRef]


 Fresh,
  AF−20 °C,
  AF−40 °C,
  NF−40 °C,
  NF−60 °C,
  NF−80 °C,
  NF−100 °C.
Fresh, AF−20 °C, AF−40 °C, NF−40 °C, NF−60 °C, NF−80 °C, NF−100 °C.
NF−100 °C.
Fresh, AF−20 °C, AF−40 °C, NF−40 °C, NF−60 °C, NF−80 °C, NF−100 °C.

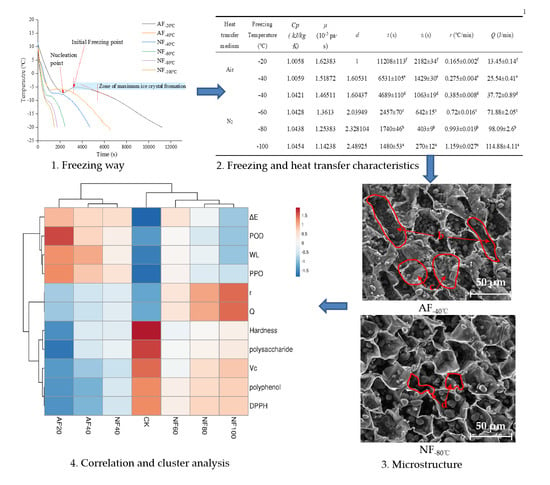
| Heat Transfer Medium | Freezing Temperature (°C) | Cp (kJ/kg K) | μ (10−5 pa∙s) | d | T (s) | Ti (s) | r (°C/min) |
|---|---|---|---|---|---|---|---|
| Air | −20 | 1.0058 | 1.62383 | 1 | 11208 ± 113 f | 2182 ± 34 f | 0.165 ± 0.002 f |
| −40 | 1.0059 | 1.51872 | 1.60531 | 6531 ± 105 e | 1429 ± 30 e | 0.275 ± 0.004 e | |
| N2 | −40 | 1.0421 | 1.46511 | 1.60437 | 4689 ± 110 d | 1063 ± 19 d | 0.385 ± 0.008 d |
| −60 | 1.0428 | 1.3613 | 2.03949 | 2457 ± 70 c | 642 ± 15 c | 0.72 ± 0.016 c | |
| −80 | 1.0438 | 1.25383 | 2.328104 | 1740 ± 46 b | 403 ± 9 b | 0.993 ± 0.019 b | |
| −100 | 1.0454 | 1.14238 | 2.48925 | 1480 ± 53 a | 270 ± 12 a | 1.159 ± 0.027 a |
Disclaimer/Publisher’s Note: The statements, opinions and data contained in all publications are solely those of the individual author(s) and contributor(s) and not of MDPI and/or the editor(s). MDPI and/or the editor(s) disclaim responsibility for any injury to people or property resulting from any ideas, methods, instructions or products referred to in the content. |
© 2023 by the authors. Licensee MDPI, Basel, Switzerland. This article is an open access article distributed under the terms and conditions of the Creative Commons Attribution (CC BY) license (https://creativecommons.org/licenses/by/4.0/).
Share and Cite
Cheng, L.; Wu, W.; Li, J.; Lin, X.; Wen, J.; Peng, J.; Yu, Y.; Zhu, J.; Xiao, G. Effect of Heat Transfer Medium and Rate on Freezing Characteristics, Color, and Cell Structure of Chestnut Kernels. Foods 2023, 12, 1409. https://doi.org/10.3390/foods12071409
Cheng L, Wu W, Li J, Lin X, Wen J, Peng J, Yu Y, Zhu J, Xiao G. Effect of Heat Transfer Medium and Rate on Freezing Characteristics, Color, and Cell Structure of Chestnut Kernels. Foods. 2023; 12(7):1409. https://doi.org/10.3390/foods12071409
Chicago/Turabian StyleCheng, Lina, Weijun Wu, Jinghao Li, Xian Lin, Jing Wen, Jian Peng, Yuanshan Yu, Jieli Zhu, and Gengsheng Xiao. 2023. "Effect of Heat Transfer Medium and Rate on Freezing Characteristics, Color, and Cell Structure of Chestnut Kernels" Foods 12, no. 7: 1409. https://doi.org/10.3390/foods12071409