
Sensory Profile and Consumer Liking of Sustainable Salamis Differing in Wild Boar Meat and Seasoning Ingredients Addition

 ,
,  , and
, and 
Abstract
:
1. Introduction
2. Materials and Methods
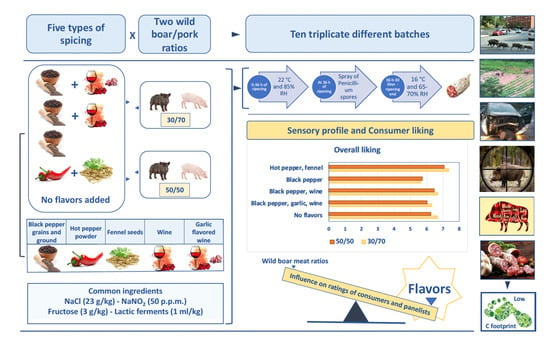
2.1. Raw Material
2.2. Product Processing
2.3. Proximate Physical and Chemical Analyses
2.4. Sensory Analises
2.4.1. Panel Selection and Training
2.4.2. Quantitative Descriptive Sensory Analysis
2.4.3. Consumer Testing
2.5. Statistical Analysis
3. Results
3.1. Color Characteristics
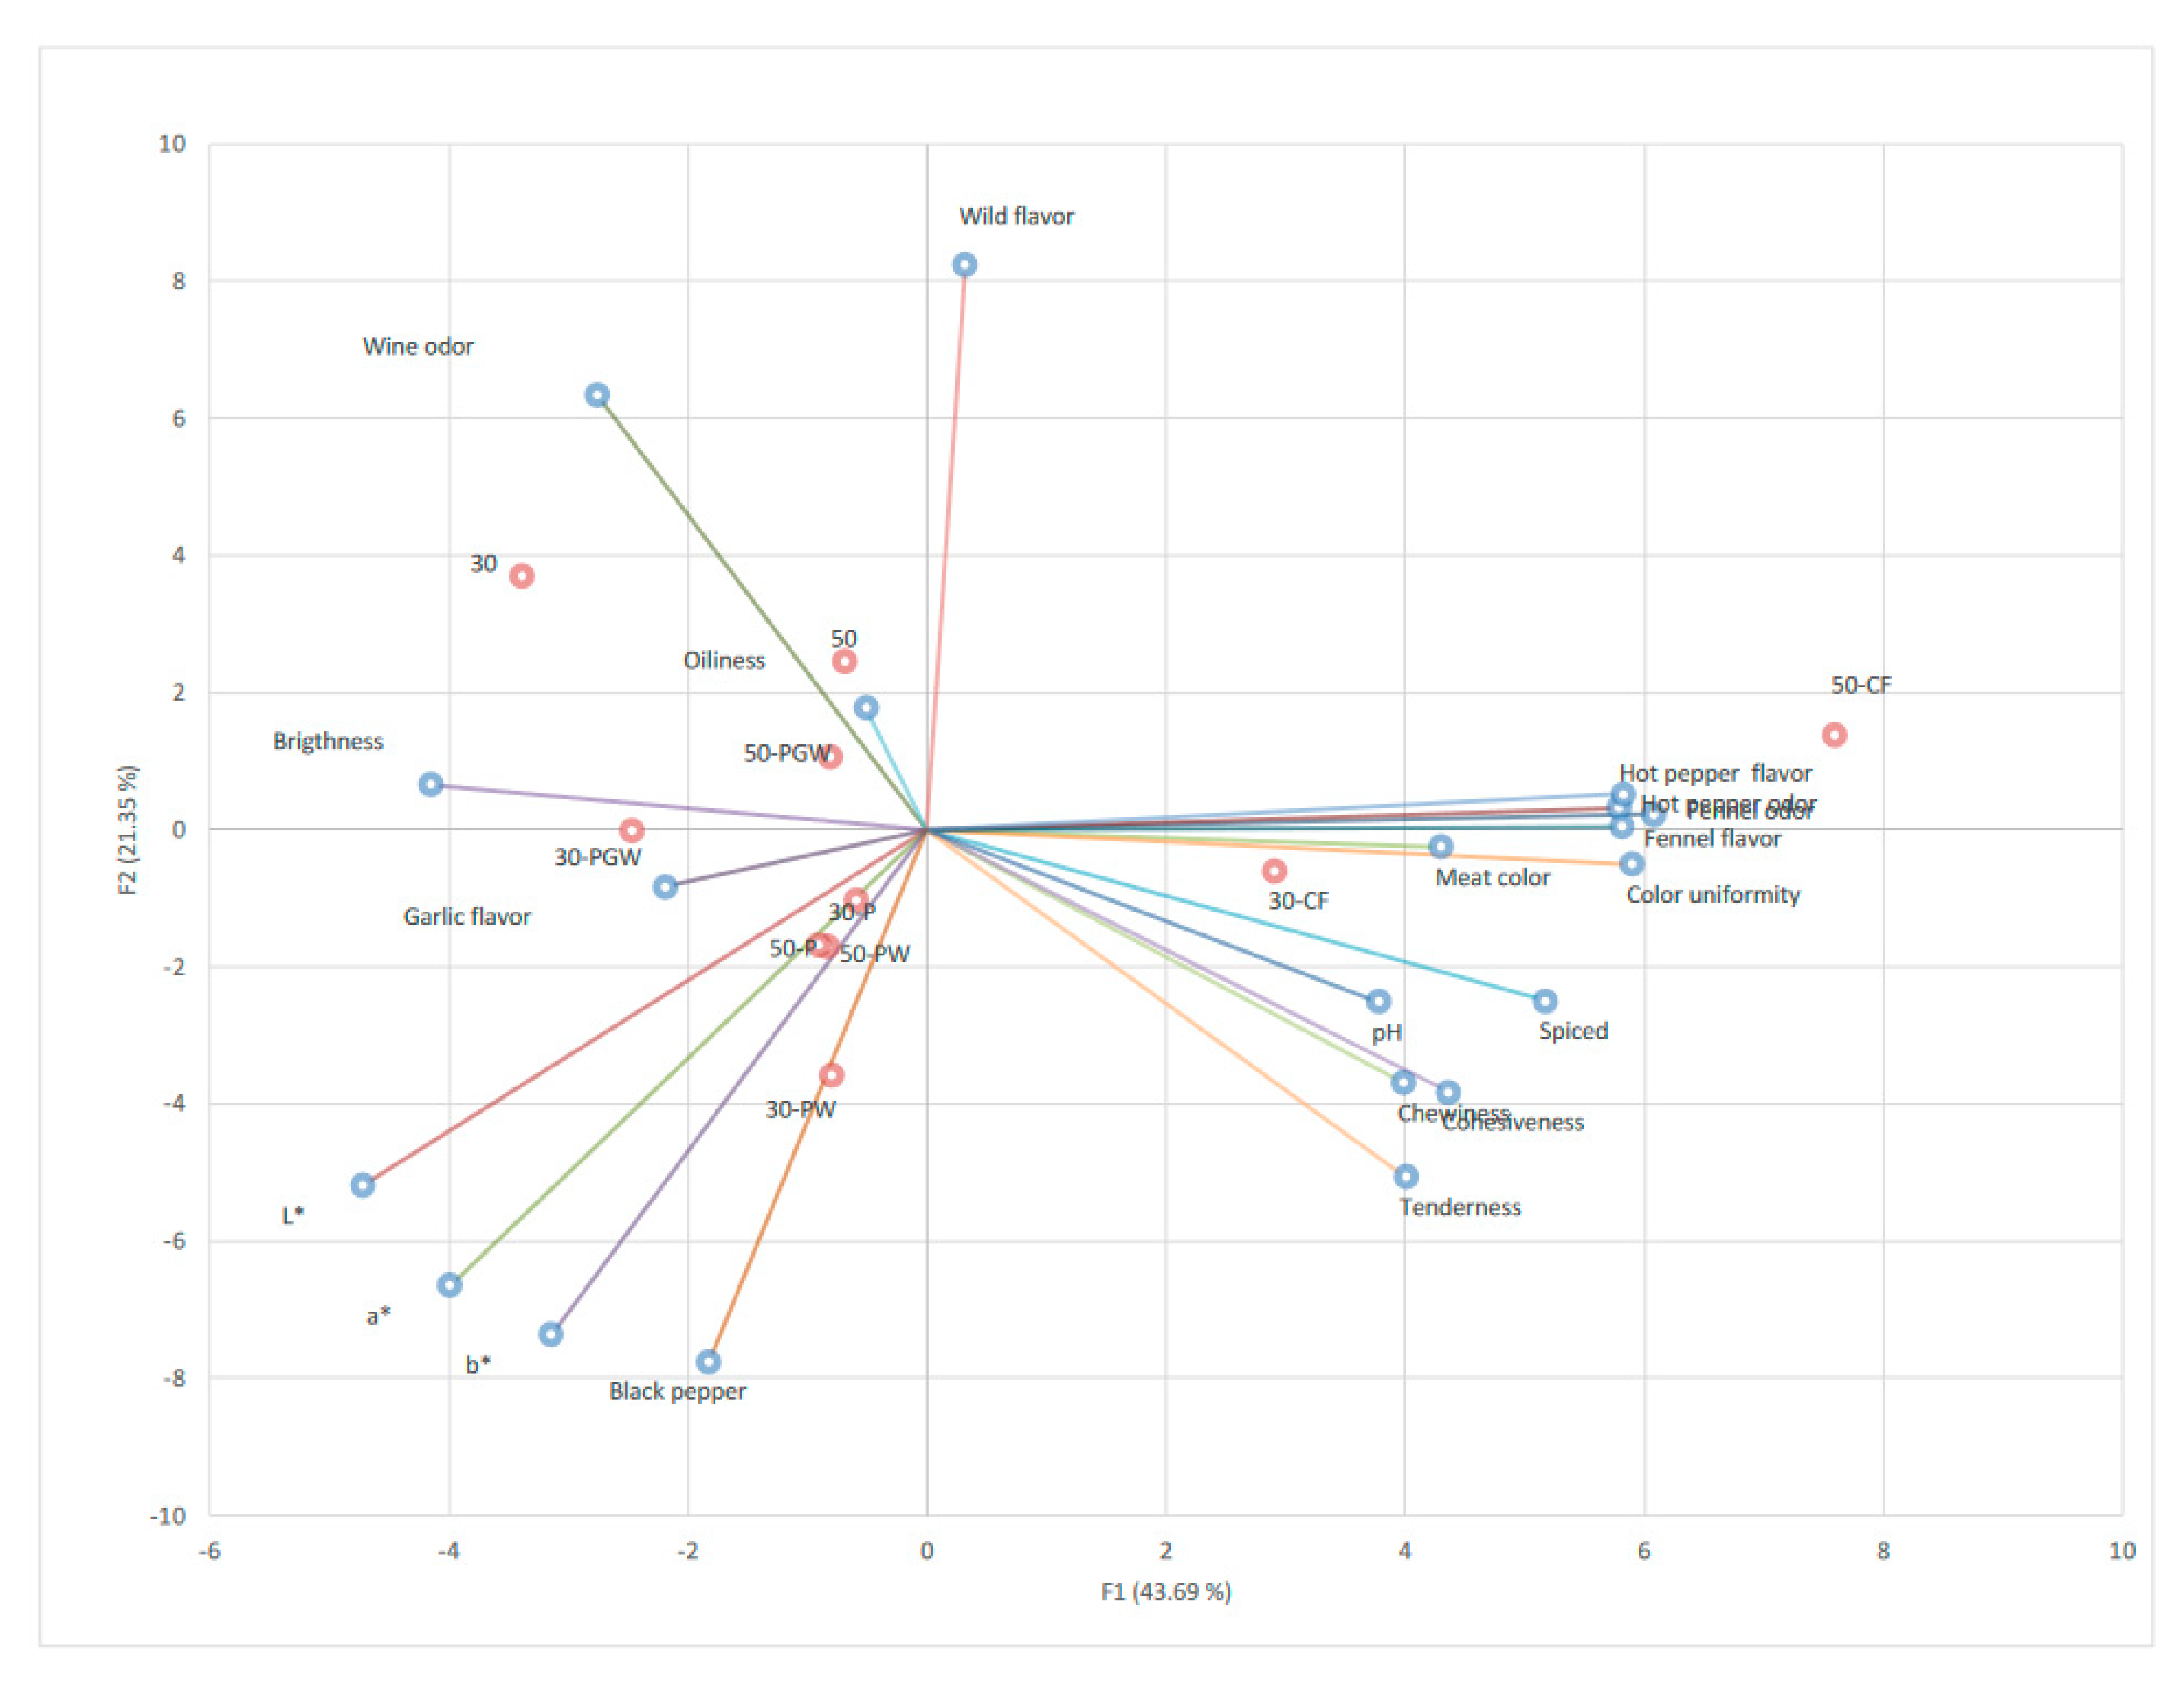
3.2. Quantitative Descriptive Sensory Analysis
3.3. Consumer Testing
4. Discussions
5. Conclusions
Author Contributions
Funding
Data Availability Statement
Acknowledgments
Conflicts of Interest
Appendix A

| Batch | Days of Ripening | Total Weight Loss, 0–30 d | |||||||||||
|---|---|---|---|---|---|---|---|---|---|---|---|---|---|
| 0 | 10 | 20 | 30 | ||||||||||
| 30 | 2.70 | ± | 0.10 | 1.66 | ± | 0.16 | 1.58 | ± | 0.13 | 1.49 | ± | 0.11 | 44.81 |
| 30-PGW | 2.71 | ± | 0.21 | 1.74 | ± | 0.12 | 1.65 | ± | 0.11 | 1.57 | ± | 0.10 | 42.07 |
| 30-PW | 2.75 | ± | 0.40 | 1.72 | ± | 0.29 | 1.64 | ± | 0.27 | 1.57 | ± | 0.25 | 42.91 |
| 30-P | 2.71 | ± | 0.41 | 1.78 | ± | 0.24 | 1.71 | ± | 0.20 | 1.64 | ± | 0.16 | 39.48 |
| 30-CF | 2.59 | ± | 0.49 | 1.75 | ± | 0.40 | 1.67 | ± | 0.38 | 1.60 | ± | 0.36 | 38.22 |
| 50 | 2.70 | ± | 0.36 | 1.69 | ± | 0.26 | 1.60 | ± | 0.24 | 1.51 | ± | 0.21 | 44.07 |
| 50-PGW | 2.62 | ± | 0.24 | 1.70 | ± | 0.30 | 1.58 | ± | 0.23 | 1.45 | ± | 0.24 | 44.66 |
| 50-PW | 2.84 | ± | 0.11 | 1.73 | ± | 0.07 | 1.64 | ± | 0.06 | 1.54 | ± | 0.05 | 45.77 |
| 50-P | 2.73 | ± | 0.04 | 1.76 | ± | 0.05 | 1.67 | ± | 0.03 | 1.57 | ± | 0.01 | 42.49 |
| 50-CF | 2.72 | ± | 0.18 | 1.61 | ± | 0.11 | 1.54 | ± | 0.11 | 1.47 | ± | 0.11 | 45.96 |
| p | 0.056 | 0.184 | 0.078 | 0.265 | |||||||||
| Batch | Days of Ripening | |||||||||||
|---|---|---|---|---|---|---|---|---|---|---|---|---|
| 2 | 4 | 6 | 30 | |||||||||
| 30 | 5.79 | ± | 0.08 | 5.76 | ± | 0.12 | 5.87 a | ± | 0.09 | 5.63 a | ± | 0.04 |
| 30-PGW | 5.66 | ± | 0.05 | 5.46 | ± | 0.05 | 5.51 | ± | 0.03 | 5.96 | ± | 0.05 |
| 30-PW | 5.63 | ± | 0.87 | 5.42 | ± | 0.08 | 5.54 | ± | 0.12 | 5.92 | ± | 0.09 |
| 30-P | 5.57 | ± | 0.11 | 5.58 | ± | 0.1 | 5.58 | ± | 0.04 | 6.17 | ± | 0.87 |
| 30-CF | 5.68 | ± | 0.04 | 5.48 | ± | 0.08 | 5.69 | ± | 0.06 | 6.19 b | ± | 0.07 |
| 50 | 5.71 | ± | 0.03 | 5.64 | ± | 0.05 | 5.77 | ± | 0.09 | 5.85 | ± | 0.08 |
| 50-PGW | 5.61 | ± | 0.06 | 5.40 | ± | 0.05 | 5.24 b | ± | 0.13 | 5.81 | ± | 0.12 |
| 50-PW | 5.60 | ± | 0.05 | 5.44 | ± | 0.05 | 5.58 | ± | 0.04 | 5.75 | ± | 0.05 |
| 50-P | 5.56 | ± | 0.07 | 5.41 | ± | 0.03 | 5.53 | ± | 0.12 | 5.94 | ± | 0.10 |
| 50-CF | 5.74 | ± | 0.07 | 5.52 | ± | 0.1 | 5.81 | ± | 0.08 | 5.74 | ± | 0.08 |
| p | 0.078 | 0.227 | 0.033 | 0.041 | ||||||||
| Batch | Dry Matter | Collagen | Connective | Total Protein | Fat | NaCl | Ash | ||||||||||||||
|---|---|---|---|---|---|---|---|---|---|---|---|---|---|---|---|---|---|---|---|---|---|
| 30 | 67.94 a | ± | 1.97 | 2.47 | ± | 0.07 | 8.71 a | ± | 0.25 | 28.34 a | ± | 0.82 | 30.61 a | ± | 0.89 | 3.79 | ± | 0.11 | 8.03 | ± | 0.23 |
| 30-PGW | 66.03 | ± | 1.91 | 2.62 | ± | 0.08 | 9.23 | ± | 0.27 | 30.03 | ± | 0.87 | 32.42 | ± | 0.94 | 4.02 | ± | 0.12 | 8.51 | ± | 0.25 |
| 30-PW | 66.31 | ± | 1.92 | 2.6 | ± | 0.08 | 9.15 | ± | 0.27 | 29.78 | ± | 0.86 | 32.15 | ± | 0.93 | 3.98 | ± | 0.12 | 8.44 | ± | 0.24 |
| 30-P | 64.86 | ± | 1.88 | 2.71 | ± | 0.08 | 9.55 b | ± | 0.28 | 31.06 | ± | 0.90 | 33.54 b | ± | 0.97 | 4.15 | ± | 0.12 | 8.08 | ± | 0.26 |
| 30-CF | 64.78 b | ± | 1.88 | 2.71 | ± | 0.08 | 9.57 b | ± | 0.28 | 31.14 b | ± | 0.90 | 33.62 b | ± | 0.97 | 4.16 | ± | 0.12 | 8.82 | ± | 0.26 |
| 50 | 66.69 | ± | 1.93 | 2.57 | ± | 0.07 | 9.05 | ± | 0.26 | 29.44 | ± | 0.85 | 31.79 | ± | 0.92 | 3.94 | ± | 0.11 | 8.34 | ± | 0.24 |
| 50-PGW | 66.89 | ± | 1.94 | 2.55 | ± | 0.07 | 9.00 | ± | 0.26 | 29.27 | ± | 0.85 | 31.61 | ± | 0.92 | 3.91 | ± | 0.11 | 8.29 | ± | 0.24 |
| 50-PW | 67.25 | ± | 1.95 | 2.52 | ± | 0.07 | 8.90 | ± | 0.26 | 28.95 | ± | 0.84 | 31.26 | ± | 0.91 | 3.87 | ± | 0.11 | 8.20 | ± | 0.24 |
| 50-P | 66.17 | ± | 1.92 | 2.61 | ± | 0.08 | 9.19 | ± | 0.27 | 29.90 | ± | 0.87 | 32.29 | ± | 0.94 | 4.00 | ± | 0.12 | 8.47 | ± | 0.25 |
| 50-CF | 67.31 | ± | 1.95 | 2.52 | ± | 0.07 | 8.88 | ± | 0.26 | 28.90 | ± | 0.84 | 31.20 | ± | 0.90 | 3.86 | ± | 0.11 | 8.19 | ± | 0.24 |
| p | 0.044 | 0.349 | 0.023 | 0.028 | 0.029 | 0.088 | 0.213 | ||||||||||||||
| Attribute | Batch | p | |||||||||
|---|---|---|---|---|---|---|---|---|---|---|---|
| 30 | 30-PGW | 30-PW | 30-P | 30-CF | 50 | 50-PGW | 50-PW | 50-P | 50-CF | ||
| Appearance | |||||||||||
| Color uniformity | 29.70 ± 2.76 B | 29.80 ± 2.76 B | 37.22 ± 2.83 | 33.40 ± 2.76 | 39.40 ± 2.76 a | 33.37 ± 2.76 B | 39.07 ± 2.76 a | 33.83 ± 7.76 B | 34.57 ± 2.76 | 47.50 ± 2.76 Aa | 0.001 |
| Meat color | 35.10 ± 2.69 Ba | 38.53 ± 2.76 B | 47.83 ± 2.76 A | 37.47 ± 2.69 B | 41.00± 2.69 B | 46.77 ± 2.69 A | 61.33 ± 2.6 A | 56.93 ± 2.69 A | 51.27 ± 2.69 A | 73.57 ± 2.69 A | <0.0001 |
| Fat color | 54.37 ± 3.37 | 53.97 ± 3.37 | 52.54 ± 3.47 | 60.30 ± 3.37 Aa | 47.30 ± 3.37 B | 54.47 ± 3.37 | 55.17 ± 3.37 | 48.77 ± 3.37 b | 48.47 ± 3.37 b | 54.30 ± 3.37 | 0.227 |
| Brightness | 51.37 ± 2.66 A | 49.47 ± 2.66 | 45.71 ± 2.73 Aa | 47.43 ± 2.66 A | 45.83 ± 2.66 | 47.40 ± 2.66 | 33.87 ± 2.66 B | 39.37 ± 2.66 bB | 36.43 ± 2.66 Bb | 28.80 ± 2.66 B | <0.0001 |
| Fat percentage | 58.63 ± 2.25 Aa | 57.97 ± 2.25 A | 55.97 ± 2.31 | 58.67 ± 2.25 A | 53.23 ± 2.25 | 52.70 ± 2.25 | 49.10 ± 2.25 Bb | 56.43 ± 2.25 | 56.53 ± 2.25 | 44.67 ± 2.25 B | 0.002 |
| Fat diameter | 44.27 ± 2.87 A | 50.03 ± 2.87 Aa | 36.54 ± 2.94 B | 38.00 ± 2.87 B | 37.00 ± 2.87 B | 44.07 ± 2.87 A | 49.20 ± 2.87 A | 45.73 ± 2.87 | 38.0 ± 2.87 b | 44.37 ± 2.87 B | 0.002 |
| Exudate | 39.40 ± 3.46 | 34.00 ± 3.46 B | 48.62 ± 3.55 Aa | 38.30 ± 3.46 | 39.77 ± 3.46 | 37.80 ± 3.46 | 38.96 ± 3.46 | 45.03 ± 3.46 A | 36.83 ± 3.46 ab | 34.23 ± 3.46 B | 0.102 |
| Odor | |||||||||||
| Overall odor | 22.97 ± 5.28 B | 33.20 ± 5.28 B | 38.24 ± 5.43 | 41.47 ± 5.28 A | 39.17 ± 5.28 Aa | 27.97 ± 5.28 b | 31.07 ± 5.28 | 34.03 ± 5.28 | 25.86 ± 5.28 B | 31.77 ± 5.28 B | 0.258 |
| Fennel | 3.73 ± 2.34 B | 10.30 ± 2.34 A | 14.94 ± 2.40 a | 13.40 ± 2.34 B | 49.67 ± 2.34 C | 6.17 ± 2.34 B | 9.60 ± 2.34 | 6.73 ± 2.34 b | 5.63 ± 2.34 | 63.13 ± 2.34 | <0.0001 |
| Wine | 20.33 ± 2.82 | 18.27 ± 2.82 | 7.68±2.90 B | 15.43 ± 2.82 | 12.70 ± 2.82 | 14.77 ± 2.82 | 21.43 ± 2.82 A | 13.20 ± 2.82 B | 13.20 ± 2.82 B | 12.47 ± 2.82 B | 0.033 |
| Garlic | 14.97 ± 2.75 | 14.87 ± 2.75 | 10.89 ± 2.82 B | 10.17 ± 2.75 Bb | 8.63 ± 2.75 B | 12.97 ± 2.75 | 18.37 ± 2.75 Aa | 17.73 ± 2.75 A | 12.20 ± 2.75 | 16.03 ± 2.75 A | 0.195 |
| Red hot pepp. | 3.13 ± 2.02 B | 3.73 ±2.02 B | 7.13±2.08 | 7.80 ± 2.02 B | 47.30 ± 2.02 A | 2.73 ± 2.02 B | 6.50 ± 2.02 B | 5.10 ± 2.02 B | 4.43 ± 2.02 B | 48.53 ± 2.02 A | <0.0001 |
| Taste | |||||||||||
| Bitter | 20.90 ± 3.43 B | 19.00 ± 3.43 | 20.61 ± 3.53 | 23.90 ± 3.43 | 16.80 ± 3.43 B | 21.87 ± 3.43 | 20.27 ± 3.43 | 30.00± 3.43 A | 27.20 ± 3.43 A | 22.57 ± 3.43 | 0.249 |
| Flavor | |||||||||||
| Overall flavor | 29.77 ± 3.15 Bb | 44.17 ± 3.15 A | 40.42 ± 3.24 | 39.70 ± 3.15 A | 36.37 ± 3.15 | 32.47 ± 3.15 | 36.13 ± 3.15 | 38.63 ± 3.15 Aa | 35.40 ± 3.15 | 33.17 ± 3.15 a | 0.068 |
| Fennel | 4.90 ± 3.14 Bb | 11.40 ± 3.14 B | 12.41 ± 3.22 B | 15.57 ± 3.14 Ba | 63.20 ± 3.14 A | 5.43 ± 3.14 B | 9.43 ± 3.14 B | 8.23 ± 3.14 B | 9.40 ± 3.14 B | 64.47 ± 3.14 A | <0.0001 |
| Red hot pepp. | 6.23 ± 2.60 B | 9.27 ± 2.60 | 8.89 ± 2.60 | 9.10 ± 2.60 B | 46.50 ± 2.60 A | 5.37 ± 2.60 B | 9.00 ± 2.60 | 6.67 ± 2.60 B | 8.57 ± 2.60 B | 48.90 ± 2.60 A | <0.0001 |
| Black pepper | 14.13 ± 3.62 Ca | 41.43 ±3.62 | 72.99 ± 3.62 A | 69.33 ± 3.62 A | 19.77± 3.62 a | 4.27 ± 3.62 Bb | 29.17 ± 3.62 | 42.03 ± 3.62 C | 65.43 ± 3.62 A | 15.30 ± 3.62 a | <0.0001 |
| Wild | 22.33 ± 2.68 A | 13.63 ± 2.68 | 7.83 ± 2.76 B | 10.90 ± 2.68 | 10.70 ± 2.68 | 23.57 ± 2.68 Aa | 19.03 ± 2.68 A | 14.97 ± 2.68 b | 14.53 ± 2.68 b | 20.50 ± 2.68 A | 0.001 |
| Spiced | 23.57 ± 2.97 | 24.87 ± 2.97 D | 41.54 ± 3.05 | 40.00 ± 2.97 | 63.53 ± 2.97 A | 11.07 ± 2.97 Bb | 20.57 ± 2.97 Da | 21.50 ±2.97 | 35.47 ± 2.97 C | 65.70 ± 2.97 A | <0.0001 |
| Garlic | 9.53 ± 2.77 B | 15.50 ± 2.77 | 9.66 ± 2.84 B | 10.13± 2.77 | 6.83 ± 2.77 Bb | 10.53 ± 2.77 | 20.06 ± 2.77 A | 15.93 ± 2.77 a | 14.83 ± 2.77 | 10.20 ± 2.77 | 0.030 |
| Wine | 14.83 ± 3.00 | 18.73 ± 3.00 | 15.06 ± 3.07 | 21.10 ± 3.00 a | 12.33± 3.00 | 13.90 ± 3.00 | 22.90 ± 3.00 A | 18.13 ± 3.00 | 17.03 ± 3.00 | 10.97 ± 3.00 Bb | 0.116 |
| Texture | |||||||||||
| Tenderness | 40.53 ± 3.05 Bb | 50.73 ± 3.05 | 53.21 ± 3.13 A | 55.30 ± 3.05 A | 52.33 ± 3.05 A | 52.63 ± 3.05 A | 52.93 ± 3.05 A | 53.97 ± 3.05 A | 51.57 ± 3.05 a | 57.90 ± 3.05 A | 0.023 |
| Cohesiveness | 47.57 ± 2.27 B | 56.53 ± 2.27 C | 59.77 ±2.34 C | 61.97 ± 2.27 b | 57.93 ± 2.27 C | 60.33 ± 2.27 C | 61.27 ± 2.27 | 65.07 ± 2.27 A | 61.70 ± 2.27 b | 69.67 ± 2.27 Aa | <0.0001 |
| Chewiness | 44.73 ± 2.70 B | 57.83 ± 2.70 B | 58.56 ± 2.77 B | 61.10 ± 2.70 B | 55.43 ± 2.70 B | 57.80 ± 2.70 B | 61.37 ± 2.70 B | 62.23 ± 2.70 B | 58.13± 2.70 B | 67.63 ± 2.70 B | <0.0001 |
| Oiliness | 44.60 ± 5.24 b | 44.60 ± 5.24 B | 46.91 ± 5.38 B | 51.87 ± 5.24 b | 49.43 ± 5.24 b | 53.20 ± 5.24 | 67.03 ± 5.24 Aa | 56.93 ± 5.24 | 49.50 ± 5.24 | 48.97 ± 5.24 | 0.170 |

References
- Roila, R.; Branciari, R.; Primavilla, S.; Miraglia, D.; Vercillo, F.; Ranucci, D. Microbial, physicochemical and sensory characteristics of salami produced from wild boar (Sus scrofa). Slovak J. Food Sci. 2021, 15, 475–483. [Google Scholar] [CrossRef] [PubMed]
- Fulgione, D.; Buglione, M. The Boar War: Five Hot Factors Unleashing Boar Expansion and Related Emergency. Land 2022, 11, 887. [Google Scholar] [CrossRef]
- Penrith, M.L. Current status of African swine fever. CABI Agric. Biosci. 2020, 1, 11. [Google Scholar] [CrossRef]
- Corn, J.L.; Stallknecht, D.E.; Mechlin, N.M.; Luttrell, M.P.; Fischer, J.R. Persistence of Pseudorabies Virus in Feral Swine Populations. J. Wildl. Dis. 2004, 40, 307–310. [Google Scholar] [CrossRef] [PubMed] [Green Version]
- Frölich, K.; Thiede, S.; Kozikowski, T.; Jakob, W. A review of mutual transmission of important infectious diseases between livestock and wildlife in Europe. Ann. N. Y. Acad. Sci. 2002, 969, 4–13. [Google Scholar] [CrossRef] [PubMed]
- Lombardini, M.; Meriggi, A.; Fozzi, A. Factors influencing wild boar damage to agricultural crops in Sardinia (Italy). Curr. Zool. 2017, 63, 507–514. [Google Scholar] [CrossRef] [PubMed] [Green Version]
- Pacini, M.I.; Bonelli, F.; Briganti, A.; Citi, S.; Papini, R.A.; Sgorbini, M. Wildlife ungulate rescue and emergency services in the Pisa area (Tuscany, Italy): Evaluation of a 9-years period (2010–2018). Front. Vet. Sci. 2020, 7, 626. [Google Scholar] [CrossRef]
- Paulsen, P.; Vali, S.; Bauer, F. Quality traits of wild boar mould-ripened salami manufactured with different selections of meat and fat tissue, and with and without bacterial starter cultures. Meat Sci. 2011, 89, 486–490. [Google Scholar] [CrossRef]
- Russo, C.; Balloni, S.; Altomonte, I.; Martini, M.; Nuvoloni, R.; Cecchi, F.; Pedonese, F.; Salari, F.; Sant’ana Da Silva, A.M.; Torracca, B.; et al. Fatty acid and microbiological profile of the meat (longissimus dorsi muscle) of wild boar (Sus scropha scropha) hunted in Tuscany. Ital. J. Anim. Sci. 2016, 16, 1–8. [Google Scholar] [CrossRef] [Green Version]
- Marescotti, M.E.; Caputo, V.; Demartini, E.; Gaviglio, A. Discovering market segments for hunted wild game meat. Meat Sci. 2019, 149, 163–176. [Google Scholar] [CrossRef]
- Ramanzin, M.; Amici, A.; Casoli, C.; Esposito, L.; Lupi, P.; Marsico, G.; Mattiello, S.; Olivieri, O.; Ponzetta, M.P.; Russo, C.; et al. Meat from wild ungulates: Ensuring quality and hygiene of an increasing resource. Ital. J. Anim. Sci. 2010, 9, e61. [Google Scholar] [CrossRef]
- Fantechi, T.; Fantini, C.; Scozzafava, G.; Casini, L. Consumer preferences for wild game meat: Evidence from a hybrid choice model on wild boar meat in Italy. Agr. Foods Econ. 2022, 10, 23. [Google Scholar] [CrossRef]
- Czarniecka-Skubina, E.; Stasiak, D.M.; Latoch, A.; Owczarek, T.; Hamulka, J. Consumers’ Perception and Preference for the Consumption of Wild Game Meat among Adults in Poland. Foods 2022, 11, 830. [Google Scholar] [CrossRef] [PubMed]
- Presidenza del Consiglio dei Ministri. Conferenza Permanente Per i Rapporti Tra lo Stato, le Regioni e le Province Autonome di Trento e Bolzano. 2021. Available online: https://www.statoregioni.it/it/conferenza-stato-regioni/sedute-2021/seduta-del-25032021/atti/repertorio-atto-n-34csr (accessed on 4 October 2022).
- Adduci, F.; Elshafie, H.S.; Labella, C.; Musto, M.; Freschi, P.; Paolino, R.; Ragni, M.; Cosentino, C. Abatement of the clostridial load in the teats of lactating cows with lysozyme derived from donkey milk. J. Dairy Sci. 2019, 102, 6750–6755. [Google Scholar] [CrossRef]
- Cosentino, C.; Faraone, D.; Paolino, R.; Freschi, P.; Musto, M. Short communication: Sensory profile and acceptability of a cow milk cheese manufactured by adding jenny milk. J. Dairy Sci. 2016, 99, 228–233. [Google Scholar] [CrossRef] [Green Version]
- Cosentino, C.; Paolino, R.; Rubino, M.; Freschi, P. Effect of the Addition of Donkey Milk on the Acceptability of Caciotta Cow Cheese. Animals 2022, 12, 1444. [Google Scholar] [CrossRef]
- Paolino, R.; Freschi, P.; Claps, S.; Tarricone, S.; Sepe, L.; Cosentino, C. Effect of donkey milk addition on the acceptability of Caprino, a typical goat cheese from Basilicata region, Italy. Int. J. Dairy Technol. 2022, 75, 460–462. [Google Scholar] [CrossRef]
- Petrescu, D.C.; Vermeir, I.; Petrescu-Mag, R.M. Consumer Understanding of Food Quality, Healthiness, and Environmental Impact: A Cross-National Perspective. Int. J. Environ. Res. Public Health 2020, 17, 169. [Google Scholar] [CrossRef] [Green Version]
- Hoffman, L.C.; Muller, M.; Schutte, D.W.; Calitz, F.J.; Crafford, K. Consumer expectations, perceptions and purchasing of South African game meat. S. Afr. J. Wildl. 2005, 35, 33–42. [Google Scholar]
- Paleari, M.A.; Moretti, V.M.; Beretta, G.; Mentasti, T.; Bersani, C. Cured products from different animal species. Meat Sci. 2003, 63, 4854–4889. [Google Scholar] [CrossRef]
- Schimpl, A.; Bauer, F.; Paulsen, P. Quality aspects of a spreadable raw sausage product manufactured from wild boar meat. Arch. Lebensmittelhyg. 2010, 61, 153–159. [Google Scholar]
- Żochowska-Kujawska, J.; Lachowicz, K.; Sobczak, M.; Gajowiecki, L.; Kotowicz, M.; Żych, A.; Mędrala, D. Effects of massaging on hardness, rheological properties, and structure of four wild boar muscles of different fibre type content and age. Meat Sci. 2007, 75, 595–602. [Google Scholar] [CrossRef] [PubMed]
- Regione Basilicata. Braia: Tavolo Emergenza Cinghiali, le Azioni del Dipartimento. Available online: http://www.regione.basilicata.it/giunta/detail.jsp?otype=1012&id=3029257 (accessed on 6 October 2022).
- Commission Internationale de l’Eclairage. Colorimetry, 2nd ed.; Pubblication CIE 15.2; Commission Internationale de l’Eclairage: Vienna, Austria, 1986. [Google Scholar]
- ISO. Sensory Analysis—General Guidelines for the Selection, Training and Monitoring of Selected Assessors and Expert Sensory Assessors; ISO/TC 34/SC 12; Technical Committee: Geneva, Switzerland, 2012; pp. 1–28. [Google Scholar]
- Braghieri, A.; Piazzolla, N.; Carlucci, A.; Bragaglio, A.; Napolitano, F. Sensory properties, consumer liking and choice determinants of Lucanian dry cured sausages. Meat Sci. 2016, 111, 122–129. [Google Scholar] [CrossRef] [PubMed]
- Stone, H.; Sidel, J.L. Sensory Evaluation Practices, 3rd ed.; Elsevier Academic Press: London, UK, 2004; pp. 21–67. [Google Scholar]
- Murray, J.M.; Delahunty, C.M.; Baxter, I.A. Descriptive sensory analysis: Past, present and future. Food Res. Int. 2001, 34, 461–471. [Google Scholar] [CrossRef]
- Ruiz, J.; Garcia, C.; Muriel, E.; Andres, A.I.; Ventanas, J. Influence of sensory characteristics on the acceptability of dry cured ham. Meat Sci. 2002, 61, 347–354. [Google Scholar] [CrossRef]
- Ruiz, J.N.; Villanueva, N.D.M.; Favaro-Trindade, C.S.; Contreras-Castillo, C.J. Physicochemical, microbiological and sensory assessments of Italian salami sausages with probiotic potential. Sci. Agric. 2014, 71, 204–211. [Google Scholar] [CrossRef] [Green Version]
- ISO/TC 34/SC 12; ISO Sensory Analysis—General Guidance for the Design of Test. Technical Committee: Geneva, Switzerland, 2007; pp. 1–16.
- Markey, O.; Souroullas, K.; Fagan, C.C.; Kliem, K.E.; Vasilopoulou, D.; Jackson, K.G.; Humphries, D.I.; Grandison, A.S.; Givens, D.I.; Lovegrove, J.A.; et al. Consumer acceptance of dairy products with a saturated fatty acid reduced, monounsaturated fatty acid enriched content. J. Dairy Sci. 2017, 100, 7953–7966. [Google Scholar] [CrossRef] [Green Version]
- Peryam, D.R.; Pilgrim, F.J. Hedonic scale method of measuring food preferences. Food Technol. 1957, 11, 9–14. [Google Scholar]
- R Version 3.6.1. Available online: https://www.r-project.org (accessed on 12 November 2022).
- Townsend, W.E.; Brown, W.L.; McCampbell, H.C.; Davis, C.E. Chemical, physical, curing and sensory properties of hams from Yorkshire, crossbred and wild pigs. J. Anim. Sci. 1979, 49, 1219–1226. [Google Scholar] [CrossRef] [Green Version]
- Marchiori, A.F.; de Felício, P.E. Quality of wild boar meat and commercial pork. Sci. Agr. 2003, 60, 1–5. [Google Scholar] [CrossRef] [Green Version]
- Hedrick, H.B.; Aberle, E.D.; Forrest, J.C.; Judge, M.; Merkel, R.A. Properties of fresh meat. In Principles of Meat Science, 3rd ed.; Kendall Hunt Publishing Company: Dubuque, Iowa, 1994; pp. 123–131. [Google Scholar]
- Brankovic Lazic, I.; Jovanovic, J.; Simunovic, S.; Raseta, M.; Trbovic, D.; Baltic, T.; Ciric, J. Evaluation of sensory and chemical parameters of fermented sausages. Meat Technol. 2019, 60, 84–90. [Google Scholar] [CrossRef]
- Braghieri, A.; Piazzolla, N.; Romaniello, A.; Paladino, F.; Ricciardi, A.; Napolitano, F. Effect of adjuncts on sensory properties and consumer liking of Scamorza cheese. J. Dairy Sci. 2015, 98, 1479–1491. [Google Scholar] [CrossRef] [PubMed] [Green Version]
- Gimeno, O.; Ansorena, D.; Astiasaran, I.; Bello, J. Characterization of chorizo de Pamplona: Instrumental measurements of colour and texture. Food Chem. 2000, 69, 195–200. [Google Scholar] [CrossRef]
- Gonzalez-Fernandez, C.; Santos, E.M.; Rovira, J.; Jaime, I. The effect of sugar concentration and starter culture on instrumental and sensory textural properties of chorizo-Spanish dry-cured sausage. Meat Sci. 2006, 74, 467–475. [Google Scholar] [CrossRef]
- Saccani, G.; Fornelli, G.; Zanardi, E. Characterization of textural properties and changes of myofibrillar and sarcoplasmic proteins in salame felino during ripening. Int. J. Food Prop. 2013, 16, 1460–1471. [Google Scholar] [CrossRef] [Green Version]
- Napolitano, F.; Girolami, A.; Faraone, D.; Chaudry, M.M.A.; Braghieri, A. Appearance, consumer liking and preferences of Lucanian ‘Soppressata’ salami. Meat. Sci. 2020, 167, 108159. [Google Scholar] [CrossRef]
- Morales, R.; Guerrero, L.; Claret, A.; Guàrdia, M.D.; Gou, P. Beliefs and attitudes of butchers and consumers towards dry-cured ham. Meat Sci. 2008, 80, 1005–1016. [Google Scholar] [CrossRef]
- Razmaitè, V.; Šveistien, R.; Jatkauskiene, V.; Šiukščius, A. Pork Consumption Frequencies, Attitudes and Sensory Acceptance of Traditional Products in Lithuania. Foods 2022, 11, 3292. [Google Scholar] [CrossRef]
- Niewiadomska, K.; Kosicka-Gębska, M.; Gębski, J.; Gutkowska, K.; Jeżewska-Zychowicz, M.; Sułek, M. Game Meat consumption-conscious choice or just a game? Foods 2020, 9, 1357. [Google Scholar] [CrossRef]
- Xie, X.; Huang, L.; Li, J.J.; Zhu, H. Generational differences in perceptions of food health/risk and attitudes toward organic food and game meat: The case of the COVID-19 crisis in China. Int. J. Environ. Res. Public Health 2020, 17, 3148. [Google Scholar] [CrossRef]
- Nikolovski, G.; Stojanovska, M.; Miovska, M. The attitude towards hunting of the local population from two settlements in Suburb of Skopje, Macedonia. South-East Eur. For. SEEFOR 2011, 2, 23–32. [Google Scholar] [CrossRef] [Green Version]
- Nijdam, D.; Rood, T.; Westhoek, H. The price of protein: Review of land use and carbon footprints from life cycle assesment of animal foods products and their substitutes. Food Policy 2012, 37, 760–770. [Google Scholar] [CrossRef]

| Batch | Proportions of Wild Boar Meat/Pork Shoulder/Pork Belly | Ground Black Pepper | Black Pepper Grains | Hot Pepper Powder | Fennel Seeds | Wine | Garlic Flavored Wine |
|---|---|---|---|---|---|---|---|
| g/kg | ml/kg | ||||||
| 30 | 30/40/30 | - | - | - | - | - | - |
| 30-PGW | 1 | 4 | - | - | - | 30 | |
| 30-PW | 1 | 4 | - | - | 30 | - | |
| 30-P | 1 | 4 | - | - | - | - | |
| 30-CF | - | - | 5 | 2 | - | - | |
| 50 | 50/20/30 | - | - | - | - | - | - |
| 50-PGW | 1 | 4 | - | - | - | 30 | |
| 50-PW | 1 | 4 | - | - | 30 | - | |
| 50-P | 1 | 4 | - | - | - | - | |
| 50-CF | - | - | 5 | 2 | - | - | |
| Attributes | Definition | Intensity | ||
|---|---|---|---|---|
| Low (<20) | High (>80) | |||
| Appearance | Color uniformity | Presence of a darker external halo in the slice due to an anomalous drying process | Two-month-seasoned sausage | Bresaola |
| Meat color | Intensity of the characteristic red color of the lean of the sausage | Red orange = 2.5 YR 1 | Dark red = 10 RP 1 | |
| Fat color | Intensity of fat color | White = 10 Y 1 | Pink = 10 R 1 | |
| Brightness | Intensity of the characteristic red color (dark-light) of the cured sausage | White | Black | |
| Fat percentage | Percentage of fat on the slice surface | Bresaola | Hungarian salami | |
| Fat diameter | Mincing type of fat in the slice | Hungarian salami | Soppressata salami | |
| Exudate | Amount of liquid fat on the surface | Seasoned sausage | Cacciatore salami | |
| Odor | Overall odor | Level of overall odor before eating the sample | Fifteen-day-seasoned sausage | Napoli salami |
| Fennel | Odor associated with fennel seed | Cacciatore salami | Lucanian sausage | |
| Wine | Odor associated with red wine | Water | Red wine | |
| Flavor | Overall flavor | Level of overall flavor | Fifteen-day-seasoned sausage | Napoli salami |
| Fennel | Flavor associated with fennel seed | Low | High | |
| Black pepper | Flavor associated with the presence of sweet pepper powder | Lucanian sausage | Napoli salami | |
| Hot pepper | Flavor associated with hot pepper | Seasoned sausage | Lucanian sausage with hot pepper | |
| Spiced Wine | Flavor associated with mixed aromatic spices Flavor associated with red wine | Seasoned sausage Water | Hungarian salami Red wine | |
| Wild | Characteristic odor of seasoned wild boar meat | Seasoned sausage | Wild boar sausage | |
| Garlic | Flavor associated with garlic | Low | High | |
| Texture | Tenderness | Effort required to bite thorough lean and to make the sample ready to be swallowed | Two-month-seasoned cubed sausage | Cubed Hungarian salami |
| Cohesiveness | Mechanical textural attribute relating to the degree to which sausage can be deformed before it breaks | Cubed cooked ham | Dry sausage | |
| Chewiness | Number of chews until reaching a state ready for swallowing | Cubed cooked ham | Dry cured ham | |
| Oiliness | Perception of the amount of fat released by the product during mastication | Cubed dry cured ham | Cubed Pancetta | |
| Batch | L* | a* | b* |
|---|---|---|---|
| 30 | 42.69 ± 1.23 aA | 28.03 ± 0.76 aA | 31.48 ± 2.36 a |
| 30-PGW | 39.34 ± 1.23 bA | 25.73 ± 0.76 B | 29.59 ± 2.36 A |
| 30-PW | 37.87 ± 1.23 aAB | 23.64 ± 0.76 B | 29.10 ± 2.36 |
| 30-P | 35.70 ± 1.23 aB | 23.31 ± 0.76 B | 29.14 ± 2.36 A |
| 30-CF | 41.71 ± 1.23 bA | 30.7 ± 0.76 bA | 39.7 ± 2.36 bB |
| 50 | 36.47 ± 1.23 B | 25.28 ± 0.76 B | 34.06 ± 2.36 |
| 50-PGW | 34.56 ± 1.23 aB | 26.07 ± 0.76 bB | 30.20 ± 2.36 |
| 50-PW | 36.80 ± 1.23 B | 23.53 ± 0.76 B | 27.12 ± 2.36 |
| 50-P | 35.19 ± 1.23 B | 27.66 ± 0.76 B | 32.99 ± 2.36 |
| 50-CF | 37.38 ± 1.23 B | 27.32 ± 0.76 B | 33.25 ± 2.36 |
| p | <0.0001 | <0.0001 | 0.025 |
| Liking | Gender | p | Class of Age (1) | p | |||
|---|---|---|---|---|---|---|---|
| F | M | I | II | III | |||
| Overall | 6.11 ± 0.14 A | 6.59 ± 0.11 B | 0.002 | 6.46 ± 0.06 | 6.24 ± 0.17 | 6.37 ± 0.26 | 0.484 |
| Appearance | 6.12 ± 0.13 A | 6.46 ± 0.11 B | 0.005 | 6.54 ± 0.06 | 6.13 ± 0.17 | 6.19 ± 0.26 | 0.045 |
| Odor | 6.08 ± 0.13 a | 6.27 ± 0.11 b | 0.037 | 6.36 ± 0.06 | 6.13 ± 0.16 | 5.94 ± 0.25 | 0.146 |
| Flavor | 6.01 ± 0.15 a | 6.30 ± 0.13 b | 0.023 | 6.34 ± 0.07 a | 5.93 ± 0.18 b | 6.18 ± 0.29 | 0.002 |
| Texture | 6.03 ± 0.13 A | 6.56 ± 0.11 B | <0.0001 | 6.51 ± 0.06 a | 6.07 ± 0.17 b | 6.31 ± 0.26 | 0.041 |
| Batch | Liking | ||||
|---|---|---|---|---|---|
| Overall Liking | Appearance | Odor | Flavor | Texture | |
| 30 | 6.69 ± 0.36 a | 6.62 ± 0.35 A | 6.48 ± 0.34 a | 5.93 ± 0.39 b | 6.21 ± 0.35 Bb |
| 30-PGW | 6.32 ± 0.36 | 6.11 ± 0.35 b | 6.36 ± 0.34 a | 6.07 ± 0.39 b | 6.25 ± 0.35 |
| 30-PW | 6.47 ± 0.36 | 6.45 ± 0.35 a | 6.21 ± 0.34 b | 6.25 ± 0.39 | 6.24 ± 0.35 |
| 30-P | 5.65 ± 0.36 Bb | 5.84 ± 0.35 B | 5.45 ± 0.34 B | 5.54 ± 0.39 B | 5.81 ± 0.35 Bb |
| 30-CF | 7.35 ± 0.36 A | 7.25 ± 0.35 Aa | 7.27 ± 0.34 Aa | 7.11 ± 0.39 Aa | 7.18 ± 0.35 Aa |
| 50 | 6.24 ± 0.36 | 6.74 ± 0.35 A | 6.12 ± 0.34 b | 6.22 ± 0.39 | 6.36 ± 0.35 |
| 50-PGW | 6.02 ± 0.36 Bb | 5.78 ± 0.35 B | 5.54 ± 0.34 B | 5.85 ± 0.39 B | 6.10 ± 0.35 B |
| 50-PW | 6.69 ± 0.36 a | 6.60 ± 0.35 A | 6.33 ± 0.34 a | 6.53 ± 0.39 | 6.60 ± 0.35 |
| 50-P | 5.73 ± 0.36 B | 5.57 ± 0.35 B | 5.54 ± 0.34 B | 5.61 ± 0.39 B | 5.82 ± 0.35 B |
| 50-CF | 7.07 ± 0.36 Aa | 6.98 ± 0.35 A | 6.95 ± 0.34 A | 7.03 ± 0.39 A | 7.04 ± 0.35 Aa |
| p | 0.001 | 0.001 | 0.001 | 0.031 | 0.040 |
Disclaimer/Publisher’s Note: The statements, opinions and data contained in all publications are solely those of the individual author(s) and contributor(s) and not of MDPI and/or the editor(s). MDPI and/or the editor(s) disclaim responsibility for any injury to people or property resulting from any ideas, methods, instructions or products referred to in the content. |
© 2023 by the authors. Licensee MDPI, Basel, Switzerland. This article is an open access article distributed under the terms and conditions of the Creative Commons Attribution (CC BY) license (https://creativecommons.org/licenses/by/4.0/).
Share and Cite
Freschi, P.; Braghieri, A.; Pacelli, C.; Langella, E.; Riviezzi, A.M.; Paolino, R.; Cosentino, C. Sensory Profile and Consumer Liking of Sustainable Salamis Differing in Wild Boar Meat and Seasoning Ingredients Addition. Foods 2023, 12, 1089. https://doi.org/10.3390/foods12051089
Freschi P, Braghieri A, Pacelli C, Langella E, Riviezzi AM, Paolino R, Cosentino C. Sensory Profile and Consumer Liking of Sustainable Salamis Differing in Wild Boar Meat and Seasoning Ingredients Addition. Foods. 2023; 12(5):1089. https://doi.org/10.3390/foods12051089
Chicago/Turabian StyleFreschi, Pierangelo, Ada Braghieri, Corrado Pacelli, Emilia Langella, Amelia Maria Riviezzi, Rosanna Paolino, and Carlo Cosentino. 2023. "Sensory Profile and Consumer Liking of Sustainable Salamis Differing in Wild Boar Meat and Seasoning Ingredients Addition" Foods 12, no. 5: 1089. https://doi.org/10.3390/foods12051089