Article

Analysis of Dynamics and Diversity of Microbial Community during Production of Germinated Brown Rice

1
College of Mechanical and Electronic Engineering, Northwest A & F University, Xianyang 712100, China
2
Department of Biological Systems Engineering, Washington State University, 213 L.J. Smith Hall, Pullman, WA 99164-6120, USA
*
Author to whom correspondence should be addressed.
Foods 2023, 12(4), 755; https://doi.org/10.3390/foods12040755
Submission received: 23 December 2022 / Revised: 30 January 2023 / Accepted: 6 February 2023 / Published: 9 February 2023
(This article belongs to the Special Issue Recent Advances in the Food Safety and Quality Management Techniques)

Abstract

:
Sprouts may be contaminated with different pathogenic and spoilage microorganisms, which lead far too easily to foodborne outbreaks. The elucidations of microbial profiles in germinated brown rice (BR) are important, but the changes in the microbial composition during germination are unknown. This study aimed to investigate the microbiota composition and to monitor the dominant microbial dynamics in BR during germination using both culture-independent and -dependent methods. BR samples (HLJ2 and HN) were collected from each stage of the germination processing. The populations of microbes (total viable counts, yeast/mold counts, Bacillus cereus, and Enterobacteriaceae) of two BR cultivars increased markedly with the prolongation of the germination time. High-throughput sequencing (HTS) showed that the germination process significantly influenced the microbial composition and reduced the microbial diversity. Similar microbial communities were observed between the HLJ2 and the HN samples, but with different microbial richness. The bacterial and fungal alpha diversity achieved the maximum for ungerminated samples and declined significantly after soaking and germination. During germination, Pantoea, Bacillus, and Cronobacter were the dominant bacterial genera, but Aspergillus, Rhizopus, and Coniothyrium dominated for the fungi in the BR samples. The predominance of harmful and spoilage microorganisms in BR during germination is mainly from contaminated seeds, which highlights the potential risk of foodborne illness from sprouted BR products. The results provide new insight into the microbiome dynamics of BR and may help to establish effective decontamination measures against pathogenic microorganisms during sprout production.

Graphical Abstract

1. Introduction

Brown rice (BR), a processed product of rice only after shucking, is considered as whole grain and has attracted widespread attention due to its rich nutritional components [1]. Germination is an effective process to improve the nutritional quality, digestibility, and flavor of cereals [2]. Currently, germinated brown rice (GBR) has gained significant attention due to the use of a processing approach to enhance the food quality and potential health-promoting functions [3]. However, due to the high nutritional values in the sprouts and the suitable environment in the BR germination process, the rice grain-associated microorganisms can readily proliferate on the surface of BR [4,5]. It has also been shown that the microbial community of the grains influences the quality of the sprouts and may also cause a risk of foodborne illness [6,7,8]. More importantly, there are limited reports on the systematic elucidation of the microbial profile during the germination of BR.
A previous study reported by Kim et al. [4] determined the microbial counts of total mesophilic aerobic bacteria, lactic acid bacteria (LAB), and Enterobacteriaceae during BR germination processing. Bourneow and Toontam [6] indicated that the aerobic mesophilic bacteria, yeasts, and molds were found in the initial stage of BR germination, but the LAB were found in the late phase of the process. These microbial contaminations of sprouted products mainly derived from the initial microbes of the seeds. The microflora of cereal grains or seeds depends on the stage of processing or the environmental conditions, including the pre-harvest practices, the decontamination treatment, and the seed storage [7,9]. The common bacteria in cereal grains are mainly Pseudomonadaceae, Micrococcaceae, Lactobacillaceae, and Bacillaceae [10], which are generally non-pathogenic. Nevertheless, pathogens such as Salmonella, Cronobacter sakazakii, and Bacillus cereus can also contaminate the grains. BR was shown to be contaminated with total mesophilic bacteria, LAB, total coliforms, enterococci, yeasts, and molds at the levels of 7.45, 3.84, 3.08, 1.30, and 4.41 log colony-forming units (CFU)/g, respectively [11]. Additionally, microbiological surveys have shown the association of a variety of foodborne pathogens in sprouts [7]. Dechet et al. [12] reported 33 foodborne outbreaks in the United States from 1998 to 2010 due to the consumption of seed and bean sprouts, which affected 1330 persons. A study has also shown that Salmonella was the leading pathogen of foodborne outbreaks in the European Union from 2004 to 2012 [13]. The microbial contamination may result in a fermented odor or another unpleasant odor in GBR [6]. In addition, the growth of microorganisms may consume some macromolecular substances in sprouts and alter the enzyme activity, which adversely affects the formation of the nutrients [14].
Recently, many studies have used conventional culture-dependent methods to investigate the microbial diversity [4,6]. However, these methods may not completely reflect the microflora information since several strains are difficult to isolate and cultivate due to the specific culture conditions, such as a certain temperature, moisture, oxygen concentration, and media [8]. High-throughput sequencing (HTS) based on culture-independent techniques is now commonly employed to analyze the microbial community and dynamics in food-based ecosystems, such as cereal grain fermentation [15,16], sprout storage [17], and pretreatment on grains [18,19]. Indeed, an HTS approach was employed to access the microbial composition in several sprouts, such as alfalfa, mung beans, radish, and barley [8,17,20]. However, systematic changes in the microbiota, including the bacterial and fungal communities during the germination of BR, have not been reported. Consequently, the objective of this study was to determine the microbial diversity changes in the natural microbiota in the seeds at different BR germination stages and to reveal the dynamics of the dominant microbiota from seed to sprout. Analysis of the microbial community and the dominant genera dynamics during the germination of BR can provide the microbial profiles of the pathogens and spoilage microbes that need to be controlled. Elucidations of microbiota changes (including microbial diversity and the dynamics of the dominant genera) may facilitate the determination of effective decontamination measures during GBR production.

2. Materials and Methods

2.1. Brown Rice Samples and Preparation

Thirteen different BR samples were purchased from the major production provinces (Anhui, Guangdong, Guangxi, Hubei, Heilongjiang, Hunan, Jiangsu, Jiangxi, Liaoning, and Sichuan) in China. The initial moisture content (MC) of the BR samples was measured using a moisture analyzer (HE53, Mettler-Toledo, Shanghai, China). The BR samples were stored at 4 °C until used for the experiments.

2.2. Germination of Brown Rice

The germination process was conducted according to Moongngarm and Saetung [21], with some modifications. The BR kernels (100 g) were soaked in sterilized distilled water at a ratio of 1:5 (w/v) at 30 °C for 12 h, and the used water was replaced every 6 h. After washing, the BR grains were drained and spread in Petri dishes (90 mm inner diameter), covered with two wet layers of sterilized filter paper, and germinated in a constant temperature and humidity chamber (HWS-150, Senxin Experimental Instrument Co., Ltd., Shanghai, China) at 30 °C for 48 h. During the germination period, the grains were sprayed with distilled water every 6 h to maintain humidity. Samples were collected at 12 h intervals. Untreated BR grains were used as the ungerminated samples (control) in this study.

2.3. Microbiological Determination

For each ungerminated and germinated BR, samples (3 g) were taken and transferred into sterile tubes containing 27 mL sterile saline (0.85% NaCl) and mixed completely by vortex (CY-30S, Yueqia Experimental Instrument Co., Ltd., Shanghai, China). After serial dilution (1:10), 0.1 mL of diluent was spread on (1) plate count agar (Luqiao Co. Ltd., Beijing, China) to enumerate the total viable counts (TVC) and incubated at 37 °C for 48 h; (2) rose bengal medium (Luqiao Co. Ltd., Beijing, China) and incubated at 28 °C for 72 h to enumerate the yeast and mold counts; (3) mannitol–egg yolk–polymyxin agar (Hopebio, Qingdao, China) to enumerate the B. cereus and incubated at 37 °C for 24 h; and (4) violet red bile glucose agar (Luqiao Co. Ltd., Beijing, China) and placed at 37 °C for 24 h to determine the Enterobacteriaceae counts. The counted and reported colonies on the plate of each sample were converted into log10 CFU/g.

2.4. Microbial Diversity Analysis

2.4.1. DNA Extraction and PCR Amplification

Ungerminated and germinated BR grains (10 g) were added into sterile 50 mL centrifuge tubes containing the maximum recovery diluent and vigorously shaken for 15 min. The solution was centrifuged (8000 rpm, 10 min, 4 °C), and the pellet was washed three times and resuspended in sterile saline. The final pellet was stored at −80 °C until used, and then, it was used for the extraction of microbial genomic DNA using a Power Water DNA Isolation Kit (MO BIO Laboratories, Carlsbad, CA, USA) according to the manufacturer’s instructions. The DNA concentration was quantified with a Qubit Fluorometer by using the Qubit dsDNA BR Assay kit (Invitrogen, Carlsbad, CA, USA), and the purity was checked by running aliquot on a 1% agarose gel.
Variable regions (V3-V4) of the bacterial 16S rRNA gene were amplified with the primer pairs 341F (5′-ACTCCTACGGGAGGCAGCAG-3′) and 806R (5′-GGACTACHVGGGTWTCTAAT-3′). The fungal ITS2 of the Internal Transcribed Spacer (ITS) region was amplified with the primer pairs ITS3F (5′-GCATCGATGAAGAACGCAGC-3′) and ITS4R (5′-TCCTCCGCTTATTGATATGC-3′). The PCR amplification was performed as follows: 94 °C for 3 min, 30 cycles of 94 °C for 30 s, 56 °C (16S) or 58 °C (ITS) for 45 s, 72 °C for 45 s, and a final extension at 72 °C for 10 min. The PCR products were purified with AmpureXP beads and eluted in elution buffer. In the PCR amplification, the complete reaction mixtures were set up, and no template controls in the reactions were used.

2.4.2. Sequencing and Bioinformatics Processing

The purified amplicons were pooled in equimolar and paired-end sequenced (2 × 300) on an Illumina MiSeq platform (Illumina, San Diego, CA, USA) using a TruSeq™ sample preparation kit (Illumina Inc., San Diego, CA, USA) and conducted by BGI Genomics, Shenzhen, China. The sequence data obtained from the high-throughput analysis in this study were deposited in the NCBI BioProject PRJNA896727 (Bacteria) and PRJNA896764 (Fungi).
Raw reads were filtered to remove adaptors and low-quality and ambiguous bases, and then, the paired-end reads were added to tags by the FLASH reads program (v1.2.11) [22]. The tags were clustered into operational taxonomic units (OTUs) with a cutoff value of 97% using UPARSE software (v7. 0.1090, http://drive5.com/uparse/, accessed on 4 October 2021) [23], and the chimera sequences were compared with the Gold database (v20110519) or UNITE (v20170628) using UCHIME (v4.2.40) [24]. Then, the OTU representative sequences were taxonomically classified using Ribosomal Database Project (RDP) Classifier v.2.2, with a minimum confidence threshold of 0.6, and trained on the Greengenes database v201305 by QIIME v1.8.0 [25]. USEARCH_global was used to compare all the tags back to the OTUs to obtain the OTU abundance statistics table of each sample [26].
The alpha and beta diversity were estimated by MOTHUR (v1.31.2) [27] and QIIME (v1.8.0) at the OTU level, respectively. The sample cluster was conducted by QIIME (v1.8.0) based on UPGMA. The bar plot and heatmap of the different classification levels were plotted with R package v3.4.1 and R package “gplots”, respectively. Principal co-ordinates analysis (PCoA) was used to determine the difference in bacterial community composition between the samples. The LDA effect size (LEfSe) cluster or LDA analysis was conducted by LEfSe. Based on the species annotation and the abundance of effective OTUs, the functional annotations were obtained based on the Kyoto Encyclopedia of Genes and Genomes (KEGG) pathway using Tax4Fun v1.0. The significant species or functions were determined by R (v3.4.1) based on the Wilcox test or the Kruskal test.

2.5. Statistical Analysis

The statistical analyses were performed using SPSS software (Version 24.0; SPSS, Inc, Chicago, IL, USA). The data are presented as the mean ± SD (n = 3), and the differences between the means were tested via one-way ANOVA. Individual or replicate samples from each province were analyzed. All experiments were performed in triplicate, and each biological experiment included three technical replicates. A p value < 0.05 was considered statistically significant.

3. Results

3.1. Natural Microbial Counts of BR Samples

The microbiological profiles of 13 BR samples, including the TVC, the yeast/mold counts, and the B. cereus and Enterobacteriaceae counts, are listed in Table 1. The TVC and yeast/mold counts of 13 samples were in the range of 4.10–5.86 log CFU/g and 3.93–5.33 log CFU/g, respectively. Apart from the LN2 sample, the foodborne pathogen B. cereus could be detected in the remaining 12 samples. The B. cereus counts detected from the nine BR samples (AH2, GD, GX, HB, HLJ2, HN, JS, LN1, and SC) ranged from 1.54 to 2.59 log CFU/g. The Enterobacteriaceae counts in the 13 BR samples varied from 3.09 to 5.22 log CFU/g. There were significant differences (p < 0.05) in the counts of the yeast/mold, B. cereus, and Enterobacteriaceae among the 13 BR samples, and the results indicated that the BR could be easily contaminated by various microbes.

3.2. Microbiological Changes during BR Germination

Two different cultivars of BR samples (Japonica, HLJ2 and Indica, HN) were selected for further study according to the microbial loads and germination rate from 13 samples (0–90.3%). The germination rate of the HLJ2 (73.3%) and HN (90.3%) samples was higher compared to the other samples (<70%) after germination for 48 h. The changes in the microbial enumeration of both samples at different germination times are presented in Figure 1. It was obvious that the TVC, the yeast/mold counts, and the B. cereus and Enterobacteriaceae numbers of the HLJ2 and HN samples increased significantly during the process of soaking and germination. After soaking for 12 h, the B. cereus, TVC, yeast/mold, and Enterobacteriaceae counts of HLJ2 significantly increased from 1.77 to 3.71, 4.98 to 6.90, 4.10 to 5.68, and 3.98 to 6.65 log CFU/g, respectively (Figure 1A). However, for the HN sample, there was no significant difference (p > 0.05) in the B. cereus numbers after soaking (Figure 1B). After germination for 48 h, the B. cereus, TVC, yeast/mold, and Enterobacteriaceae counts of the HLJ2 samples increased to 6.85, 9.83, 9.21, and 9.82 log CFU/g, respectively. Similarly, for the HN samples, these microbial counts increased to 6.40, 9.89, 8.91, and 9.84 log CFU/g, respectively. These results showed that the populations of microbes rose markedly during the BR germination.

3.3. Microbiome Analysis

3.3.1. Community Abundance and Diversity

Effective sequences of 2,132,479 and 2,267,150 were entirely obtained from the 16S rRNA and ITS libraries, respectively. The sequences were clustered in 2311 bacterial OTUs (ranging from 31 to 234) and 3558 fungal OTUs (ranging from 14 to 319) using a 97% similarity threshold. As shown in Supplementary Tables S1 and S2, the Good’s coverage value was more than 99.9% with regard to both the bacterial and the fungal community abundance, demonstrating that the samples had a high coverage rate. The rarefaction curves (Supplementary Figure S1) for the 16S rRNA and ITS gene sequences tended to be saturated, indicating that the sequencing results could truly reflect the microbial profile during BR germination. The trend of the microbial species number under the two BR samples was consistent with the findings on the alpha diversity analysis (Supplementary Tables S1 and S2), assessed using the Sobs, Chao, ACE, Shannon, and Simpson indexes. For the bacteria, the OTUs and the Chao, ACE, and Shannon indexes in the HLJ2 and HN samples decreased during germination. The highest indexes were found in the ungerminated samples (HLJ2 and HN), which were 220, 236, 240, and 3.14 as well as 156, 171, 178, and 3.01, respectively. For the species diversity and richness of fungi, the indexes in the HLJ2 and HN samples decreased during germination. Similarly, these indexes reached the maximum in the ungerminated samples and were 309, 355, 363, and 2.95 as well as 252, 276, 281, and 3.04, respectively. These changes in the four indexes indicated that the richness and diversity decreased during germination, suggesting that a subset of bacteria or fungi became dominant in the BR samples.
Based on the OTU abundance, Venn diagrams (samples < 5) and flower diagrams (samples > 5) were used to show the shared and unique OTUs in each group. The Venn diagrams showed that there were 170 common OTUs for the bacteria and 226 for the fungi in two cultivars (Supplementary Figure S2). The number of unique OTUs for the bacteria was 110 in HLJ2 and 41 in HN; for the fungi, it was 150 in HLJ2 and 108 in HN. For the bacteria, the HLJ2 samples shared 25 OTUs, which were slightly lower than those (30) in the HN samples. The numbers of unique OTUs decreased obviously in the two BR cultivars (Supplementary Figure S3A,B). The ungerminated samples (HLJ2 and HN) had the highest unique OTU (183 and 145) numbers, and the unique OTUs were found to have reduced to a minimum of 0 after germinating for 48 h. For the fungi, the HLJ2 samples shared 42 OTUs, which were higher than those (20) in the HN samples (Supplementary Figure S3C,D). It was also found that the numbers of unique OTUs decreased obviously in the two BR cultivars. These results indicated that new species (except fungi) rarely appeared, and only certain species were found during germination.
Principal coordinates analysis (PCoA) was used to analyze the data similarities or differences in the bacterial and fungal communities between the samples. There were significant differences in the beta diversity of the bacterial communities in the HLJ2 samples (unweighted UniFrac, R2 = 0.7952, p = 0.0001) and the HN samples (unweighted UniFrac, R2 = 0.8384, p = 0.0001) among the different development stages (Figure 2A,B). For the HLJ2 and HN samples, the bacterial communities in the ungerminated and soaked stages were obviously separated, and the other samples in the germinated stages were clustered together. However, significance was confirmed only for the ungerminated BR samples (J_CK and I_CK) using PERMANOVA tests among the samples (p < 0.05). For the fungi, the HLJ2 and HN samples exhibited similar clustering and separating trends (except for the soaked samples clustered with the ungerminated samples), suggesting differences in their microbiota after germination (Figure 2C,D). The beta diversity between the two cultivars at each development stage was also compared (Figure 2C,F). The results revealed that the microbial communities between the HLJ2 and the HN samples were not significantly different at each stage (p > 0.05).
Overall, the diversity analysis demonstrated that the structures of the microbial communities at the different germination stages of the two BR cultivars were obviously different. In particular, the germination process had a significant effect on the microbiota in the BR samples. Further analysis of each stage is also required to identify rapid changes in the microbial community structure.

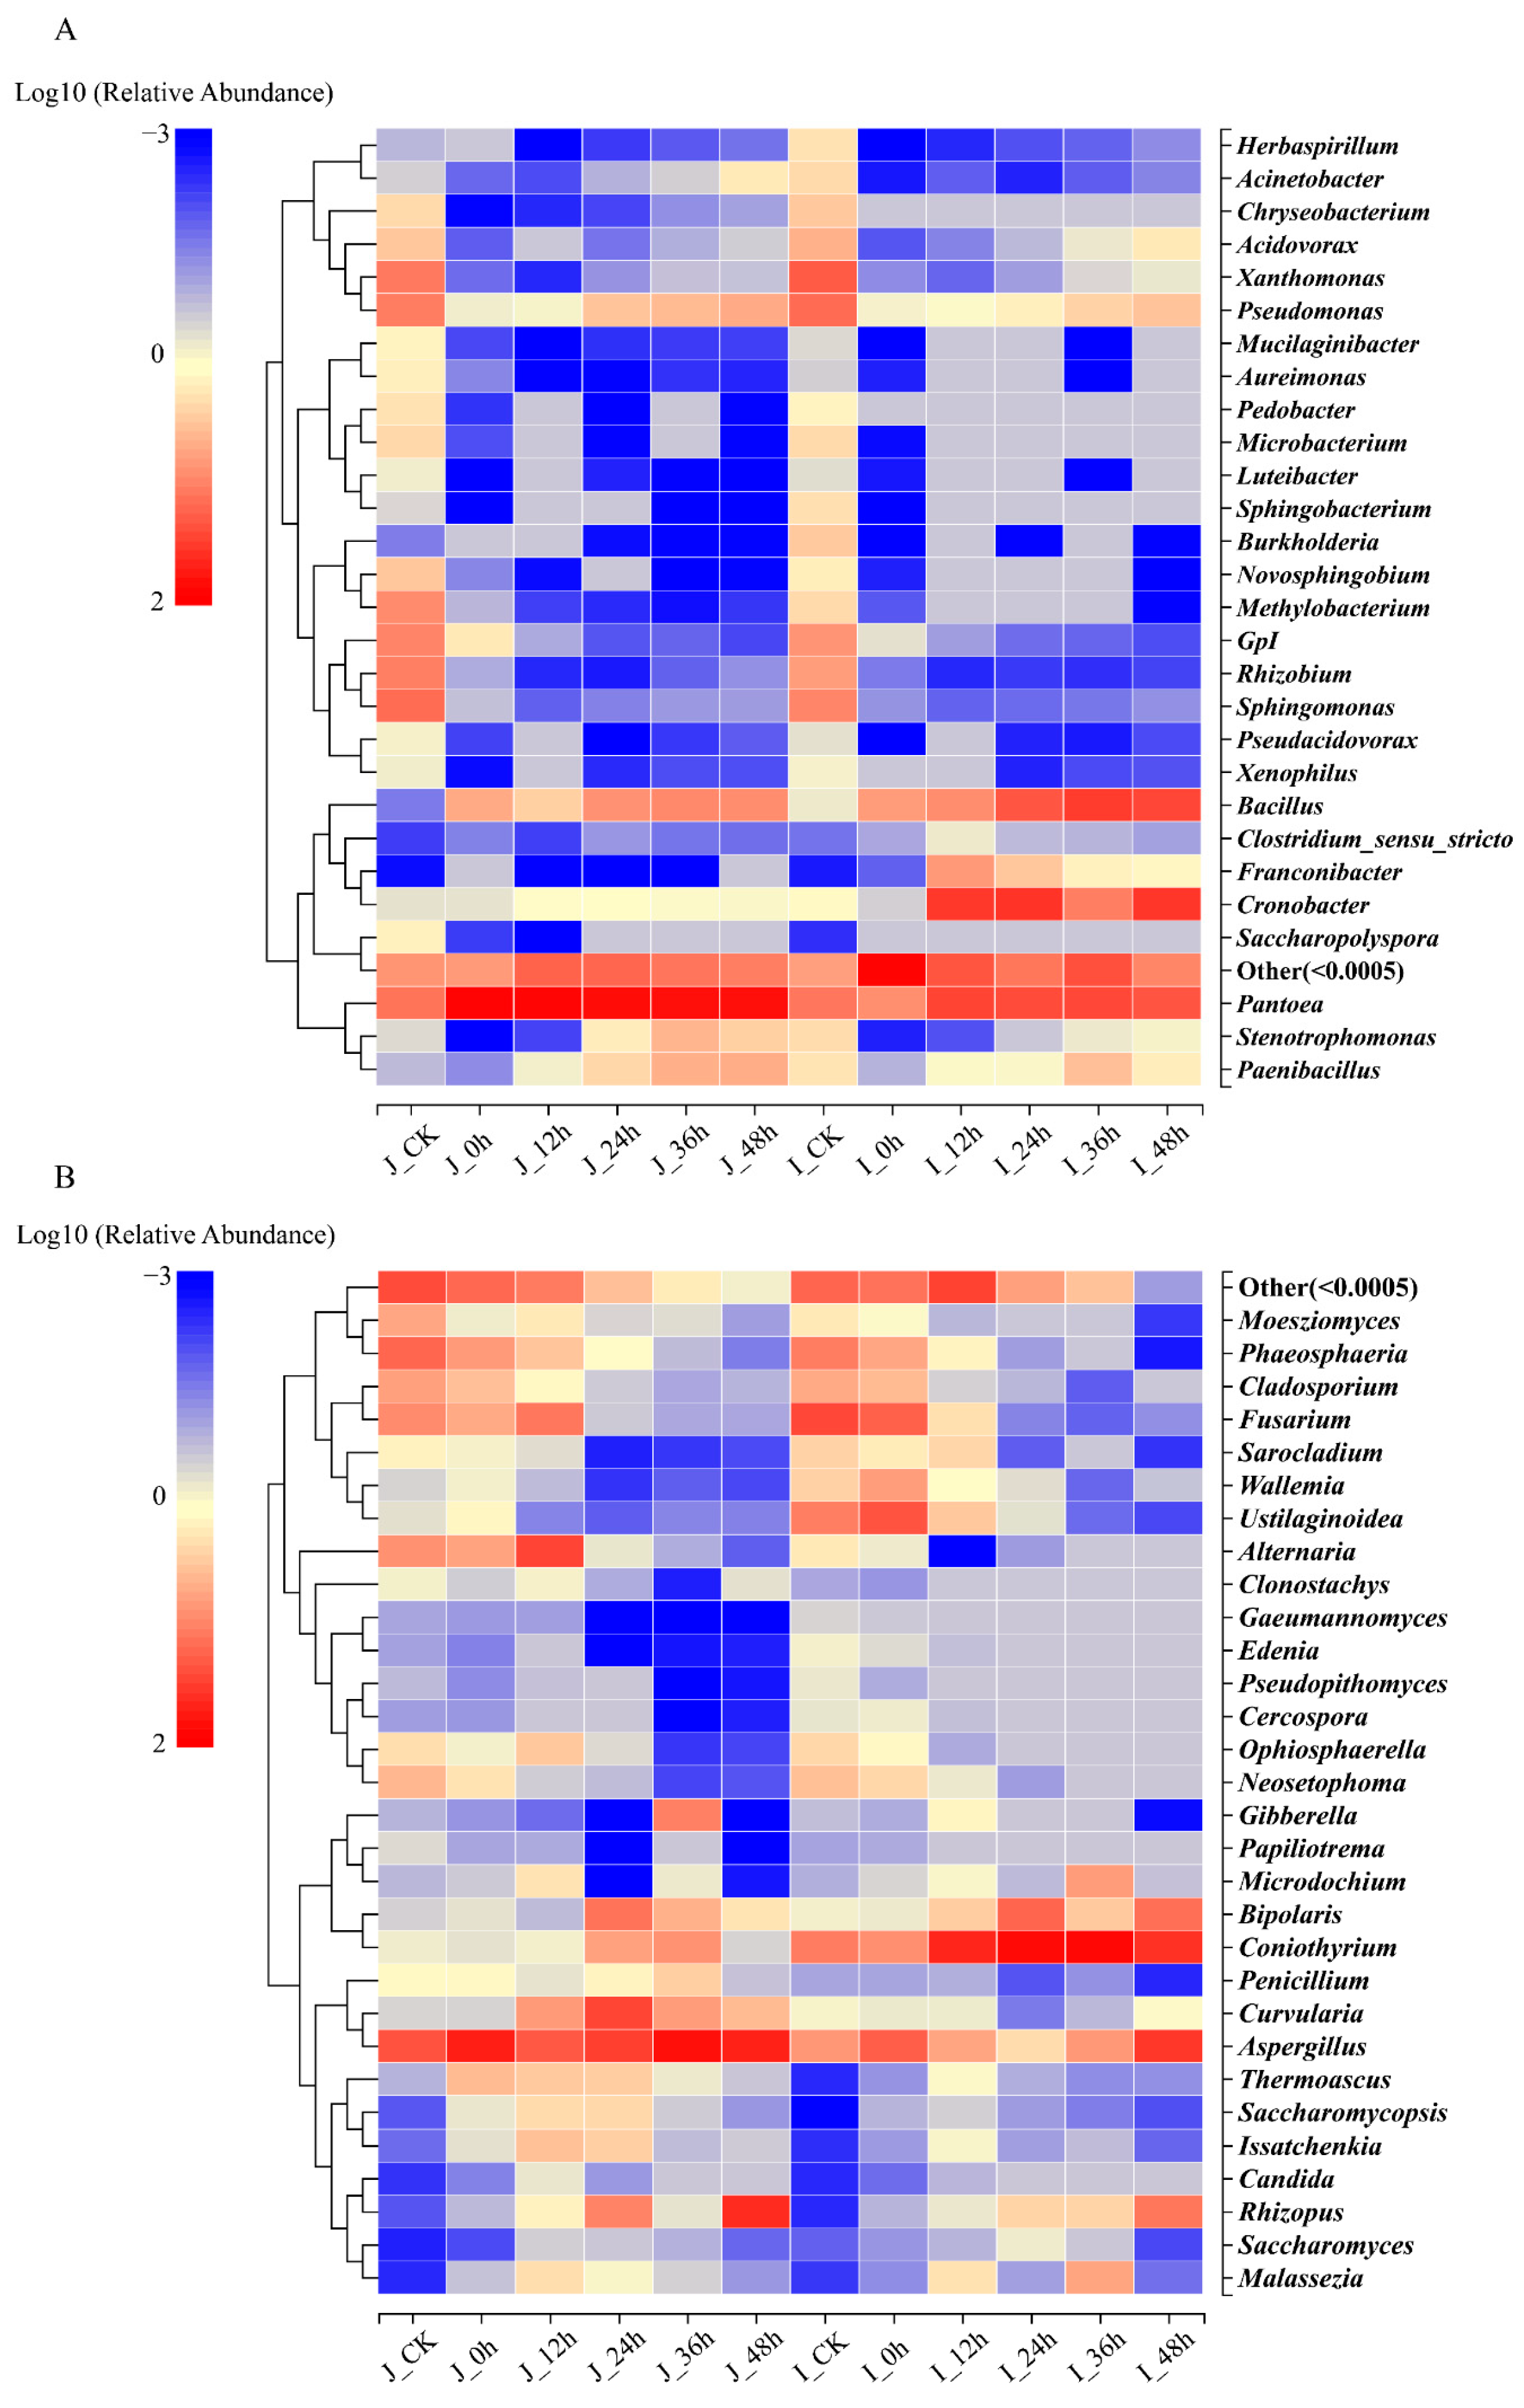
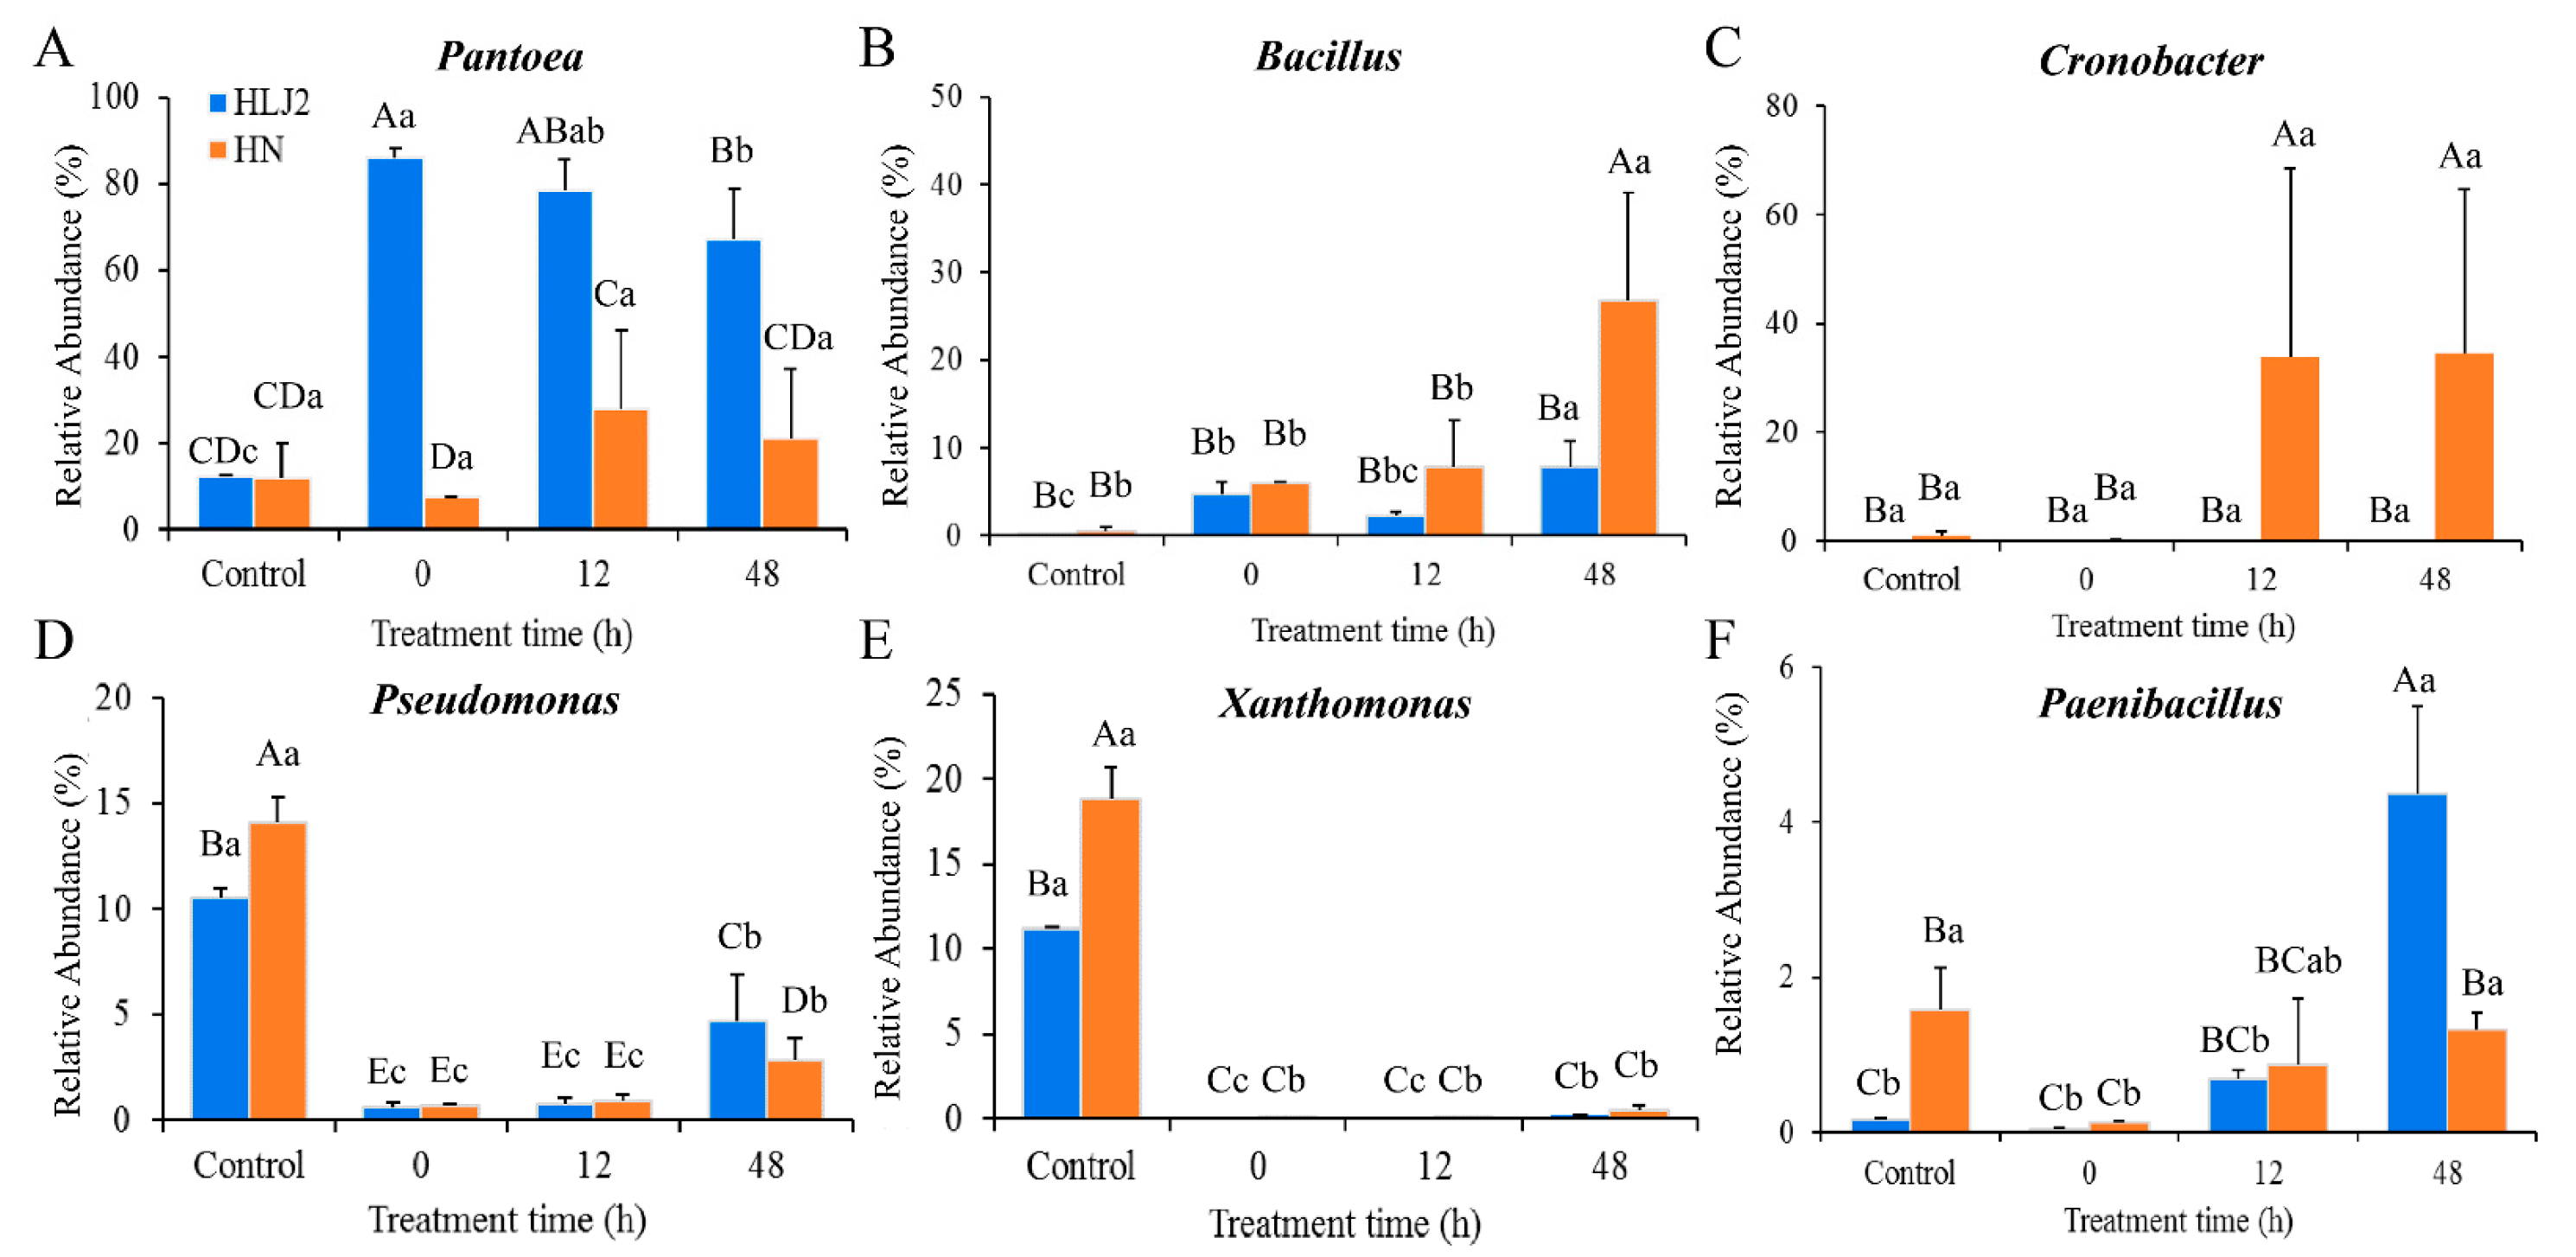
3.3.2. Composition Analysis of Bacterial Community during BR Germination

Fourteen bacterial phyla were detected by taxonomical classification in all the samples (Figure 3A), but there were no significant differences between the HLJ2 and the HN samples in terms of the bacterial community composition. For the HLJ2 and the HN samples, Proteobacteria (79.14% and 82.18%), Cyanobacteria (9.10% and 6.77%), and Bacteroidetes (5.78% and 6.00%) were the dominant phyla in the ungerminated stage. However, Cyanobacteria and Bacteroidetes (<0.001%) nearly disappeared, and Proteobacteria (87.69% and 71.79%) and Firmicutes (12.18% and 28.20%) became the major phyla after germination for 48 h.
At the genus level, the bacterial composition of the BR samples was significantly influenced by the germination process (Figure 3B). No significant difference in bacterial composition was observed between the ungerminated HLJ2 and HN samples, while the bacterial communities and relative abundances of the genera were obviously different in the two cultivars during germination processing. A total of 130 genera were detected among all the stages of the HLJ2 samples. The genera with a relative abundance of greater than 5% were Sphingomonas (13.78%), Pantoea (12.28%), Xanthomonas (11.18%), Pseudomonas (10.55%), Rhizobium (9.99%), GPI (9.06%, GPI belongs to the Cyanobacteria group), and Methylobacterium (8.10%), respectively. The abundance of Pantoea obviously increased (86.03%) after the soaking process and was reduced to 67.73% at the end of germination stage due to the other species gradually increasing in numbers. Bacillus and Paenibacillus were also detected to have increased, with the abundances of 7.79% and 4.37% after germination for 48 h. For the HN samples, the top six abundant genera (relative abundance > 5%) included Xanthomonas (18.84%), Pseudomonas (14.12%), Pantoea (11.83%), Sphingomonas (9.00%), GPI (6.77%), and Rhizobium (5.77%), which accounted for 66.33% of all of the genera in the ungerminated samples. Notably, Cronobacter was dominant in the HN samples, with an abundance of 34.99% after germination for 48 h, followed by Bacillus and Pantoea at 26.79% and 21.06%. It was indicated that the major bacterial genera in the BR samples shifted significantly after germination treatment.

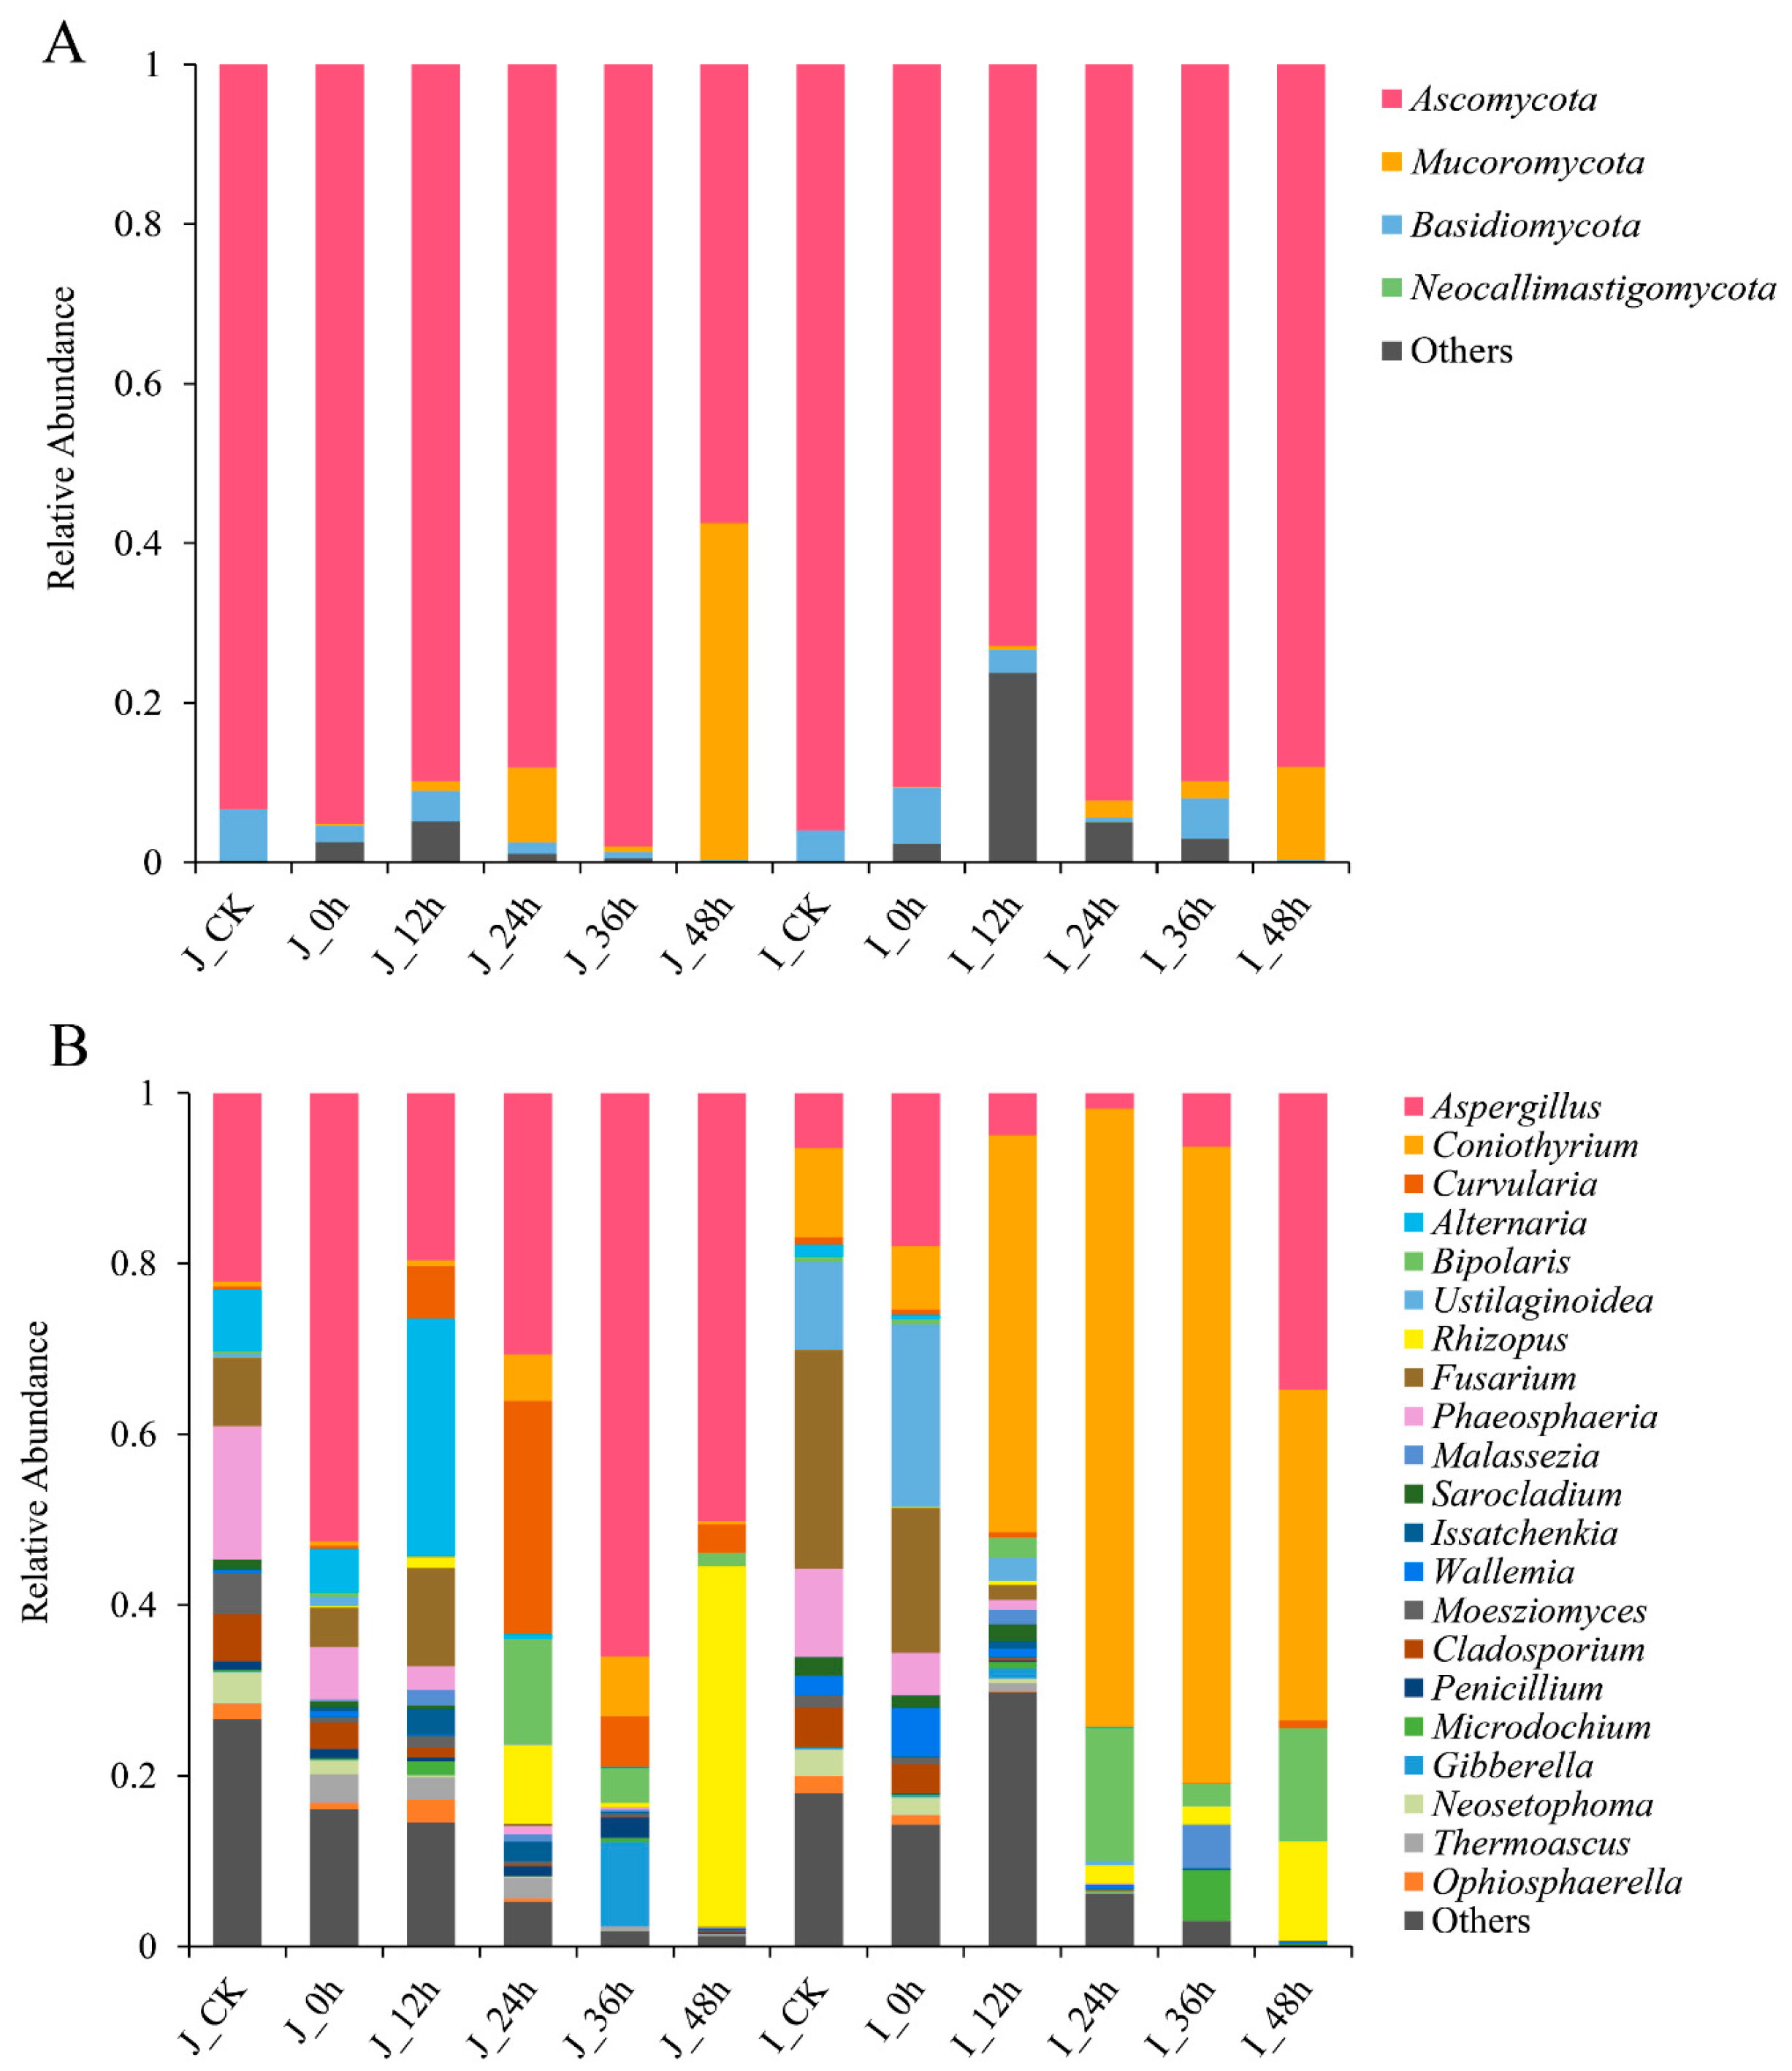
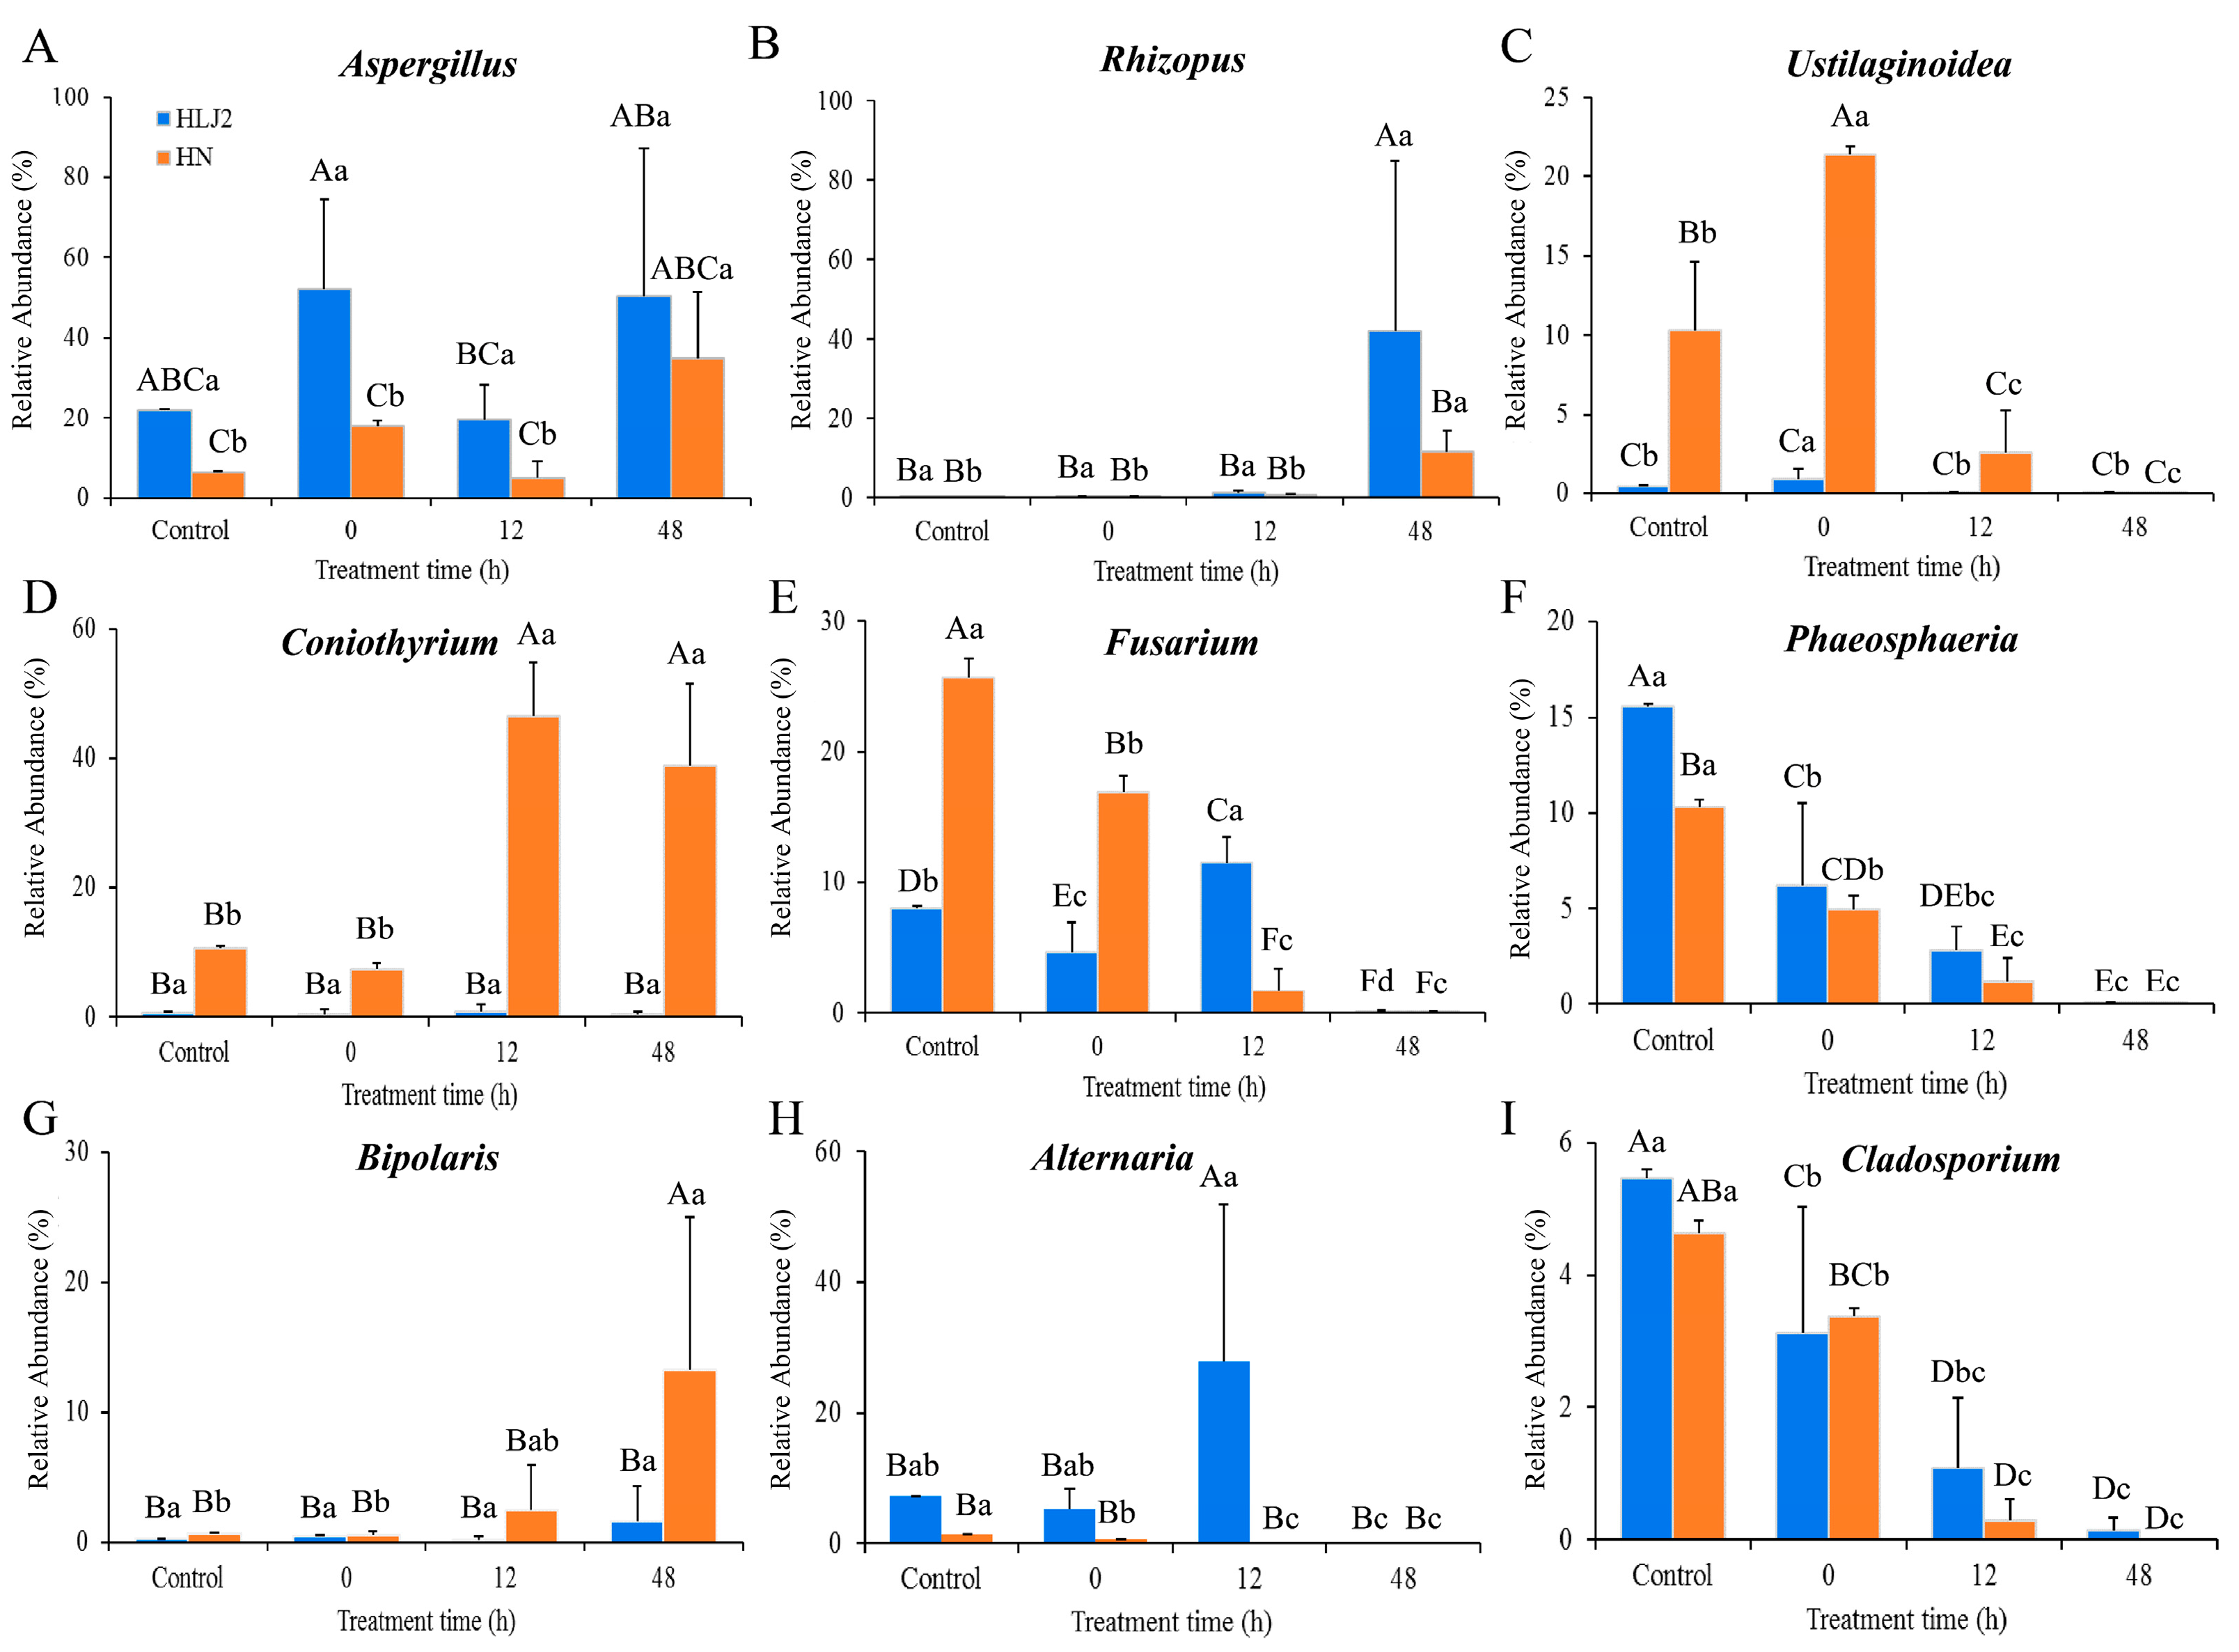
3.3.3. Composition Analysis of Fungal Community during BR Germination

The fungal community comprised four phyla, including Ascomycota, Mucoromycota, Basidiomycota, and Neocallimastigomycota in the all samples (Figure 4A). Ascomycota was always the dominant phylum, with the relative abundance ranging from 57.45 to 98.04% and 72.87 to 95.94% in the HLJ2 and HN samples. During germination, the abundance of Ascomycota gradually decreased but that of Mucoromycota increased.
At the genus level, a total of 170 fungal genera were detected in all the samples, and 21 genera are shown in Figure 4B. The germination process obviously influenced the fungal composition of the HLJ2 and HN samples. A similar fungal composition was detected between the HLJ2 and the HN samples at the ungerminated stage. However, the differences in the abundance of the fungal communities between the two cultivars were significant during the germination process (p < 0.05). There were 18 genera determined in the ungerminated HLJ2 samples, and the top 5 genera were Aspergillus (22.09%), Phaeosphaeria (15.58%), Fusarium (8.06%), Alternaria (7.21%), and Cladosporium (5.47%). After germination for 48 h, Aspergillus and Rhizopus were the main groups, with the relative abundances of 50.20% and 42.21%. The relative abundances of the other genera, especially Alternaria and Curvularia, were also increased by the germination process. Fifteen genera of fungi were detected during the germination process in the HN samples. It was found that the fungal diversity was obviously quite different from that of the HLJ2 samples. For the ungerminated samples, the top five genera were Fusarium (25.69%), Coniothyrium (10.51%), Phaeosphaeria (10.30%), Ustilaginoidea (10.24%), and Aspergillus (6.44%). During the germination phase, Coniothyrium was the main dominant genus. The abundance of Coniothyrium increased after germination for 12 h but then decreased at 48 h. In addition, Aspergillus, Bipolaris, and Rhizopus were more abundant after germination, but the abundance of Fusarium, Ustilaginoidea, and Phaeosphaeria decreased (Figure 4B).

3.3.4. Comparison of Microbial Community Structure between HLJ2 and HN Samples

To compare the microbial composition and community dynamics of the two cultivars under different periods, a heatmap was constructed at the genera level (Figure 5). As shown in Figure 5, the dominant bacterial species were significantly different among the different periods during the BR germination. The relative abundance of Sphingomonas, Xanthomonas, and Pseudomonas decreased rapidly, whereas the abundance of Pantoea increased obviously at the germinated stages. Importantly, the relative abundance of Bacillus in the two cultivars and Cronobacter in the HN samples was significantly higher in the germinated periods than in the ungerminated samples (Figure 5A). For the fungi, the most abundant genera in the HN samples were Aspergillus, Phaeosphaeria, Fusarium, and Alternaria at the initial stage, and their abundance reduced markedly with the extension of the germination time, except for that of Aspergillus. In contrast, the abundance of Coniothyrium showed the trend of growth for the germinated stages and became the dominant genus (Figure 5B). It showed that the germination process remarkably influenced the bacterial and fungal colony structures.

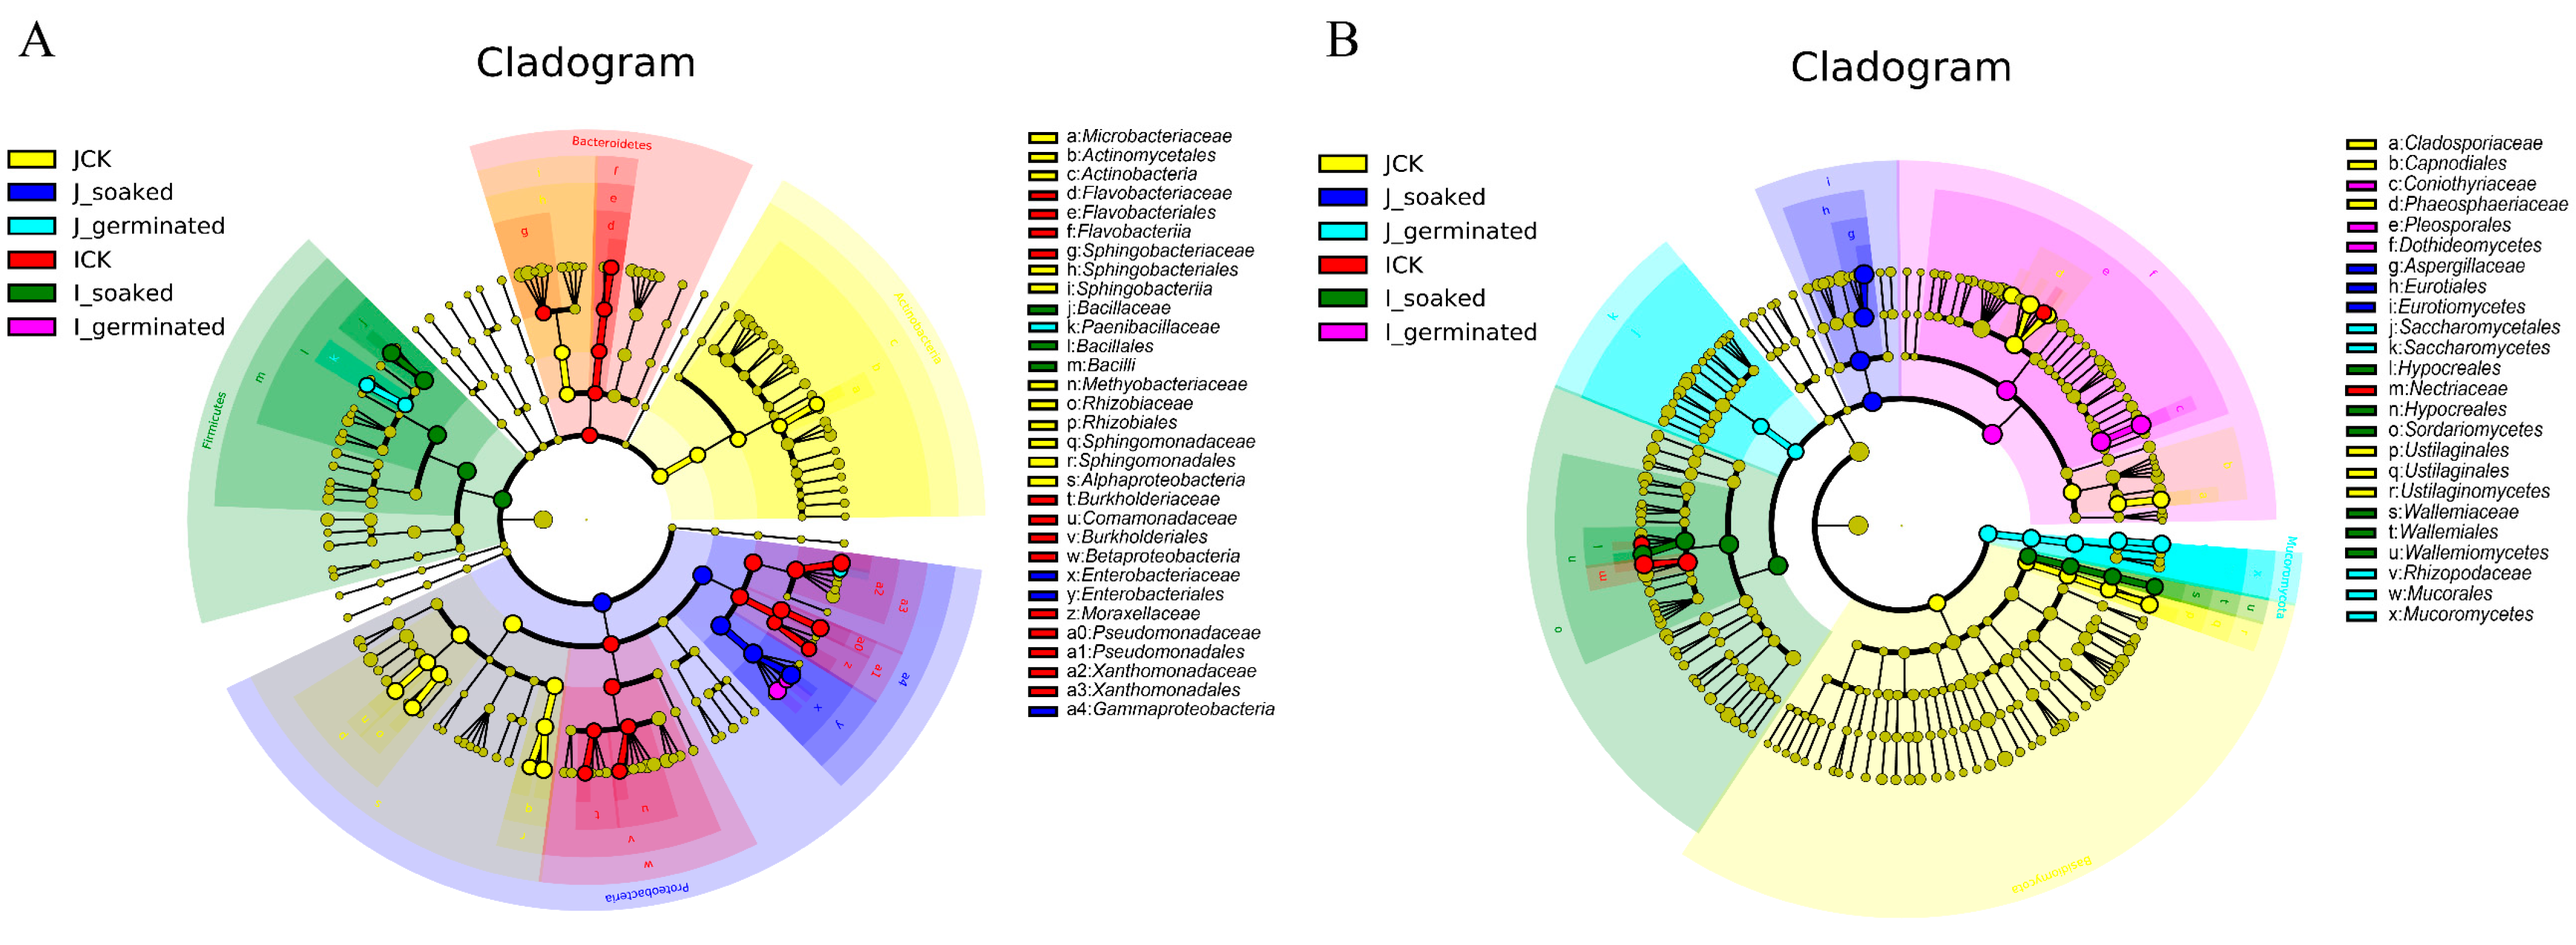
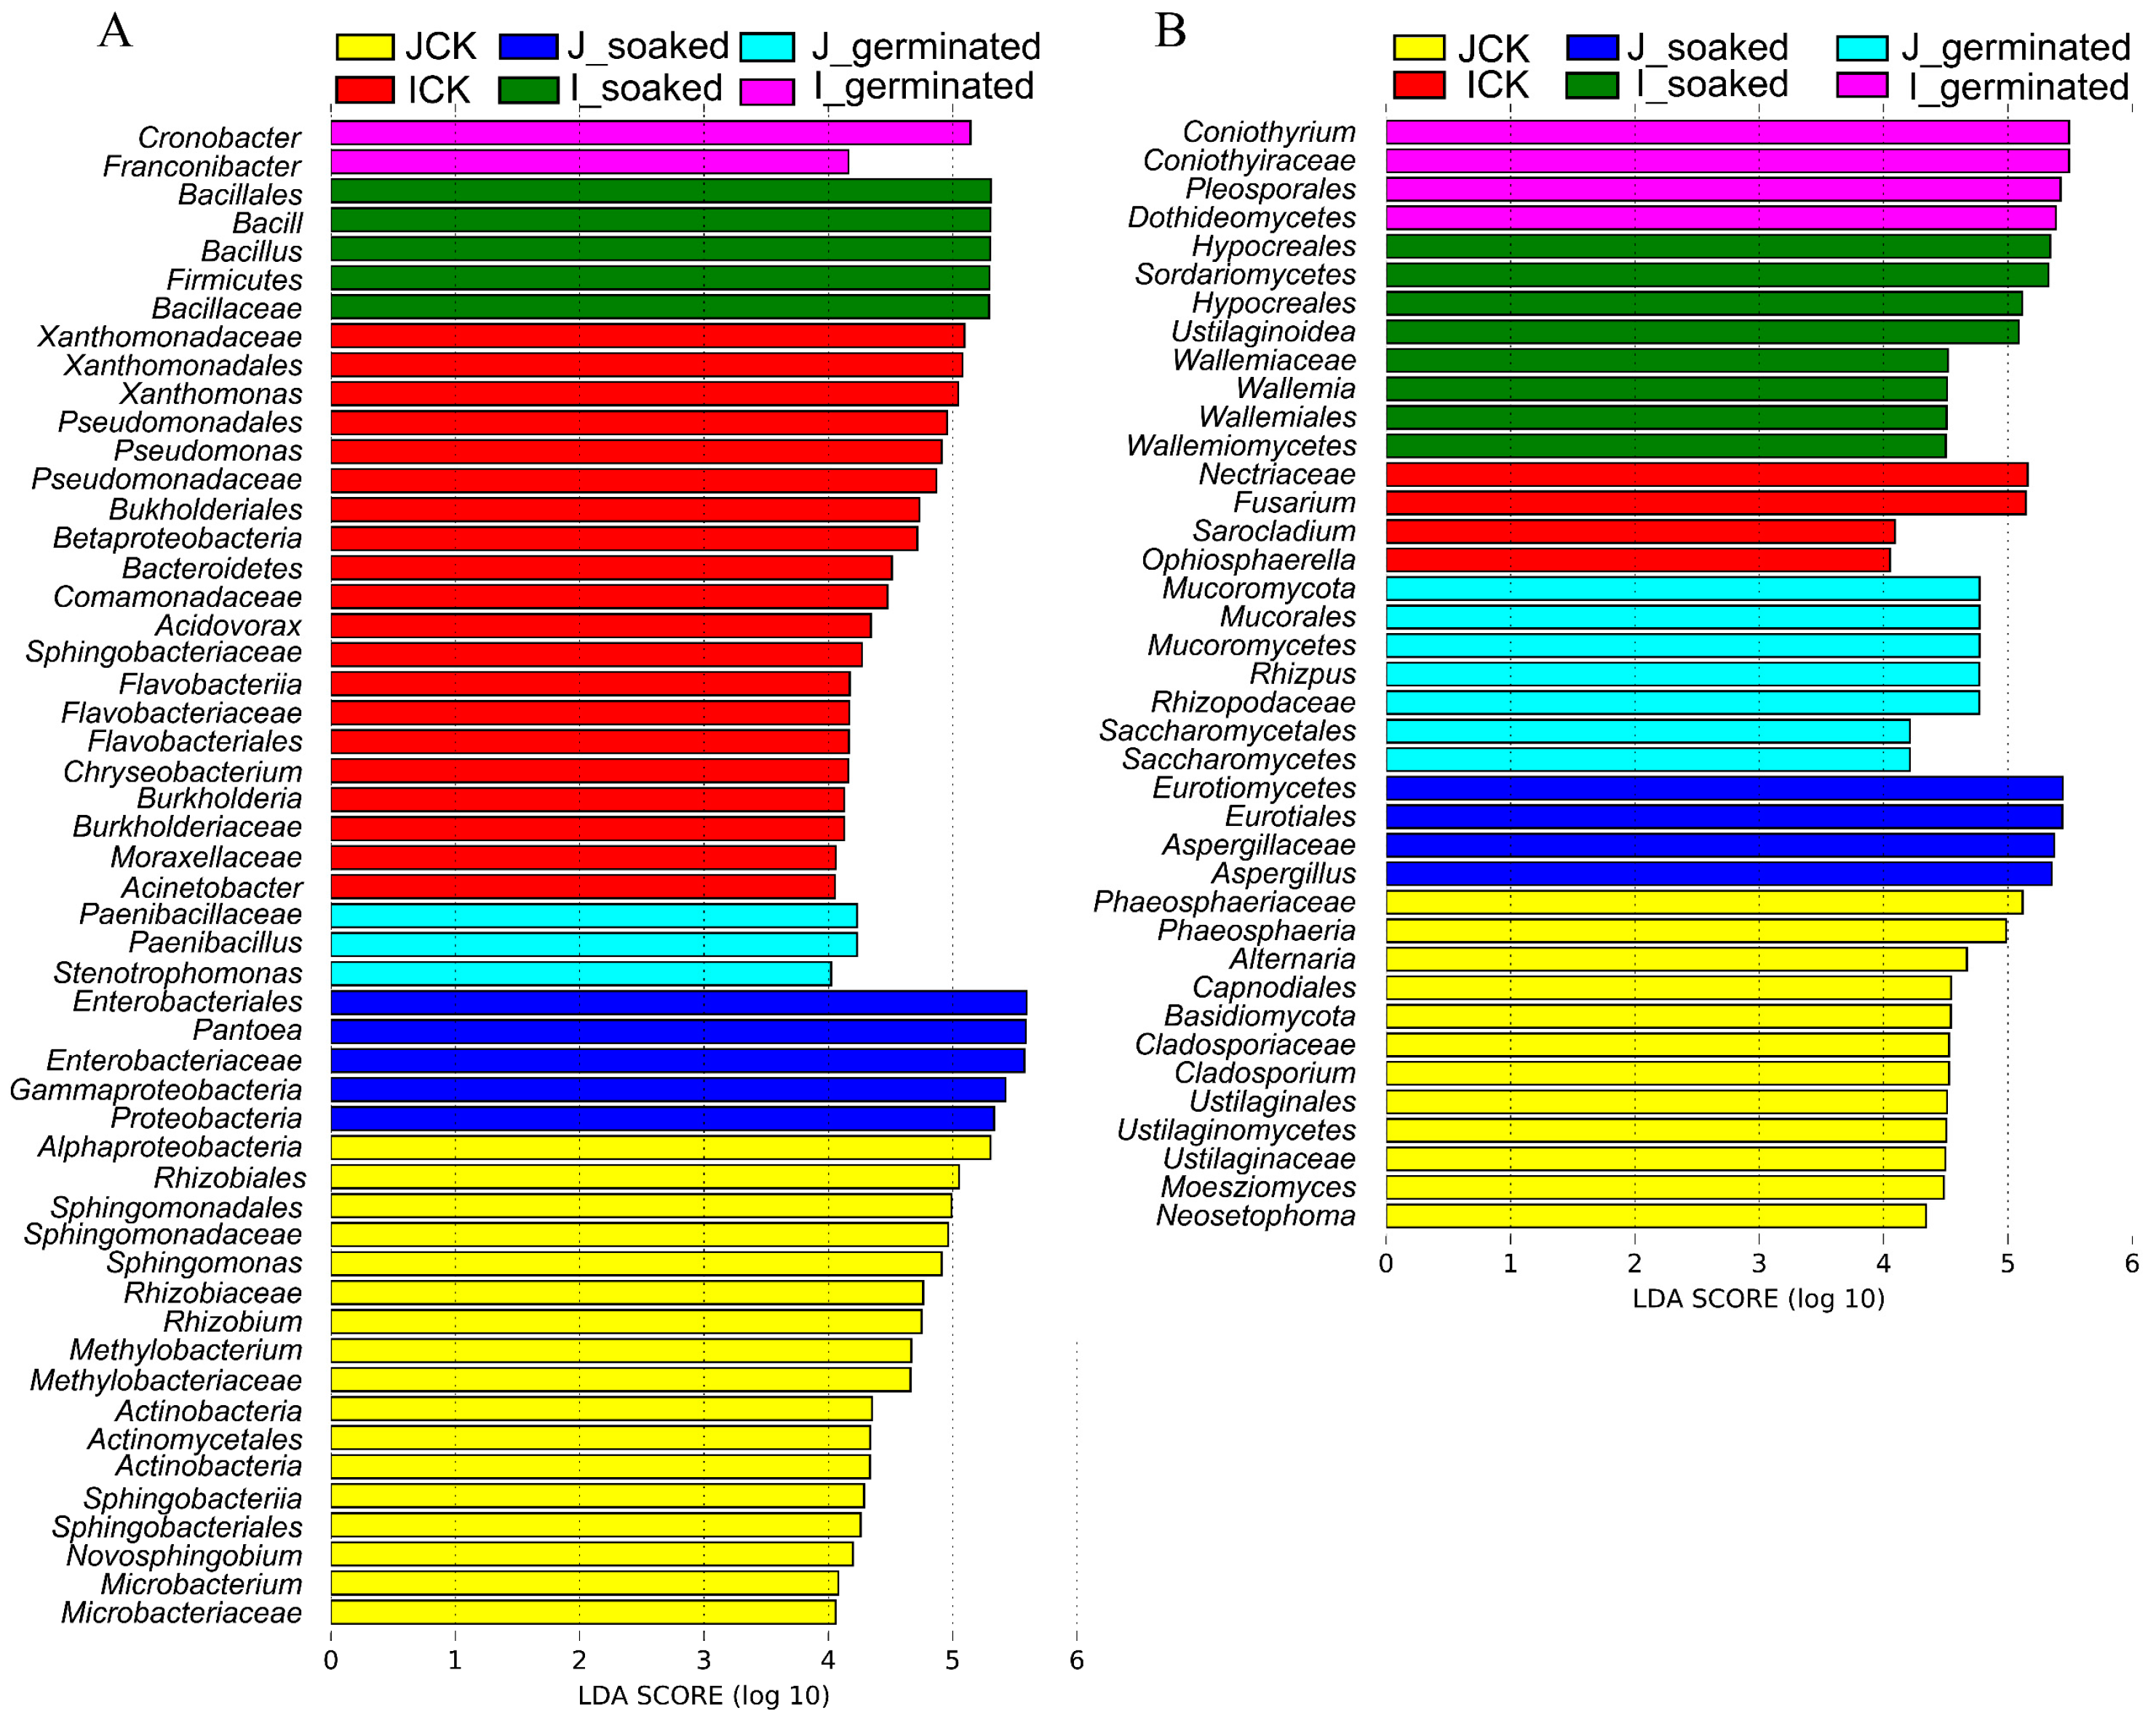
3.3.5. LDA Effect Size (LEfSe) Analysis

To understand the predominant microbiota composition at the different process stages (ungerminated, soaking, and germination), LEfSe was used to identify the bacterial and fungal taxa that were most likely to explain the differences between the HLJ2 and the HN samples (Figure 6 and Figure 7). There were in total 52 bacterial biomarkers with LDA scores over 4, indicating a significant influence of the sample treatments on the microbial species. As shown in Figure 6A, Proteobacteria and Actinobacteria dominated in the HLJ2 samples, while Firmicutes and Bacteroidetes dominated the HN samples. At the ungerminated stage, the bacteria significantly enriched in HLJ2 mainly belonged to Rhizobium, Sphingomonas, and Methylobacterium, while Xanthomonas, Pseudomonas, and Acidovorax were the main biomarkers in the HN samples. Pantoea, Paenibacillus, Bacillus, and Cronobacter were the most abundant genera in the HLJ2 and HN samples after soaking and germination, respectively (Figure 7A). For the fungi composition (Figure 6B and Figure 7B), 39 fungal biomarkers were significantly abundant with LDA scores over 4. Ascomycota, Mucoromycota, and Basidiomycota were the predominant phyla across the all of the stages. At the ungerminated stage, Phaeosphaeria, Alternaria, and Cladosporium were the marker genera in HLJ2, while Fusarium was the predominant genera in HN. Aspergillus and Rhizopus dominated in the HLJ2 samples, while Ustilaginoidea, Wallemia, and Coniothyrium dominated in the HN samples after soaking and germination, respectively.
As shown in Figure 8, the relative abundance of Pantoea, Paenibacillus, and Bacillus increased, while the abundance of Xanthomonas and Pseudomonas decreased significantly in the HLJ2 samples after germination for 48 h (p < 0.05). In addition, at the end of the germination stage, the relative abundance of Pantoea, Pseudomonas, and Paenibacillus was higher in the HLJ2 than in the HN samples, while the changes in Bacillus and Cronobacter were reversed. In Figure 9, compared to the ungerminated samples, the relative abundance of Aspergillus and Rhizopus increased, while the abundance of Fusarium, Phaeosphaeria, and Cladosporium decreased significantly in the HLJ2 samples after germination for 48 h (p < 0.05). For the HN samples, significant differences in the relative abundance of nine genera were detected after being germinated for 48 h in comparison to the ungerminated samples. It was also found that the abundance of Coniothyrium and Bipolaris was lower in the HLJ2 than in the HN samples, while the abundance of Rhizopus was reversed (p < 0.05). Additionally, variations between the individual samples may affect the results (e.g., Cronobacter, Rhizopus, and Alternaria), requiring more replicates to eliminate.

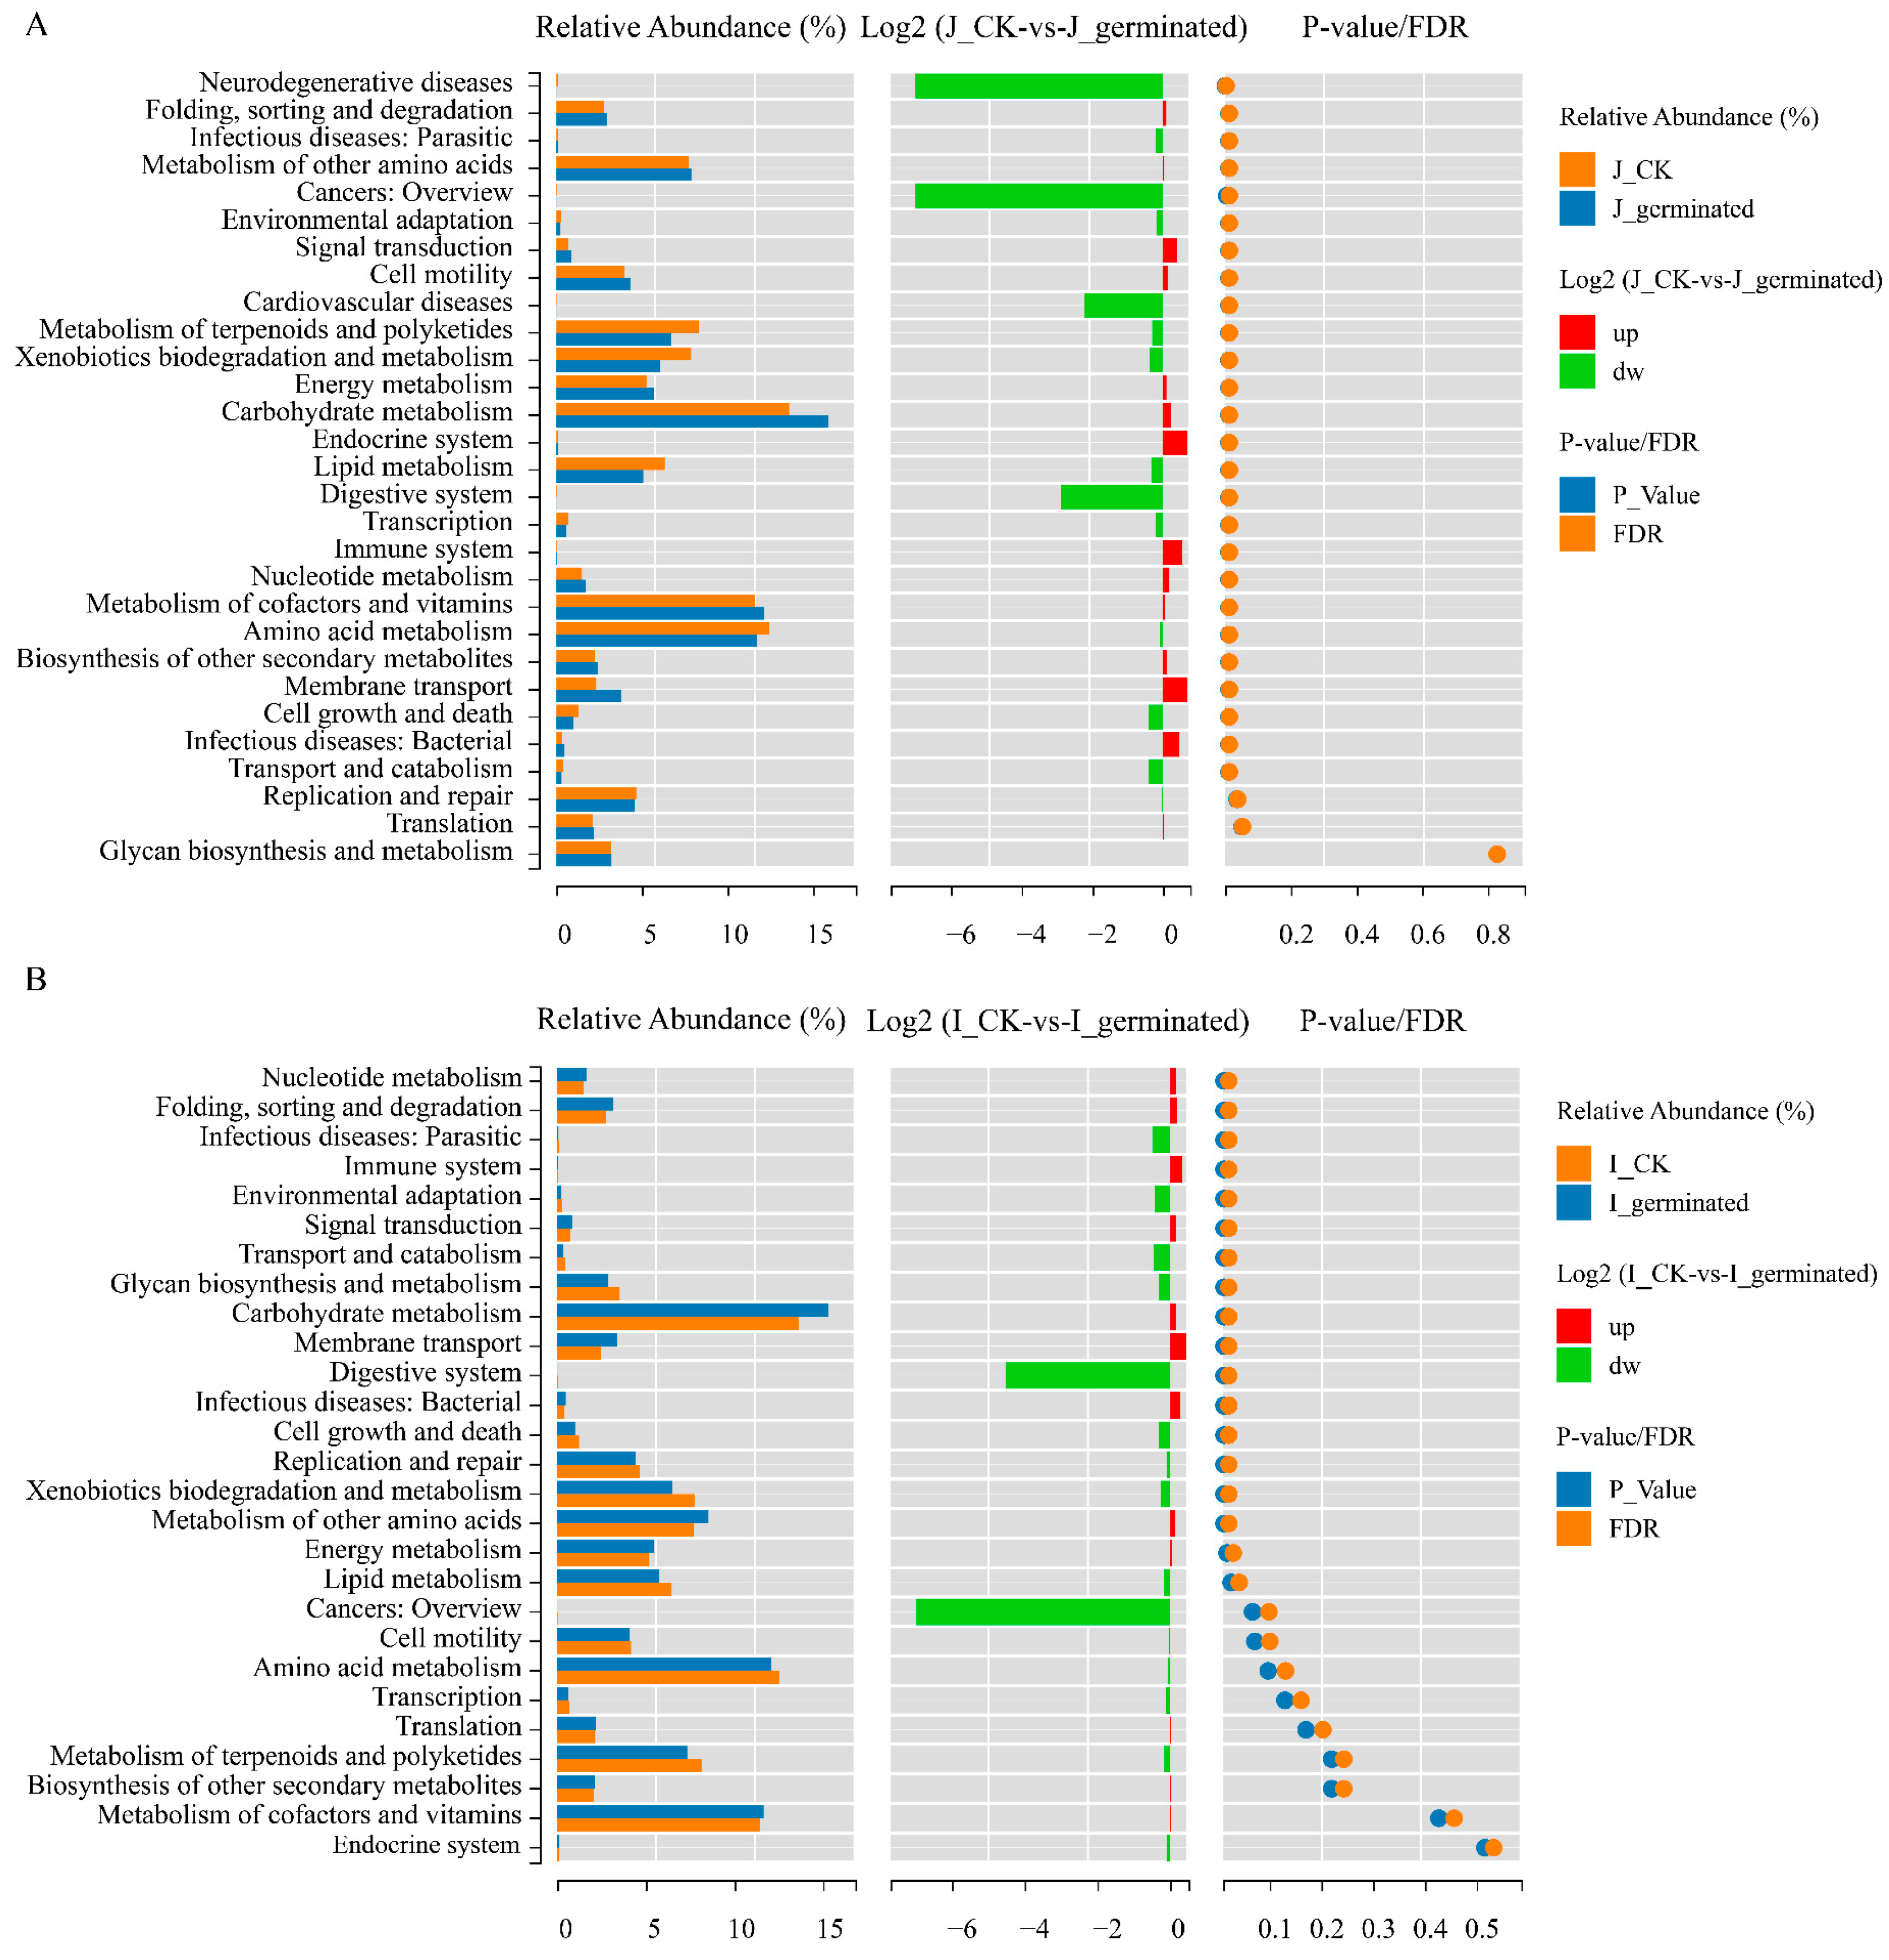
3.3.6. Functional Prediction Analysis of Microbial Community

PICRUSt was used to predict the functional genes of the microbial communities during the process of BR germination in this study. The relative abundance of the level 1 (Supplementary Figure S4A) and 2 (Figure S4B) functions of the bacterial microbes in KEGG was predicted based on the 16S rRNA gene sequence. As shown in Figure 10, the KEGG prediction of the function classification was essentially similar to that between the HLJ2 and HN samples during the different periods. The largest proportion in the all samples was the metabolism class, followed by genetic information processing (level 1), indicating that metabolism was the primary function of the bacterial community. Using the level 2 KEGG ortholog function predictions, 27 different functional categories between the HLJ2 and HN samples during BR germination were determined. Among the genes related to metabolism, they mainly included those of carbohydrate, amino acid, lipid, cofactor, vitamin, terpenoid, and polyketide metabolism (level 2).
To further analyze the differences in these functions between the ungerminated and the germinated samples in HLJ2 and HN, the Wilcox test was used in the study (Figure 10). Using the level 2 KEGG function predictions, 27 significantly different functional categories between two groups in HLJ2 were observed (Figure 10A). The functional categories associated with the microbiota in the germinated samples compared to those in the ungerminated samples were significantly enriched, including carbohydrate metabolism, cofactor and vitamin metabolism, energy metabolism, membrane transport, and cell motility, whereas the abundance of functional genes in terpenoid and polyketide metabolism, transcription, amino acid metabolism, replication, and repair was significantly lower after germination. There were also significant changes in the functional classification of the HN samples, such as carbohydrate metabolism, xenobiotics biodegradation and metabolism, energy metabolism, membrane transport, and lipid metabolism (Figure 10B). These results indicated that the functional categories associated with the microbiota in the HLJ2 and HN samples changed significantly during the process of germination. It was consistent with the changes in the bacterial community during the BR germination process. In addition, the result also indicated that the functional categories of infectious disease performed the difference after germination. It is related to the potential involvement of the pathogenic microbial species in human diseases.

4. Discussion

In this study, we used the HTS technology to examine the microbial diversity and the dominant genera changes at different BR germination stages. The results indicated that the germination process significantly influenced the microbial composition and reduced the microbial diversity. The relative abundance of the dominant genera increased obviously during the BR germination. For the bacteria, the dominant genera of bacteria were Pantoea, Bacillus, and Cronobacter. For the fungi, Aspergillus, Rhizopus, and Coniothyrium increased obviously during germination. Previous studies also reported that the bacterial diversity of the seeds (alfalfa, radish, and rapeseed) and the fungal diversity of the barley seeds sharply declined after germination [8,20]. However, there were significant differences in the main dominant genera during the germination of the different seeds, which was due to the environmental factor and the different food products markedly affecting the microbial composition [20,28].
The high nutritional values of sprouts, along with the suitable warm and humid environments, could make them more susceptible to microbial contamination [29]. Previous studies have suggested that the majority of sprout-related foodborne disease has been related to contaminated seeds, and the initial microbes in seeds have important effects on the microbial community structure during germination [30,31]. The microbial contamination of the seeds depends on the environmental conditions, including pre-harvest practices and postharvest handling or processing [7]. In this study, the microbiological profiles of 13 BR samples from ten provinces in China were investigated. The results were consistent with the study reported by Kim et al. [4] that the counts of total mesophilic aerobic bacteria, yeasts and molds, and coliforms were 2.4 × 10⁶, 4.8 × 10³, and 4.2 × 10³ CFU/g, respectively. Park et al. [32] also showed that aerobic bacteria, as well as yeasts and molds, were found to be the predominant contaminants in BR grains, with the levels of 6.24 ± 0.02 and 6.16 ± 0.04 log CFU/g. B. cereus is a widespread endospore-forming pathogen that contaminates common grains and can be detected, with the exception of HN2 in this study. Kim et al. [33] investigated the contamination of rough rice collected from 64 farms in 22 agricultural areas, and the results showed that the rice samples were broadly contaminated with B. cereus spores. In addition, the preliminary results showed that Salmonella and Listeria monocytogenes were not detected in the BR samples (the detection limit was 1.30 log CFU/mL). Moreover, L. monocytogenes and Escherichia coli were not found during BR germination, while Salmonella with the low relative abundance (<0.05%) was observed by HTS analysis. This may be related to the variety of samples, sources, and handling.
Soaking is one of the important steps in GBR production. There are various biochemical reactions during sprouting, such as the conversion of starch, fat, and proteins into simpler forms, including glucose, fatty acids, and amino acids [34]. Therefore, the microbial counts significantly increased due to the favorable growth conditions in the soaking and sprouting process (Figure 1). In a previous study, the aerobic bacteria and the yeast and mold counts between BR and GBR were shown to increase from the initial 2.4 × 10⁶ to 3.0 × 10⁷ CFU/g and from 4.8 × 10³ to 1.7 × 10⁵ CFU/g [4]. However, there was no significant difference in the TVC and yeast/mold counts during the purple BR germination reported by Bourneow and Toontam [6]. The difference could be due to the variations in the source and cultivar of the samples and the sprouting conditions [6,8]. The initial microbial populations of the grains and the medium types could also contribute to the variations in the results [4]. Furthermore, several studies have found higher populations of microbes in sprouts compared with those of ungerminated seeds, including barley, alfalfa, radish, and rapeseed [8,20,35].
From the microbial alpha diversity analysis (Supplementary Tables S1 and S2), the richness and diversity of the two BR cultivars decreased significantly after germination, which is consistent with the results of Kim et al. [20]. However, there was no significant difference in microbial diversity with the extension of the germination time. In previous studies, it was also observed that the microbial diversity of the seeds was higher than that of the sprout products [36,37]. These changes may be due to the proliferation of the Enterobacteriaceae in the bacteria and the Aspergillaceae or Coniothyriaceae in the fungi during germination; then, the specific genera became dominant, caused an unbalanced community composition, and reduced the microbial diversity [20]. However, Ostlie et al. [8] observed that the bacterial diversity of barley increased significantly after germination. This may be related to the microbial structure of the grains and the variation of the treatment conditions. These results suggested that the cultivar of seeds affected the microbial diversity and composition, which is consistent with the previous reports [17,20,38].
The bacterial community composition of the BR samples was significantly influenced by the germination process (from seed to sprout) and the grain cultivars. At the phylum level, the bacterial community remained similar between the HLJ2 and HN samples during germination; however, the relative abundance of the predominant phyla differed at the various germinated stages. Proteobacteria was the dominant phyla at the all stages, but the abundance of Firmicutes increased with the extension in germination time. Proteobacteria, Firmicutes, Actinobacteria, and Bacteroidetes have been reported as the most abundant phyla in the soil and field in previous reports [39,40], indicating that these bacteria are widely distributed in the natural environment. Similar bacterial composition, but with a different relative abundance of the two cultivars before germination, was observed. This is consistent with the results reported by Ostlie et al. [8] and Kim et al. [17], in which the similar genera were detected in barley, radish, rapeseed, and alfalfa seeds. Notably, Pantoea was the most abundant genus in the HLJ2 samples, while Cronobacter, Bacillus, and Pantoea were dominant in the HN samples during germination (Figure 3A–C). Pantoea is a diverse group of rod-shaped Gram-negative bacteria in the Enterobacteriaceae [41], which can be confirmed by the culture-dependent results with the high population during germination (Figure 1). It is also a potential candidate of the spoilage-causing genus [17]. Previous studies reported that Pantoea was highly abundant in fresh mung bean sprouts, spinach [17,42], and barley [8], and several species were generally recognized as plant pathogens, but some species can cause disease in humans [41].
In this study, Bacillus (in HLJ2 and HN) and Cronobacter (in HN) were also the most abundant genera during germination. Bacillus species are fundamental to food fermentation, and several spoilage species and pathogens may cause food contamination and poisoning [15,43]. It has been reported that Bacillus is widely distributed in soil and water and can be detected with high abundance in radish, rapeseed, and alfalfa sprouts [20,28]. Cronobacter species are also commonly found in the environment or in soil and water [44], as well as in various food products, such as rice and other cereal seeds, vegetables, and fruits [45]. These bacteria are opportunistic pathogens associated with life-threatening infections in newborns [46]. Pseudomonas and Lactococcus were the most common bacterial species in the barley, alfalfa and mung sprouts [8,17], and fermented vegetables [47,48]. However, it was not the major species found in this study and reported by Kim et al. [20]. It was obvious that variations in the environmental factors and food products markedly affected the microbial composition. Due to the high nutritional values and suitable humid environment during the soaking and germination process, high abundance species, such as the Pantoea species, are stronger environmental competitors than the less competitive bacteria, leading to an unbalanced community composition [49]. Here, the growth of the Pantoea, Bacillus, Cronobacter, and other species influenced the bacterial community and consequently reduced the diversity indices. Furthermore, differences in the microbial communities between the HLJ2 and HN samples were attributed to endophytes (specific bacteria), which can vary with the species and the age of the host [50]. Therefore, two cultivars of BR may host differential bacterial species with differential functional profiles [20].
As with the bacteria, the fungal composition of the BR samples was also significantly influenced by the germination process and the cultivar of grain. Here, four known phyla were identified, and the most abundant phyla were Ascomycota and Mucoromycota, which agreed with the study results reported by Huang et al. [51] At the genus level, the top five genera (relative abundance > 5%) were Aspergillus, Phaeosphaeria, Fusarium, Alternaria, and Cladosporium in the ungerminated HLJ2 samples, while Fusarium, Coniothyrium, Phaeosphaeria, Ustilaginoidea, and Aspergillus dominated in the HN samples. It differed from the report by Ostlie et al. [6] that the most abundant fungi were Cryptococcus, Cladosporium, Pyrenophora, Vagicola, and Sporobolomyces in both ungerminated and germinated barley. The variation of the different grain endophytes may be one of the most important reasons for the difference in the microbial community [51]. During germination, the relative abundance of Aspergillus and Rhizopus in the HLJ2 samples rose, while Coniothyrium, Aspergillus, and Rhizopus increased significantly in the HN samples. Many reports have shown that the Aspergillus species as predominant fungi can be found in various agricultural products [52,53]. Our results agreed with Huang et al. [37] who found high frequencies of Aspergillus species in wheat seeds and sprouts. The microbiological analysis demonstrated that Coniothyrium and Rhizopus were predominant in a bean sauce mash, a traditional fermented soybean product [54]. Among these fungi, those such as the Aspergillus and Fusarium species can produce mycotoxins. Fungal growth caused the loss of nutritive substances and could also result in contamination by mycotoxins, which may be harmful to humans [55].
In addition, it was noteworthy that the relative abundance of Fusarium (HN), Phaeosphaeria (HLJ2 and HN), Cladosporium (HLJ2 and HN), and Ustilaginoidea (HN) decreased significantly during germination (Figure 9). Fusarium, Cladosporium, and Alternaria are considered as the most ubiquitous fungi on cereal grains and usually continue to survive at all stages of plant growth [56]. Ostlie et al. [8] observed that the relative abundance of Fusarium and Alternaria increased and Cladosporium significantly decreased after the germination of barley. Most Phaeosphaeria species are plant pathogens, which can cause serious infections, especially in many important crops, such as wheat and corn [57]. The previous study showed that seed endophytes may be important founders of the sprout microbial communities. In the work, the bacterial and fungal community in ungerminated BR grains is similar to that in the germinated samples; so, some bacteria and fungi derived from grains were transferred into the sprouts.
The predictive functions of the bacterial community were further analyzed using PICRUSt based on the KEGG database in this study. It is notable that each sample performed the similar gene function with a different abundance (Supplementary Figure S4), which may be due to the similarity in gene functions of the different microbiota [58]. The predicted bacterial functional profiles exhibited the highest relative abundance in metabolism, particularly the carbohydrate, amino acid, lipid, cofactor, vitamin, terpenoid, and polyketide metabolisms. These metabolic pathways are crucial for supporting microbial growth. According to the Wilcox test, the functional categories associated with the microbiota in the germinated samples compared to those in the ungerminated samples were significantly different (Figure 10). Carbohydrate metabolism and amino acid metabolism are essential for microbes, which play an important role in the survival of microorganisms and their related functions [59]. Moreover, the relative abundance of membrane transport and energy metabolism was higher in the germinated stage compared with the ungerminated stage. These results suggest that the changes in bacterial composition during BR germination may be related to differences in the functional metabolism of the microbiota. The detection of Bacillus and Cronobacter in BR during germination highlights the potential risk of the foodborne illness associated with the consumption of sprouts. In this study, PICRUSt identified the metabolic pathways associated with infectious diseases, supporting the potential involvement of the identified microbial species in human diseases (Figure 10). These findings suggest that sprouted BR may pose a safety hazard to consumers.
This study showed that microbial diversity and composition were affected by the BR cultivars. Despite the selected BR samples being the most consumed varieties, it is necessary to investigate the microbial diversity of more diversified varieties. The associations between the changes in nutrient composition and microbiota of BR during germination also needs to be further explored. In addition to the pathogenic and potential pathogenic genera, the information on the several spoilage genera associated with sprouts also requires attention. In addition, it is important to consider sterilization before the preparation for the BR germination and the optimal process conditions, especially temperature control during incubation.

5. Conclusions

In this study, both microbial cultivation and HTS technology were developed to explore the microbial community dynamics of BR during germination. The microbial counts of the BR samples rose significantly with the prolongation of the germination time. The results indicated that germination significantly influenced the microbial composition and diversity. Different microbial richness but similar microbial community diversity was found between the HLJ2 and HN samples. During germination, Proteobacteria and Firmicutes were the predominant phyla, while Pantoea, Bacillus, and Cronobacter were the key microbial groups at the genus level. For the fungi, Aspergillus, Rhizopus, and Coniothyrium were the dominant genera in the HLJ2 and HN samples. The abundance of several pathogenic and spoilage microorganisms carried in the BR seeds increased significantly after germination treatment, thereby causing the risk of foodborne illness. These findings suggest that microbial community dynamics analysis can provide related information to establish control points during BR germination and can be useful in ensuring microbial safety in the industry.

Supplementary Materials

The following supporting information can be downloaded at: https://www.mdpi.com/article/10.3390/foods12040755/s1, Figure S1: rarefaction curves of bacterial (A) and fungal (B) populations in the germination process of BR samples, Figure S2: Venn diagrams for numbers of shared and unique genera of ungerminated BR samples in bacteria (A) and fungi (B), Figure S3: flower diagrams for numbers of shared and unique genera of BR samples in bacteria (A,B) and fungi (C,D) at various germination times; (A,C) HLJ2; (B,D) HN, Figure S4: relative abundance of functional properties of KEGG levels 1 (A) and 2 (B) based on the 16S rRNA gene sequences using PICRUSt, Table S1: richness and diversity indices for bacteria of BR samples during germination, Table S2: richness and diversity indices for fungi of BR samples during germination.

Author Contributions

Conceptualization G.Y. and J.X.; investigation, G.Y., Y.X. and J.X.; methodology, G.Y., J.X., Y.X. and R.L.; supervision, S.W.; writing—original draft, G.Y.; writing—review and editing, S.W.; project administration, S.W.; funding acquisition, S.W. All authors have read and agreed to the published version of the manuscript.

Funding

This research was funded by the General Program of National Natural Science Foundation of China (31772031) and National Foreign Expert Project, Ministry of Science and Technology, China (G2022172003L, DL2022172013L).

Data Availability Statement

The data presented in this study are available on request from the corresponding author.

Conflicts of Interest

The authors declare no conflict of interest.

References

  1. Saleh, A.S.M.; Wang, P.; Wang, N.; Yang, L.; Xiao, Z. Brown rice versus white rice: Nutritional quality, potential health benefits, development of food products, and preservation technologies. Compr. Rev. Food Sci. Food Saf. 2019, 18, 1070–1096. [Google Scholar] [PubMed]
  2. Lemmens, E.; Moroni, A.V.; Pagand, J.; Heirbaut, P.; Ritala, A.; Karlen, Y.; Lê, K.A.; Den Broeck, H.C.; Brouns, F.J.P.H.; Brier, N. Impact of cereal seed sprouting on its nutritional and technological properties: A critical review. Compr. Rev. Food Sci. Food Saf. 2019, 18, 305–328. [Google Scholar] [PubMed]
  3. Cho, D.H.; Lim, S.T. Germinated brown rice and its bio-functional compounds. Food Chem. 2016, 196, 259–271. [Google Scholar] [CrossRef] [PubMed]
  4. Kim, K.S.; Kim, B.H.; Kim, M.J.; Han, J.K.; Kum, J.S.; Lee, H.Y. Quantitative microbiological profiles of brown rice and germinated brown rice. Food Sci. Biotechnol. 2012, 21, 1785–1788. [Google Scholar] [CrossRef]
  5. Lu, Z.H.; Zhang, Y.; Li, L.T.; Curtis, R.B.; Kong, X.L.; Fulcher, R.G.; Zhang, G.; Cao, W. Inhibition of microbial growth and enrichment of gamma-aminobutyric acid during germination of brown rice by electrolyzed oxidizing water. J. Food Protect. 2010, 73, 483–487. [Google Scholar] [CrossRef]
  6. Bourneow, C.; Toontam, N. Microbiological quality and some bioactive compounds in relation to sensory profiles during germination of brown-purple-pigmented rice. Int. Food Res. J. 2019, 26, 1011–1021. [Google Scholar]
  7. Miyahira, R.F.; Costa Antunes, A.E. Bacteriological safety of sprouts: A brief review. Int. J. Food Microbiol. 2021, 352, 109266. [Google Scholar] [CrossRef]
  8. Ostlie, H.M.; Porcellato, D.; Kvam, G.; Wicklund, T. Investigation of the microbiota associated with ungerminated and germinated Norwegian barley cultivars with focus on lactic acid bacteria. Int. J. Food Microbiol. 2021, 341, 109059. [Google Scholar] [CrossRef]
  9. Los, A.; Ziuzina, D.; Boehm, D.; Cullen, P.J.; Bourke, P. The potential of atmospheric air cold plasma for control of bacterial contaminants relevant to cereal grain production. Innov. Food Sci. Emerg. Technol. 2017, 44, 36–45. [Google Scholar] [CrossRef]
  10. Laca, A.; Mousia, Z.; Diaz, M.; Webb, C.; Pandiella, S.S. Distribution of microbial contamination within cereal grains. J. Food Eng. 2006, 72, 332–338. [Google Scholar] [CrossRef]
  11. Piernas, V.; Guiraud, J.P. Microbial hazards related to rice sprouting. Int. J. Food Sci. Technol. 1997, 32, 33–39. [Google Scholar] [CrossRef]
  12. Dechet, A.M.; Herman, K.M.; Chen Parker, C.; Taormina, P.; Johanson, J.; Tauxe, R.V.; Mahon, B.E. Outbreaks caused by sprouts, United States, 1998–2010: Lessons learned and solutions needed. Foodborne Pathog. Dis. 2014, 11, 635–644. [Google Scholar]
  13. Callejón, R.M.; Rodriguez-Naranjo, M.I.; Ubeda, C.; Hornedo-Ortega, R.; GarciaParrilla, M.C.; Troncoso, A.M. Reported foodborne outbreaks due to fresh produce in the United States and European union: Trends and causes. Foodborne Pathog. Dis. 2015, 12, 32–38. [Google Scholar] [CrossRef]
  14. Villeneuve, S.; Power, K.A.; Guévremont, E.; Mondor, M.; Tsao, R.; Wanasundara, J.P.D.; Mercier, S. Effect of a short-time germination process on the nutrient composition, microbial counts and bread-making potential of whole flaxseed. J. Food Process. Pres. 2015, 39, 1574–1586. [Google Scholar] [CrossRef]
  15. Cai, H.; Zhang, T.; Zhang, Q.; Luo, J.; Cai, C.; Mao, J. Microbial diversity and chemical analysis of the starters used in traditional Chinese sweet rice wine. Food Microbiol. 2018, 73, 319–326. [Google Scholar] [CrossRef]
  16. Zhao, G.; Li, J.; Zheng, F.; Yao, Y. The fermentation properties and microbial diversity of soy sauce fermented by germinated soybean. J. Sci. Food Agric. 2021, 101, 2920–2929. [Google Scholar] [CrossRef] [PubMed]
  17. Keshri, J.; Krouptiski, Y.; Abu-Fani, L.; Achmon, Y.; Bauer, T.S.; Zarka, O.; Maler, I.; Pinto, R.; Saldinger, S.S. Dynamics of bacterial communities in alfalfa and mung bean sprouts during refrigerated conditions. Food Microbiol. 2019, 84, 103261. [Google Scholar]
  18. Los, A.; Ziuzina, D.; Boehm, D.; Bourke, P. Effects of cold plasma on wheat grain microbiome and antimicrobial efficacy against challenge pathogens and their resistance. Int. J. Food Microbiol. 2020, 335, 108889. [Google Scholar] [CrossRef] [PubMed]
  19. Solanki, M.K.; Abdelfattah, A.; Britzi, M.; Zakin, V.; Wisniewski, M.; Droby, S.; Sionov, E. Shifts in the composition of the microbiota of stored wheat grains in response to fumigation. Front. Microbiol. 2019, 10, 1098. [Google Scholar] [CrossRef] [PubMed]
  20. Kim, S.Y.; Ban, G.H.; Hong, Y.W.; Jang, M.J.; Kim, S.A. Microbiome shifts in sprouts (alfalfa, radish, and rapeseed) during production from seed to sprout using 16S rRNA microbiome sequencing. Food Res. Int. 2022, 152, 110896. [Google Scholar]
  21. Moongngarm, A.; Saetung, N. Comparison of chemical compositions and bioactive compounds of germinated rough rice and brown rice. Food Chem. 2010, 122, 782–788. [Google Scholar]
  22. Magoc, T.; Salzberg, S.L. FLASH: Fast length adjustment of short reads to improve genome assemblies. Bioinformatics 2011, 27, 2957–2963. [Google Scholar] [PubMed]
  23. Edgar, R.C. UPARSE: Highly accurate OTU sequences from microbial amplicon reads. Nat. Methods 2013, 10, 996–998. [Google Scholar] [CrossRef]
  24. Edgar, R.C.; Haas, B.J.; Clemente, J.C.; Quince, C.; Knight, R. UCHIME improves sensitivity and speed of chimera detection. Bioinformatics 2011, 27, 2194–2200. [Google Scholar] [PubMed]
  25. Caporaso, J.G.; Kuczynski, J.; Stombaugh, J.; Bittinger, K.; Bushman, F.D.; Costello, E.K.; Fierer, N.; Pena, A.G.; Goodrich, J.K.; Gordon, J.I.; et al. QIIME allows analysis of high-throughput community sequencing data. Nat. Methods 2010, 7, 335–336. [Google Scholar]
  26. Edgar, R.C. Search and clustering orders of magnitude faster than BLAST. Bioinformatics 2010, 26, 2460–2461. [Google Scholar] [CrossRef] [Green Version]
  27. Schloss, P.D.; Westcott, S.L.; Ryabin, T.; Hall, J.R.; Hartmann, M.; Hollister, E.B.; Lesniewski, R.A.; Oakley, B.B.; Parks, D.H.; Robinson, C.J. Introducing mothur: Open-source, platform-independent, community-supported software for describing and comparing microbial communities. Appl. Environ. Microbiol. 2009, 75, 7537–7541. [Google Scholar] [PubMed]
  28. Landry, K.S.; Sela, D.A.; Mclandsborough, L. Influence of sprouting environment on the microbiota of sprouts. J. Food Saf. 2017, 38, e12380. [Google Scholar]
  29. Liu, H.K.; Li, Z.H.; Zhang, X.W.; Liu, Y.P.; Zhao, X.Y. The effects of ultrasound on the growth, nutritional quality and microbiological quality of sprouts. Trends Food Sci. Technol. 2021, 111, 92–300. [Google Scholar]
  30. Landry, K.S.; Micheli, S.; Mcclements, D.J.; Mclandsborough, L. Effectiveness of a spontaneous carvacrol nanoemulsion against Salmonella enterica Enteritidis and Escherichia coli O157:H7 on contaminated broccoli and radish seeds. Food Microbiol. 2015, 51, 10–17. [Google Scholar] [CrossRef] [PubMed]
  31. Peñas, E.; Gómez, R.; Frías, J.; Vidal-Valverde, C. Effects of combined treatments of high pressure, temperature and antimicrobial products on germination of mung bean seeds and microbial quality of sprouts. Food Control 2010, 21, 82–88. [Google Scholar]
  32. Park, H.; Puligundla, P.; Mok, C. Cold plasma decontamination of brown rice: Impact on biochemical and sensory qualities of their corresponding seedlings and aqueous tea infusions. LWT Food Sci. Technol. 2020, 131, 109508. [Google Scholar]
  33. Kim, B.; Bang, J.; Kim, H.; Kim, Y.; Kim, B.S.; Beuchat, L.R.; Ryu, J.H. Bacillus cereus and Bacillus thuringiensis spores in Korean rice: Prevalence and toxin production as affected by production area and degree of milling. Food Microbiol. 2014, 42, 89–94. [Google Scholar] [CrossRef]
  34. Mir, S.A.; Farooq, S.; Shah, M.A.; Sofi, S.A.; Khaneghah, A.M. An overview of sprouts nutritional properties, pathogens and decontamination technologies. LWT Food Sci. Technol. 2021, 141, 110900. [Google Scholar]
  35. Li, X.; Cai, G.; Wu, D.; Zhang, M.; Lin, C.; Lu, J. Microbial community dynamics of Dan’er barley grain during the industrial malting process. Food Microbiol. 2018, 76, 110–116. [Google Scholar] [PubMed]
  36. Gloria, T.C.; Sophie, B.; Olivier, B.; Clémence, G.; Martial, B.; Marie-Agnès, J.; Matthieu, B. Functional microbial features driving community assembly during seed germination and emergence. Front. Plant Sci. 2018, 9, 902. [Google Scholar]
  37. Huang, Y.; Kuang, Z.; Wang, W.; Cao, L. Exploring potential bacterial and fungal biocontrol agents transmitted from seeds to sprouts of wheat. Biol. Control 2016, 98, 27–33. [Google Scholar] [CrossRef]
  38. Bziuk, N.; Maccario, L.; Straube, B.; Wehner, G.; Sorensen, S.J.; Schikora, A.; Small, K. The treasure inside barley seeds: Microbial diversity and plant beneficial bacteria. Environ. Microbiome 2021, 16, 20. [Google Scholar] [PubMed]
  39. Fierer, N.; Bradford, M.A.; Jackson, R.B. Toward an ecological classification of soil bacteria. Ecology 2007, 88, 1354–1364. [Google Scholar] [CrossRef] [PubMed]
  40. He, H.D.; Li, W.C.; Yu, R.Q.; Ye, Z.H. Illumina-based analysis of bulk and rhizosphere soil bacterial communities in paddy fields under mixed heavy metal contamination. Pedosphere 2017, 27, 569–578. [Google Scholar]
  41. Walterson, A.M.; Stavrinides, J. Pantoea: Insights into a highly versatile and diverse genus within the Enterobacteriaceae. FEMS Microbiol. Rev. 2015, 39, 968–984. [Google Scholar] [PubMed]
  42. Leff, J.W.; Noah, F.; Gabriele, B. Bacterial communities associated with the surfaces of fresh fruits and vegetables. PLoS ONE 2013, 8, e59310. [Google Scholar] [CrossRef] [PubMed]
  43. Logan, N.A. Bacillus and relatives in foodborne illness. J. Appl. Microbiol. 2011, 112, 417–429. [Google Scholar]
  44. Chenu, J.W.; Cox, J.M. Cronobacter (‘Enterobacter sakazakii’): Current status and future prospects. Lett. Appl. Microbiol. 2010, 49, 153–159. [Google Scholar]
  45. Berthold-Pluta, A.; Garbowska, M.; Stefańska, I.; Pluta, A. Microbiological quality of selected ready-to-eat leaf vegetables, sprouts and non-pasteurized fresh fruit-vegetable juices including the presence of Cronobacter spp. Food Microbiol. 2017, 65, 221–230. [Google Scholar] [PubMed]
  46. Healy, B.; Cooney, S.; O’Brien, S.; Iversen, C.; Whyte, P.; Nally, J.; Callanan, J.J.; Fanning, S. Cronobacter (Enterobacter sakazakii): An opportunistic foodborne pathogen. Foodborne Pathog. Dis. 2010, 7, 339–350. [Google Scholar]
  47. He, Z.; Chen, H.; Wang, X.; Lin, X.; Ji, C.; Li, S.; Liang, H. Effects of different temperatures on bacterial diversity and volatile flavor compounds during the fermentation of suancai, a traditional fermented vegetable food from northeastern China. LWT Food Sci. Technol. 2020, 118, 108773. [Google Scholar]
  48. Zhang, J.; Zhang, C.; Wu, W.; Lv, X.; Xin, X.; Liu, D.; Hu, H.; Guo, S. Correlation of the bacterial communities with umami components, and chemical characteristics in Zhejiang xuecai and fermented brine. Food Res. Int. 2021, 140, 109986. [Google Scholar] [CrossRef]
  49. Jiang, L.; Jeong, J.C.; Lee, J.S.; Park, J.M.; Yang, J.W.; Lee, M.H.; Choi, S.H.; Kim, C.Y.; Kim, D.H.; Kim, S.W.; et al. Potential of Pantoea dispersa as an effective biocontrol agent for black rot in sweet potato. Sci. Rep. 2019, 9, 16354. [Google Scholar]
  50. Singha, K.M.; Singh, B.; Pandey, P. Host specific endophytic microbiome diversity and associated functions in three varieties of scented black rice are dependent on growth stage. Sci. Rep. 2021, 11, 12259. [Google Scholar] [PubMed]
  51. Huang, Y.; Zhang, M.; Deng, Z.; Cao, L. Evaluation of probiotic diversity from soybean (Glycine max) seeds and sprouts using illumina-based sequencing method. Probiotics Antimicrob. Proteins 2018, 10, 293–298. [Google Scholar] [CrossRef] [PubMed]
  52. Park, H.S.; Jun, S.C.; Han, K.H.; Hong, S.B.; Yu, J.H. Diversity, application, and synthetic biology of industrially important Aspergillus Fungi. Adv. Appl. Microbiol. 2017, 100, 161–202. [Google Scholar] [PubMed]
  53. Perrone, G.; Susca, A.; Cozzi, G.; Ehrlich, K.; Varga, J.; Frisvad, J.C.; Meijer, M.; Noonim, P.; Mahakamchanakul, W.; Samson, R.A. Biodiversity of Aspergillus species in some important agricultural products. Stud. Mycol. 2007, 59, 53–66. [Google Scholar] [PubMed]
  54. Xie, M.; An, F.; Wu, J.; Liu, Y.; Shi, H.; Wu, R. Meta-omics reveal microbial assortments and key enzymes in bean sauce mash, a traditional fermented soybean product. J. Sci. Food Agric. 2019, 99, 6522–6534. [Google Scholar] [CrossRef]
  55. Justé, A.; Malfliet, S.; Lenaerts, M.; Cooman, L.D.; Lievens, B. Microflora during malting of barley: Overview and impact on malt quality. Brew. Sci. 2011, 64, 22–31. [Google Scholar]
  56. Gagkaeva, T.Y.; Gavrilova, O.P.; Orina, A.S.; Blinova, E.V.; Loskutov, I.G. Response of wild Avena species to fungal infection of grain. Crop. J. 2017, 5, 499–508. [Google Scholar]
  57. El-Demerdash, A. Chemical diversity and biological activities of Phaeosphaeria fungi genus: A systematic review. J. Fungi 2018, 4, 130. [Google Scholar]
  58. Zheng, X.; Xu, X.; Ma, Y.; Zhu, L.; Xiao, J.; Deng, L.; Shi, X.; Wang, B. Diversity and potential function of bacterial communities during milk fermentation of Kazak artisanal cheese. Process. Biochem. 2021, 111, 191–200. [Google Scholar] [CrossRef]
  59. Wang, Y.; Cai, W.; Wang, W.; Shu, N.; Zhang, Z.; Hou, Q.; Shan, C.; Guo, Z. Analysis of microbial diversity and functional differences in different types of high-temperature Daqu. Food Sci. Nutr. 2021, 9, 1003–1016. [Google Scholar]
Figure 1. The microbiological profiles of BR samples at various germination times: (A) HLJ2; (B) HN. BR: untreated BR grains; soaked BR: the BR kernels were soaked in distilled water with a ratio of 1:5 (w/v) at 30 °C for 12 h.
Foods 12 00755 g001
Figure 2. PCoA plot analysis based on unweighted UniFrac metrics for HLJ2 (A,D), HN (B,E), and all samples (C,F) at various germination times; (AC) bacteria; (DF) fungi. Control: untreated BR grains were used as the ungerminated samples. Samples germinated for 0 h represented the soaked BR. Labels ‘J’ and ‘I’ in legend refer to HLJ2 and HN samples, respectively.
Foods 12 00755 g002
Figure 3. Bacterial community structure variation of HLJ2 and HN samples at different stages. The relative abundance of bacteria at the (A) phylum and (B) genus levels is shown. Genera of abundance > 0.5% are listed and genera of abundance < 0.5% and unclassified are marked as others. Labels ‘J’ and ‘I’ in legend refer to HLJ2 and HN samples, respectively.
Foods 12 00755 g003
Figure 4. Fungal community structure variation of HLJ2 and HN samples at different stages. The relative abundance of fungi at the (A) phylum and (B) genus levels is shown. Genera of abundance > 0.5% are listed, and genera of abundance < 0.5% and unclassified are marked as others. Labels ‘J’ and ‘I’ in legend refer to HLJ2 and HN samples, respectively.
Foods 12 00755 g004
Figure 5. Heatmap of the changes in the microbial communities of BR samples at various germination times: (A) bacteria; (B) fungi. Labels ‘J’ and ‘I’ in legend refer to HLJ2 and HN samples, respectively.
Foods 12 00755 g005
Figure 6. Landscape of bacterial (A) and fungal (B) clades in HLJ2 and HN samples. Control: untreated BR grains were used as the ungerminated samples. Soaked treatment: the BR kernels were soaked in distilled water at a ratio of 1:5 (w/v) at 30 °C for 12 h. Germinated treatment: the BR kernels were germinated at 30 °C for 12, 24, 36, and 48 h. Labels ‘J’ and ‘I’ in legend refer to HLJ2 and HN samples, respectively.
Foods 12 00755 g006
Figure 7. Differences in LEfSe in bacteria (A) and fungi (B) in HLJ2 and HN samples. Colored clades represent significant differences with an LDA threshold of 4.0. Control: untreated BR grains were used as the ungerminated samples. Soaked treatment: the BR kernels were soaked in distilled water at a ratio of 1:5 (w/v) at 30 °C for 12 h. Germinated treatment: the BR kernels were germinated at 30 °C for 12, 24, 36, and 48 h. Labels ‘J’ and ‘I’ in legend refer to HLJ2 and HN samples, respectively.
Foods 12 00755 g007
Figure 8. Bacterial genera difference analysis of BR samples at various germination times. (A) Pantoea; (B) Bacillus; (C) Cronobacter; (D) Pseudomonas; (E) Xanthomonas; (F) Paenibacillus. Different upper- and lower-case letters indicate that means were significantly different among the two samples and the different gemination stages for the same cultivar, respectively, at p = 0.05.
Foods 12 00755 g008
Figure 9. Difference analysis of fungal genera for BR samples at various germination times. (A) Aspergillus; (B) Rhizopus; (C) Ustilaginoidea; (D) Coniothyrium; (E) Fusarium; (F) Phaeosphaeria; (G) Bipolaris; (H) Alternaria; (I) Cladosporium. Different upper- and lower-case letters indicate that means were significantly different among two samples and the different germination stages for the same cultivar, respectively, at p = 0.05.
Foods 12 00755 g009
Figure 10. Differences in the functional properties of KEGG level 2 between ungerminated and germinated BR samples: (A) HLJ2, (B) HN. The pathway was significantly different between the two groups with p-value/FDR < 0.05. Labels ‘J’ and ‘I’ in legend refer to HLJ2 and HN samples, respectively.
Foods 12 00755 g010
Table 1. Microbial counts of 13 BR samples.
SamplesCultivarsProducing RegionsMoisture Content (% w.b.)Viable Counts (log10 CFU/g)
TVCMolds and YeastsBacillus cereusEnterobacteriaceae
AH1JaponicaAnhui12.21 ± 0.325.45 ± 0.20 abcd4.11 ± 0.16 c<1.33.38 ± 0.34 e
AH2JaponicaAnhui11.99 ± 0.105.11 ± 0.24 d4.22 ± 0.15 bc1.60 ± 0.49 e3.91 ± 0.33 d
GDIndicaGuangdong12.12 ± 0.355.79 ± 0.05 a5.33 ± 0.28 a2.45 ± 0.17 ab4.76 ± 0.25 b
GXJaponicaGuangxi14.00 ± 0.334.10 ± 0.11 f5.20 ± 0.14 a1.76 ± 0.11 d e3.09 ± 0.09 e
HBIndicaHubei11.89 ± 0.224.55 ± 0.10 e4.22 ± 0.09 bc2.59 ± 0.16 a3.17 ± 0.06 e
HLJ1IndicaHeilongjiang11.61 ± 0.914.41 ± 0.09 ef4.16 ± 0.45 bc<1.33.86 ± 0.52 d
HLJ2JaponicaHeilongjiang11.42 ± 0.665.32 ± 0.28 bcd4.60 ± 0.45 abc2.05 ± 0.34 bcd3.98 ± 0.33 cd
HNIndicaHunan12.53 ± 0.245.18 ± 0.02 cd4.65 ± 0.16 abc2.30 ± 0.32 abc3.94 ± 0.35 d
JSJaponicaJiangsu12.75 ± 0.295.44 ± 0.29 abcd5.00 ± 0.26 a1.54 ± 0.34 e4.37 ± 0.08 c
JXJaponicaJiangxi13.55 ± 0.145.11 ± 0.19 d4.86±0.51 ab<1.33.33 ± 0.24 e
LN1JaponicaLiaoning11.84 ± 0.055.86 ± 0.13 a5.14±0.39 a1.99 ± 0.24 dce5.22 ± 0.23 a
LN2JaponicaLiaoning12.43 ± 0.055.60 ± 0.01 abc3.93±0.03 cND *3.34 ± 0.26 e
SCJaponicaSichuan11.67 ± 0.255.65 ± 0.22 ab4.98±0.26 a1.61 ± 0.32 e4.13 ± 0.09 cd
* ND = Not detected because below the limit of 1.30 log CFU/g. Values with different lowercase letters in the same column showed significant differences at p < 0.05.
Disclaimer/Publisher’s Note: The statements, opinions and data contained in all publications are solely those of the individual author(s) and contributor(s) and not of MDPI and/or the editor(s). MDPI and/or the editor(s) disclaim responsibility for any injury to people or property resulting from any ideas, methods, instructions or products referred to in the content.

