
Effects of Salt Soaking Treatment on the Deodorization of Beef Liver and the Flavor Formation of Beef Liver Steak
Abstract
:1. Introduction
2. Materials and Methods
2.1. Materials
2.2. Sample Processing
2.3. Sensory Evaluation
2.4. Gas Chromatography–Ion Mobility Spectrometry (GC–IMS) Analysis
2.5. Determination of Fatty Acid Content
2.6. Determination of Reducing Sugar Content
2.7. Statistical Analysis
3. Results and Discussion
3.1. Sensory Evaluation
3.1.1. The Fishy Value of Raw Beef Liver after Soaking
3.1.2. Sensory Score of Roast Beef Liver Steak
3.2. GC–IMS Analysis of Volatile Compounds
3.3. Volatile Flavor Compounds in Beef Liver
3.3.1. Identification of Volatile Flavor Compounds in Soaked Raw Beef Liver
3.3.2. Identification of Flavor Compounds in Beef Liver Steak under Different Soaking Conditions
3.4. Principal Component Analysis (PCA) and Cluster of Volatile Compounds
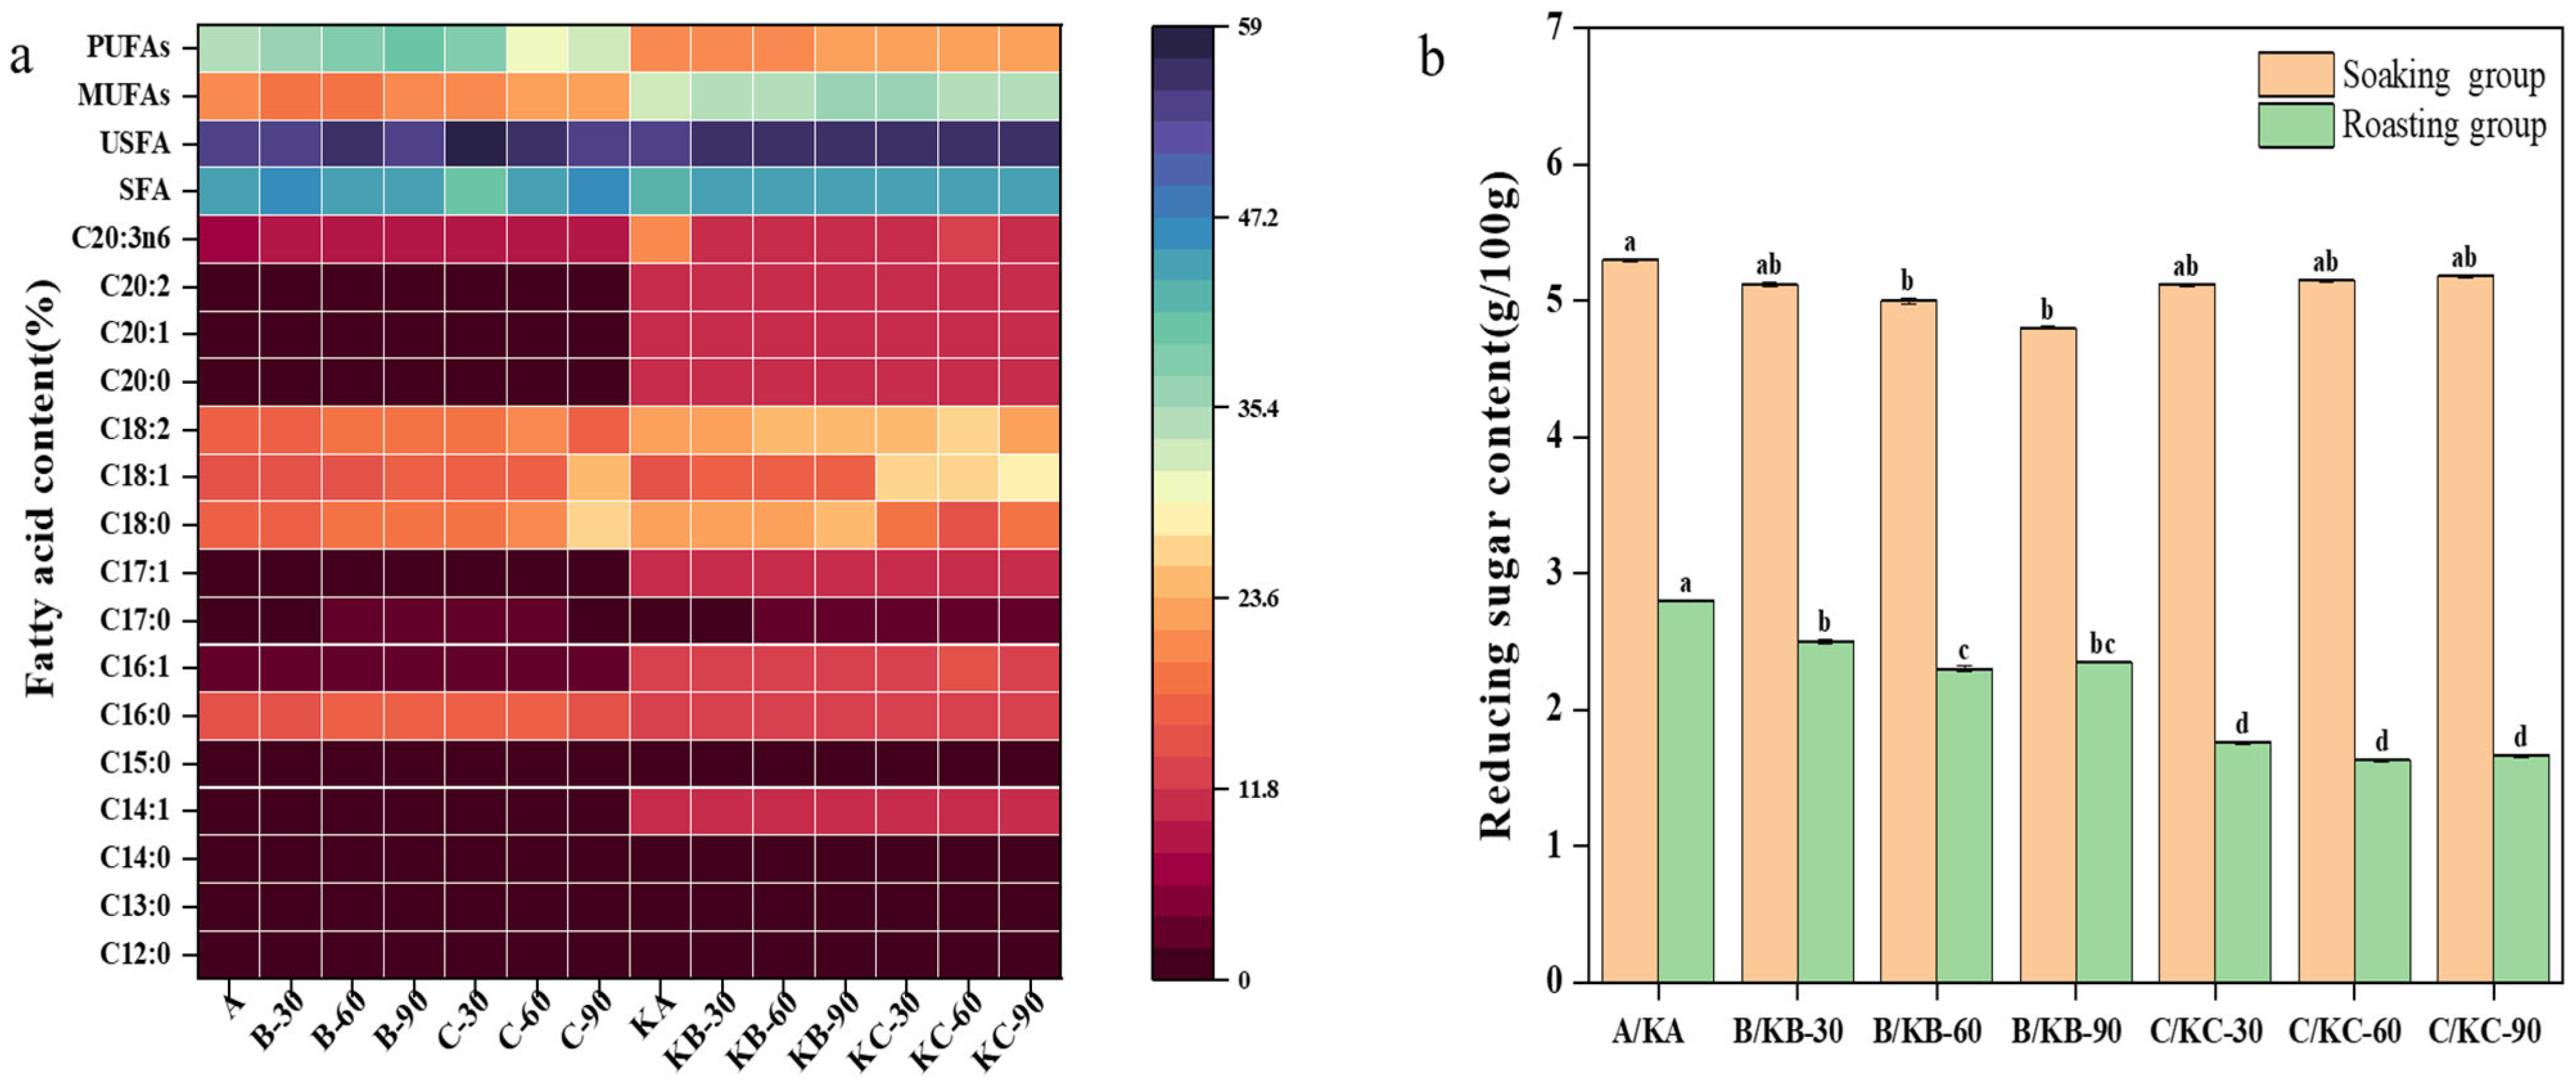
3.5. Changes in the Fatty Acid Content of Beef Liver and Beef Liver Steak under Different Soaking Conditions
3.6. Changes in Reducing Sugar Content in Beef Liver and Beef Liver Steak under Different Soaking Conditions
4. Conclusions
Author Contributions
Funding
Data Availability Statement
Acknowledgments
Conflicts of Interest
References
- Custodio, F.B.; Theodoro, K.H.; Gloria, M.B.A. Bioactive amines in fresh beef liver and influence of refrigerated storage and pan–roasting. Food Control 2016, 60, 151–157. [Google Scholar] [CrossRef]
- Abdullah, B.M. Composition, chemical and microbiological properties of Jordanian ovine organ meats. Int. J. Food Sci. Technol. 2008, 43, 746–751. [Google Scholar] [CrossRef]
- Devatkal, S.; Mendiratta, S.K. Evaluation of Shelf Life and Spoilage Pattern of Aerobically Stored Buffalo Liver. J. Muscle Foods 2007, 18, 276–284. [Google Scholar] [CrossRef]
- Paulsen, P.; Dicakova, Z.; Bauer, F. Biogenic amines and polyamines in liver, kidney and spleen of roe deer and European brown hare. Eur. Food Res. Technol. 2008, 227, 209–213. [Google Scholar] [CrossRef]
- Zou, Y.; Shahidi, F.; Shi, H.B.; Wang, J.K.; Huang, Y.; Xu, W.M.; Wang, D.Y. Values–added utilization of protein and hydrolysates from animal processing by–product livers: A review. Trends Food Sci. Technol. 2021, 110, 432–442. [Google Scholar] [CrossRef]
- Abu–Salem, F.M.; Abou Arab, E.A. Chemical properties, microbiological quality and sensory evaluation of chicken and duck liver paste (foie gras). Grasas Y Aceites 2010, 61, 126–135. [Google Scholar] [CrossRef]
- Delgado–Pando, G.; Cofrades, S.; Rodriguez–Salas, L.; Jimenez–Colmenero, F. A healthier oil combination and konjac gel as functional ingredients in low–fat pork liver pate. Meat Sci. 2011, 88, 241–248. [Google Scholar] [CrossRef]
- Steen, L.; Fraeye, I.; De Mey, E.; Goemaere, O.; Paelinck, H.; Foubert, I. Effect of Salt and Liver/Fat Ratio on Viscoelastic Properties of Liver Paste and Its Intermediates. Food Bioprocess Technol. 2014, 7, 496–505. [Google Scholar] [CrossRef]
- Xiong, G.; Han, M.; Kang, Z.; Zhao, Y.; Xu, X.; Zhu, Y. Evaluation of protein structural changes and water mobility in chicken liver paste batters prepared with plant oil substituting pork back–fat combined with pre–emulsification. Food Chem. 2016, 196, 388–395. [Google Scholar] [CrossRef]
- Fukui, N.; Takatori, S.; Kitagawa, Y.; Okihashi, M.; Ishikawa, E.; Fujiyama, T.; Kajimura, K.; Furuta, M.; Obana, H. Determination of irradiation histories of raw beef livers using liquid chromatography–tandem mass spectrometry of 5,6–dihydrothymidine. Food Chem. 2017, 216, 186–193. [Google Scholar] [CrossRef]
- Luo, J.; Yu, Q.L.; Han, G.X.; Zhang, X.J.; Shi, H.M.; Cao, H. Identification of off–flavor compounds and deodorizing of cattle by–products. J. Food Biochem. 2022, 46, 12. [Google Scholar] [CrossRef] [PubMed]
- Yang, X.; Yang, F.; Liu, Y.; Li, J.; Song, H. Off–flavor removal from thermal–treated watermelon juice by adsorbent treatment with β–cyclodextrin, xanthan gum, carboxymethyl cellulose sodium, and sugar/acid. LWT 2020, 131, 109775. [Google Scholar] [CrossRef]
- Khalafu, S.H.S.; Aida, W.M.W.; Lim, S.J.; Maskat, M.Y. Effects of deodorisation methods on volatile compounds, chemical properties and antioxidant activities of fucoidan isolated from brown seaweed (Sargassum sp.). Algal Res. 2017, 25, 507–515. [Google Scholar] [CrossRef]
- Sun, J.A.; Yu, X.H.; Fang, B.H.; Ma, L.; Xue, C.H.; Zhang, Z.H.; Mao, X.Z. Effect of fermentation by Aspergillus oryzae on the biochemical and sensory properties of anchovy (Engraulis japonicus) fish sauce. Int. J. Food Sci. Technol. 2016, 51, 133–141. [Google Scholar] [CrossRef]
- Liu, J.J.; Ellies–Oury, M.P.; Chriki, S.; Legrand, I.; Pogorzelski, G.; Wierzbicki, J.; Farmer, L.; Troy, D.; Polkinghorne, R.; Hocquette, J.F. Contributions of tenderness, juiciness and flavor liking to overall liking of beef in Europe. Meat Sci. 2020, 168, 9. [Google Scholar] [CrossRef] [PubMed]
- Desmond, E. Reducing salt: A challenge for the meat industry. Meat Sci. 2006, 74, 188–196. [Google Scholar] [CrossRef]
- Ojangba, T.; Zhang, L.; Boamah, S.; Gao, Y.L.; Wang, Z.; Amagloh, F.K. Effect of Partial Substitution of Sodium Chloride (NaCl) with Potassium Chloride (KCl) Coupled with High–Pressure Processing (HPP) on Physicochemical Properties and Volatile Compounds of Beef Sausage under Cold Storage at 4 degrees C. Processes 2022, 10, 431. [Google Scholar] [CrossRef]
- Liang, Z.C.; Yang, C.; He, Z.G.; Lin, X.Z.; Chen, B.Y.; Li, W.X. Changes in characteristic volatile aroma substances during fermentation and deodorization of Gracilaria lemaneiformis by lactic acid bacteria and yeast. Food Chem. 2023, 405, 10. [Google Scholar] [CrossRef]
- Li, X.Z.; Huang, M.Y.; Song, J.L.; Shi, X.F.; Chen, X.; Yang, F.X.; Pi, J.S.; Zhang, H.; Xu, G.Y.; Zheng, J.X. Analysis of fishy taint in duck eggs reveals the causative constituent of the fishy odor and factors affecting the perception ability of this odor. Poult. Sci. 2019, 98, 5198–5207. [Google Scholar] [CrossRef]
- Dai, W.L.; Wang, W.J.; Gu, S.Q.; Xu, M.J.; Yao, H.Z.; Zhou, X.X.; Ding, Y.T. Effect of chitosan–epigallocatechin gallate coating on volatile flavor compounds retention in bighead carp (Aristichthys nobilis) fillets during chilled storage. LWT Food Sci. Technol. 2022, 169, 11. [Google Scholar] [CrossRef]
- Wang, F.; Gao, Y.Q.; Wang, H.B.; Xi, B.; He, X.N.; Yang, X.L.; Li, W.H. Analysis of volatile compounds and flavor fingerprint in Jingyuan lamb of different ages using gas chromatography–ion mobility spectrometry (GC–IMS). Meat Sci. 2021, 175, 11. [Google Scholar] [CrossRef] [PubMed]
- Wang, Y.J.; Bu, X.R.; Yang, D.W.; Deng, D.; Lei, Z.M.; Guo, Z.B.; Ma, X.T.; Zhang, L.; Yu, Q.L. Effect of Cooking Method and Doneness Degree on Volatile Compounds and Taste Substance of Pingliang Red Beef. Foods 2023, 12, 446. [Google Scholar] [CrossRef] [PubMed]
- Wu, T.L.; Wang, M.Q.; Wang, P.; Tian, H.L.; Zhan, P. Advances in the Formation and Control Methods of Undesirable Flavors in Fish. Foods 2022, 11, 2504. [Google Scholar] [CrossRef] [PubMed]
- Gao, S.; Liu, Y.Y.; Fu, Z.X.; Zhang, H.J.; Zhang, L.T.; Li, B.; Tan, Y.Q.; Hong, H.; Luo, Y.K. Uncovering quality changes of salted bighead carp fillets during frozen storage: The potential role of time–dependent protein denaturation and oxidation. Food Chem. 2023, 414, 10. [Google Scholar] [CrossRef] [PubMed]
- Fan, H.B.; Luo, Y.K.; Yin, X.F.; Bao, Y.L.; Feng, L.G. Biogenic amine and quality changes in lightly salt– and sugar–salted black carp (Mylopharyngodon piceus) fillets stored at 4 degrees C. Food Chem. 2014, 159, 20–28. [Google Scholar] [CrossRef]
- Jiang, Q.Q.; Nakazawa, N.; Hu, Y.Q.; Osako, K.; Okazaki, E. Microstructural modification and its effect on the quality attributes of frozen–thawed bigeye tuna (Thunnus obesus) meat during salting. LWT Food Sci. Technol. 2019, 100, 213–219. [Google Scholar] [CrossRef]
- Li, M.Q.; Yang, R.W.; Zhang, H.; Wang, S.L.; Chen, D.; Lin, S.Y. Development of a flavor fingerprint by HS–GC–IMS with PCA for volatile compounds of Tricholoma matsutake Singer. Food Chem. 2019, 290, 32–39. [Google Scholar] [CrossRef]
- Yang, Y.J.; Ai, L.Z.; Mu, Z.Y.; Liu, H.D.; Yan, X.; Ni, L.; Zhang, H.; Xia, Y.J. Flavor compounds with high odor activity values (OAV > 1) dominate the aroma of aged Chinese rice wine (Huangjiu) by molecular association. Food Chem. 2022, 383, 12. [Google Scholar] [CrossRef]
- Sproston, M.J.; Akoh, C.C. Antioxidative Effects of a Glucose–Cysteine Maillard Reaction Product on the Oxidative Stability of a Structured Lipid in a Complex Food Emulsion. J. Food Sci. 2016, 81, C2923–C2931. [Google Scholar] [CrossRef]
- Qian, M.; Zheng, M.Y.; Zhao, W.H.; Liu, Q.Y.; Zeng, X.F.; Bai, W.D. Effect of marinating and frying on the flavor of braised pigeon. J. Food Process Preserv. 2021, 45, 10. [Google Scholar] [CrossRef]
- Resconi, V.C.; Escudero, A.; Campo, M.M. The Development of Aromas in Ruminant Meat. Molecules 2013, 18, 6748–6781. [Google Scholar] [CrossRef] [PubMed]
- Ozkara, K.T.; Amanpour, A.; Guclu, G.; Kelebek, H.; Selli, S. GC–MS–Olfactometric Differentiation of Aroma–Active Compounds in Turkish Heat–Treated Sausages by Application of Aroma Extract Dilution Analysis. Food Anal. Meth. 2019, 12, 729–741. [Google Scholar] [CrossRef]
- Mottram, D.S. Flavour formation in meat and meat products: A review. Food Chem. 1998, 62, 415–424. [Google Scholar] [CrossRef]
- Minor, L.J.; Pearson, A.M.; Dawson, L.E.; Schweigert, B.S. Chicken Flavor: The Identification of Some Chemical Components and the Importance of Sulfur Compounds in the Cooked Volatile Fraction. J. Food Sci. 2010, 30, 686–696. [Google Scholar] [CrossRef]
- Edris, A.E.; Fadel, H.M. Investigation of the volatile aroma components of garlic leaves essential oil. Possibility of utilization to enrich garlic bulb oil. Eur. Food Res. Technol. 2002, 214, 105–107. [Google Scholar] [CrossRef]
- Zhang, X.J.; Gao, P.; Xia, W.S.; Jiang, Q.X.; Liu, S.Q.; Xu, Y.S. Characterization of key aroma compounds in low–salt fermented sour fish by gas chromatography–mass spectrometry, odor activity values, aroma recombination and omission experiments. Food Chem. 2022, 397, 8. [Google Scholar] [CrossRef]
- Cai, Z.D.; Ruan, Y.F.; He, J.; Dang, Y.L.; Cao, J.X.; Sun, Y.Y.; Pan, D.D.; Tian, H.W. Effects of microbial fermentation on the flavor of cured duck legs. Poult. Sci. 2020, 99, 4642–4652. [Google Scholar] [CrossRef]
- Zhou, J.J.; Han, Y.Q.; Zhuang, H.N.; Feng, T.; Xu, B.C. Influence of the Type of Extraction Conditions and Fiber Coating on the Meat of Sauced Duck Neck Volatile Compounds Extracted by Solid–Phase Microextraction (SPME). Food Anal. Meth. 2015, 8, 1661–1672. [Google Scholar] [CrossRef]
- Huan, Y.; Zhou, G.; Zhao, G.; Xu, X.; Peng, Z. Changes in flavor compounds of dry–cured Chinese Jinhua ham during processing. Meat Sci. 2005, 71, 291–299. [Google Scholar] [CrossRef]
- Vigor, C.; Bertrand–Michel, J.; Pinot, E.; Oger, C.; Vercauteren, J.; Le Faouder, P.; Galano, J.M.; Lee, J.C.Y.; Durand, T. Non–enzymatic lipid oxidation products in biological systems: Assessment of the metabolites from polyunsaturated fatty acids. J. Chromatogr. B 2014, 964, 65–78. [Google Scholar] [CrossRef]
- Zhang, K.H.; Li, D.; Zang, M.W.; Zhang, Z.Q.; Li, X.M.; Wang, S.W.; Zhang, S.L.; Zhao, B. Comparative characterization of fatty acids, reheating volatile compounds, and warmed–over flavor (WOF) of Chinese indigenous pork and hybrid pork. LWT Food Sci. Technol. 2022, 155, 9. [Google Scholar] [CrossRef]


| IDX | Solution | Time | Soaking | SN | IDX | Solution | Time | Baking | SN |
|---|---|---|---|---|---|---|---|---|---|
| 1 | Not soaked | 0 | 4 °C | A | 1 | Not soaked | 0 | 200 °C, 7 min | KA |
| 2 | Distilled water | 30 | 4 °C | B–30 | 2 | Distilled water | 30 | 200 °C, 7 min | KB–30 |
| 3 | Distilled water | 60 | 4 °C | B–60 | 3 | Distilled water | 60 | 200 °C, 7 min | KB–60 |
| 4 | Distilled water | 90 | 4 °C | B–90 | 4 | Distilled water | 90 | 200 °C, 7 min | KB–90 |
| 5 | 1% salt | 30 | 4 °C | C–30 | 5 | 1% salt | 30 | 200 °C, 7 min | KC–30 |
| 6 | 1% salt | 60 | 4 °C | C–60 | 6 | 1% salt | 60 | 200 °C, 7 min | KC–60 |
| 7 | 1% salt | 90 | 4 °C | C–90 | 7 | 1% salt | 90 | 200 °C, 7 min | KC–90 |
| Type | Compound | CAS# | Formula | MW | RI(s) | Dt | A | B–30 | B–60 | B–90 | C–30 | C–60 | C–90 |
|---|---|---|---|---|---|---|---|---|---|---|---|---|---|
| Aldehyde | Decanal | C112312 | C10H20O | 156.3 | 1277.1 | 1.53797 | 0.21 ± 0.00 a | 0.19 ± 0.02 a | 0.22 ± 0.00 a | 0.22 ± 0.00 a | 0.24 ± 0.02 a | 0.25 ± 0.03 a | 0.22 ± 0.02 a |
| (E)–2–nonenal | C18829566 | C9H16O | 140.2 | 1188.1 | 1.4107 | 0.25 ± 0.00 a | 0.22 ± 0.01 a | 0.26 ± 0.00 a | 0.22 ± 0.00 a | 0.25 ± 0.03 a | 0.24 ± 0.06 a | 0.27 ± 0.02 a | |
| Nonanal–M | C124196 | C9H18O | 142.2 | 1109.1 | 1.47344 | 2.00 ± 0.01 a | 2.04 ± 0.07 a | 2.19 ± 0.02 a | 1.75 ± 0.01 a | 2.19 ± 0.02 a | 2.22 ± 0.02 a | 2.30 ± 0.07 a | |
| Nonanal–D | C124196 | C9H18O | 142.2 | 1108.1 | 1.94666 | 0.37 ± 0.00 a | 0.26 ± 0.02 b | 0.35 ± 0.00 ab | 0.31 ± 0.00 ab | 0.35 ± 0.06 ab | 0.36 ± 0.04 ab | 0.38 ± 0.07 ab | |
| (E)–2–octenal–M | C2548870 | C8H14O | 126.2 | 1054.7 | 1.33541 | 0.35 ± 0.00 b | 0.40 ± 0.01 ab | 0.50 ± 0.01 a | 0.42 ± 0.01 ab | 0.39 ± 0.00 ab | 0.43 ± 0.07 b | 0.45 ± 0.06 ab | |
| (E)–2–octenal–D | C2548870 | C8H14O | 126.2 | 1054.7 | 1.82835 | 0.09 ± 0.00 ab | 0.07 ± 0.01 b | 0.10 ± 0.00 ab | 0.10 ± 0.00 a | 0.08 ± 0.01 ab | 0.10 ± 0.01 ab | 0.10 ± 0.00 a | |
| Octanal–M | C124130 | C8H16O | 128.2 | 1008.6 | 1.40712 | 0.84 ± 0.01 a | 0.80 ± 0.03 a | 0.95 ± 0.01 a | 0.78 ± 0.00 a | 0.87 ± 0.01 a | 0.94 ± 0.09 a | 0.99 ± 0.03 a | |
| Octanal–D | C124130 | C8H16O | 128.2 | 1004.5 | 1.82656 | 0.38 ± 0.00 ab | 0.28 ± 0.03 b | 0.44 ± 0.01 a | 0.33 ± 0.00 ab | 0.36 ± 0.02 ab | 0.44 ± 0.06 ab | 0.40 ± 0.08 ab | |
| Benzaldehyde–M | C100527 | C7H6O | 106.1 | 956.7 | 1.15172 | 3.19 ± 0.01 ab | 3.16 ± 0.01 ab | 3.81 ± 0.02 a | 3.00 ± 0.03 bc | 2.84 ± 0.00 c | 3.84 ± 0.00 ab | 3.28 ± 0.01 bc | |
| Benzaldehyde–D | C100527 | C7H6O | 106.1 | 957.1 | 1.47171 | 2.61 ± 0.01 a | 2.69 ± 0.01 a | 2.89 ± 0.03 a | 2.24 ± 0.03 ab | 1.96 ± 0.00 b | 2.36 ± 0.08 b | 1.91 ± 0.03 b | |
| Benzene acetaldehyde | C122781 | C8H8O | 120.2 | 1039.3 | 1.25813 | 0.74 ± 0.00 a | 0.59 ± 0.03 ab | 0.34 ± 0.01 cd | 0.36 ± 0.01 cd | 0.64 ± 0.06 ab | 0.38 ± 0.00 cd | 0.23 ± 0.02 d | |
| (E)–hept–2–enal | C18829555 | C7H12O | 112.2 | 952.3 | 1.67411 | 0.14 ± 0.00 ab | 0.13 ± 0.00 ab | 0.17 ± 0.00 a | 0.13 ± 0.00 ab | 0.12 ± 0.09 b | 0.15 ± 0.04 ab | 0.13 ± 0.01 b | |
| Hexanal–M | C66251 | C6H12O | 100.2 | 791.9 | 1.25392 | 1.10 ± 0.01 c | 1.14 ± 0.01 c | 1.66 ± 0.01 b | 1.05 ± 0.01 c | 1.25 ± 0.24 c | 2.11 ± 0.10 a | 1.74 ± 0.06 ab | |
| Hexanal–D | C66251 | C6H12O | 100.2 | 787.2 | 1.56558 | 1.82 ± 0.03 cd | 1.78 ± 0.01 cd | 2.60 ± 0.01 abc | 1.75 ± 0.03 cd | 2.10 ± 0.02 bcd | 3.49 ± 0.07 a | 2.96 ± 0.02 ab | |
| Heptanal–M | C111717 | C7H14O | 114.2 | 898.2 | 1.32579 | 1.35 ± 0.02 c | 1.65 ± 0.01 abc | 1.79 ± 0.01 abc | 1.53 ± 0.01 bc | 1.97 ± 0.02 a | 1.88 ± 0.01 abc | 1.92 ± 0.07 ab | |
| Heptanal–D | C111717 | C7H14O | 114.2 | 898.9 | 1.69956 | 0.27 ± 0.00 ab | 0.31 ± 0.00 ab | 0.35 ± 0.00 ab | 0.27 ± 0.00 ab | 0.33 ± 0.09 ab | 0.37 ± 0.04 ab | 0.41 ± 0.08 a | |
| 3–methylthiopropanal–M | C3268493 | C4H8OS | 104.2 | 905.2 | 1.08897 | 1.93 ± 0.04 bcd | 2.19 ± 0.01 abc | 2.73 ± 0.03 a | 1.56 ± 0.02 d | 1.61 ± 0.06 d | 2.76 ± 0.07 ab | 2.16 ± 0.09 abcd | |
| 3–methylthiopropanal–D | C3268493 | C4H8OS | 104.2 | 904.7 | 1.40189 | 0.86 ± 0.03 abc | 1.15 ± 0.02 ab | 1.32 ± 0.04 a | 0.65 ± 0.02 c | 0.64 ± 0.06 c | 1.13 ± 0.08 abc | 0.83 ± 0.05 bc | |
| Pentanal–M | C110623 | C5H10O | 86.1 | 693.4 | 1.183 21 | 0.25 ± 0.00 a | 0.24 ± 0.00 ab | 0.22 ± 0.00 c | 0.22 ± 0.00 bc | 0.27 ± 0.02 a | 0.32 ± 0.05 a | 0.28 ± 0.06 a | |
| Pentanal–D | C110623 | C5H10O | 86.1 | 692.1 | 1.43008 | 0.26 ± 0.00 a | 0.15 ± 0.00 cd | 0.16 ± 0.00 cd | 0.22 ± 0.00 ab | 0.20 ± 0.01 bc | 0.17 ± 0.02 cd | 0.19 ± 0.00 bcd | |
| Butanal | C123728 | C4H8O | 72.1 | 540.3 | 1.28464 | 0.44 ± 0.01 b | 0.57 ± 0.00 a | 0.48 ± 0.00 b | 0.36 ± 0.00 c | 0.47 ± 0.02 b | 0.39 ± 0.01 c | 0.36 ± 0.01 c | |
| (E)–2–pentenal–M | C1576870 | C5H8O | 84.1 | 744.8 | 1.10603 | 0.03 ± 0.00 cd | 0.02 ± 0.00 d | 0.05 ± 0.00 b | 0.03 ± 0.00 cd | 0.02 ± 0.00 d | 0.08 ± 0.00 a | 0.04 ± 0.00 bc | |
| (E)–2–pentenal–D | C1576870 | C5H8O | 84.1 | 745.3 | 1.35813 | 1.07 ± 0.01 abc | 1.32 ± 0.00 a | 1.02 ± 0.02 bcd | 1.18 ± 0.03 abc | 1.34 ± 0.09 ab | 0.71 ± 0.04 d | 1.06 ± 0.05 abc | |
| 2–methylbutanal–M | C96173 | C5H10O | 86.1 | 652.8 | 1.15776 | 0.08 ± 0.00 b | 0.11 ± 0.00 b | 0.13 ± 0.00 b | 0.10 ± 0.00 b | 0.13 ± 0.05 b | 0.20 ± 0.02 a | 0.12 ± 0.00 b | |
| 2–methylbutanal–D | C96173 | C5H10O | 86.1 | 654.4 | 1.40175 | 1.36 ± 0.03 a | 1.38 ± 0.01 a | 1.96 ± 0.03 a | 0.95 ± 0.01 a | 0.92 ± 0.07 b | 2.09 ± 0.01 a | 1.22 ± 0.07 a | |
| 3–methylbutanal–M | C590863 | C5H10O | 86.1 | 635.1 | 1.17318 | 0.18 ± 0.00 cd | 0.18 ± 0.00 d | 0.34 ± 0.00 b | 0.13 ± 0.00 cd | 0.20 ± 0.04 d | 0.46 ± 0.05 a | 0.34 ± 0.04 bc | |
| 3–methylbutanal–D | C590863 | C5H10O | 86.1 | 638.4 | 1.41016 | 0.60 ± 0.01 ab | 0.56 ± 0.01 ab | 0.81 ± 0.01 ab | 0.40 ± 0.00 b | 0.46 ± 0.02 ab | 0.99 ± 0.09 c | 0.50 ± 0.05 ab | |
| Esters | Butyl propanoate–M | C590012 | C7H14O2 | 130.2 | 907.3 | 1.28334 | 0.15 ± 0.00 a | 0.14 ± 0.01 ab | 0.14 ± 0.00 ab | 0.13 ± 0.00 ab | 0.14 ± 0.01 ab | 0.14 ± 0.01 b | 0.12 ± 0.01 b |
| Butyl propanoate–D | C590012 | C7H14O2 | 130.2 | 907.1 | 1.72743 | 0.06 ± 0.00 a | 0.05 ± 0.00 a | 0.06 ± 0.00 a | 0.05 ± 0.00 a | 0.06 ± 0.00 a | 0.06 ± 0.02 a | 0.06 ± 0.05 a | |
| Ethyl 3–methylbutyrate | C108645 | C7H14O2 | 130.2 | 842.7 | 1.65769 | 0.07 ± 0.00 ab | 0.05 ± 0.00 b | 0.07 ± 0.00 b | 0.09 ± 0.00 a | 0.08 ± 0.00 ab | 0.08 ± 0.01 b | 0.07 ± 0.02 b | |
| Propyl acetate | C109604 | C5H10O2 | 102.1 | 703.6 | 1.47843 | 0.10 ± 0.00 a | 0.04 ± 0.00 bc | 0.04 ± 0.00 c | 0.10 ± 0.00 a | 0.07 ± 0.00 abc | 0.05 ± 0.00 bc | 0.05 ± 0.02 bc | |
| Butyl acetate | C123864 | C6H12O2 | 116.2 | 816.1 | 1.61605 | 0.03 ± 0.00 a | 0.02 ± 0.00 b | 0.04 ± 0.00 a | 0.03 ± 0.00 a | 0.03 ± 0.00 a | 0.04 ± 0.00 a | 0.04 ± 0.00 a | |
| Ethyl acetate–M | C141786 | C4H8O2 | 88.1 | 599.1 | 1.0987 | 1.08 ± 0.01 bc | 1.05 ± 0.00 c | 0.84 ± 0.01 e | 1.05 ± 0.00 c | 1.61 ± 0.04 a | 0.74 ± 0.09 f | 1.08 ± 0.07 cd | |
| Ethyl acetate–D | C141786 | C4H8O2 | 88.1 | 601.1 | 1.34402 | 14.20 ± 0.05 b | 12.43 ± 0.04 b | 2.10 ± 0.06 cd | 18.12 ± 0.19 a | 15.45 ± 0.14 b | 1.35 ± 0.03 d | 5.43 ± 0.07 c | |
| Ethyl hexanoate | C123660 | C8H16O2 | 144.2 | 999.5 | 1.34258 | 0.20 ± 0.00 b | 0.24 ± 0.01 ab | 0.23 ± 0.00 b | 0.28 ± 0.00 a | 0.23 ± 0.05 b | 0.23 ± 0.06 b | 0.26 ± 0.01 ab | |
| Ketones | 2–methyl–3–heptanone | C13019200 | C8H16O | 128.2 | 1085.8 | 1.27626 | 0.06 ± 0.00 ab | 0.05 ± 0.00 b | 0.06 ± 0.00 ab | 0.07 ± 0.00 ab | 0.06 ± 0.01 ab | 0.06 ± 0.01 b | 0.06 ± 0.01 b |
| 2,6 dimethyl–4–heptanone | C108838 | C9H18O | 142.2 | 967.8 | 1.32856 | 0.21 ± 0.00 ab | 0.21 ± 0.01 a | 0.19 ± 0.00 a | 0.21 ± 0.00 a | 0.25 ± 0.00 a | 0.20 ± 0.02 b | 0.19 ± 0.06 b | |
| 3–pentanone–M | C96220 | C5H10O | 86.1 | 693.2 | 1.10836 | 0.57 ± 0.00 bc | 0.54 ± 0.01 cd | 0.66 ± 0.00 b | 0.49 ± 0.00 d | 0.57 ± 0.02 cd | 0.82 ± 0.02 a | 0.75 ± 0.03 a | |
| 3–pentanone–D | C96220 | C5H10O | 86.1 | 692.6 | 1.35946 | 1.01 ± 0.01 cd | 0.95 ± 0.01 d | 1.43 ± 0.00 a | 1.23 ± 0.01 ab | 1.05 ± 0.02 cd | 1.37 ± 0.03 abc | 1.41 ± 0.03 a | |
| 2–hexanone | C591786 | C6H12O | 100.2 | 779.5 | 1.18752 | 0.14 ± 0.00 a | 0.14 ± 0.00 a | 0.16 ± 0.00 a | 0.15 ± 0.00 a | 0.12 ± 0.07 b | 0.19 ± 0.02 a | 0.16 ± 0.01 a | |
| 3–hydroxybutan–2–one–M | C513860 | C4H8O2 | 88.1 | 712.8 | 1.05627 | 0.78 ± 0.04 cd | 0.44 ± 0.01 d | 1.71 ± 0.05 b | 0.73 ± 0.05 cd | 0.46 ± 0.01 d | 3.04 ± 0.19 a | 1.32 ± 0.20 bc | |
| 3–hydroxybutan–2–one–D | C513860 | C4H8O2 | 88.1 | 713.2 | 1.33282 | 10.65 ± 0.01 ab | 10.71 ± 0.04 ab | 11.50 ± 0.08 ab | 10.04 ± 0.06 b | 10.97 ± 0.81 ab | 9.39 ± 0.37 c | 11.64 ± 0.12 ab | |
| 2,3–hexanedione–M | C3848246 | C6H10O2 | 114.1 | 778.3 | 1.09198 | 0.25 ± 0.01 bc | 0.18 ± 0.00 c | 0.29 ± 0.00 bc | 0.17 ± 0.00 c | 0.22 ± 0.01 bc | 0.47 ± 0.04 a | 0.33 ± 0.05 ab | |
| 2,3–hexanedione–D | C3848246 | C6H10O2 | 114.1 | 772.7 | 1.35966 | 0.73 ± 0.01 abc | 0.86 ± 0.03 ab | 0.57 ± 0.02 bc | 0.66 ± 0.02 bc | 1.09 ± 0.08 a | 0.55 ± 0.00 c | 0.70 ± 0.01 bc | |
| (E)–3–penten–2–one–M | C3102338 | C5H8O | 84.1 | 731.8 | 1.35105 | 2.37 ± 0.03 ab | 2.67 ± 0.01 a | 2.17 ± 0.04 b | 2.54 ± 0.04 ab | 2.87 ± 0.08 a | 1.42 ± 0.04 c | 2.30 ± 0.08 ab | |
| 2–heptanone–M | C110430 | C7H14O | 114.2 | 891.8 | 1.25627 | 0.36 ± 0.00 d | 0.40 ± 0.00 d | 0.67 ± 0.00 a | 0.50 ± 0.01 bc | 0.38 ± 0.09 d | 0.73 ± 0.02 a | 0.65 ± 0.20 a | |
| 2–heptanone–D | C110430 | C7H14O | 114.2 | 890.1 | 1.63201 | 0.11 ± 0.00 c | 0.15 ± 0.01 bc | 0.23 ± 0.00 a | 0.20 ± 0.00 a | 0.13 ± 0.00 c | 0.21 ± 0.08 ab | 0.23 ± 0.08 a | |
| 1–octen–3–one–M | C4312996 | C8H14O | 126.2 | 979.4 | 1.27092 | 0.46 ± 0.00 d | 0.60 ± 0.00 b | 0.76 ± 0.00 a | 0.56 ± 0.00 bc | 0.45 ± 0.01 d | 0.69 ± 0.00 b | 0.65 ± 0.08 b | |
| 1–octen–3–one–D | C4312996 | C8H14O | 126.2 | 978.7 | 1.68592 | 0.06 ± 0.00 ab | 0.10 ± 0.00 ab | 0.12 ± 0.00 a | 0.10 ± 0.00 bc | 0.07 ± 0.03 c | 0.09 ± 0.10 a | 0.09 ± 0.02 bc | |
| 2–butanone–M | C78933 | C4H8O | 72.1 | 565.1 | 1.06071 | 0.94 ± 0.02 b | 1.04 ± 0.01 b | 1.55 ± 0.02 a | 0.94 ± 0.01 b | 1.06 ± 0.09 b | 1.89 ± 0.81 a | 1.58 ± 0.12 a | |
| 2–butanone–D | C78933 | C4H8O | 72.1 | 566.8 | 1.24553 | 9.65 ± 0.04 de | 10.44 ± 0.07 cd | 17.52 ± 0.10 a | 8.22 ± 0.06 ef | 7.99 ± 0.15 e | 18.74 ± 0.13 a | 12.78 ± 0.66 bc | |
| 2–ethyl–1–hexanol | C104767 | C8H18O | 130.2 | 1026.9 | 1.26013 | 0.15 ± 0.00 a | 0.14 ± 0.01 ab | 0.18 ± 0.00 ab | 0.15 ± 0.00 ab | 0.12 ± 0.00 ab | 0.16 ± 0.01 b | 0.17 ± 0.01 b | |
| Oct–1–en–3–ol–M | C3391864 | C8H16O | 128.2 | 986 | 1.15975 | 3.33 ± 0.01 a | 3.26 ± 0.05 a | 2.99 ± 0.02 a | 3.51 ± 0.03 a | 2.70 ± 0.20 a | 3.02 ± 0.18 a | 2.47 ± 0.07 a | |
| Oct–1–en–3–ol–D | C3391864 | C8H16O | 128.2 | 979.4 | 1.60406 | 0.10 ± 0.00 ab | 0.08 ± 0.00 b | 0.11 ± 0.00 b | 0.09 ± 0.00 a | 0.10 ± 0.01 ab | 0.11 ± 0.01 b | 0.10 ± 0.03 b | |
| n–hexanol–M | C111273 | C6H14O | 102.2 | 861.9 | 1.32497 | 0.28 ± 0.01 a | 0.48 ± 0.01 bc | 0.23 ± 0.00 c | 0.44 ± 0.02 a | 0.65 ± 0.06 abc | 0.24 ± 0.01 bc | 0.30 ± 0.02 bc | |
| n–hexanol–D | C111273 | C6H14O | 102.2 | 861.9 | 1.6385 | 0.13 ± 0.00 a | 0.09 ± 0.01 b | 0.14 ± 0.00 a | 0.12 ± 0.00 a | 0.13 ± 0.00 a | 0.15 ± 0.09 a | 0.12 ± 0.01 a | |
| (E)–2–hexen–1–ol–M | C928950 | C6H12O | 100.2 | 846 | 1.18518 | 0.11 ± 0.00 b | 0.11 ± 0.00 b | 0.17 ± 0.00 a | 0.09 ± 0.00 b | 0.10 ± 0.07 b | 0.17 ± 0.01 a | 0.15 ± 0.06 a | |
| (E)–2–hexen–1–ol–D | C928950 | C6H12O | 100.2 | 844 | 1.51752 | 0.03 ± 0.00 b | 0.03 ± 0.00 b | 0.02 ± 0.00 cd | 0.03 ± 0.00 a | 0.05 ± 0.03 b | 0.02 ± 0.05 d | 0.02 ± 0.01 c | |
| 3–methylbutan–1–ol | C123513 | C5H12O | 88.1 | 727.3 | 1.48806 | 0.07 ± 0.00 b | 0.07 ± 0.00 ab | 0.12 ± 0.00 b | 0.08 ± 0.00 a | 0.07 ± 0.01 b | 0.18 ± 0.01 b | 0.10 ± 0.01 ab | |
| 1–butanol–M | C71363 | C4H10O | 74.1 | 654.3 | 1.1823 | 0.20 ± 0.00 ab | 0.19 ± 0.00 b | 0.28 ± 0.00 ab | 0.17 ± 0.00 ab | 0.24 ± 0.02 ab | 0.32 ± 0.01 b | 0.29 ± 0.01 b | |
| 1–butanol–D | C71363 | C4H10O | 74.1 | 653 | 1.37683 | 0.32 ± 0.00 ab | 0.32 ± 0.00 ab | 0.42 ± 0.01 b | 0.34 ± 0.00 ab | 0.23 ± 0.01 a | 0.39 ± 0.03 b | 0.20 ± 0.03 b | |
| Methanethiol | C74931 | CH4S | 48.1 | 441.9 | 1.0483 | 8.50 ± 0.01 bc | 9.09 ± 0.04 cd | 5.96 ± 0.07 b | 8.67 ± 0.03 d | 9.35 ± 0.07 cd | 5.05 ± 0.09 a | 8.72 ± 0.02 a | |
| 2–furanmethanethiol | C98022 | C5H6OS | 114.2 | 912.8 | 1.11099 | 0.04 ± 0.00 cd | 0.04 ± 0.00 d | 0.21 ± 0.00 a | 0.13 ± 0.00 ab | 0.02 ± 0.00 cd | 0.11 ± 0.00 abc | 0.03 ± 0.04 a | |
| Pentan–1–ol–M | C71410 | C5H12O | 88.1 | 762.4 | 1.25392 | 0.29 ± 0.00 a | 0.34 ± 0.01 a | 0.34 ± 0.00 a | 0.30 ± 0.01 a | 0.38 ± 0.09 a | 0.34 ± 0.04 a | 0.31 ± 0.01 a | |
| Pentan–1–ol–D | C71410 | C5H12O | 88.1 | 764.4 | 1.51286 | 0.09 ± 0.00 ab | 0.09 ± 0.00 ab | 0.11 ± 0.00 a | 0.09 ± 0.00 ab | 0.08 ± 0.00 b | 0.10 ± 0.01 ab | 0.09 ± 0.01 ab | |
| Hydrocarbon | Styrene | C100425 | C8H8 | 104.2 | 887.9 | 1.41987 | 0.19 ± 0.00 abc | 0.22 ± 0.00 a | 0.19 ± 0.00 bcd | 0.21 ± 0.00 ab | 0.17 ± 0.01 cd | 0.15 ± 0.01 d | 0.17 ± 0.01 cd |
| Toluene | C108883 | C7H8 | 92.1 | 760.5 | 1.01492 | 0.13 ± 0.00 cde | 0.12 ± 0.00 e | 0.20 ± 0.00 b | 0.13 ± 0.00 cde | 0.13 ± 0.00 de | 0.26 ± 0.00 a | 0.18 ± 0.01 bc | |
| Acids | Hexanoic acid | C142621 | C6H12O2 | 116.2 | 994.1 | 1.30503 | 1.48 ± 0.01 c | 1.14 ± 0.00 e | 2.07 ± 0.01 b | 1.09 ± 0.01 e | 1.26 ± 0.03 de | 2.19 ± 0.08 b | 1.99 ± 0.14 b |
| Furan | 2–pentyl furan | C3777693 | C9H14O | 138.2 | 994.1 | 1.2552 | 0.31 ± 0.00 a | 0.30 ± 0.01 a | 0.35 ± 0.00 a | 0.31 ± 0.00 a | 0.21 ± 0.00 c | 0.35 ± 0.02 a | 0.32 ± 0.19 a |
| Type | Compound | CAS# | Formula | MW | RI(s) | Dt | KA | KB–30 | KB–60 | KB–90 | KC–30 | KC–60 | KC–90 |
|---|---|---|---|---|---|---|---|---|---|---|---|---|---|
| Aldehyde | Decanal | C112312 | C10H20O | 156.3 | 1277.1 | 1.53797 | 0.20 ± 0.00 bc | 0.26 ± 0.02 a | 0.21 ± 0.00 ab | 0.25 ± 0.00 a | 0.18 ± 0.02 bc | 0.15 ± 0.02 c | 0.17 ± 0.02 bc |
| (E)–2–nonenal | C18829566 | C9H16O | 140.2 | 1188.1 | 1.4107 | 0.21 ± 0.00 abc | 0.23 ± 0.01 ab | 0.19 ± 0.00 bc | 0.20 ± 0.00 bc | 0.19 ± 0.07 c | 0.18 ± 0.01 c | 0.23 ± 0.01 a | |
| Nonanal–M | C124196 | C9H18O | 142.2 | 1109.1 | 1.47344 | 1.19 ± 0.04 g | 1.26 ± 0.07 g | 1.59 ± 0.02 f | 1.84 ± 0.01 e | 3.73 ± 0.22 c | 5.48 ± 0.07 a | 3.99 ± 0.07 b | |
| Nonanal–D | C124196 | C9H18O | 142.2 | 1108.1 | 1.94666 | 0.33 ± 0.01 de | 0.38 ± 0.02 d | 0.29 ± 0.00 e | 0.33 ± 0.00 de | 0.47 ± 0.06 c | 1.03 ± 0.02 a | 0.56 ± 0.02 b | |
| (E)–2–octenal–M | C2548870 | C8H14O | 126.2 | 1054.7 | 1.33541 | 0.46 ± 0.01 f | 0.52 ± 0.01 e | 0.76 ± 0.01 c | 0.69 ± 0.01 d | 0.88 ± 0.04 b | 0.77 ± 0.01 c | 1.13 ± 0.01 a | |
| (E)–2–octenal–D | C2548870 | C8H14O | 126.2 | 1054.7 | 1.82835 | 0.09 ± 0.00 ab | 0.10 ± 0.01 a | 0.09 ± 0.00 ab | 0.08 ± 0.00 abc | 0.07 ± 0.14 bc | 0.06 ± 0.01 c | 0.10 ± 0.01 ab | |
| Octanal–M | C124130 | C8H16O | 128.2 | 1008.6 | 1.40712 | 0.83 ± 0.01 f | 1.13 ± 0.03 e | 1.54 ± 0.01 c | 1.45 ± 0.00 cd | 2.22 ± 0.11 b | 3.43 ± 0.03 a | 2.29 ± 0.03 b | |
| Octanal–D | C124130 | C8H16O | 128.2 | 1004.5 | 1.82656 | 0.42 ± 0.00 de | 0.46 ± 0.03 cd | 0.33 ± 0.01 e | 0.36 ± 0.00 e | 0.50 ± 0.10 c | 1.23 ± 0.03 a | 0.58 ± 0. 03 b | |
| Benzaldehyde–M | C100527 | C7H6O | 106.1 | 956.7 | 1.15172 | 0.32 ± 0.01 ef | 0.55 ± 0.01 d | 0.43 ± 0.02 e | 0.36 ± 0.03 ef | 1.29 ± 0.10 c | 1.81 ± 0.01 a | 1.41 ± 0.01 b | |
| Benzaldehyde–D | C100527 | C7H6O | 106.1 | 957.1 | 1.47171 | 0.13 ± 0.01 d | 0.11 ± 0.01 d | 0.08 ± 0.03 d | 0.11 ± 0.03 d | 0.36 ± 0.10 c | 0.58 ± 0.01 a | 0.72 ± 0.01 b | |
| Benzene acetaldehyde | C122781 | C8H8O | 120.2 | 1039.3 | 1.25813 | 0.17 ± 0.02 e | 0.19 ± 0.03 e | 0.18 ± 0.01 e | 0.16 ± 0.01 e | 0.26 ± 0.06 d | 0.34 ± 0.03 c | 0.58 ± 0.03 a | |
| (E)–hept–2–enal | C18829555 | C7H12O | 112.2 | 952.3 | 1.67411 | 0.09 ± 0.00 d | 0.11 ± 0.00 cd | 0.16 ± 0.00 b | 0.19 ± 0.00 b | 0.15 ± 0.01 bc | 0.17 ± 0.00 b | 0.34 ± 0.00 a | |
| Hexanal–M | C66251 | C6H12O | 100.2 | 791.9 | 1.25392 | 1.18 ± 0.02 d | 1.00 ± 0.01 e | 1.36 ± 0.01 b | 1.41 ± 0.01 b | 1.74 ± 0.24 a | 1.33 ± 0.01 bc | 0.77 ± 0.01 f | |
| Hexanal–D | C66251 | C6H12O | 100.2 | 787.2 | 1.56558 | 0.52 ± 0.01 f | 1.08 ± 0.01 e | 1.87 ± 0.01 d | 2.59 ± 0.03 c | 6.58 ± 0.02 a | 6.90 ± 0.00 a | 3.71 ± 0.01 b | |
| Heptanal–M | C111717 | C7H14O | 114.2 | 898.2 | 1.32579 | 2.45 ± 0.02 f | 2.44 ± 0.01 f | 3.60 ± 0.01 cde | 3.73 ± 0.01 e | 5.35 ± 0.12 a | 4.47 ± 0.01 b | 3.64 ± 0.01 cd | |
| Heptanal–D | C111717 | C7H14O | 114.2 | 898.9 | 1.69956 | 0.08 ± 0.01 d | 0.19 ± 0.00 d | 0.16 ± 0.00 d | 0.16 ± 0.00 d | 0.84 ± 0.09 c | 1.92 ± 0.00 a | 1.02 ± 0.01 b | |
| 3–methylthiopropanal–M | C3268493 | C4H8OS | 104.2 | 905.2 | 1.08897 | 0.19 ± 0.02 c | 0.14 ± 0.01 d | 0.10 ± 0.03 g | 0.13 ± 0.02 e | 0.26 ± 0.06 b | 0.33 ± 0.01 a | 0.19 ± 0.01 c | |
| 3–methylthiopropanal–D | C3268493 | C4H8OS | 104.2 | 904.7 | 1.40189 | 0.35 ± 0.02 c | 0.51 ± 0.02 b | 0.66 ± 0.04 a | 0.73 ± 0.02 a | 0.13 ± 0.01 f | 0.16 ± 0.01 ef | 0.11 ± 0.01 f | |
| Pentanal–M | C110623 | C5H10O | 86.1 | 693.4 | 1.183 21 | 0.30 ± 0.00 d | 0.50 ± 0.00 c | 0.26 ± 0.00 de | 0.23 ± 0.00 e | 0.73 ± 0.02 a | 0.65 ± 0.01 b | 0.28 ± 0.01 de | |
| Pentanal–D | C110623 | C5H10O | 86.1 | 692.1 | 1.43008 | 0.16 ± 0.01 g | 0.65 ± 0.01 de | 0.76 ± 0.01 d | 1.08 ± 0.00 bc | 1.16 ± 0.05 b | 1.75 ± 0.01 a | 0.84 ± 0.01 cd | |
| Butanal | C123728 | C4H8O | 72.1 | 540.3 | 1.28464 | 0.22 ± 0.01 e | 0.19 ± 0.00 e | 0.23 ± 0.00 e | 0.29 ± 0.00 de | 0.70 ± 0.09 c | 1.44 ± 0.01 b | 1.66 ± 0.01 a | |
| (E)–2–pentenal–M | C1576870 | C5H8O | 84.1 | 744.8 | 1.10603 | 0.13 ± 0.00 a | 0.08 ± 0.00 c | 0.06 ± 0.00 d | 0.10 ± 0.00 b | 0.13 ± 0.02 a | 0.11 ± 0.01 b | 0.02 ± 0.00 e | |
| (E)–2–pentenal–D | C1576870 | C5H8O | 84.1 | 745.3 | 1.35813 | 0.40 ± 0.01 d | 0.28 ± 0.00 d | 0.61 ± 0.02 c | 0.31 ± 0.01 d | 0.63 ± 0.01 c | 0.71 ± 0.00 bc | 2.02 ± 0.01 a | |
| 2–methylbutanal–M | C96173 | C5H10O | 86.1 | 652.8 | 1.15776 | 0.15 ± 0.00 c | 0.07 ± 0.00 f | 0.07 ± 0.00 f | 0.10 ± 0.00 e | 0.24 ± 0.01 a | 0.16 ± 0.00 b | 0.04 ± 0.00 g | |
| 2–methylbutanal–D | C96173 | C5H10O | 86.1 | 654.4 | 1.40175 | 0.72 ± 0.03 e | 0.45 ± 0.01 f | 0.46 ± 0.03 f | 0.40 ± 0.01 f | 1.95 ± 0.07 d | 2.14 ± 0.01 c | 3.02 ± 0.01 a | |
| 3–methylbutanal–M | C590863 | C5H10O | 86.1 | 635.1 | 1.17318 | 0.39 ± 0.00 a | 0.24 ± 0.00 e | 0.22 ± 0.00 e | 0.28 ± 0.00 cd | 0.30 ± 0.01 bc | 0.25 ± 0.00 de | 0.13 ± 0.01 f | |
| 3–methylbutanal–D | C590863 | C5H10O | 86.1 | 638.4 | 1.41016 | 0.43 ± 0.01 d | 0.28 ± 0.00 e | 0.21 ± 0.01 e | 0.19 ± 0.01 e | 1.33 ± 0.02 c | 1.60 ± 0.00 b | 2.30 ± 0.00 a | |
| Esters | Butyl propanoate–M | C590012 | C7H14O2 | 130.2 | 907.3 | 1.28334 | 0.08 ± 0.00 c | 0.17 ± 0.00 a | 0.11 ± 0.00 b | 0.09 ± 0.00 bc | 0.09 ± 0.00 bc | 0.10 ± 0.01 bc | 0.08 ± 0.01 c |
| Butyl propanoate–D | C590012 | C7H14O2 | 130.2 | 907.1 | 1.72743 | 0.05 ± 0.00 d | 0.05 ± 0.00 d | 0.06 ± 0.00 d | 0.05 ± 0.00 d | 0.07 ± 0.00 c | 0.14 ± 0.00 a | 0.09 ± 0.00 b | |
| Ethyl 3–methylbutyrate | C108645 | C7H14O2 | 130.2 | 842.7 | 1.65769 | 0.05 ± 0.00 b | 2.03 ± 0.00 a | 0.05 ± 0.00 b | 0.08 ± 0.00 b | 0.04 ± 0.00 b | 0.04 ± 0.00 b | 0.04 ± 0.00 b | |
| Propyl acetate | C109604 | C5H10O2 | 102.1 | 703.6 | 1.47843 | 0.05 ± 0.00 cd | 0.22 ± 0.01 a | 0.07 ± 0.00 c | 0.11 ± 0.00 b | 0.03 ± 0.00 d | 0.03 ± 0.00 d | 0.02 ± 0.00 d | |
| Butyl acetate | C123864 | C6H12O2 | 116.2 | 816.1 | 1.61605 | 0.07 ± 0.00 b | 0.06 ± 0.00 bc | 0.05 ± 0.00 cd | 0.06 ± 0.00 bc | 0.05 ± 0.00 bc | 0.09 ± 0.00 a | 0.03 ± 0.00 e | |
| Ethyl acetate–M | C141786 | C4H8O2 | 88.1 | 599.1 | 1.0987 | 0.79 ± 0.01 c | 1.15 ± 0.00 a | 0.84 ± 0.01 b | 0.70 ± 0.00 d | 0.75 ± 0.01 d | 0.62 ± 0.01 e | 0.57 ± 0.01 f | |
| Ethyl acetate–D | C141786 | C4H8O2 | 88.1 | 601.1 | 1.34402 | 3.04 ± 0.10 c | 7.10 ± 0.04 a | 4.56 ± 0.02 b | 1.76 ± 0.09 e | 4.75 ± 0.01 b | 2.43 ± 0.04 d | 3.18 ± 0.04 c | |
| Ethyl hexanoate | C123660 | C8H16O2 | 144.2 | 999.5 | 1.34258 | 0.28 ± 0.00 d | 0.59 ± 0.01 a | 0.26 ± 0.00 d | 0.27 ± 0.00 d | 0.33 ± 0.06 bc | 0.29 ± 0.01 cd | 0.35 ± 0.01 b | |
| Ketones | 2–methyl–3–heptanone | C13019200 | C8H16O | 128.2 | 1085.8 | 1.27626 | 0.07 ± 0.00 ab | 0.07 ± 0.00 a | 0.06 ± 0.00 abc | 0.06 ± 0.00 bc | 0.06 ± 0.01 abc | 0.05 ± 0.00 c | 0.06 ± 0.00 bc |
| 2,6 dimethyl–4–heptanone | C108838 | C9H18O | 142.2 | 967.8 | 1.32856 | 0.36 ± 0.00 d | 0.39 ± 0.01 d | 0.56 ± 0.00 bc | 0.52 ± 0.00 c | 0.72 ± 0.07 a | 0.54 ± 0.01 c | 0.60 ± 0.01 b | |
| 3–pentanone–M | C96220 | C5H10O | 86.1 | 693.2 | 1.10836 | 0.41 ± 0.00 a | 0.44 ± 0.00 a | 0.30 ± 0.00 b | 0.24 ± 0.00 c | 0.19 ± 0.01 d | 0.13 ± 0.00 e | 0.07 ± 0.00 f | |
| 3–pentanone–D | C96220 | C5H10O | 86.1 | 692.6 | 1.35946 | 1.01 ± 0.01 b | 1.39 ± 0.01 a | 1.27 ± 0.00 a | 1.47 ± 0.01 a | 0.74 ± 0.30 c | 0.57 ± 0.01 c | 0.71 ± 0.01 c | |
| 2–pentanone | C107879 | C5H10O | 86.1 | 676.5 | 1.37584 | 3.85 ± 0.00 b | 2.62 ± 0.01 cd | 3.92 ± 0.00 b | 6.04 ± 0.00 a | 2.78 ± 0.03 c | 1.96 ± 0.01 d | 2.00 ± 0.01 d | |
| 2–hexanone | C591786 | C6H12O | 100.2 | 779.5 | 1.18752 | 0.31 ± 0.01 a | 0.17 ± 0.00 b | 0.09 ± 0.00 f | 0.13 ± 0.00 cd | 0.16 ± 0.02 bc | 0.11 ± 0.00 de | 0.04 ± 0.00 g | |
| 3–hydroxybutan–2–one–M | C513860 | C4H8O2 | 88.1 | 712.8 | 1.05627 | 1.00 ± 0.04 d | 1.40 ± 0.01 c | 1.29 ± 0.05 c | 1.31 ± 0.01 c | 2.07 ± 0.01 a | 1.77 ± 0.00 b | 0.10 ± 0.00 f | |
| 3–hydroxybutan–2–one–D | C513860 | C4H8O2 | 88.1 | 713.2 | 1.33282 | 10.44 ± 0.01 a | 2.67 ± 0.01 ef | 4.56 ± 0.00 d | 1.74 ± 0.00 f | 3.34 ± 0.20 de | 3.60 ± 0.01 de | 7.35 ± 0.02 c | |
| 2,3–hexanedione–M | C3848246 | C6H10O2 | 114.1 | 778.3 | 1.09198 | 0.15 ± 0.01 c | 0.12 ± 0.00 d | 0.15 ± 0.00 c | 0.16 ± 0.00 c | 0.31 ± 0.01 a | 0.27 ± 0.00 b | 0.07 ± 0.00 e | |
| 2,3–hexanedione–D | C3848246 | C6H10O2 | 114.1 | 772.7 | 1.35966 | 0.30 ± 0.01 bcd | 0.24 ± 0.01 cd | 0.35 ± 0.02 bc | 0.18 ± 0.01 d | 0.39 ± 0.13 bc | 0.44 ± 0.00 b | 0.80 ± 0.01 a | |
| (E)–3–penten–2–one–M | C3102338 | C5H8O | 84.1 | 731.8 | 1.35105 | 0.03 ± 0.02 bc | 0.02 ± 0.01 c | 0.04 ± 0.01 b | 0.04 ± 0.00 b | 0.10 ± 0.00 a | 0.11 ± 0.00 a | 0.01 ± 0.00 c | |
| (E)–3–penten–2–one–D | C3102338 | C5H8O | 84.1 | 734.2 | 1.09263 | 0.72 ± 0.03 d | 0.17 ± 0.01 f | 1.05 ± 0.02 bc | 0.14 ± 0.02 e | 0.96 ± 0.08 cd | 1.23 ± 0.04 b | 2.14 ± 0.01 a | |
| 2–heptanone–M | C110430 | C7H14O | 114.2 | 891.8 | 1.25627 | 0.79 ± 0.01 a | 0.50 ± 0.01 b | 0.18 ± 0.02 e | 0.34 ± 0.01 d | 0.54 ± 0.02 b | 0.48 ± 0.01 bc | 0.27 ± 0.01 d | |
| 2–heptanone–D | C110430 | C7H14O | 114.2 | 890.1 | 1.63201 | 1.63 ± 0.00 d | 1.32 ± 0.01 e | 2.27 ± 0.00 ab | 2.34 ± 0.06 a | 2.14 ± 0.10 abc | 1.61 ± 0.07 d | 1.92 ± 0.07 c | |
| 1–octen–3–one–M | C4312996 | C8H14O | 126.2 | 979.4 | 1.27092 | 0.11 ± 0.00 de | 0.13 ± 0.00 cd | 0.12 ± 0.01 de | 0.11 ± 0.00 e | 0.14 ± 0.02 ab | 0.14 ± 0.02 bc | 0.16 ± 0.02 a | |
| 1–octen–3–one–D | C4312996 | C8H14O | 126.2 | 978.7 | 1.68592 | 0.04 ± 0.00 b | 0.04 ± 0.00 b | 0.05 ± 0.00 ab | 0.06 ± 0.00 a | 0.04 ± 0.00 b | 0.04 ± 0.01 b | 0.05 ± 0.01 ab | |
| 2–butanone–M | C78933 | C4H8O | 72.1 | 565.1 | 1.06071 | 0.46 ± 0.02 b | 0.46 ± 0.01 b | 0.38 ± 0.02 d | 0.26 ± 0.01 e | 0.62 ± 0.03 a | 0.43 ± 0.03 bc | 0.27 ± 0.01 e | |
| 2–butanone–D | C78933 | C4H8O | 72.1 | 566.8 | 1.24553 | 20.44 ± 0.01 b | 14.45 ± 0.07 e | 16.38 ± 0.04 d | 23.23 ± 0.06 a | 12.95 ± 0.07 f | 13.80 ± 0.01 ef | 14.81 ± 0.01 e | |
| 2–ethyl–1–hexanol | C104767 | C8H18O | 130.2 | 1026.9 | 1.26013 | 0.12 ± 0.00 d | 0.13 ± 0.01 d | 0.21 ± 0.00 b | 0.17 ± 0.00 c | 0.20 ± 0.07 b | 0.22 ± 0.00 b | 0.29 ± 0.00 a | |
| Oct–1–en–3–ol–M | C3391864 | C8H16O | 128.2 | 986 | 1.15975 | 3.61 ± 0.01 d | 4.82 ± 0.01 ab | 4.99 ± 0.02 a | 4.12 ± 0.03 c | 3.06 ± 0.10 e | 2.87 ± 0.01 e | 4.09 ± 0.01 c | |
| Oct–1–en–3–ol–D | C3391864 | C8H16O | 128.2 | 979.4 | 1.60406 | 0.09 ± 0.00 de | 0.15 ± 0.01 b | 0.20 ± 0.00 a | 0.15 ± 0.00 b | 0.11 ± 0.01 de | 0.09 ± 0.01 e | 0.14 ± 0.01 bc | |
| n–hexanol–M | C111273 | C6H14O | 102.2 | 861.9 | 1.32497 | 1.22 ± 0.01 bc | 1.20 ± 0.03 c | 1.05 ± 0.00 d | 1.26 ± 0.02 bc | 1.56 ± 0.02 a | 1.28 ± 0.00 b | 0.86 ± 0.01 f | |
| n–hexanol–D | C111273 | C6H14O | 102.2 | 861.9 | 1.6385 | 2.39 ± 0.00 e | 3.18 ± 0.01 cd | 4.80 ± 0.03 a | 4.69 ± 0.00 a | 4.02 ± 0.01 b | 3.29 ± 0.09 c | 2.89 ± 0.03 d | |
| (E)–2–hexen–1–ol–M | C928950 | C6H12O | 100.2 | 846 | 1.18518 | 0.22 ± 0.00 d | 0.10 ± 0.02 g | 0.17 ± 0.00 e | 0.19 ± 0.00 def | 0.50 ± 0.01 a | 0.43 ± 0.01 b | 0.33 ± 0.02 c | |
| (E)–2–hexen–1–ol–D | C928950 | C6H12O | 100.2 | 844 | 1.51752 | 0.04 ± 0.00 d | 0.15 ± 0.00 b | 0.10 ± 0.00 c | 0.10 ± 0.00 c | 0.15 ± 0.04 b | 0.16 ± 0.00 b | 0.40 ± 0.01 a | |
| 3–methylbutan–1–ol | C123513 | C5H12O | 88.1 | 727.3 | 1.48806 | 0.80 ± 0.00 c | 2.22 ± 0.02 a | 0.95 ± 0.01 bc | 1.16 ± 0.00 b | 0.45 ± 0.01 d | 0.19 ± 0.00 e | 0.09 ± 0.00 e | |
| 1–butanol–M | C71363 | C4H10O | 74.1 | 654.3 | 1.1823 | 0.52 ± 0.02 b | 0.38 ± 0.04 c | 0.36 ± 0.04 c | 0.61 ± 0.03 a | 0.36 ± 0.05 c | 0.27 ± 0.02 d | 0.09 ± 0.01 f | |
| 1–butanol–D | C71363 | C4H10O | 74.1 | 653 | 1.37683 | 0.18 ± 0.00 a | 0.12 ± 0.00 c | 0.06 ± 0.01 f | 0.06 ± 0.00 f | 0.10 ± 0.00 de | 0.10 ± 0.00 de | 0.14 ± 0.00 b | |
| Methanethiol | C74931 | CH4S | 48.1 | 441.9 | 1.0483 | 5.77 ± 0.01 ab | 5.97 ± 0.04 a | 5.16 ± 0.07 d | 5.21 ± 0.03 d | 2.41 ± 0.05 g | 2.80 ± 0.00 f | 4.74 ± 0.00 e | |
| 2–furanmethanethiol | C98022 | C5H6OS | 114.2 | 912.8 | 1.11099 | 0.06 ± 0.00 a | 0.05 ± 0.00 ab | 0.03 ± 0.00 c | 0.05 ± 0.00 b | 0.01 ± 0.00 d | 0.01 ± 0.00 d | 0.02 ± 0.00 d | |
| Pentan–1–ol–M | C71410 | C5H12O | 88.1 | 762.4 | 1.25392 | 1.13 ± 0.00 d | 1.26 ± 0.01 c | 1.28 ± 0.00 c | 1.30 ± 0.01 c | 1.96 ± 0.09 a | 1.69 ± 0.04 b | 0.64 ± 0.01 e | |
| Pentan–1–ol–D | C71410 | C5H12O | 88.1 | 764.4 | 1.51286 | 0.54 ± 0.01 f | 1.41 ± 0.01 cd | 2.43 ± 0.02 a | 2.22 ± 0.01 b | 1.46 ± 0.20 c | 1.50 ± 0.01 c | 0.59 ± 0.01 f | |
| Hydrocarbon | Styrene | C100425 | C8H8 | 104.2 | 887.9 | 1.41987 | 0.23 ± 0.00 bc | 0.39 ± 0.01 a | 0.25 ± 0.01 bc | 0.27 ± 0.01 b | 0.10 ± 0.0 d | 0.08 ± 0.00 d | 0.10 ± 0.00 d |
| Toluene | C108883 | C7H8 | 92.1 | 760.5 | 1.01492 | 0.11 ± 0.00 b | 0.19 ± 0.00 c | 0.13 ± 0.01 d | 0.16 ± 0.00 c | 0.27 ± 0.03 a | 0.21 ± 0.01 b | 0.08 ± 0.00 f | |
| Acids | Hexanoic acid | C142621 | C6H12O2 | 116.2 | 994.1 | 1.30503 | 0.69 ± 0.01 b | 0.80 ± 0.00 a | 0.57 ± 0.01 c | 0.42 ± 0.01 d | 0.31 ± 0.01 e | 0.26 ± 0.01 ef | 0.23 ± 0.02 f |
| Furan | 2–pentyl furan | C3777693 | C9H14O | 138.2 | 994.1 | 1.2552 | 0.28 ± 0.01 e | 0.59 ± 0.01 a | 0.55 ± 0.03 ab | 0.44 ± 0.05 c | 0.32 ± 0.03 d | 0.36 ± 0.01 d | 0.53 ± 0.01 b |
| Serial Number | Fatty Acid Composition | A | B–30 | B–60 | B–90 | C–30 | C–60 | C–90 | KA | KB–30 | KB–60 | KB–90 | KC–30 | KC–60 | KC–90 |
|---|---|---|---|---|---|---|---|---|---|---|---|---|---|---|---|
| 1 | C12:0 | 0.46 ± 0.02 d | 0.53 ± 0.03 c | 0.65 ± 0.03 b | 0.59 ± 0.01 c | 0.69 ± 0.02 b | 0.73 ± 0.07 a | 0.66 ± 0.03 b | 1.03 ± 0.07 cd | 1.09 ± 0.06 cd | 1.16 ± 0.04 c | 1.19 ± 0.07 c | 1.18 ± 0.04 c | 1.55 ± 0.06 a | 1.31 ± 0.05 b |
| 2 | C13:0 | 0.04 ± 0.01 b | 0.05 ± 0.01 ab | 0.05 ± 0.01 ab | 0.04 ± 0.01 b | 0.06 ± 0.01 a | 0.06 ± 0.01 a | 0.06 ± 0.02 a | 0.06 ± 0.01 ab | 0.08 ± 0.02 a | 0.07 ± 0.03 a | 0.06 ± 0.02 ab | 0.05 ± 0.02 b | 0.07 ± 0.02 a | 0.05 ± 0.01 b |
| 3 | C14:0 | 1.10 ± 0.02 d | 1.30 ± 0.03 c | 1.43 ± 0.01 b | 1.48 ± 0.02 b | 1.58 ± 0.03 a | 1.65 ± 0.10 a | 1.21 ± 0.03 c | 1.35 ± 0.10 c | 1.52 ± 0.20 a | 1.58 ± 0.23 a | 1.49 ± 0.03 b | 1.45 ± 0.05 ab | 1.65 ± 0.03 a | 1.53 ± 0.03 a |
| 4 | C14:1 | 0.23 ± 0.01 c | 0.26 ± 0.03 bc | 0.31 ± 0.01 b | 0.29 ± 0.01 b | 0.32 ± 0.03 b | 0.36 ± 0.02 a | 0.19 ± 0.03 d | 10.57 ± 0.02 b | 10.61 ± 0.03 b | 10.63 ± 0.05 ab | 10.59 ± 0.02 b | 10.72 ± 0.06 a | 10.65 ± 0.03 ab | 10.79 ± 0.03 a |
| 5 | C15:0 | 0.14 ± 0.03 e | 0.20 ± 0.02 d | 0.28 ± 0.03 c | 0.26 ± 0.04 c | 0.32 ± 0.01 b | 0.35 ± 0.03 a | 0.18 ± 0.03 d | 0.43 ± 0.03 a | 0.39 ± 0.05 b | 0.46 ± 0.06 a | 0.52 ± 0.03 a | 0.38 ± 0.02 b | 0.35 ± 0.03 b | 0.42 ± 0.02 a |
| 6 | C16:0 | 14.26 ± 0.05 c | 15.28 ± 0.12 c | 16.23 ± 0.08 b | 16.05 ± 0.06 b | 16.85 ± 0.09 b | 17.07 ± 0.25 a | 15.00 ± 0.08 c | 13.07 ± 0.25 a | 12.43 ± 0.18 b | 12.84 ± 0.24 b | 13.02 ± 0.07 a | 12.85 ± 0.25 b | 13.25 ± 0.05 a | 12.25 ± 0.06 b |
| 7 | C16:1 | 2.05 ± 0.02 c | 2.65 ± 0.04 b | 3.21 ± 0.05 a | 2.92 ± 0.06 ab | 3.02 ± 0.08 ab | 3.28 ± 0.12 a | 2.43 ± 0.06 b | 13.18 ± 0.12 c | 13.25 ± 0.30 c | 13.31 ± 0.19 bc | 13.63 ± 0.37 b | 13.45 ± 0.04 b | 14.65 ± 0.03 a | 13.24 ± 0.03 b |
| 8 | C17:0 | 1.87 ± 0.02 b | 1.75 ± 0.03 b | 2.11 ± 0.03 a | 2.08 ± 0.06 a | 2.23 ± 0.02 a | 2.39 ± 0.01 a | 1.65 ± 0.03 bc | 1.89 ± 0.01 c | 1.73 ± 0.02 c | 2.02 ± 0.03 b | 2.13 ± 0.05 b | 2.29 ± 0.02 a | 2.25 ± 0.04 a | 2.08 ± 0.01 a |
| 9 | C17:1 | 0.36 ± 0.03 b | 0.42 ± 0.02 a | 0.52 ± 0.02 a | 0.49 ± 0.03 a | 0.59 ± 0.03 a | 0.66 ± 0.09 a | 0.46 ± 0.03 a | 10.66 ± 0.09 b | 10.73 ± 0.04 a | 10.76 ± 0.06 b | 10.82 ± 0.04 a | 10.72 ± 0.03 a | 10.89 ± 0.05 a | 10.66 ± 0.04 b |
| 10 | C18:0 | 16.65 ± 0.04 d | 17.46 ± 0.08 c | 18.5 ± 0.09 bc | 18.89 ± 0.03 b | 19.24 ± 0.12 b | 20.08 ± 1.31 b | 26.85 ± 0.03 a | 23.08 ± 0.31 a | 22.43 ± 0.08 ab | 23.05 ± 0.04 a | 24.38 ± 0.08 a | 18.98 ± 0.05 b | 14.16 ± 0.08 c | 18.48 ± 0.05 b |
| 11 | C18:1 | 14.35 ± 0.02 c | 15.29 ± 0.07 c | 15.59 ± 0.21 c | 16.02 ± 0.03 b | 16.65 ± 0.19 b | 17.29 ± 0.35 b | 24.15 ± 0.06 a | 15.29 ± 0.35 d | 16.02 ± 0.19 cd | 16.34 ± 0.23 c | 16.85 ± 0.76 c | 26.89 ± 0.03 c | 27.52 ± 0.05 b | 28.79 ± 0.04 a |
| 12 | C18:2 | 16.25 ± 0.08 c | 17.62 ± 0.06 b | 18.79 ± 0.09 a | 18.66 ± 0.05 a | 19.58 ± 0.19 a | 20.22 ± 0.36 a | 17.68 ± 0.05 b | 22.22 ± 0.36 d | 23.35 ± 0.04 c | 24.11 ± 0.09 c | 25.36 ± 0.05 b | 25.51 ± 0.05 b | 27.23 ± 0.08 a | 23.21 ± 0.05 c |
| 13 | C20:0 | 0.57 ± 0.01 b | 0.62 ± 0.03 ab | 0.79 ± 0.05 ab | 0.68 ± 0.06 ab | 0.87 ± 0.06 a | 0.84 ± 0.02 a | 0.51 ± 0.01 b | 10.54 ± 0.02 a | 10.38 ± 0.03 ab | 10.42 ± 0.01 a | 10.46 ± 0.03 a | 10.29 ± 0.02 bc | 10.34 ± 0.01 a | 10.19 ± 0.01 c |
| 14 | C20:1 | 0.05 ± 0.01 b | 0.06 ± 0.03 b | 0.07 ± 0.02 a | 0.08 ± 0.05 a | 0.09 ± 0.03 a | 0.08 ± 0.01 a | 0.06 ± 0.01 b | 10.08 ± 0.01 a | 10.10 ± 0.02 a | 10.16 ± 0.03 a | 10.18 ± 0.04 a | 10.17 ± 0.02 a | 10.25 ± 0.01 a | 10.15 ± 0.01 a |
| 15 | C20:2 | 0.63 ± 0.03 b | 0.56 ± 0.03 c | 0.67 ± 0.01 ab | 0.64 ± 0.02 b | 0.70 ± 0.02 b | 0.82 ± 0.03 a | 0.60 ± 0.03 b | 10.62 ± 0.03 a | 10.54 ± 0.01 a | 10.35 ± 0.02 b | 10.47 ± 0.06 ab | 10.53 ± 0.05 a | 10.42 ± 0.02 ab | 10.35 ± 0.01 b |
| 16 | C20:3n6 | 7.65 ± 0.01 c | 8.16 ± 0.08 b | 9.16 ± 0.03 a | 8.85 ± 0.07 ab | 9.05 ± 0.05 b | 9.62 ± 0.17 a | 7.89 ± 0.05 c | 19.82 ± 0.17 a | 10.02 ± 0.03 c | 10.25 ± 0.06 c | 10.17 ± 0.01 c | 11.48 ± 0.05 bc | 12.63 ± 0.12 b | 10.37 ± 0.04 c |
| SFA | 45.09 a | 45.99 b | 44.10 d | 45.07 d | 41.18 d | 43.77 c | 46.12 b | 42.45 c | 44.35 a | 44.09 a | 43.95 c | 43.53 b | 43.36 b | 44.48 a | |
| USFA | 54.91 d | 54.01 b | 55.32 a | 54.93 a | 58.82 a | 56.23 b | 53.88 c | 53.55 c | 55.65 bc | 55.91 b | 56.07 a | 56.47 a | 56.64 b | 55.52 b | |
| MUFAs | 20.01 ab | 18.68 bc | 19.60 b | 19.80 b | 20.67 ab | 21.67 a | 22.21 a | 32.44 c | 34.01 b | 34.87 b | 36.18 a | 35.79 a | 33.53 c | 34.08 b | |
| PUFAs | 34.90 c | 36.33 b | 38.62 b | 40.13 a | 38.15 b | 30.56 d | 31.67 d | 21.11 d | 20.64 d | 21.04 d | 21.89 c | 21.68 c | 22.11 ab | 23.48 a |
Disclaimer/Publisher’s Note: The statements, opinions and data contained in all publications are solely those of the individual author(s) and contributor(s) and not of MDPI and/or the editor(s). MDPI and/or the editor(s) disclaim responsibility for any injury to people or property resulting from any ideas, methods, instructions or products referred to in the content. |
© 2023 by the authors. Licensee MDPI, Basel, Switzerland. This article is an open access article distributed under the terms and conditions of the Creative Commons Attribution (CC BY) license (https://creativecommons.org/licenses/by/4.0/).
Share and Cite
Duan, Y.; Liu, Z.; Deng, D.; Zhang, L.; Yu, Q.; Ma, G.; Ma, X.; Guo, Z.; Chen, C.; He, L. Effects of Salt Soaking Treatment on the Deodorization of Beef Liver and the Flavor Formation of Beef Liver Steak. Foods 2023, 12, 3877. https://doi.org/10.3390/foods12203877
Duan Y, Liu Z, Deng D, Zhang L, Yu Q, Ma G, Ma X, Guo Z, Chen C, He L. Effects of Salt Soaking Treatment on the Deodorization of Beef Liver and the Flavor Formation of Beef Liver Steak. Foods. 2023; 12(20):3877. https://doi.org/10.3390/foods12203877
Chicago/Turabian StyleDuan, Yufeng, Ziqi Liu, Dan Deng, Li Zhang, Qunli Yu, Guoyuan Ma, Xiaotong Ma, Zhaobin Guo, Cheng Chen, and Long He. 2023. "Effects of Salt Soaking Treatment on the Deodorization of Beef Liver and the Flavor Formation of Beef Liver Steak" Foods 12, no. 20: 3877. https://doi.org/10.3390/foods12203877