
Quality and Shelf-Life Evaluation of Fresh Beef Stored in Smart Packaging
Abstract
:1. Introduction
2. Materials and Methods
2.1. Materials
2.2. Stages
2.2.1. Preparation of Intelligent and Active Packaging Indicators
2.2.2. Application of Intelligent and Active Packaging on Fresh Beef
2.3. Observation Parameters
2.3.1. Analysis of Intelligent Packaging Indicator Color Change
2.3.2. Thio Barbituric Acid (TBA) Value
2.3.3. Total Volatile Basic Nitrogen (TVBN) Value
2.3.4. Total Bacterial Count (TBC)
2.3.5. pH
2.4. Data Analysis
3. Results and Discussion
3.1. Intelligent Packaging Indicator Color Change
3.2. Thio Barbituric Acid (TBA) Value
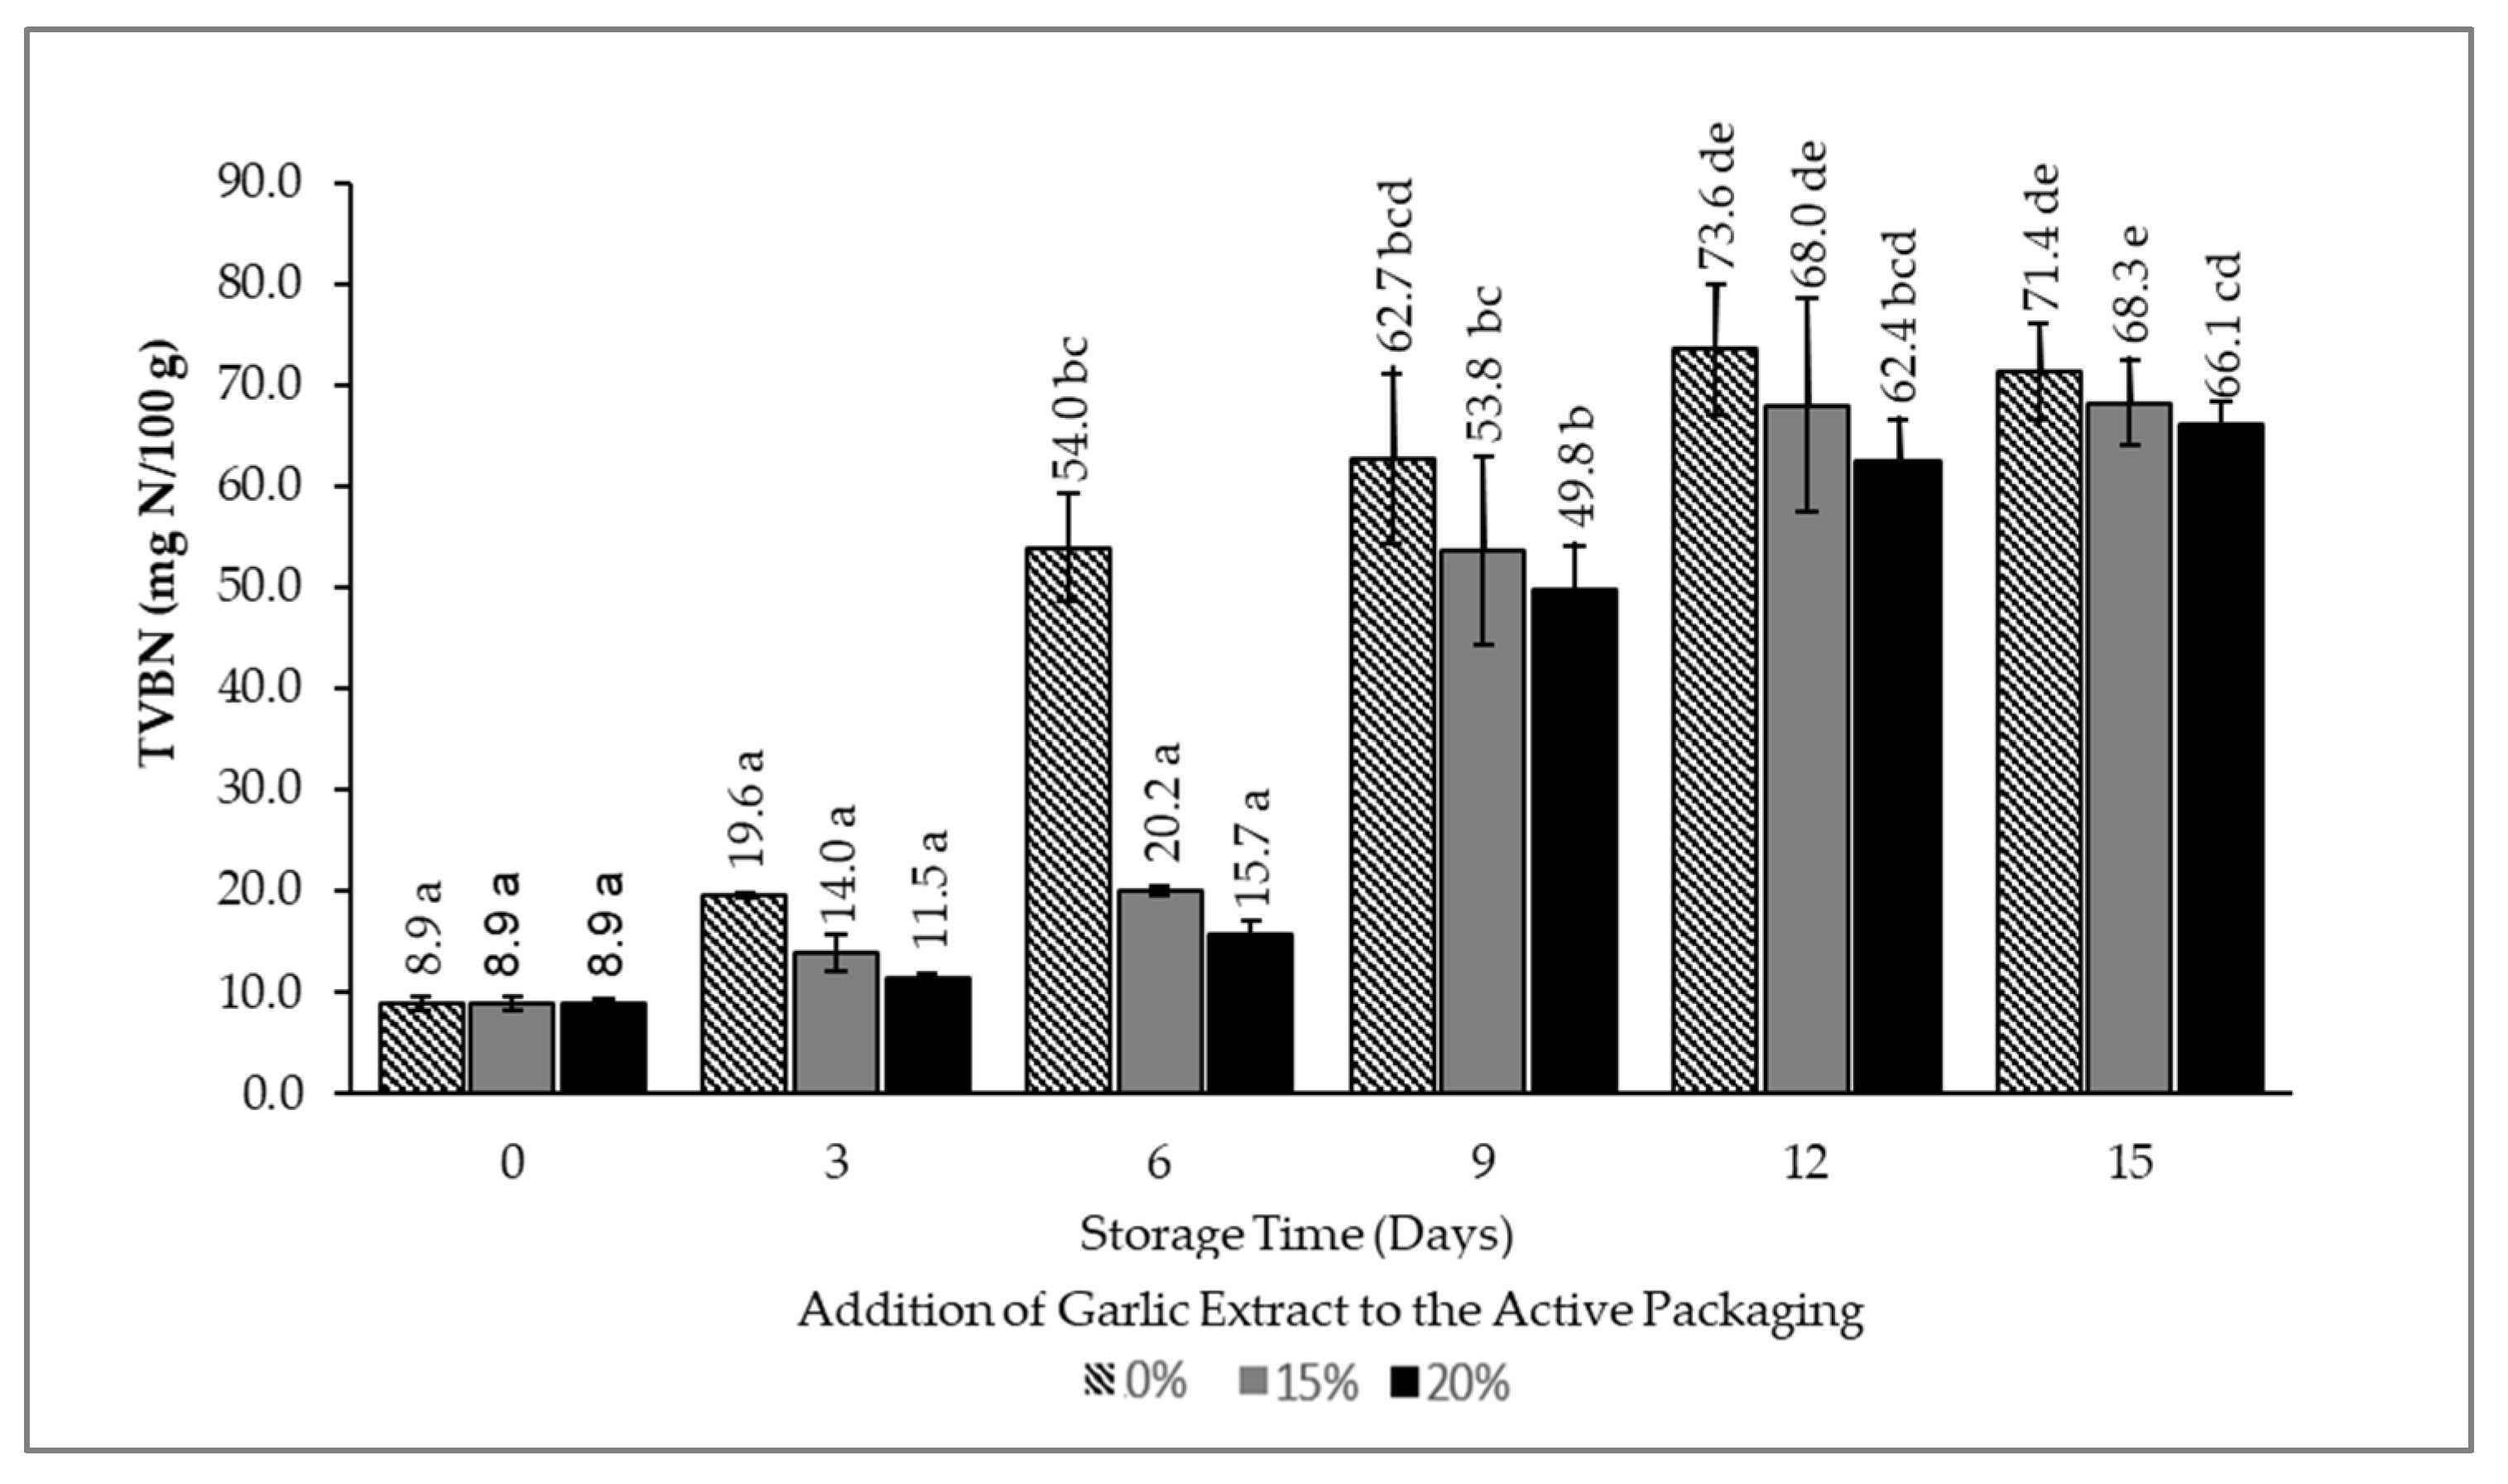
3.3. Total Volatile Basic Nitrogen (TVBN) Value
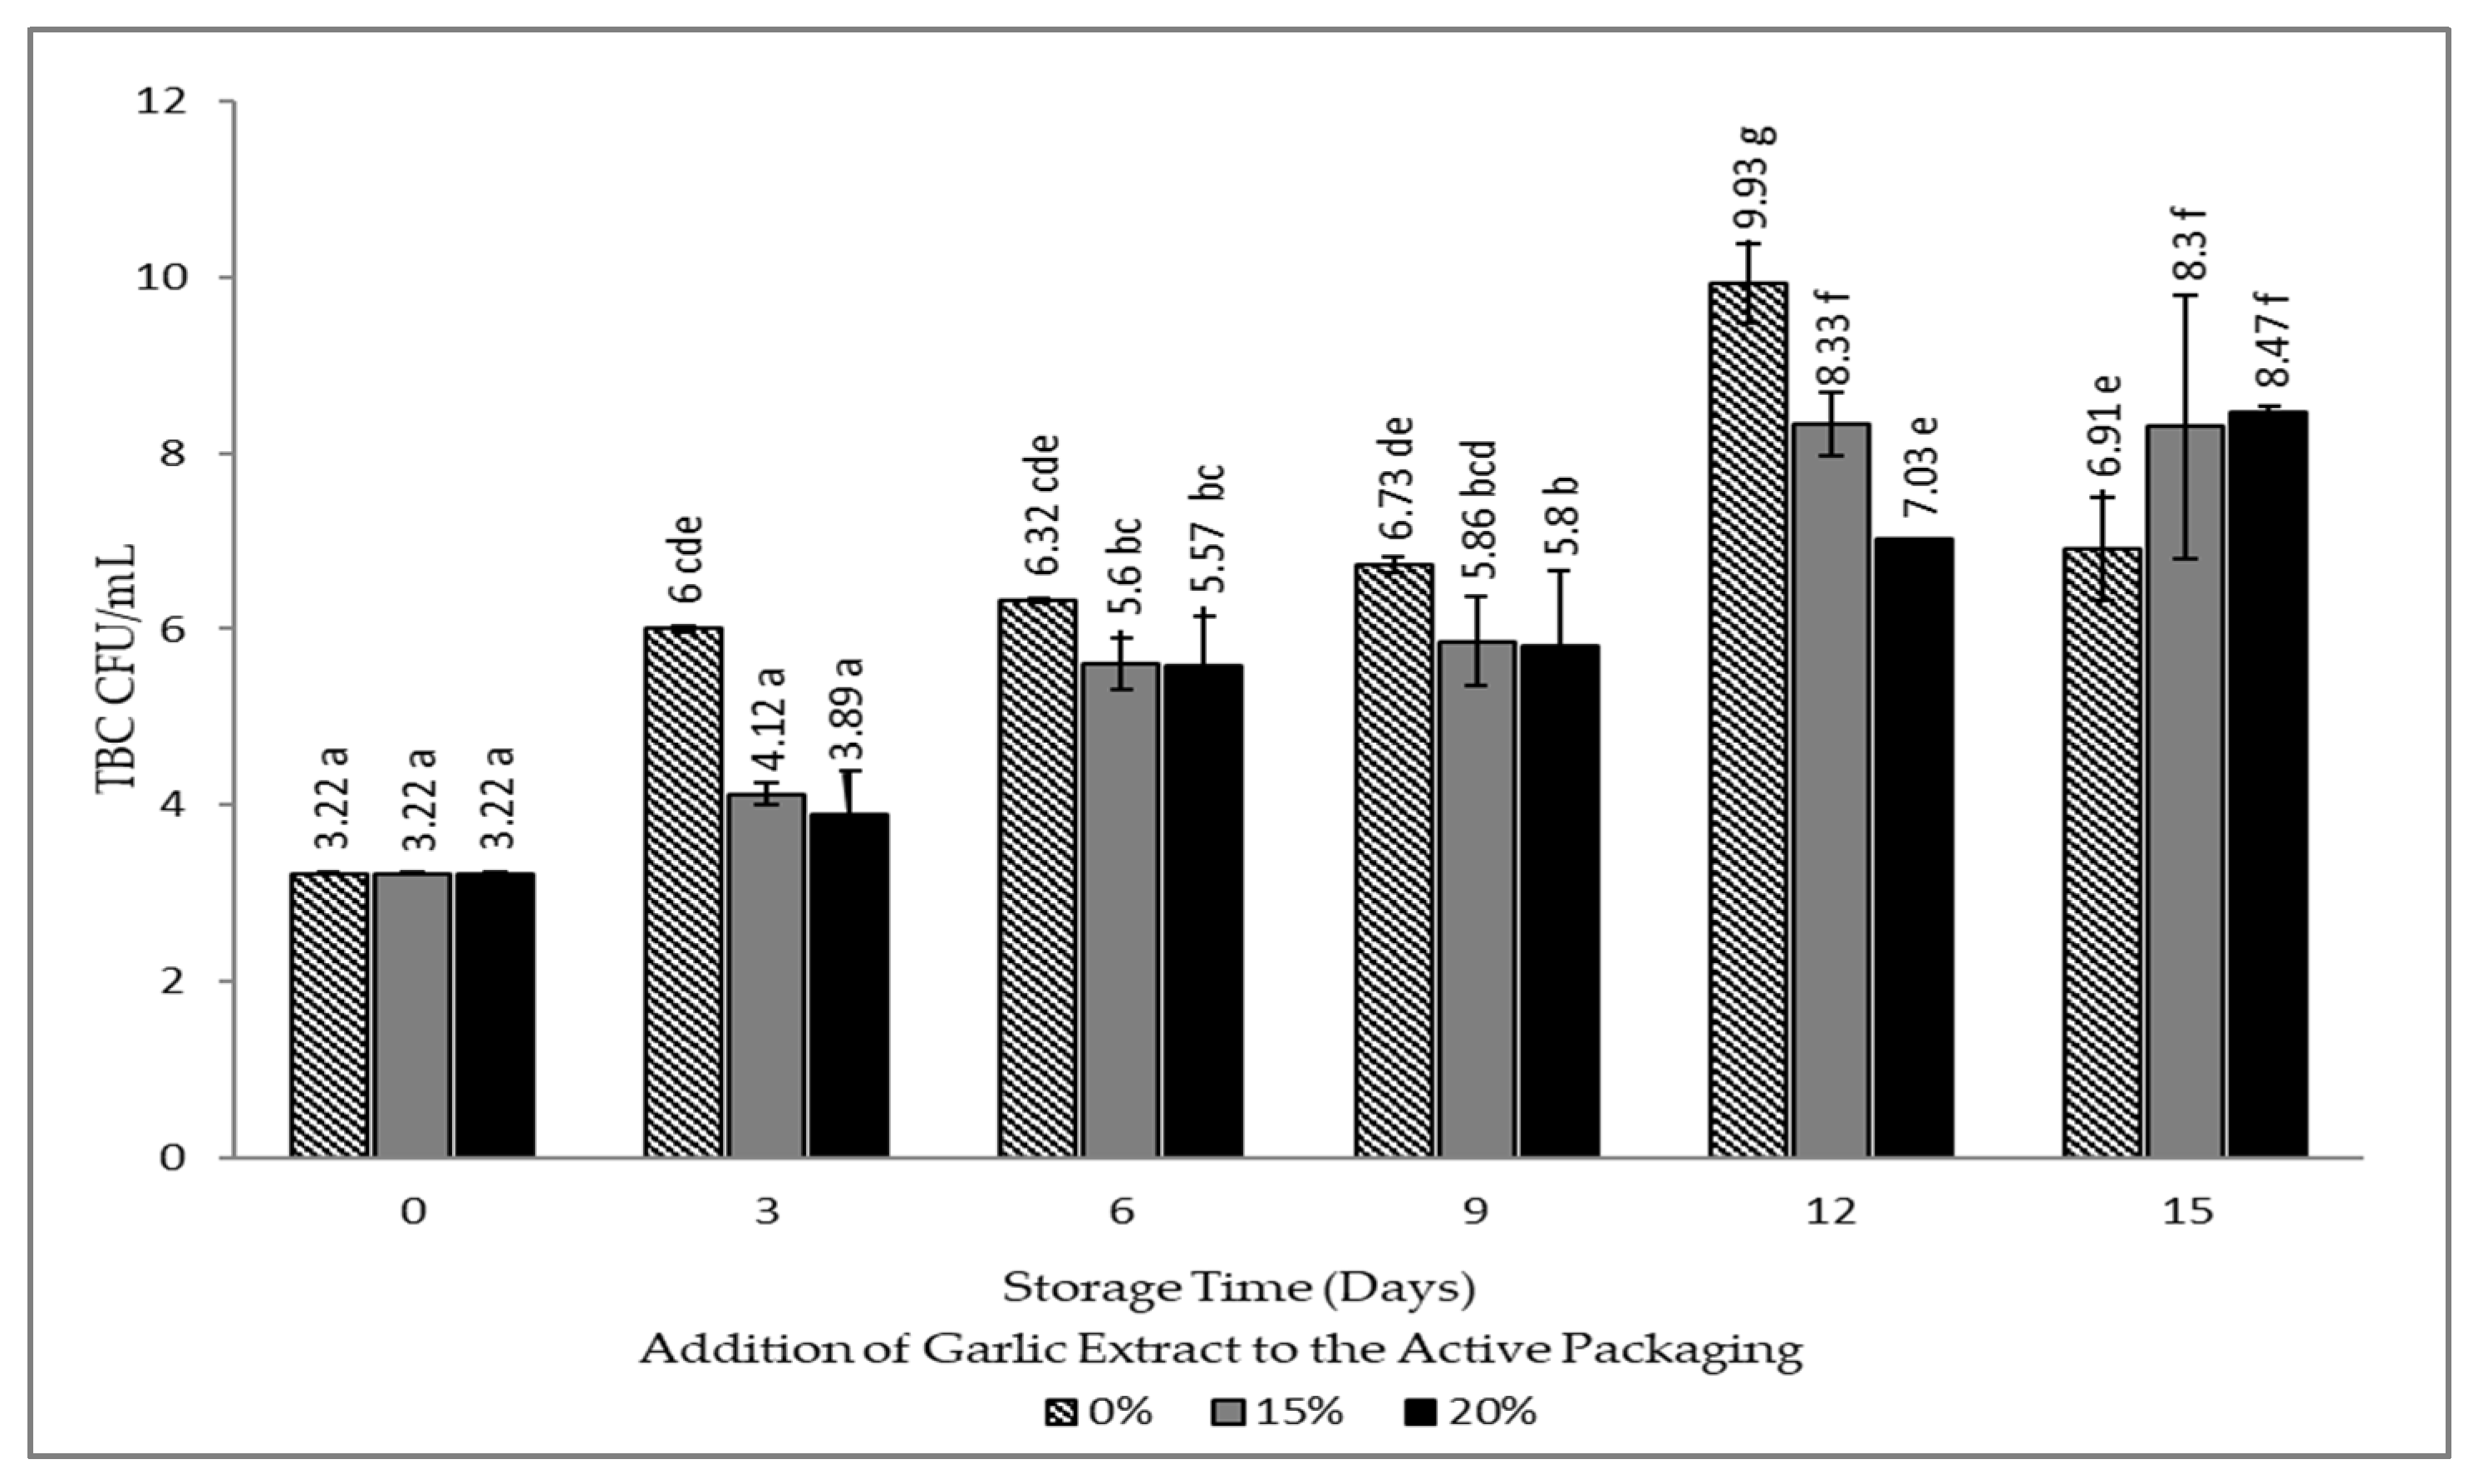
3.4. Total Bacterial Count (TBC) Value
3.5. pH
3.6. Correlation between Indicator Label Sensor Response with Various Parameters of Quality Deterioration in Packaged Fresh Beef
4. Conclusions
Author Contributions
Funding
Institutional Review Board Statement
Informed Consent Statement
Data Availability Statement
Conflicts of Interest
References
- Beltrán, J.A.; Roncalés, P.; Bellés, M. Biochemical Reactions During Fresh Meat Storage. Encycl. Food Chem. 2019, 2, 224–232. [Google Scholar] [CrossRef]
- Iriani, E.S.; Widayanti, S.M.; Miskiyah, M.; Juniawati, J. The Effect of Encapsulated Garlic Extract against Antimicrobial Packaging Characteristics. J. Chem. Package 2014, 36, 1–6. [Google Scholar]
- Abustan, E. Ilmu Daging; Aspek Produksi, Kimia, Biokimia, dan Kualitas; Masagena Press: Makassar, Indonesia, 2012. [Google Scholar]
- Sahoo, G.; Mulla, N.S.S.; Ansari, Z.A.; Mohandass, C. Antibacterial Activity of Mangrove Leaf Extracts against Human Pathogens. Indian J. Pharm. 2012, 74, 348–351. [Google Scholar]
- García, M.R.; Vilas, C.; Herrera, J.R.; Bernárdez, M.; Balsa-Canto, E.; Alonso, A.A. Quality and shelf-life prediction for retail fresh hake (Merluccius merluccius). Int. J. Food Microbiol. 2015, 208, 65–74. [Google Scholar] [CrossRef] [PubMed] [Green Version]
- Zhang, H.; Hortal, M.; Dobon, A.; Bermudez, J.M.; Lara-Lledo, M. The effect of active packaging on minimizing food losses: Life cycle assessment (LCA) of essential oil component-enabled packaging for fresh beef. Packag. Technol. Sci. 2015, 28, 761–774. [Google Scholar] [CrossRef]
- Dobrucka, R.; Cierpiszewski, R. Active and Intelligent Packaging Food–Research and Development–A Review. Polish J. Food Nutr. Sci. 2014, 63, 49–54. [Google Scholar] [CrossRef] [Green Version]
- Pacquit, A.; Crowley, K.; Diamond, D. Smart Packaging Technologies for Fish and Seafood Products. In Smart Packaging Technologies for Fast Moving Consumer Goods; Kerry, J., Ed.; John Wiley & Sons, Ltd.: Hoboken, NJ, USA, 2008; pp. 75–98. ISBN 9780470028025. [Google Scholar]
- Riyanto, R.; Hermana, I.; Wibowo, S. Characteristics of Plastic Indicator for Early Warning Indicator of Fish Freshness in a Plastic Packaging. JPB Perikan. 2014, 9, 153–163. [Google Scholar]
- Hidayat, S.H.; Dirpan, A.; Adiansyah; Djalal, M.; Rahman, A.N.F.; Ainani, A.F. Sensitivity determination of indicator paper as smart packaging elements in monitoring meat freshness in cold temperature. IOP Conf. Ser. Earth Environ. Sci. 2019, 343, 012076. [Google Scholar] [CrossRef]
- Sharma, S.; Barkauskaite, S.; Jaiswal, A.K.; Jaiswal, S. Essential Oils as Additives in Active Food Packaging. Food Chem. 2021, 343, 128403. [Google Scholar] [CrossRef] [PubMed]
- Pajan, S.A. Potensi antibakteri air perasan bawang putih (Allium Sativum L) terhadap pertumbuhan Staphylococcus aureus. Pharmacon 2016, 5, 77–89. [Google Scholar]
- Moulia, M.N. Antimikroba ekstrak bawang putih. J. Pangan 2018, 27, 55–66. [Google Scholar]
- Karuppiah, P.; Rajaram, S. Antibacterial effect of Allium sativum cloves and Zingiber officinale rhizomes against multiple-drug resistant clinical pathogens. Asian Pac. J. Trop. Biomed. 2012, 2, 597–601. [Google Scholar] [CrossRef] [PubMed] [Green Version]
- Rodrigues, E.T.; Han, J.H. Antimicrobial Whey Protein Films against Spoilage and Pathogenic Bacteria. In Book Of Abstract IFT Annual Meeting; Institute of Food Technologist: Chicago, IL, USA, 2000; p. 191. [Google Scholar]
- Sisilia Yolanda, D.; Dirpan, A.; Nur Faidah Rahman, A.; Djalal, M.; Hatul Hidayat, S. The potential combination of smart and active packaging in one packaging system in improving and maintaining the quality of fish. Canrea J. Food Technol. Nutr. Culin. J. 2020, 3, 74–86. [Google Scholar] [CrossRef]
- Hidayat, S.H.; Syarifuddin, A.; Dirpan, A. Analysis of the effectiveness of active paper use by adding garlic extract in inhibiting bacterial growth. IOP Conf. Ser. Earth Environ. Sci. 2020, 575, 012010. [Google Scholar] [CrossRef]
- Yang, H.S.; Lee, E.J.; Moon, S.H.; Paik, H.D.; Nam, K.; Ahn, D.U. Effect of garlic, onion, and their combination on the quality and sensory characteristics of irradiated raw ground beef. Meat Sci. 2011, 89, 202–208. [Google Scholar] [CrossRef] [PubMed]
- Kim, Y.J.; Jin, S.K.; Yang, H.S. Effect of dietary garlic bulb and husk on the physicochemical properties of chicken meat. Poult. Sci. 2009, 88, 398–405. [Google Scholar] [CrossRef]
- Sallam, K.I.; Ishioroshi, M.; Samejima, K. Antioxidant and antimicrobial effects of garlic in chicken sausage. Lwt 2004, 37, 849–855. [Google Scholar] [CrossRef] [Green Version]
- Wiastuti, T.; Khasanah, L.U.; Kawiji, W.A.; Manuhara, G.J.; Utami, R. Characterization of active paper packaging incorporated with ginger pulp oleoresin. IOP Conf. Ser. Mater. Sci. Eng. 2016, 107, 012057. [Google Scholar] [CrossRef] [Green Version]
- Guillard, V.; Gaucel, S.; Fornaciari, C.; Angellier-Coussy, H.; Buche, P.; Gontard, N. The next generation of sustainable food packaging to preserve our environment in a circular economy context. Front. Nutr. 2018, 5, 121. [Google Scholar] [CrossRef] [Green Version]
- Giannoglou, M.; Touli, A.; Platakou, E.; Tsironi, T.; Taoukis, P.S. Predictive modeling and selection of TTI smart labels for monitoring the quality and shelf-life of frozen seafood. Innov. Food Sci. Emerg. Technol. 2014, 26, 294–301. [Google Scholar] [CrossRef]
- Pacquit, A.; Frisby, J.; Diamond, D.; Lau, K.T.; Farrell, A.; Quilty, B.; Diamond, D. Development of a smart packaging for the monitoring of fish spoilage. Food Chem. 2007, 102, 466–470. [Google Scholar] [CrossRef]
- Dirpan, A.; Kamaruddin, I.; Syarifuddin, A.; Zainal; Rahman, A.N.F.; Hafidzah; Latief, R.; Prahesti, K.I. Characteristics of bacterial cellulose derived from two nitrogen sources: Ammonium sulphate and yeast extract as an indicator of smart packaging on fresh meat. IOP Conf. Ser. Earth Environ. Sci. 2019, 355, 012040. [Google Scholar] [CrossRef]
- Dirpan, A.; Latief, R.; Syarifuddin, A.; Rahman, A.N.F.; Putra, R.P.; Hidayat, S.H. The use of colour indicator as a smart packaging system for evaluating mangoes Arummanis (Mangifera indica L. var. Arummanisa) freshness. IOP Conf. Ser. Earth Environ. Sci. 2018, 157, 012031. [Google Scholar] [CrossRef]
- Dirpan, A.; Djalal, M.; Ainani, A.F. A Simple Combination of Active and Intelligent Packaging Based on Garlic Extract and Indicator Solution in Extending and Monitoring the Meat Quality Stored at Cold Temperature. Foods 2022, 11, 1495. [Google Scholar] [CrossRef] [PubMed]
- Kuswandi, B.; Nurfawaidi, A. On-package dual sensors label based on pH indicators for real-time monitoring of beef freshness. Food Control. 2017, 82, 91–100. [Google Scholar] [CrossRef]
- Kuswandi, B.; Maryska, C.; Jayus; Abdullah, A.; Heng, L.Y. Real time on-package freshness indicator for guavas packaging. J. Food Meas. Charact. 2013, 7, 29–39. [Google Scholar] [CrossRef]
- Suyono, E.A.; Nuhamunada, M.; Ramadhani, N. Lipid Content from Monoculture of Micro Algae Chlorella zofingiensis Dönz and mixed culture of Glagah isolate in laboratory scale and raceway pond for biodiesel production. Asian Jr. Microbiol. Biotech. Env. Sc. 2016, 18, 95–100. [Google Scholar]
- Tokur, B.; Korkmaz, K. The effects of an iron-catalyzed oxidation system on lipids and proteins of dark muscle fish. Food Chem. 2007, 104, 754–760. [Google Scholar] [CrossRef]
- De Meyer, T.; Hemelsoet, K.; Van Speybroeck, V.; De Clerck, K. Substituent effects on absorption spectra of pH indicators: An experimental and computational study of sulfonphthaleine dyes. Dye. Pigment. 2014, 102, 241–250. [Google Scholar] [CrossRef] [Green Version]
- Pratama, M.; Warsiki, E.; Haditjaroko, L. Kinerja label untuk memprediksi umur simpan pempek pada berbagai kondisi penyimpanan. J. Teknol. Ind. Pertan. 2016, 26. [Google Scholar]
- Purnamasari, E.; Nurhasni, N.; Zain, W.N.H. Nilai Thiobarbituric Acid (Tba) Dan Kadar Lemak Dendeng Daging Kambing Yang Direndam Dalam Jus Daun Sirih (Piper Betle L.) Pada Konsentrasi Dan Lama Penyimpanan Yang Berbeda. J. Peternak. 2012, 9, 321–332. [Google Scholar]
- Sayadi, M.; Mojaddar Langroodi, A.; Amiri, S.; Radi, M. Effect of nanocomposite alginate-based film incorporated with cumin essential oil and TiO2 nanoparticles on chemical, microbial, and sensory properties of fresh meat/beef. Food Sci. Nutr. 2022, 10, 1401–1413. [Google Scholar] [CrossRef] [PubMed]
- Sumpono; Putri, D.H.; Sri, L.R. Prosiding Seminar Nasional Kimia UNY 2017 Sinergi Penelitian Dan Pembelajaran Untuk Mendukung Pengembangan Literasi Kimia Pada Era Global. In Proceedings of the Prosiding Seminar Nasional Kimia UNY 2017, Yogyakarta, Indonesia, 14 October 2017; pp. 215–228. [Google Scholar]
- Behbahani, B.A.; Imani Fooladi, A.A. Shirazi balangu (Lallemantia royleana) seed mucilage: Chemical composition, molecular weight, biological activity and its evaluation as edible coating on beefs. Int. J. Biol. Macromol. 2018, 114, 882–889. [Google Scholar] [CrossRef] [PubMed]
- Jinadasa, K. Determination of Quality of Marine Fishes Based on Total Volatile Base Nitrogen test (TVB-N). Nat. Sci. 2014, 12, 106–111. [Google Scholar] [CrossRef] [Green Version]
- Castro, P.; Millán, R.; Penedo, J.C.; Sanjuán, E.; Santana, A.; Caballero, M.J. Effect of storage conditions on total volatile base nitrogen determinations in fish muscle extracts. J. Aquat. Food Prod. Technol. 2012, 21, 519–523. [Google Scholar] [CrossRef]
- Alizadeh-Sani, M.; Mohammadian, E.; McClements, D.J. Eco-friendly active packaging consisting of nanostructured biopolymer matrix reinforced with TiO2 and essential oil: Application for preservation of refrigerated meat. Food Chem. 2020, 322, 126782. [Google Scholar] [CrossRef]
- Strika, I.; Bašić, A.; Halilović, N. Antimicrobial effects of garlic (Allium sativum L.). Bull. Chem. Technol. Bosnia Herzeg. 2017, 47, 17–22. [Google Scholar]
- Jo, M. Influence of Food Characteristics and Food Additives on the Antimicrobial Effect of Garlic and Oregano Essential Oils. Foods 2017, 6, 44. [Google Scholar] [CrossRef]
- Boboye, B.; Alli, J. Cellular effects of garlic (Allium sativum) extracts on Pseudomonas aeruginosa and staphylococcus aureus. Res. J. Microbiol. 2008, 3, 508–513. [Google Scholar] [CrossRef] [Green Version]
- Rybak, M.E.; Calvey, E.M.; Harnly, J.M. Quantitative determination of allicin in garlic: Supercritical fluid extraction and standard addition of alliin. J. Agric. Food Chem. 2004, 52, 682–687. [Google Scholar] [CrossRef]
- Ngafifuddin, M.; Sunarno, S.; Susilo, S. Penerapan Rancang Bangun Ph Meter Berbasis Arduino Pada Mesin Pencuci Film Radiografi Sinar-X. J. Sains Dasar 2017, 6, 66–70. [Google Scholar] [CrossRef] [Green Version]
- Lawrie, R. Ilmu Daging; Universitas Indonesia Press: Jakarta, Indonesia, 2003. [Google Scholar]
- Węglarz, A. Meat quality defined based on pH and colour depending on cattle category and slaughter season. Czech J. Anim. Sci. 2010, 55, 548–556. [Google Scholar] [CrossRef] [Green Version]
- Muslim, M. Penggunaan ekstrak bawang putih (Allium sativum) untuk mengobati benih ikan patin siam (Pangasius hypophthalmus) yang diinfeksi bakteri Aeromonas hydrophylla. J. Akuakultur Indones. 2009, 8, 91–100. [Google Scholar] [CrossRef]
- Bhattacharya; Souptik; Sen, D.; Bhattacharjee, C. Inhibition mechanism study for diallyl thiosulfinate (allicin) against crucial bacterial proteins through in silico molecular docking simulation. Process Biochem. 2022, 122, 110–119. [Google Scholar] [CrossRef]
- Deresse, D. Antibacterial effect of garlic (Allium sativum) on Staphylococcu aureus: An in vitro study. Asian J. Med. Sci. 2010, 2, 62–65. [Google Scholar]
- Gabriel, T.; Vestine, A.; Kim, K.D.; Kwon, S.J.; Sivanesan, I.; Chun, S.C. Antibacterial Activity of Nanoparticles of Garlic (Allium sativum) Extract against Different Bacteria Such as Streptococcus mutans and Poryphormonas gingivalis. Appl. Sci. 2022, 12, 3491. [Google Scholar] [CrossRef]
- Kusmajadi, S. Perubahan Nilai pH, TVB dan Total Bakteri Daging Kerbau ( Effect of Storage Length in the Room Temperature on pH, TVB, and Total Bacteria Changes of Buffalo Meat). J. Ilmu Ternak 2012, 12, 9–12. [Google Scholar]


Disclaimer/Publisher’s Note: The statements, opinions and data contained in all publications are solely those of the individual author(s) and contributor(s) and not of MDPI and/or the editor(s). MDPI and/or the editor(s) disclaim responsibility for any injury to people or property resulting from any ideas, methods, instructions or products referred to in the content. |
© 2023 by the authors. Licensee MDPI, Basel, Switzerland. This article is an open access article distributed under the terms and conditions of the Creative Commons Attribution (CC BY) license (https://creativecommons.org/licenses/by/4.0/).
Share and Cite
Dirpan, A.; Hidayat, S.H. Quality and Shelf-Life Evaluation of Fresh Beef Stored in Smart Packaging. Foods 2023, 12, 396. https://doi.org/10.3390/foods12020396
Dirpan A, Hidayat SH. Quality and Shelf-Life Evaluation of Fresh Beef Stored in Smart Packaging. Foods. 2023; 12(2):396. https://doi.org/10.3390/foods12020396
Chicago/Turabian StyleDirpan, Andi, and Serli Hatul Hidayat. 2023. "Quality and Shelf-Life Evaluation of Fresh Beef Stored in Smart Packaging" Foods 12, no. 2: 396. https://doi.org/10.3390/foods12020396