1. Introduction
Frying is one of the oldest and popular processes broadly used to cook foodstuffs directly in the oils and/or fats of appropriate stability at high temperatures (170–200 °C) and long periods of time. The harsh conditions of the process cause the formation of an extraordinarily complex set of hydrolytic and oxidative products, which may be of a wide variety of molecular weights from volatile to heavy polymeric derivatives. These derivatives not only affect the sensory properties of frying oils and foods being fried but also raise potential toxicological concerns with respect to consumers’ health [
1].
Any methods adopted to evaluate the quality of used frying oils should simultaneously consider both sensory and toxicological concerns. The total content of polar compounds (TPC) has commonly been using for decades to toxicologically evaluate used frying oils [
2]. It has frequently been shown that TPC increases linearly during the course of frying processes [
3,
4,
5,
6] and passes over the cut-off value of 24–27% for rejection [
7]. From sensory as well as nutritional points of view, the total carbonyls content known as carbonyl value (CV), including a wide range of secondary oxidation products of crucial importance, has been considered as a valuable measure in the evaluation of used frying oils quality [
8]. A sigmoidal pattern has frequently been observed for the change in CV over the typical time ranges of frying processes, i.e., an initial slow increasing phase followed by a rapid rising phase terminated to a maximum level. Afterwards, CV might show constant or reduced quantities [
8,
9] due essentially to the further degradations of the primary carbonyls to the products of non-carbonyl character and/or higher volatility [
8,
9,
10]. The time required to reach a cut-off CV of 43.5 μmol/g has been reported to be the safety time range of sensory and nutritional interest [
8].
Conjugated diene value (CDV), representing a remarkable part of the primary oxidation products, i.e., lipid hydroperoxides, resulting from the double bond shifts in polyunsaturated fatty acids [
11], has been shown to correlate well with TPC [
4]. On this basis, the time required to reach a cut-off CDV of 29 mmol/L corresponded roughly to a TPC of 24% [
8]. Despite the time-consuming and relatively costive preparations involving some chemical reactions in TPC and CV measurements, CDV is simply determined by only reading the UV absorption of a small amount of an oil sample at 232–234 nm [
12,
13,
14]. From a kinetic standpoint, CDV increases initially and then reaches a plateau over frying, due to a balance between the formation rates of conjugated dienes and their dimers resulting from the Diels-Alder reaction [
14]. This is in line with the kinetic model of total (conjugated and non-conjugated) lipid hydroperoxides accumulation developed recently by the author [
15,
16].
Considering the kinetics of the simultaneous formation of polar compounds, carbonyls, and conjugated dienes in a wide range of frying oil samples, the present study aimed to reconsider the evaluation process of frying oils as well as introduce some kinetic parameters to predict their toxicological and also sensory expirations in a simpler, quicker, and less expensive manner.
2. Materials and Methods
2.1. Materials
A set of eight oil samples, including seven frying oils (A–G) and one non-frying sunflower oil (S), of different compositional properties but passed qualitative and quantitative standards, which were of various vegetable oil sources (individually or as blends), were obtained from seven of big oil factories in Iran. The oil samples were stored at −18 °C until analysis. All of the chemicals and solvents used in the study were of analytical reagent grade and purchased from Merck (Darmstadt, Germany) and Sigma-Aldrich (St. Louis, MO, USA).
2.2. Frying Procedure
Peeled and cut (7.0 × 0.5 × 0.3 cm) potatoes were submerged in water until frying. They (20 g) were fried (170 °C) in the eight oil samples (2.0 L) with no replenishment by an electric bench-top fryer (Kenwood DF280, Hampshire, UK). The potato pieces were fried at 15-min intervals for 8 h a day over six days. At given times, ~10 g of the oils were filtered into a screw-cap vial and immediately stored in the dark at 4 °C until analysis. Frying processes were carried out in duplicate.
2.3. TPC Measurement
The oil sample (500 mg) was made up to 5 mL with toluene. The solution (1 mL) was pipetted to a 5-mL pipette tip of 15 cm in length packed with 1 g of silica gel 60 (63–100 μm) activated at 160 °C. After soaking in, the pipette tip was eluted (~15 min) by 7 mL (2 × 3.5 mL) of isohexane:diisopropyl ether (85:15
v/
v). TPC (%
w/
w) was calculated by Equation (1).
where
w and
w1 are the oil weight and the weight of nonpolar components in mg, respectively [
17].
2.4. CV Determination
Firstly, 2-propanol containing 0.05% (
w/
w) of sodium borohydride was refluxed (1 h) and then distilled to remove any trace of carbonyls. 2,4-Dinitrophenylhydrazine (DNPH, 50 mg) was dissolved in 100 mL of 2-propanol containing 3.5 mL of 37% HCl. Oil samples (0.04–1.0 g) were dissolved in 10 mL of 2-propanol containing triphenylphosphine (0.4 mg mL
−1) to reduce the formation of lipid hydroperoxides. 2,4-Decadienal in 2-propanol (50–500 μM) was used as the standard carbonyl. The standard/oil solutions (1 mL) were mixed with 1 mL of the DNPH solution in a 15-mL test tube. The stoppered test tubes were heated for 20 min at 40 °C. They were cooled in water, and 2% KOH solutions (8 mL) were added. The test tubes were centrifuged at 2000×
g (Heraeus, Biofuge 13, Germany) for 5 min at room temperature. The absorbance of the upper layers was read at 420 nm by using a spectrophotometer (Jenway 6105 UV-VIS, Essex, UK) against a blank containing all the reagents except that the standard carbonyl solution or the oil was replaced by the solvent alone [
18].
2.5. CDV Determination
The oil sample was dissolved in hexane (1:600) and its absorbance was read at 234 nm by using a spectrophotometer (Jenway 6105 UV-VIS, Essex, UK) against HPLC grade hexane as blank. An extinction coefficient of 29,000 mol/L was used to calculate millimoles of conjugated dienes per liter [
19].
2.6. Kinetic Data Analyses
The linear Equation (2) was fitted to the changes in TPC (%
w/
w) over the frying time
t (h).
where
a and
b are y-intercept and the rate of change in TPC (
rTPC, /h), respectively.
The method developed recently by the author was employed to calculate the CV-based kinetic parameters [
20]. Kinetic curves were drawn by plotting the changes in CV (μmol/g) versus time
t (h). The sigmoidal Equation (3) was fitted on the kinetic data points of carbonyls accumulation:
where
a,
b,
c, and
d are the equation parameters. The finite value CV
max, where the rate of carbonyls accumulation reaches zero at infinity, equals
a +
b. At the equation’s turning point with the coordinates
tT =
c and CV
T =
a + 0.5
b, the rate of carbonyls accumulation (μmol/g h) reaches the maximum value
rmax = 0.25
b/
d. Its normalized form (
rmax/CV
max =
rn, /h) is calculated from the ratio
b/4
d(
a +
b). The time at which carbonyls practically approach CV
max (
tmax, h) is obtained from
c + 2
d. The value of
t43.5 (h) is given by Equation (4):
Kinetic curves of the accumulation of conjugated dienes were drawn by plotting the changes in CDV (mmol/L) versus time
t (h). The sigmoidal Equation (5) was fitted on the kinetic data points [
15]:
where
a,
b, and
c are the equation parameters. The finite value CDV
max is calculated from the ratio
a/
b. At the equation’s turning point with the coordinates
tT = (
ac − ln
b)/
a and CDV
T = 0.5
a/
b, the rate of the accumulation of conjugated dienes (mmol/L h) reaches the maximum value
rmax = 0.25
a2/
b. Its normalized form (
rmax/CDV
max =
rn, /h) is given by 0.25
a. The time at which the content of conjugated dienes practically approaches CDV
max (
tmax, h) is obtained from the ratio (2 +
ac − ln
b)/
a.
2.7. Statistical Analysis
All determinations were carried out in triplicate and data were subjected to analysis of variance (ANOVA). ANOVA and regression analyses were performed according to the MStatC and SlideWrite software version 7.0. Significant differences between means were determined by Duncan’s multiple range tests. p values less than 0.05 were considered statistically significant.
3. Results and Discussion
3.1. Kinetics of Change in Polar Compounds
The unfried oil samples contained TPCs of 3.4–11.0% (
Table 1), indicating a wide variation in their initial quality. Fresh and refined vegetable oils have been shown to contain TPCs of 0.4–6.4% [
21], although higher contents up to 14% have also been reported [
22].
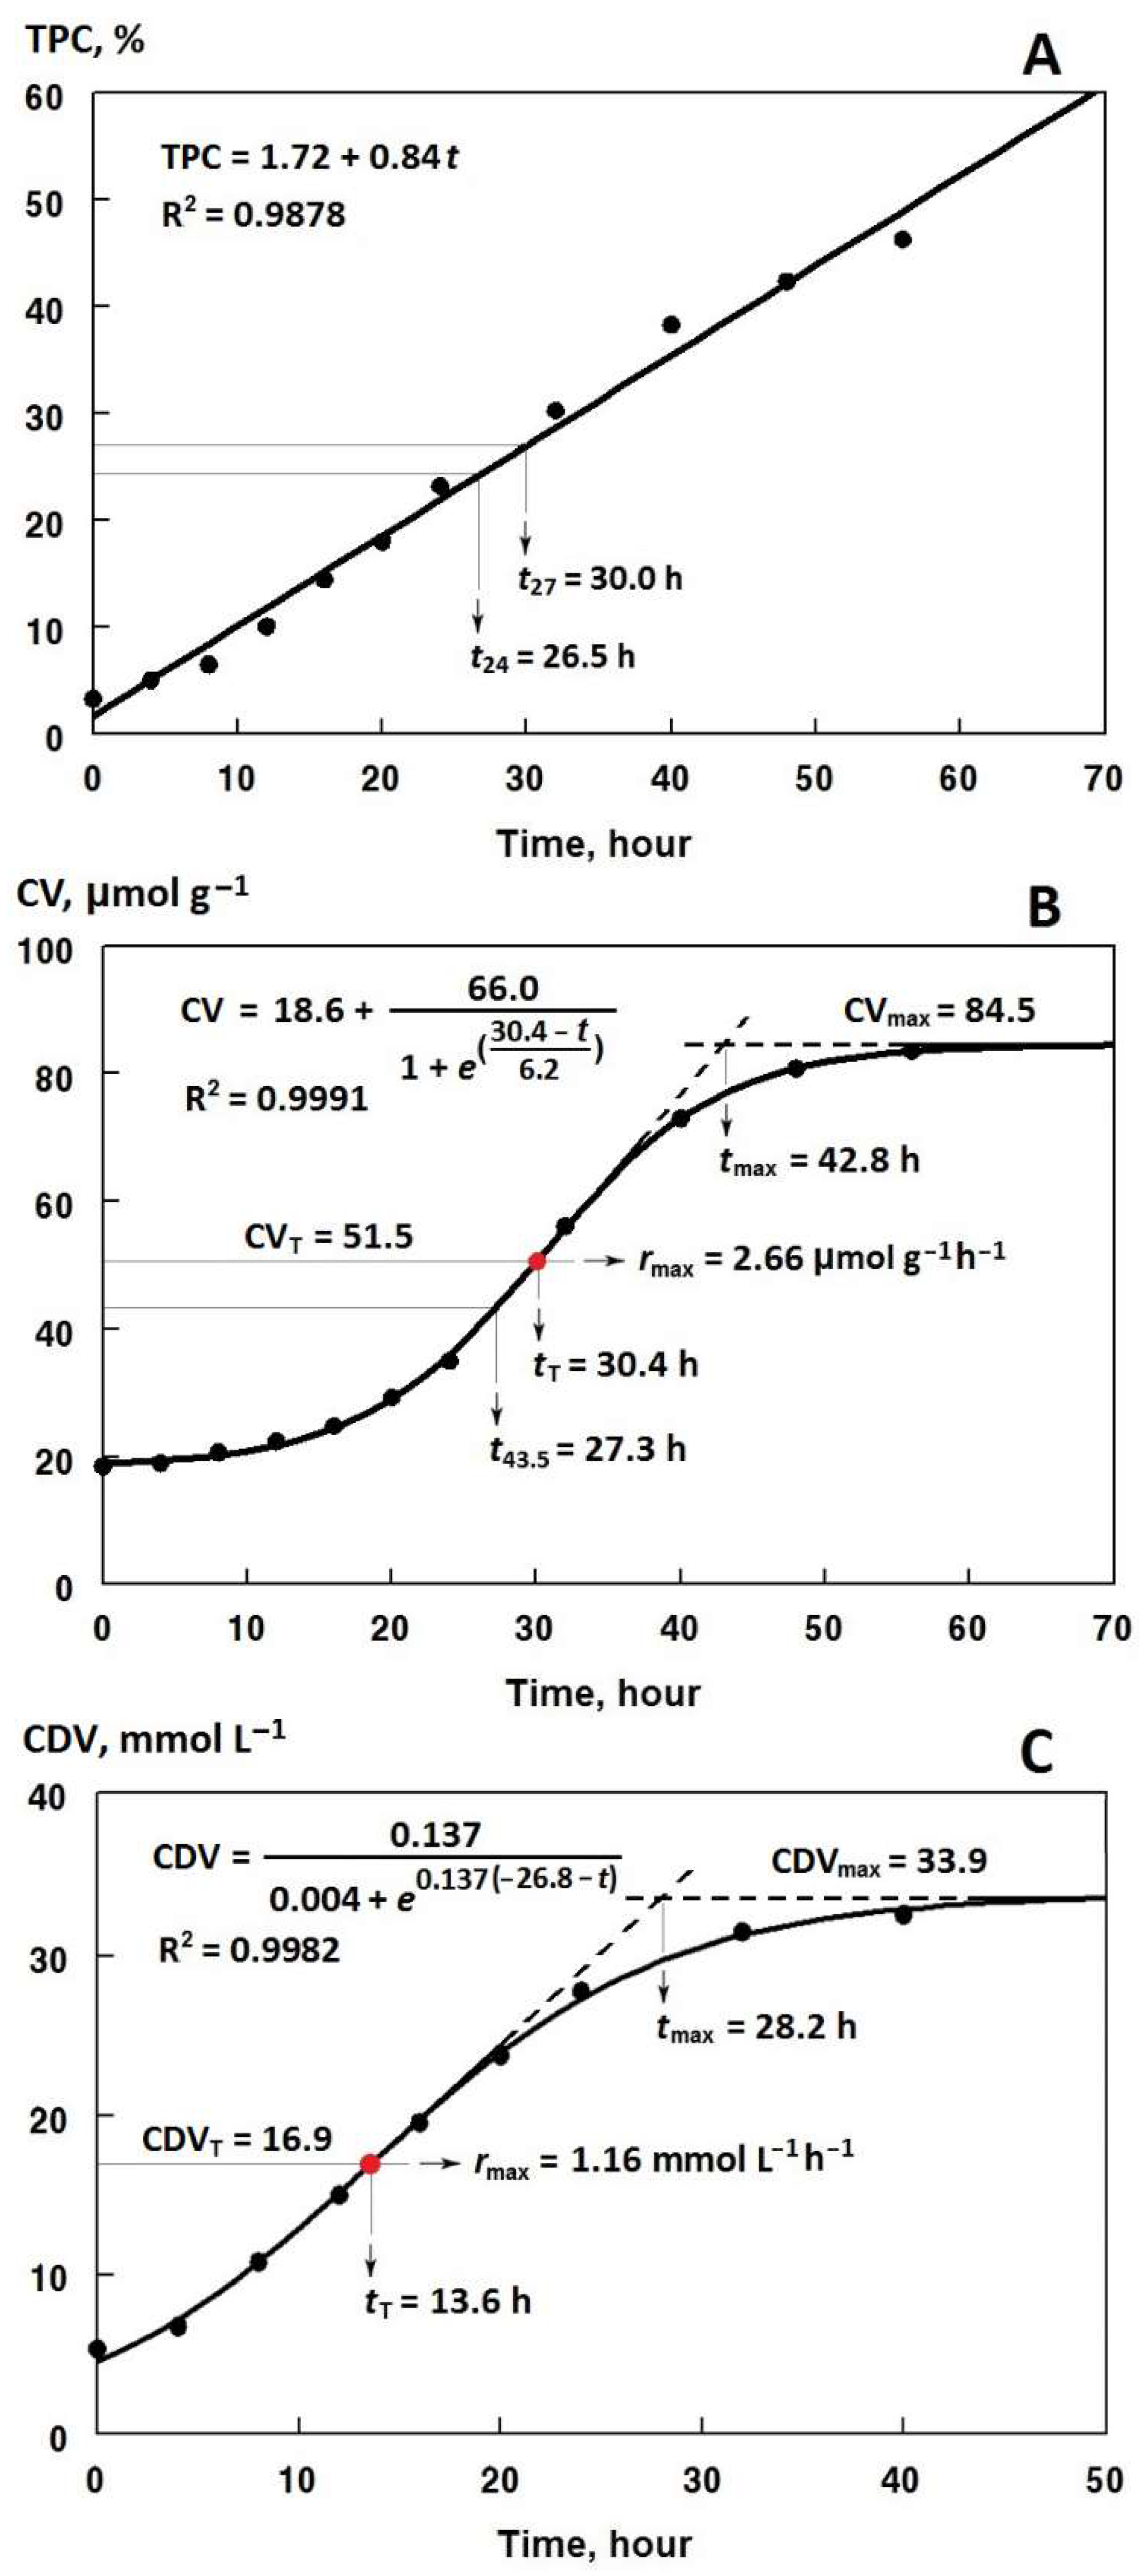
As expected, TPCs increased linearly during the frying process with high coefficients of determination (R
2 > 0.97) (
Figure 1A). As shown in
Table 1, the values of
rTPC as a quantitative measure of the innate potency of an oil in preventing the formation of polar compounds was less than 1 /h for the frying oils A–G (1.63/h for the sunflower oil S). Accordingly, the frying oil B was of the highest toxicological quality, followed by the oils D, F, E, C~A~G, and S. However, a different order of frying performance was obtained when considering the time required to reach the cut-off TPCs of 24% (
t24) or 27% (
t27): B > D > E~A~F > G > C > S. This is due naturally to the different initial quality of the oils with respect to the TPC
0 values shown in
Table 1. In other words, in addition to the innate potency (the
rTPC value), the initial number of polar compounds is of crucial importance in evaluating the overall toxicological quality of a frying oil.
3.2. Kinetics of Change in Carbonyls
Various CVs ranged from 7.8 to 22.8 μmol/g were found in the unfried oil samples (
Table 2). Well-refined oils have been reported to have 0.5–2.0 μmol/g of carbonyls [
23]. The sigmoidal Equation (3) appropriately fitted (R
2 > 0.98) the changes in CVs over the frying time at 170 °C (
Figure 1B).
Table 2 presents the kinetic data characterizing the time change pattern of CV during the frying process of the oil samples.
After attaining the
tmax values of 23.4–54.0 h, CVs reached their maximum values of 44–352 μmol/g (
Table 2). The level of CV
max is governed by a balance between the rate of carbonyls formation, which can be represented by the value of
rmax on average, and the rate of their degradation. These rates are in turn affected by the chemical composition of oxidizing systems as well as some extrinsic factors such as temperature [
20]. Therefore, the
rn values, ranged from 0.0127 to 0.0528 /h, can be employed to show the innate susceptibility of frying oils to their CV variations. On this basis, the oils of higher sensory quality were in the order of D > E > G > A > C ~ B ~ F > S, which was not in the same performance order as the
rTPC value. This order was also not highly consistent with those from the time parameters
tT,
tmax, or
t43.5. As mentioned above, this can be attributed to the different initial qualities of the oils with respect to the CV
0 values (
Table 2).
As for the cut-off CV of 43.5 μmol/g, it is noteworthy to mention that it was lower than all the CV
max levels but higher than the quantities of CV
T in the oils B, C, D, E, and G. Furthermore, the calculated CVs at the TPCs of 24 and 27% exceeded that level in some cases (
Table 2), indicating their undesirable sensory but acceptable toxicological quality. A more detailed analysis of the matter is provided in the following section.
3.3. Kinetics of Change in Conjugated Dienes
The oils were of quite different initial quality with respect to the values of CDV
0 ranged from 2.4 to 17.1 mmol/L (
Table 3). The sigmoidal Equation (5) fitted well (R
2 > 0.97) the changes in the contents of conjugated dienes over the frying time at 170 °C (
Figure 1C).
Table 3 presents the kinetic data characterizing the time change pattern of CDV during the frying process of the oil samples.
Distinct from the plateau-reaching pattern of the CDV during frying [
14], total lipid hydroperoxides have been shown to significantly decompose after a steep rising phase and reaching their maximum concentration [
16]. The decomposition phase is accompanied by the generation of a wide range of secondary oxidation products of dramatic negative impacts on sensory attributes and potential toxicity of the system [
24]. The comparison between the contents of conjugated dienes and total lipid hydroperoxides in monitoring the quality of used frying oils in previous research demonstrated that the onset of the total lipid hydroperoxides decomposition phase corresponded to an average CDV of ~18.4 mmol/L [
4]. Interestingly, as shown in
Table 3, this was in the range of the CDV
T values for the frying oils studied (14.5–22.7 mmol/L) with an average of 19.2 mmol/L, which is about two-thirds of the cut-off CDV of 29 mmol/L corresponded to the TPC of 24% [
8]. Thus, the time parameter
tT can be adopted as a measure of frying stability of the oils: S~D > A~F > B~G ≥ C > E. Such an order is naturally different from that according to the unifying parameter
rn (F > E > C > D > B~G > S~A), which solely addresses the innate potency of the oil samples regardless of their initial quality with respect to the CDV
0 values (
Table 3).
The CV and TPC calculated at the
tT values ranged from 14.0 to 34.8 μmol/g and from 9.1 to 16.2% for the frying oils with the averages of 23.6 μmol/g and 13.5%, respectively (
Table 3). These are much lower than the cut-off CV and TPC values of 43.5 μmol/g and 24–27%, respectively, to discard frying oils. Considering the values of CDV
max (
Table 3), the cut-off CDV of 29 mmol/L is roughly out of the range with an average of 38.4 mmol/L for the frying oils. However, it falls in the range of the CDV calculated at (
tT +
tmax)/2 with an average of 28.1 mmol/L for the frying oils. Moreover, the cut-off CV and TPC values of 43.5 μmol/g and 24–27% fall in the ranges of the CV and TPC values calculated at (
tT +
tmax)/2 with the averages of 41.2 μmol/g and 21.6%, respectively. In accordance, the CDV at
tT (CDV
T) and at (
tT +
tmax)/2 from the sigmoidal Equation (5) can be employed as the sensory and toxicological measures, respectively, to reject frying oils. Plus, the two time parameters
tT and (
tT +
tmax)/2 can practically be used as the corresponding stability times.
4. Conclusions
The present study revealed that the cut-off TPC, CV, or CDV values of 24–27% (~22% in this study), 43.5 μmol/g (~41 μmol/g in this study), or 29 mmol/L (~28 mmol/L in this study), respectively, are almost equivalent measures to reject the used frying oils from a toxicological standpoint. For the sensory rejection of used frying oils, much lower average values of such quantities (about 14%, 24 μmol/g, or 19 mmol/L, respectively) should be considered. Most importantly, the simpler, quicker, and less expensive CDV method provided the CDV at tT (CDVT) and (tT + tmax)/2 of predicting value regarding the sensory and toxicological expirations, respectively, for any individual frying oil. Moreover, some valuable kinetic parameters, especially rn, were adopted to comparatively evaluate the innate potency of frying oils against oxidative deteriorations.
Author Contributions
S.M.R.M. performed the experiments; R.F. designed research, interpreted results, and drafted the manuscript. All authors have read and agreed to the published version of the manuscript.
Funding
The study was financed by Ferdowsi University of Mashhad.
Data Availability Statement
All the necessary data generated and/or analysed during the current study are included in this published article and its additional information, if needed, are available from the corresponding author on reasonable request.
Conflicts of Interest
The authors declare no conflict of interest.
References
- Zhang, Q.; Saleh, A.S.M.; Chen, J.; Shen, Q. Chemical alterations taken place during deep-fat frying based on certain reaction products: A review. Chem. Phys. Lipids 2012, 165, 662–681. [Google Scholar] [CrossRef] [PubMed]
- Pantzaris, T.P. Comparison of monounsaturated and polyunsaturated oils in continuous frying. Grasas Aceites 1998, 49, 319–352. [Google Scholar] [CrossRef]
- Farhoosh, R.; Khodaparast, M.H.H.; Sharif, A.; Rafiee, S.A. Olive oil oxidation: Rejection points in terms of polar, conjugated diene, and carbonyl values. Food Chem. 2012, 131, 1385–1390. [Google Scholar] [CrossRef]
- Farhoosh, R.; Moosavi, S.M.R. Evaluating the performance of peroxide and conjugated diene values in monitoring quality of used frying oils. J. Agric. Sci. Technol. 2009, 11, 173–179. [Google Scholar]
- Habibi-Nodeh, F.; Farhoosh, R.; Sharif, A. Frying stability time of olive oils estimated from the oxidative stability index. J. Food Meas. Charact. 2019, 13, 1831–1838. [Google Scholar] [CrossRef]
- Sharayei, P.; Farhoosh, R. Improved frying stability of canola oil blended with palm olein and virgin olive oils as affected by bene kernel oil and its unsaponifiable matter. Eur. J. Lipid Sci. Technol. 2016, 118, 1495–1506. [Google Scholar] [CrossRef]
- Firestone, D. Worldwide regulation of frying fats and oils. Inform 1993, 4, 1366–1371. [Google Scholar]
- Farhoosh, R.; Moosavi, S.M.R. Carbonyl value in monitoring of the quality of used frying oils. Anal. Chim. Acta 2008, 617, 18–21. [Google Scholar] [CrossRef] [PubMed]
- Damanik, M.; Murkovic, M. Formation of potentially toxic carbonyls during oxidation of triolein in the presence of alimentary antioxidants. Mon. Chem. 2017, 148, 2031–2035. [Google Scholar] [CrossRef] [PubMed] [Green Version]
- Frankel, E.N. Hydroperoxide Decomposition, Lipid Oxidation; Woodhead Publishing Limited: Cambridge, UK, 2012; pp. 67–98. [Google Scholar] [CrossRef]
- Houhoula, D.P.; Oreopoulou, V.; Tzia, C. A kinetic study of oil deterioration during frying and a comparison with heating. J. Am. Oil Chem. Soc. 2002, 79, 133–137. [Google Scholar] [CrossRef]
- Maskan, M.; Bağcı, H.I. The recovery of used sunflower seed oil utilized in repeated deep-fat frying process. Eur. Food Res. Technol. 2003, 218, 26–31. [Google Scholar] [CrossRef]
- Melton, S.L.; Jafar, S.; Sykes, D.; Trigiano, M.K. Review of stability measurements for frying oils and fried food flavor. J. Am. Oil Chem. Soc. 1994, 71, 1301–1308. [Google Scholar] [CrossRef]
- White, P.J. Methods for measuring changes in deep-fat frying oils. Food Technol. 1991, 45, 75–80. [Google Scholar]
- Farhoosh, R. Reliable determination of the induction period and critical reverse micelle concentration of lipid hydroperoxides exploiting a model composed of pseudo-first and -second order reaction kinetics. LWT Food Sci. Technol. 2018, 98, 406–410. [Google Scholar] [CrossRef]
- Farhoosh, R. A reconsidered approach providing kinetic parameters and rate constants to analyze the oxidative stability of bulk lipid systems. Food Chem. 2020, 327, 127088. [Google Scholar] [CrossRef] [PubMed]
- Schulte, E. Economical micromethod for determination of polar components in frying fats. Eur. J. Lipid Sci. Technol. 2004, 106, 772–776. [Google Scholar] [CrossRef]
- Endo, Y.; Li, C.M.; Tagiri-Endo, M.; Fujimoto, K. A modified method for the estimation of total carbonyl compounds in heated and frying oils using 2-propanol as a solvent. J. Am. Oil Chem. Soc. 2001, 78, 1021–1024. [Google Scholar] [CrossRef]
- Saguy, I.; Shani, A.; Weinberg, P.; Garti, N. Utilization of Jojoba Oil for Deep-fat Frying of Foods. LWT 1996, 29, 573–577. [Google Scholar] [CrossRef]
- Farhoosh, R. Quantitative criteria characterizing the time change pattern of total lipid-peroxidation carbonyls. Sci. Rep. 2022, 12, 22345. [Google Scholar] [CrossRef] [PubMed]
- Lumley, I.D. Polar Compounds in Heated Oils, Frying of Food: Principles, Changes, New Approaches; Ellis Horwood Ltd: Chichester, UK, 1988; pp. 166–173. [Google Scholar]
- Ruiz-Méndez, M.V.; Marquez-Ruiz, G.; Dobarganes, M. Relationships between quality of crude and refined edible oils based on quantitation of minor glyceridic compounds. Food Chem. 1997, 60, 549–554. [Google Scholar] [CrossRef]
- White, P.J. Methods to Assess Quality and Stability of Oils and Fat-Containing Foods; AOCS Press: Champaign, IL, USA, 1995; p. 158. [Google Scholar]
- Yanishlieva, N.; Marinova, E. Kinetic Evaluation of the Antioxidant Activity in Lipid Oxidation, Lipid Oxidation Pathways; AOCS Press: Champaign, IL, USA, 2003. [Google Scholar] [CrossRef]
| Disclaimer/Publisher’s Note: The statements, opinions and data contained in all publications are solely those of the individual author(s) and contributor(s) and not of MDPI and/or the editor(s). MDPI and/or the editor(s) disclaim responsibility for any injury to people or property resulting from any ideas, methods, instructions or products referred to in the content. |
© 2023 by the authors. Licensee MDPI, Basel, Switzerland. This article is an open access article distributed under the terms and conditions of the Creative Commons Attribution (CC BY) license (https://creativecommons.org/licenses/by/4.0/).


