Article

Detection of Red Pepper Powder Adulteration with Allura Red and Red Pepper Seeds Using Hyperspectral Imaging

1
Food Safety and Distribution Research Group, Korea Food Research Institute, Wanju-gun 55365, Republic of Korea
2
Smart Food Manufacturing Project Group, Korea Food Research Institute, Wanju-gun 55365, Republic of Korea
*
Author to whom correspondence should be addressed.
Foods 2023, 12(18), 3471; https://doi.org/10.3390/foods12183471
Submission received: 14 August 2023 / Revised: 14 September 2023 / Accepted: 15 September 2023 / Published: 18 September 2023

Abstract

:
This study used shortwave infrared (SWIR) technology to determine whether red pepper powder was artificially adulterated with Allura Red and red pepper seeds. First, the ratio of red pepper pericarp to seed was adjusted to 100:0 (P100), 75:25 (P75), 50:50 (P50), 25:75 (P25), or 0:100 (P0), and Allura Red was added to the red pepper pericarp/seed mixture at 0.05% (A), 0.1% (B), and 0.15% (C). The results of principal component analysis (PCA) using the L, a, and b values; hue angle; and chroma showed that the pure pericarp powder (P100) was not easily distinguished from some adulterated samples (P50A-C, P75A-C, and P100B,C). Adulterated red pepper powder was detected by applying machine learning techniques, including linear discriminant analysis (LDA), linear support vector machine (LSVM), and k-nearest neighbor (KNN), based on spectra obtained from SWIR (1,000–1,700 nm). Linear discriminant analysis determined adulteration with 100% accuracy when the samples were divided into four categories (acceptable, adulterated by Allura Red, adulterated by seeds, and adulterated by seeds and Allura Red). The application of SWIR technology and machine learning detects adulteration with Allura Red and seeds in red pepper powder.

1. Introduction

Red pepper (Capsicum annum) is extensively used as a spice in various cuisines and is commonly consumed as a powder. The government prohibits the addition of any substance to red pepper powder other than the red pepper seeds that it originally contains [1]. However, some individuals in the food supply chain intentionally add inexpensive materials, such as bran and saw dust, into red pepper powder to maximize their profits [2,3].
This study focused on red pepper seeds and Allura Red colorant as adulterants. Red pepper seeds are generally separated from red pepper to produce high-quality red pepper powder. Some traders add seeds that were not part of the original red pepper to increase the quantity of the product. Red colorants are added to mask the adulteration since the addition of seeds can reduce the red color of the red pepper powder [4,5]. Allura Red is a synthetic azo dye that is widely used in various food products and is also used in the adulteration of red pepper powder. The detection of Allura Red is necessary for consumer safety because it is absorbed into the gastrointestinal tract, enters the bloodstream, and interacts with proteins during transport and metabolism to cause disease [6].
Several analytical techniques (including high-performance liquid chromatography, capillary electrophoresis, and fluorescence spectroscopy) were used to determine the illegal addition of adulterants. However, these conventional destructive methods require skilled analysts and are time consuming since they require several procedures, such as sample extraction, pretreatment, and data analysis [6,7]. Therefore, nondestructive techniques are increasingly being adopted for onsite detection in the food supply chain, owing to their feasibility, cost effectiveness, and ease of operation [8].
Various imaging and spectroscopy techniques, such as RGB imaging and near-infrared (NIR) spectroscopy, were applied to evaluate food quality and safety. RGB imaging provides spatial information, and NIR spectroscopy provides spectral and multi-constituent information [9]. Meanwhile, hyperspectral imaging (HSI) employs a combination of conventional imaging and spectroscopy and can extract spatial-, spectral-, and multi-constituent information by detecting spectral changes in broadband light after interaction with a sample. Additionally, HSI shows sensitivity to minor components [9,10]. Therefore, HSI was recently used to detect wheat bran, rice bran, corn flour, and rosin powder in Sichuan peppers [11]. In addition, it was used to identify red pepper powder contaminated by Sudan dye [5].
A hypercube gathers three-dimensional blocks of data consisting of two spatial dimensions and one spectral dimension by the HSI system [12]. It consists of relevant and nonspecific background information; thus, extraction of useful information from high-dimensional hyperspectral data is essential to apply HSI techniques to the food industry [13]. Machine learning is regarded as an efficient tool to analyze complex datasets owing to its self-learning and adaptive capabilities and its strong fault tolerance [14]. Therefore, HSI combined with machine learning is widely utilized for quality evaluation of agricultural products [15], detection of specific adulterants [16], and quantification of food components [17].
Nevertheless, no studies have focused on the simultaneous detection of Allura Red and red pepper seeds in red pepper powder using HSI and machine learning. Therefore, this study aimed to establish a machine learning classification model that can identify red pepper powder contaminated with Allura Red and seed adulteration based on HSI spectra.

2. Materials and Methods

2.1. Materials

Red pepper pericarp powder (without seeds) and seeds were purchased from Red Pepper Mill Cheong-ju Shop (Seoul, Republic of Korea) and Danong Food (Dangjin-si, Republic of Korea). The ground samples were sieved through 20- and 50-mesh sieves. The powder that passed through a 20-mesh sieve, but was trapped on a 50-mesh sieve (average 35 mesh) was used for the experiment. Allura Red (FD&C Red No 40 powder; Sensient Colors LLC, St. Louis, MO, USA) was used as the coloring agent.

2.2. Sample Preparation

The pericarp and seed of red pepper were blended in different weight ratios (pericarp: seed = 100:0, 75:25, 50:50, 25:75, and 0:100) for the samples adulterated without the dye. The red pepper pericarp, seed, and mixture of red pepper pericarp/seed (5 g) were mixed with 10 mL of aqueous Allura Red solution (0.025% w/v, 0.05% w/v, and 0.075% w/v) for the dye-adulterated samples. The mixture was homogenized using a blender for 1 min and dried at 60 °C for 24 h. The composition of each group is presented in Table 1. The prepared sample (5 g) was placed in a petri dish (50 × 15 mm, SPL Life Sciences Co., Ltd., Pocheon-si, Republic of Korea) and flattened with a presser before the experiments (approximately 0.5 cm sample height). In this way, 30 samples were prepared for each group. The samples were weighed with an accuracy of within 1% deviation from the intended weight.

2.3. Color Measurement

The L*, a*, and b* values were obtained using a spectrophotometer (CM-700d; Konica Minolta Optics Inc., Tokyo, Japan), and the measurements were repeated 10 times. The hue angle and chroma were calculated as follows:
H u e   a n g l e = t a n 1 b * a *
C h r o m a = ( a * ) 2 + ( b * ) 2
Tukey’s test (p < 0.05) was performed for statistical analysis using SPSS Statistics 20 (SPSS Inc., Chicago, IL, USA).

2.4. Determination of Capsaicin and Dihydrocapsaicin Content

The capsaicin and dihydrocapsaicin content were determined using the method of Kim et al. [18], with some modifications. The sample (2 g) was mixed with 80 mL of 100% ethanol and extracted at 85 °C for 3 h using a reflux extractor (FTCOD-6; Chang Shin Science, Changwon, Republic of Korea). The extract was filtered through filter paper (No. 1, Whatman Co., Maidstone, UK) and then adjusted to 100 mL in a 100 mL volumetric flask. The solution was filtered using a 0.2 μm syringe filter (D2520; Echrome Science, Daegu, Republic of Korea), and the filtrate was used for analysis.
The capsaicin and dihydrocapsaicin content were determined using an ultra-high-performance liquid chromatography system, with a fluorescence detector (LaChromUltra L-2000U Series; Hitachi High-Technologies Corp., Tokyo, Japan) consisting of LaChrom Ultra C18 (2 µm, 2 mm I.D x 50 mm) (Ex = 280, Em = 325 nm). Chromatographic separation was performed using isocratic elution, with a mobile phase consisting of 1% acetic acid and acetonitrile (60:40 v/v). The flow rate, injection volume, acquisition time, and column temperature were 0.6 mL/min, 2 µL, 6 min, and 25 °C, respectively. The experiments were conducted in triplicate, and the results were expressed as mg/kg.

2.5. Data Collection

A hyperspectral system was custom designed and comprised a SWIR camera (PA320F300TCL, OZRAY, Gwangmyeong, Republic of Korea), spectrograph (N17E, Specim, Oulu, Finland), vision dome light (VTDL550*240, Vision Technology, Cheonan-si, Republic of Korea) with six halogen lamps (150W power), and sample linear stage (FBL80E1400, FUYU, Chengdu, China). An optical module (shortwave infrared (SWIR) camera, spectrograph, and vision dome light) of the SWIR system was fixed 460 mm above the sample, and SWIR spectral images (hypercube) were acquired by line-scan mode, while moving constant velocity motion by 275 mm/s using a sample linear stage.
The SWIR spectral images were recorded from 900 to 1700 nm, and the reflectance intensities of images was measured at averaged 3.45 nm intervals. The resolution of the SWIR spectral image was 320 (w) × 256 pixels (l), and the spectral band had 256 channels. However, the first 20 bands and the last 16 bands were deleted to remove noisy signals; thus, 220 spectral bands were used for analysis.
The frame rate was 260 fps, and the exposure time was 3.8 ms/line during spectrum acquisition. Thirty hypercube datasets were collected for each group. Region of interest (ROI) spectral extraction was performed using the principal component analysis (PCA)-based ROI function in Prediktera Breeze software (Prediktera AB, Umea, Sweden). The mean spectra of each sample were used for data analysis.

2.6. Data Analysis for Classification

The 600 images were randomly divided into training (70%, 21 samples from each group, 420 samples in total) for principal component analysis (PCA) using Evince software (Prediktera AB, Umea, Sweden).
Machine learning classification was performed using the classification learner in MATLAB R2022b software (MathWorks, Inc., Natick, MA, USA). The training of machine learning implemented k-fold cross-validation to enhance the reliability of the result. The k-fold cross-validation involved randomly dividing the entire dataset into k-subsets of equal sizes. One of these k-subsets for each iteration served as the validation data, while the remaining subsets were employed for training purposes [19]. A total of 420 samples (70% of the dataset) was allocated for training, while the remaining 30% (180 samples) was reserved as the test set. Additionally, a fivefold cross-validation was employed.
The feature selection algorithm (minimum redundancy maximal relevance (MRMR)) was performed in MATLAB R2022b software. The wavelength bands with high importance scores were identified by MRMR, followed by construction of the optimal subset for each machine learning classifier by wavelength selection. Three machine learning classifiers were used: linear discriminant analysis (LDA), linear support vector machine (LSVM), and k-nearest neighbor (KNN). True-positive (TP), true-negative (TN), false-positive (FP), and false-negative (FN) rates were used to calculate the model performance indicators (accuracy, recall, specificity, precision, and F1-score) with the following equations:
A c c u r a c y = T P + T N T P + T N + F P + F N × 100
R e c a l l = T P T P + F N × 100
P r e c i s i o n = T P T P + F P × 100
F 1 s c o r e = 2 × R e c a l l × P r e c i s i o n R e c a l l + P r e c i s i o n × 100

3. Results

3.1. Color Values of Red Pepper Powder in Relation to Different Pericarp and Seed Ratios and Allura Red Concentrations

The color values of red pepper powder in relation to the pericarp/seed ratio and Allura Red concentration are shown in Table 2. The L* values of samples containing only seed (P0) and a pericarp/seed mixture (P25, P50, and P75) decreased with increasing Allura Red concentrations, whereas those of pure pericarp powder (P100) increased after the addition of Allura Red. The a* value increased with increasing Allura Red concentrations. However, the magnitude of the increase in the a* value decreased as the pericarp ratio increased. The addition of Allura Red increased the b* values of P75 and P100, the hue angle of P100, and the chroma values of P25, P50, P75, and P100. However, the addition of Allura Red decreased the b* values of P0 and P25; the hue angles of P0, P25, and P50; and the chroma of P0.
PCA was performed using the L*, a*, b*, hue angle, and chroma values. Color is considered the most crucial quality parameter of red pepper powder [20]. However, PCA showed that it was difficult to distinguish some groups (P50A-C, P75, P75A-C, and P100B-C) from P100 using color values as an indicator (Figure 1). This result highlights the limitations of relying solely on color values for onsite detection to assess food quality in the food supply chain. One significant challenge is the difficulty in distinguishing adulterated products when the addition of colorants results in color values similar to those of authentic products. From this perspective, HSI, especially SWIR-based HSI, is a useful alternative to overcome the above limitations since it provides detailed information about several compounds in food [21]. Therefore, this study used SWIR technology to identify adulterated red pepper powder.

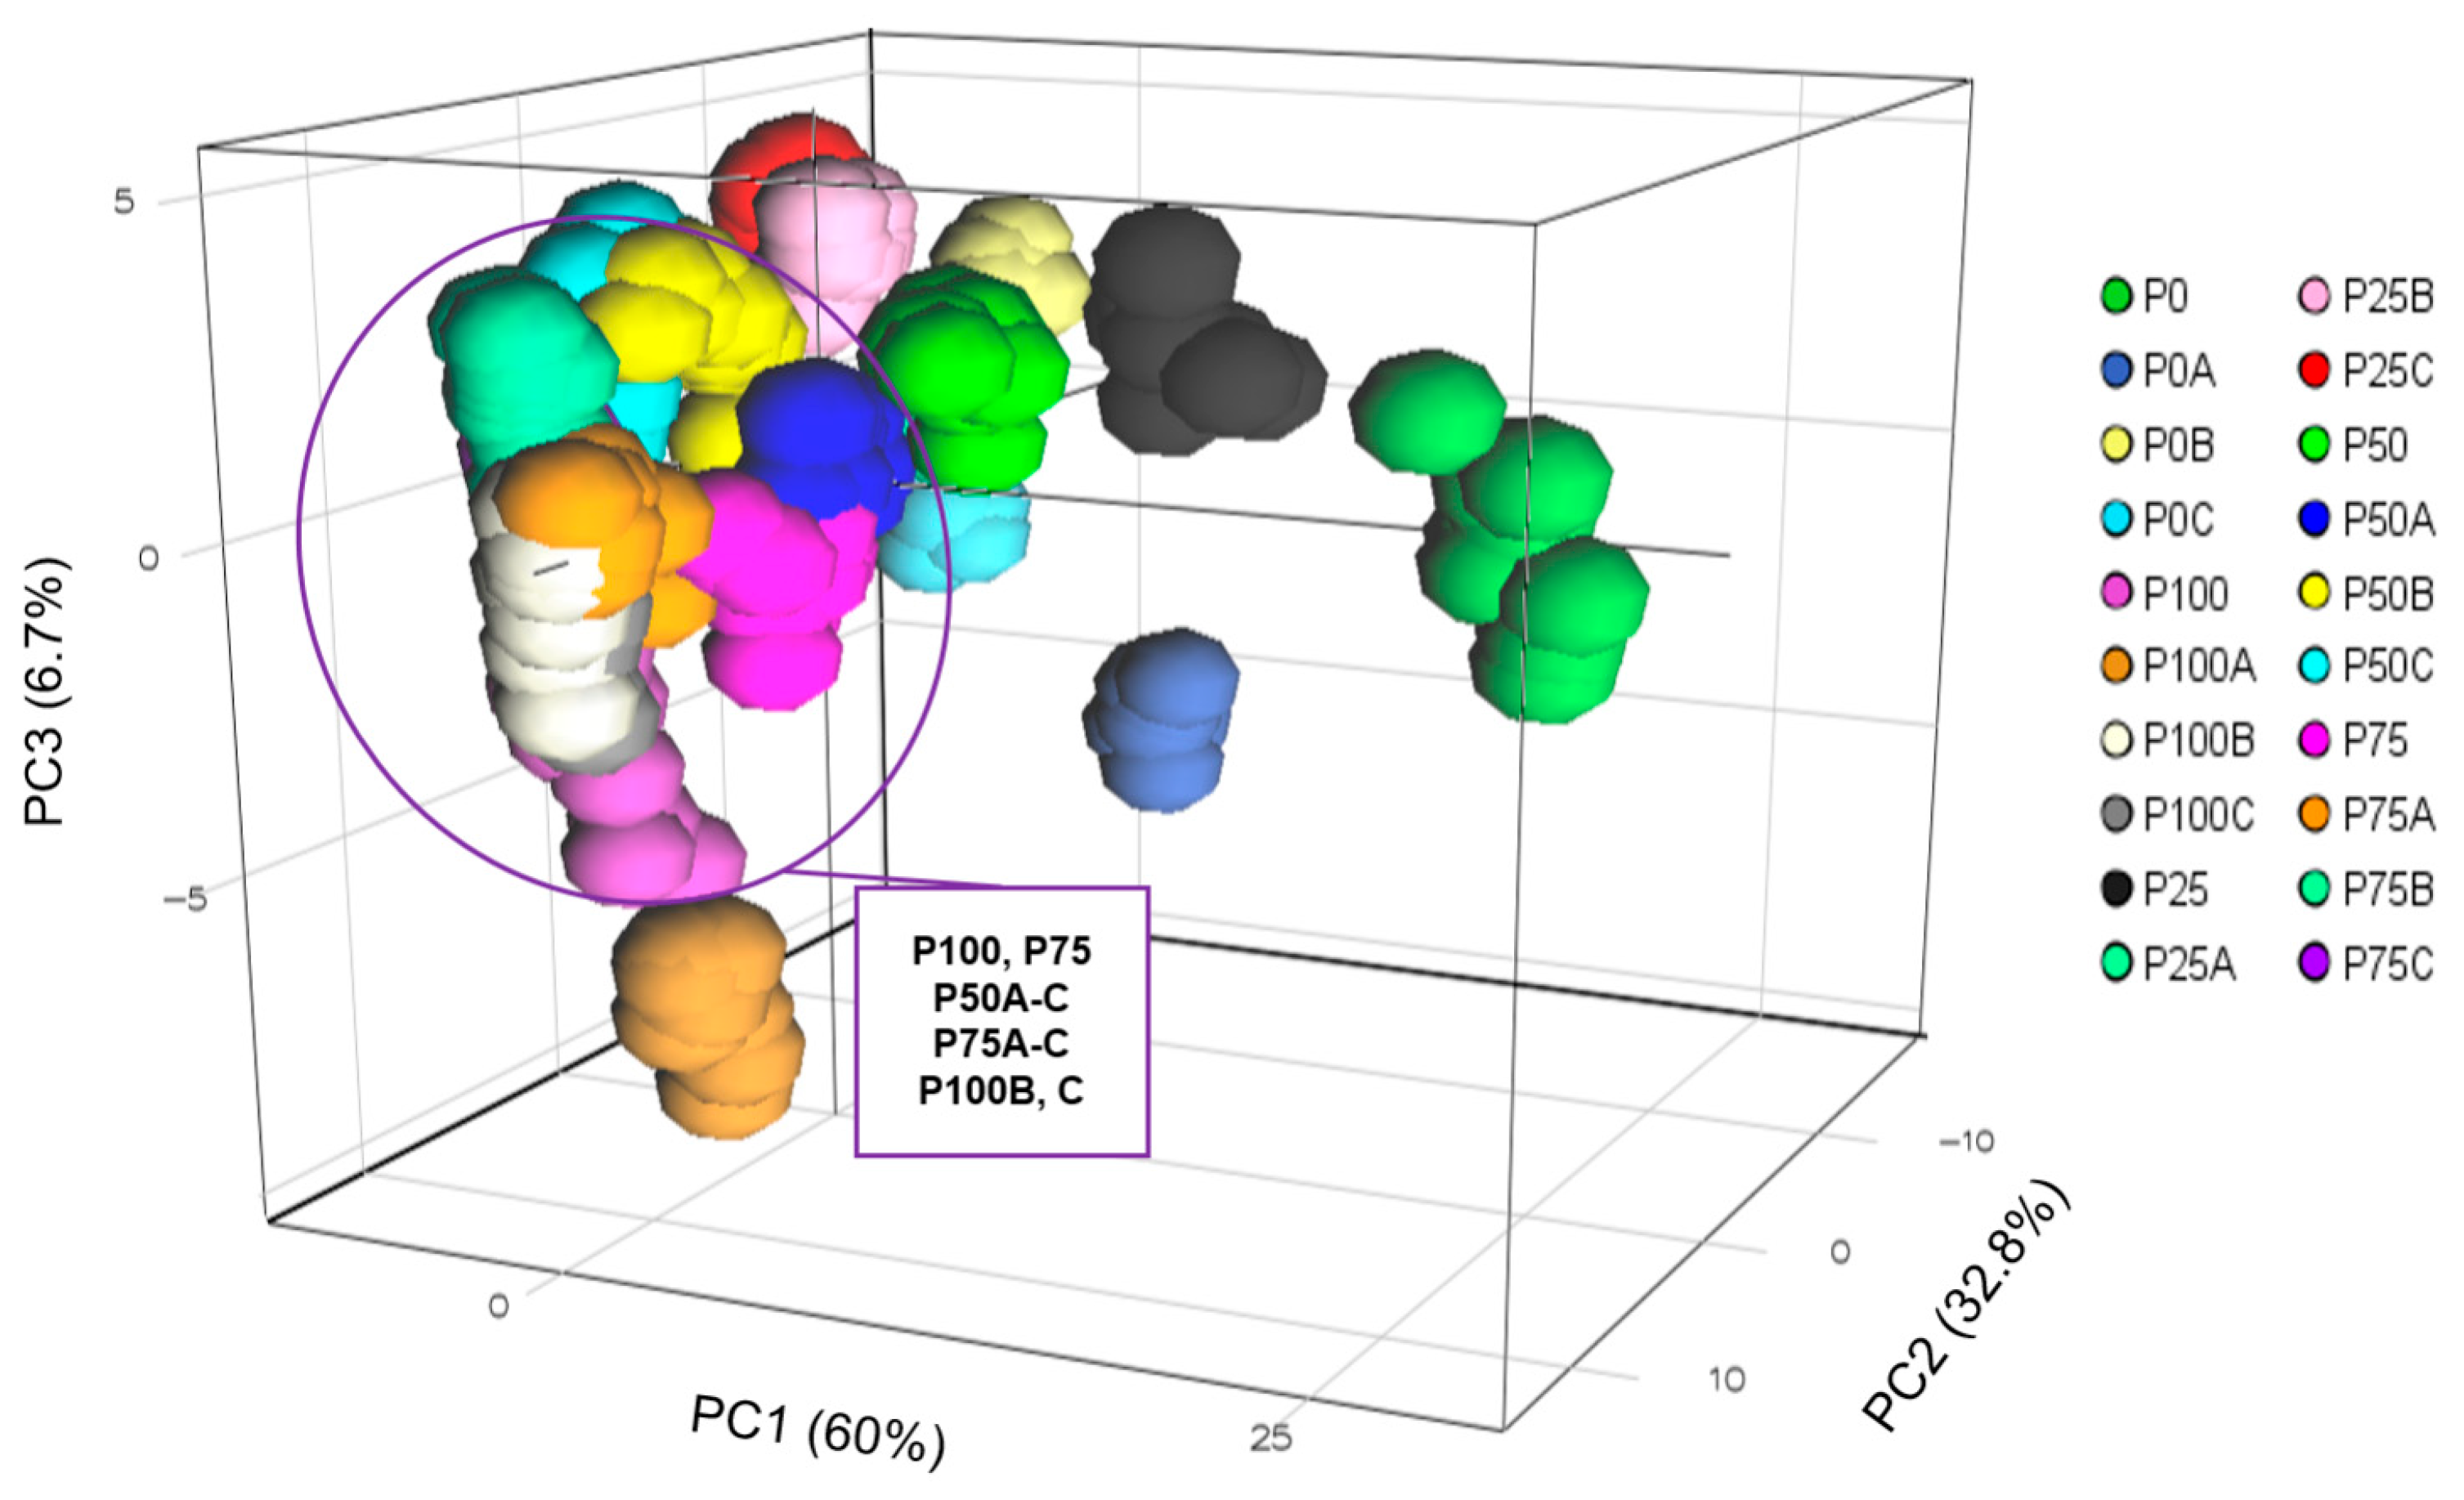
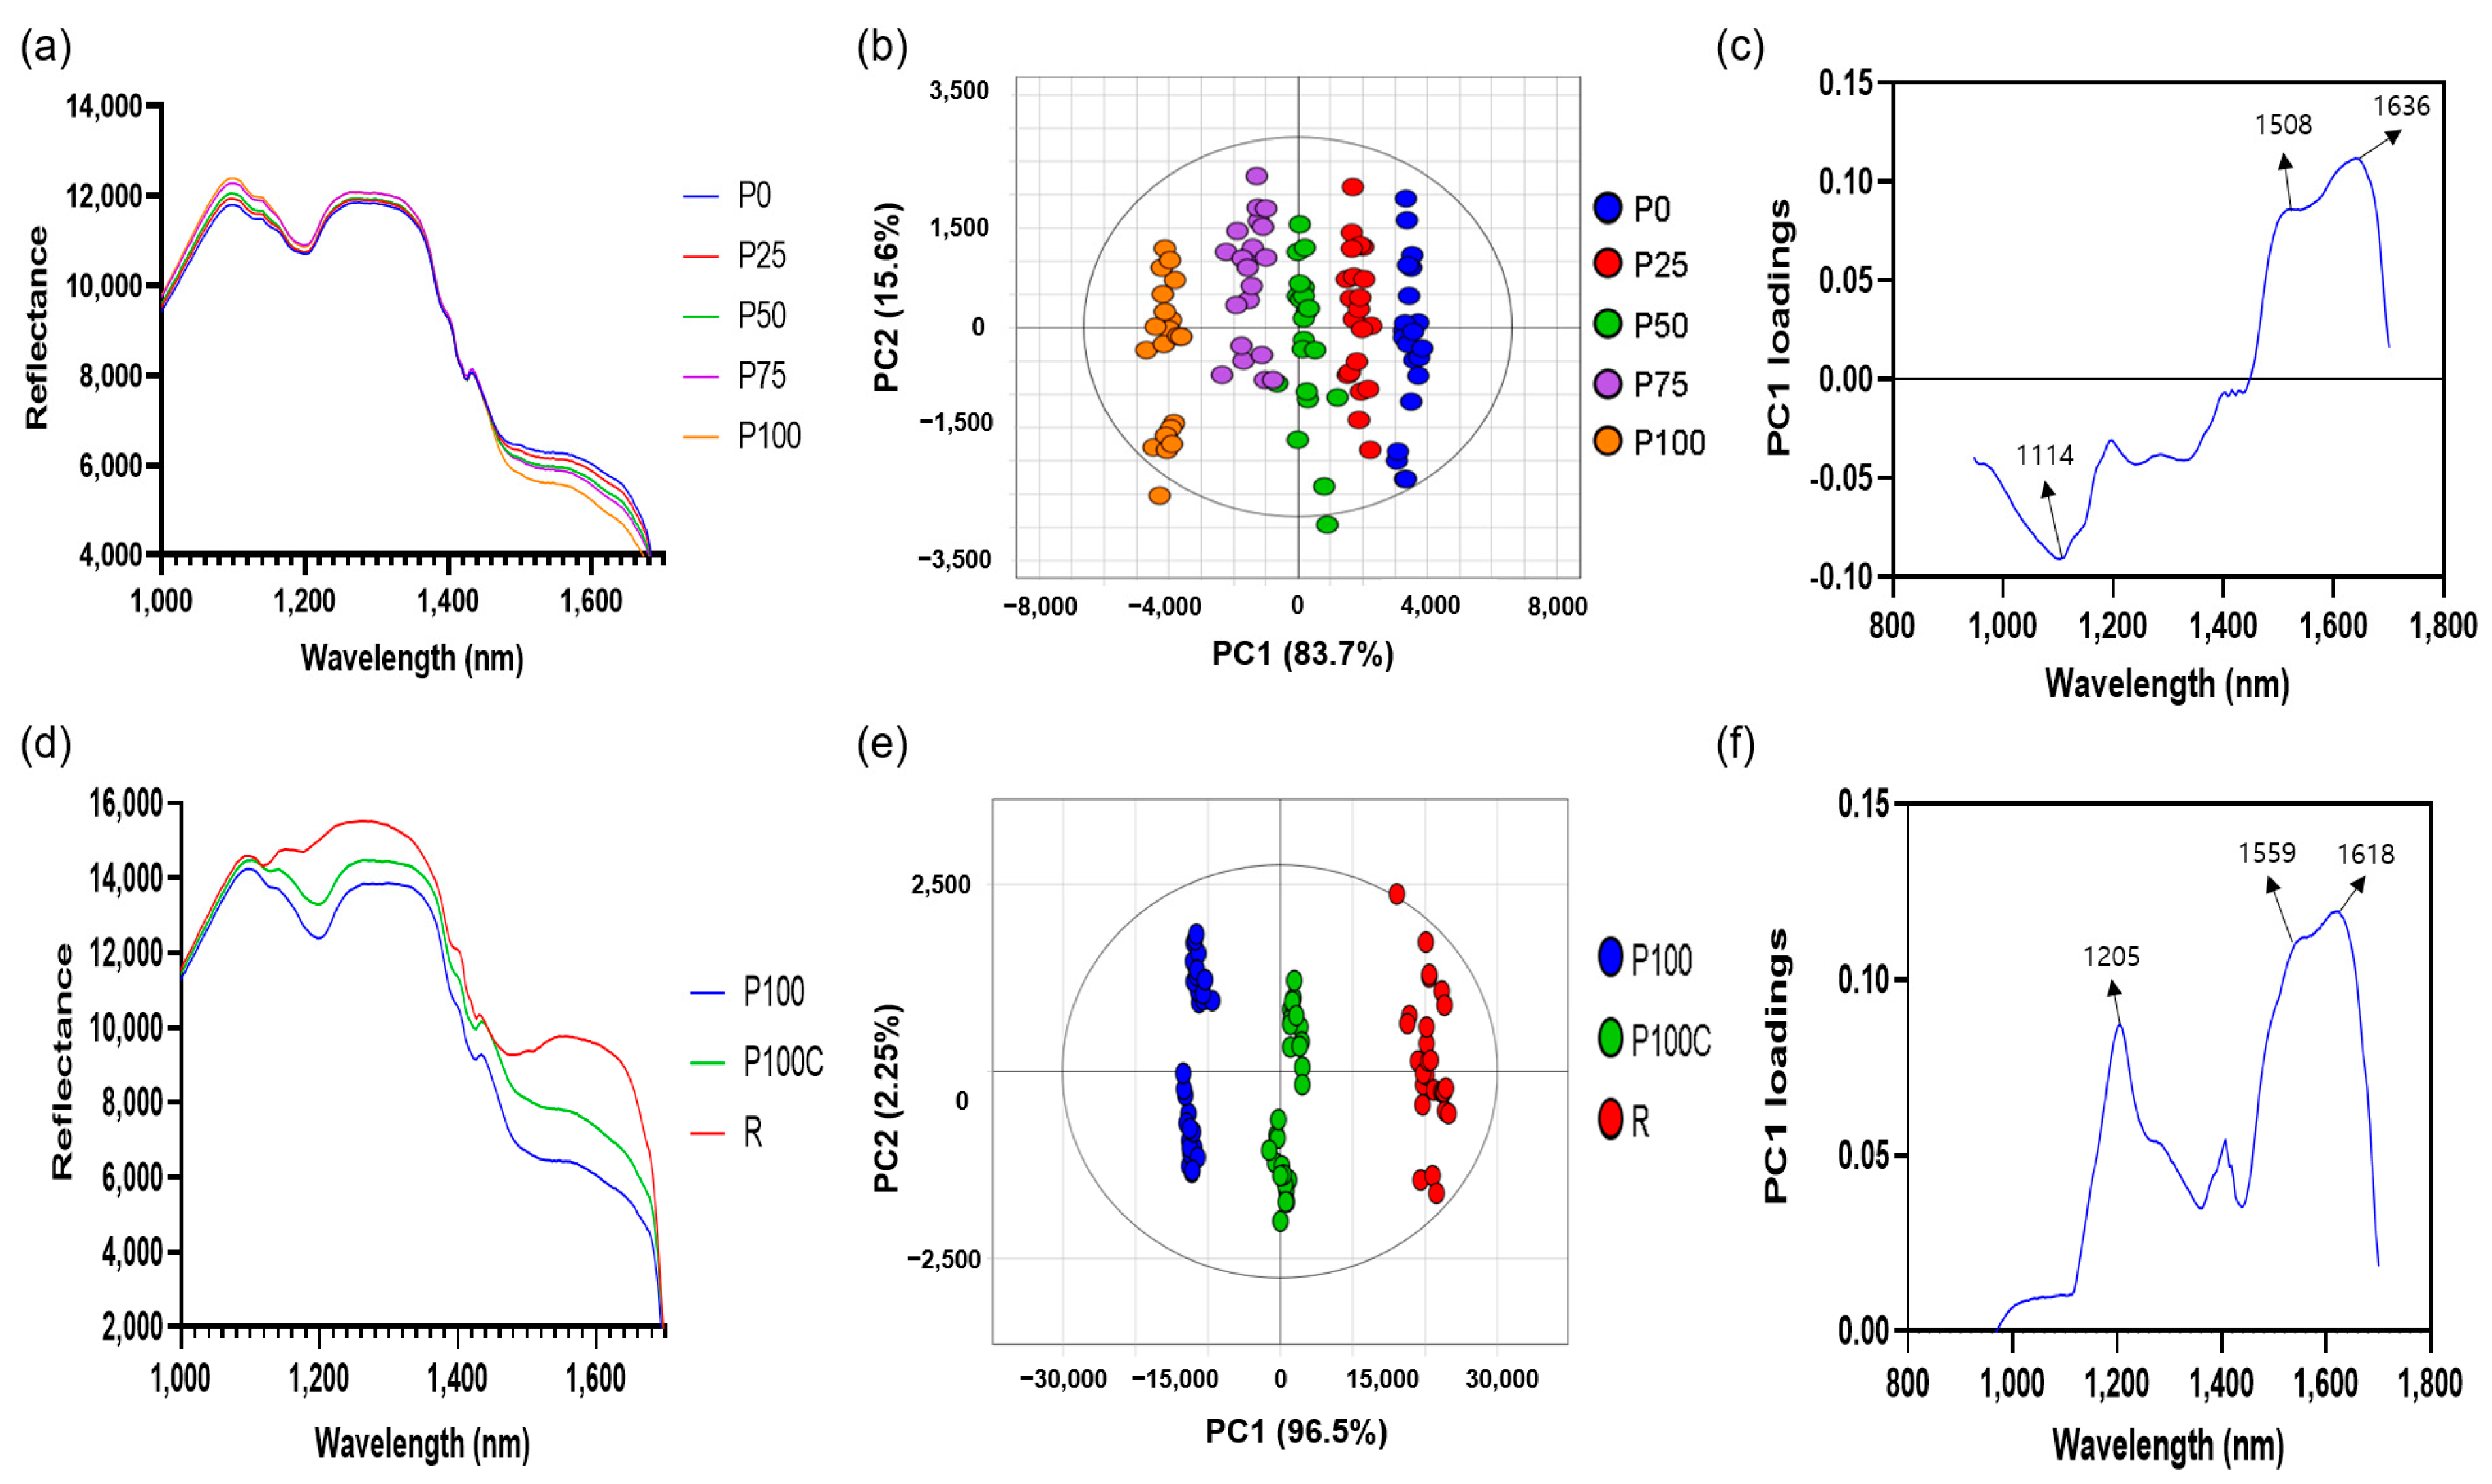
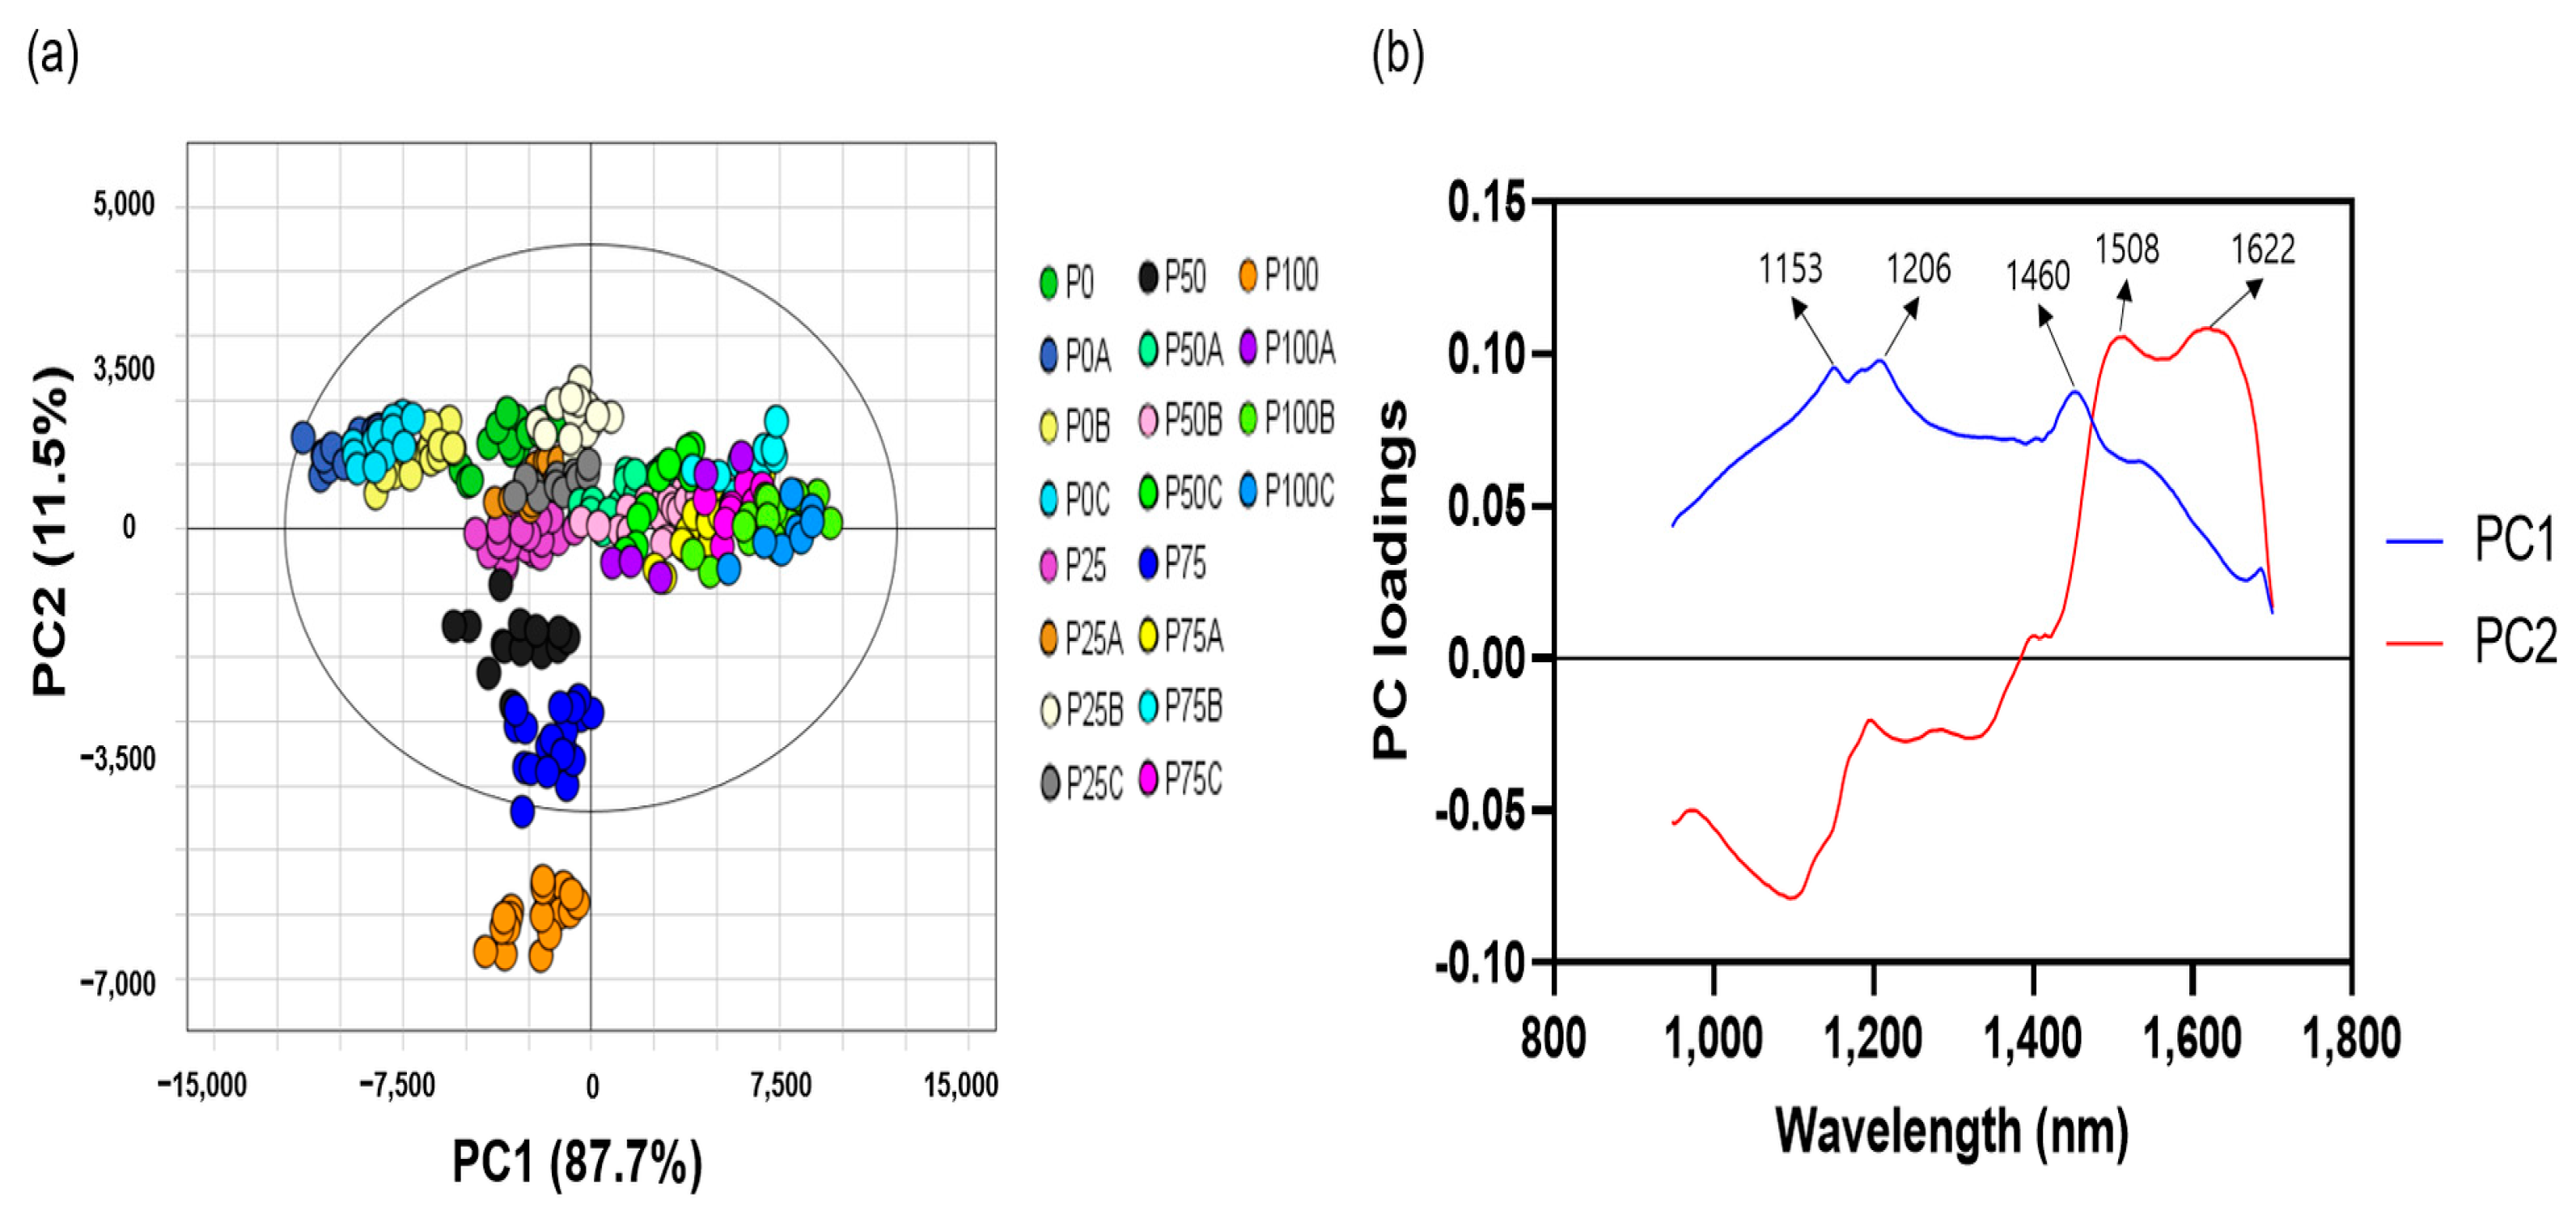
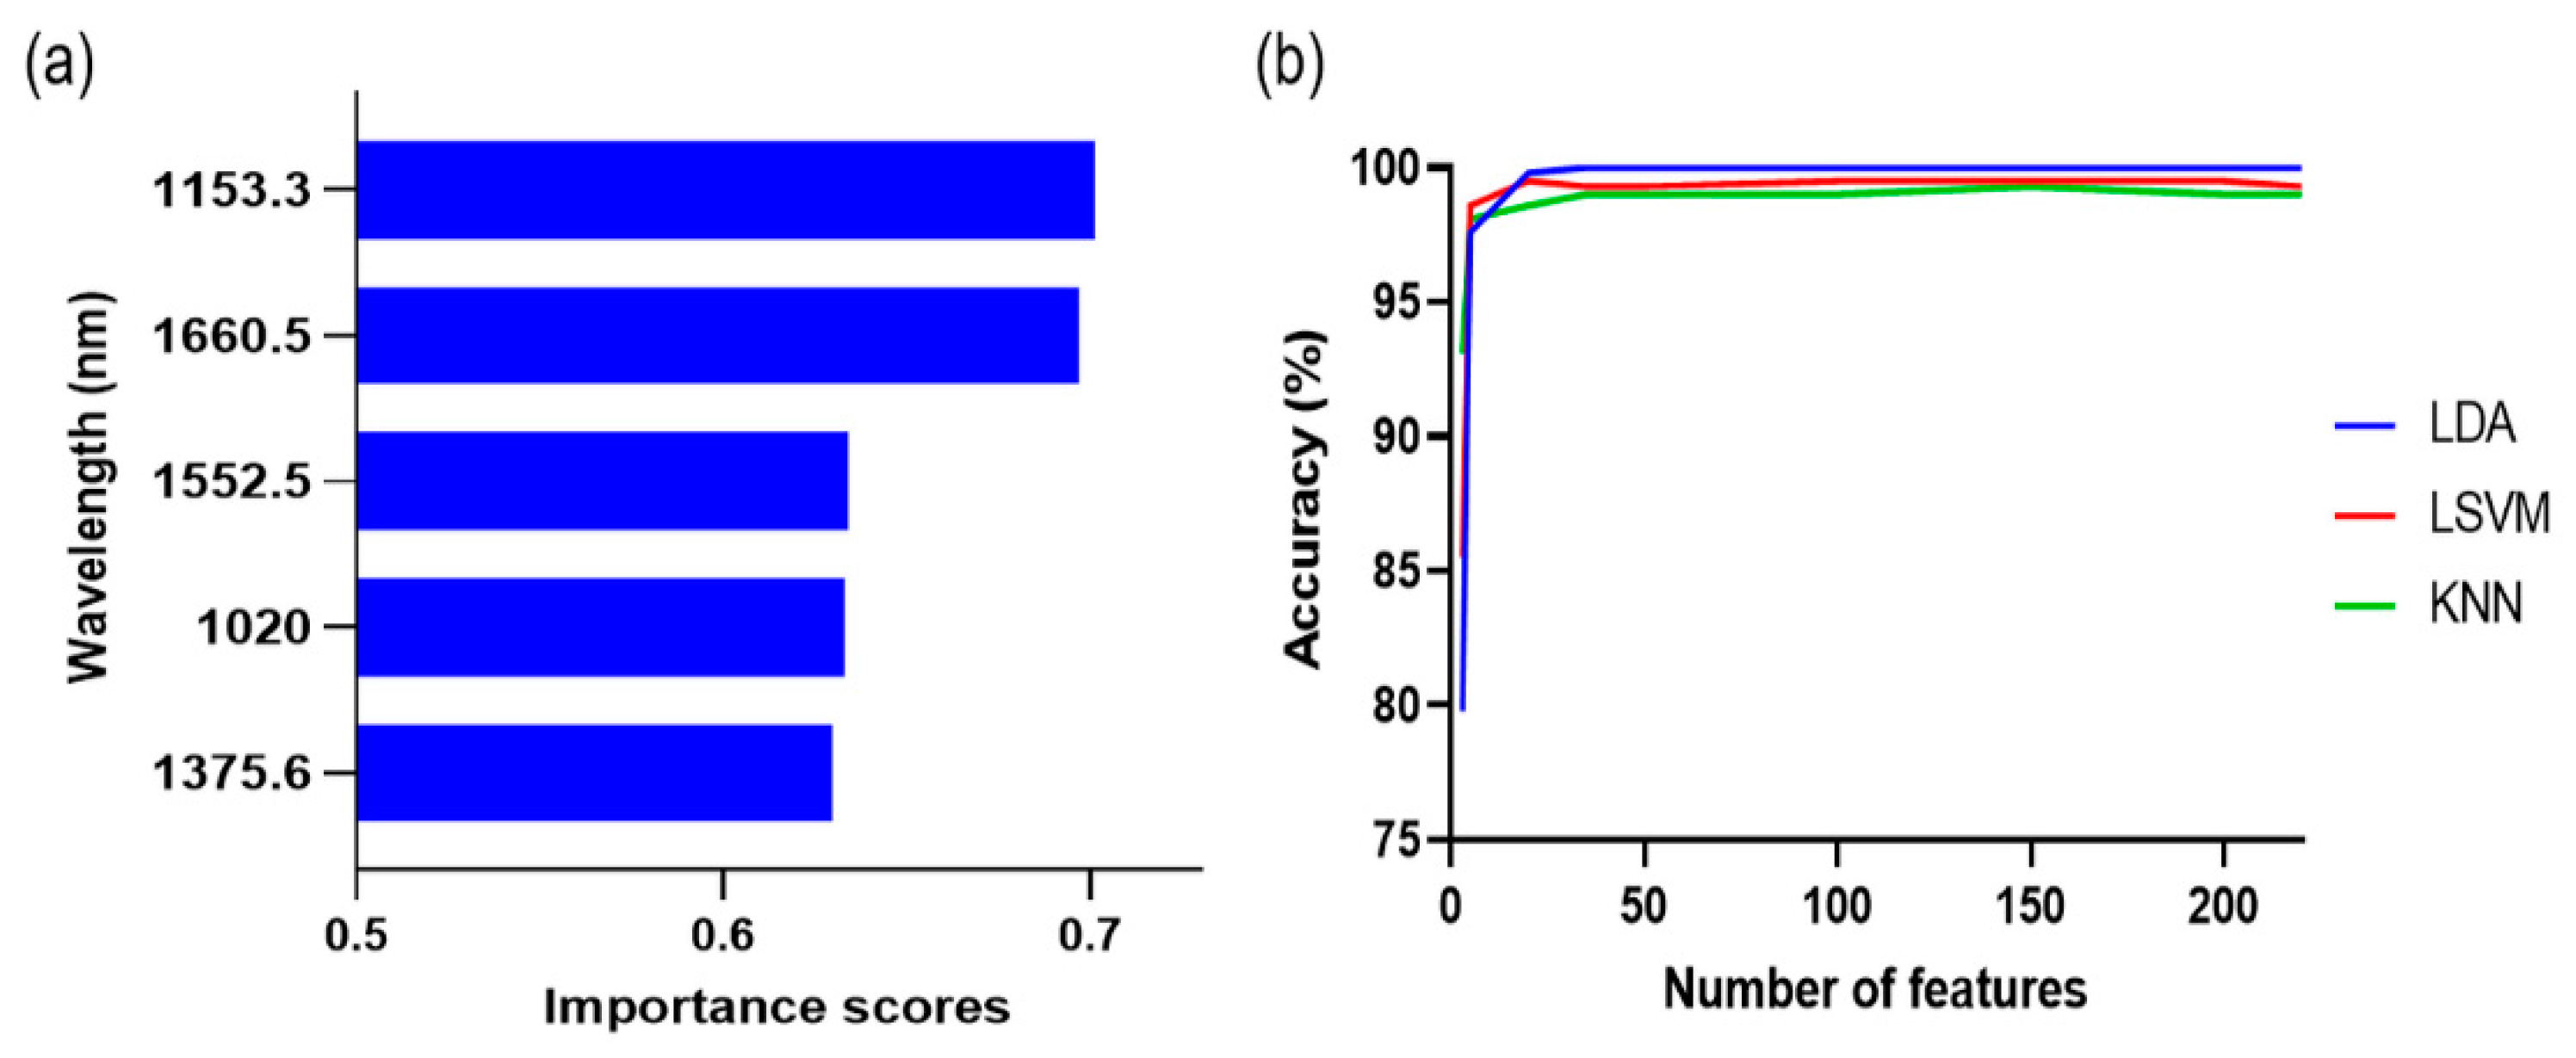
3.2. Hyperspectral Information and PCA Results in Relation to the Pericarp and Seed Ratio and the Presence of Allura Red

The spectral data based on the pericarp/seed mixture ratio showed that the reflectance in the 1500–1700 nm range decreased, but the reflectance in the 1000–1350 nm range increased as the pericarp percentage increased (Figure 2a). The spectral data of the pericarp/seed mixture without Allura Red (P0-100) were used for PCA. The score plot of the first two principal components (PCs) (explaining 99.3% of the variation) showed that the groups were well separated based on the peel/seed ratio (Figure 2b). Principal component loadings revealed the contributions of the wavelengths, and the valleys and peaks of the loading plot could be considered effective wavelengths [22]. The loading plot indicated that the wavelength at 1000–1165 nm and the pericarp ratio were positively correlated, while the wavelength at 1470–1690 nm and the pericarp ratio were negatively correlated (Figure 2c).
The capsaicin and dihydrocapsaicin contents in the pericarp were over 20 times higher than those in the seeds (Table 3). Thus, the capsaicin content increased as the pericarp percentage increased. Capsaicin (C18H27NO3) is an inherent component of red peppers, and many previous studies reported that capsaicin content affects the NIR spectra of red pepper powder [23,24]. The characteristic wavelengths of chili pepper capsaicin are 1035 nm (the second overtone of N–H), 1150–1210 nm (the second overtone absorption of C–H stretching), 1300–1500 nm (the second combination regions of C–H stretching), and 1530 nm (the first overtone of N–H) [25]. The second overtone region of C–H bonds (1120–1200 nm) were assigned to the capsaicin and dihydrocapsaicin content since this region contained at least 18 C–H bonds [26].
The score plot explained 98.8% of the variation when PCA was performed using a spectral dataset that included pure pericarp (P100), pericarp adulterated with 0.15% Allura Red (P100C), and Allura Red (R) (Figure 2e). R exhibits the highest reflectance over the entire wavelength range, followed by P100C and P100 (Figure 2d). The loading plot suggested that 1205 nm and 1559-1618 nm were the key wavelengths indicating the presence of Allura Red (Figure 2f). Kamil, Mohamed, and Shaheen [27] reported that Allura Red showed specific function groups, including NH stretching, C-N=N-C, stretching C=C aromatic, and CH2 bending. Therefore, the increase in the reflectance of red pepper powder adulterated with Allura Red may have been caused by these functional groups of Allura Red.
PC1 and PC2 explained 87.7% and 11.5% of the variation across the samples, respectively, when all datasets were subjected to PCA. The cumulative variance contributions of PC1 and PC2 were 99.3% (Figure 3a). P100, P75, and P50 were evidently separated from the samples adulterated with Allura Red. However, the samples adulterated with Allura Red overlapped with P25 and P0, and the adulterated samples could not be clearly separated based on the Allura Red concentration.
The classification of the pericarp/seed ratio in the Allura Red-contaminated sample was determined by PC1, and wavelengths at 1153, 1206, and 1460 nm predominantly influenced this discrimination. In contrast, the pericarp/seed ratio of pepper powder without Allura Red was discriminated by PC2, and the dominant wavelengths in the loading plot were 1103 nm and 1508-1622 nm, which is consistent with the loading plot results in Figure 2c. Confining these spectral characteristics solely to Allura Red might be premature considering the presence of numerous other red azo dyes. Nevertheless, the PCA results suggest the possibility of SWIR to identify red azo dye and seed impurities in red pepper powder. Therefore, a machine learning method was applied for effective classification.

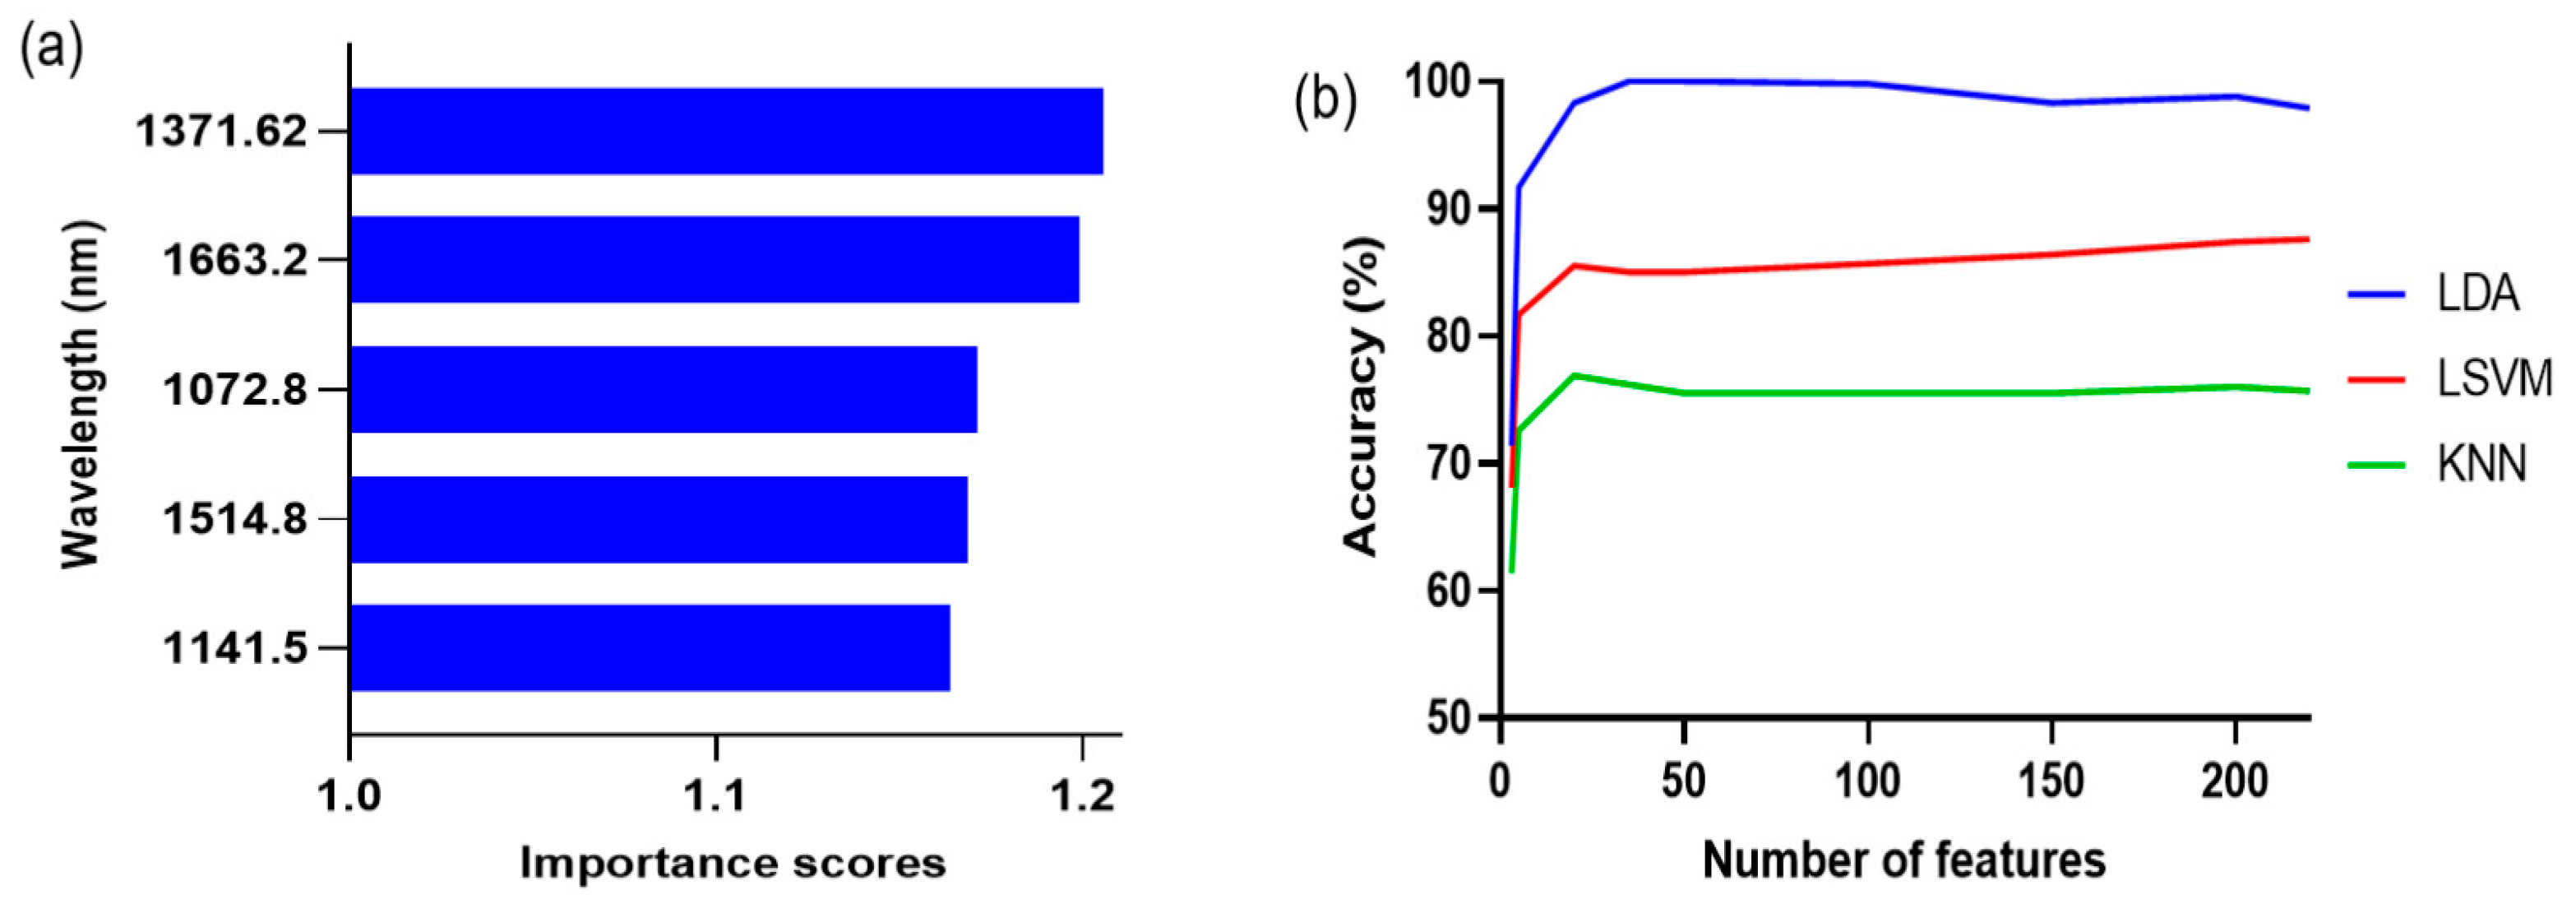
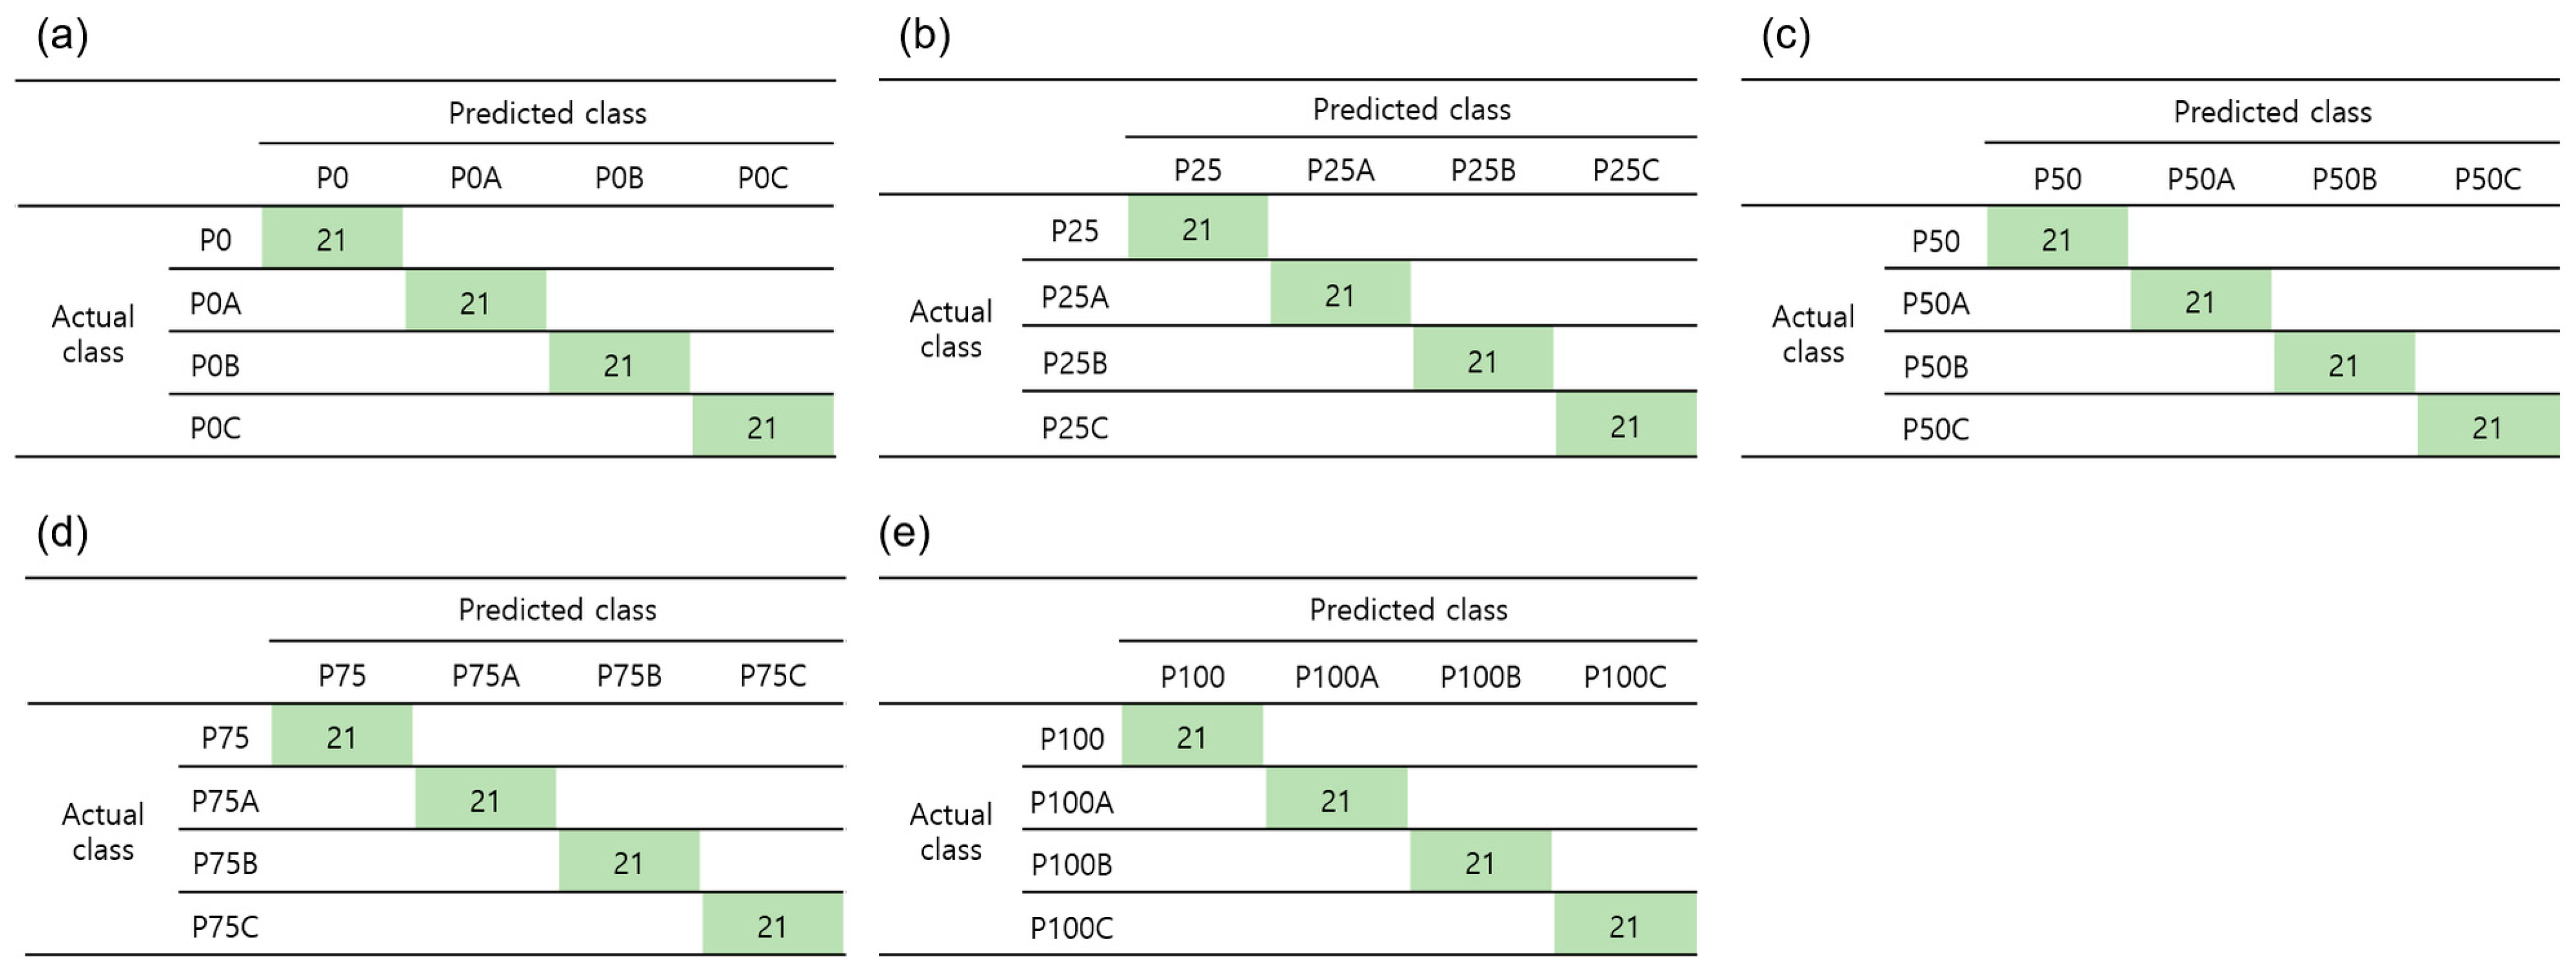
3.3. Classification of Adulterated Red Pepper Powder by the Pericarp Ratio and Allura Red Concentration

Three machine learning algorithms (LDA, LSVM, and KNN) were employed to train the model for classifying red pepper powder adulterated with different pericarp ratios and Allura Red concentrations (20 categories).
Prior to applying machine learning classification, the optimal wavelength was selected by the minimum redundancy maximal relevance (MRMR) algorithm. MRMR aimed to choose a feature subset that maximizes dependence and relevance, while minimizing redundancy from the raw feature set [28].
Hyperspectral image data contain a vast number of spectral bands, resulting in an overabundance of information. Wavelength selection is an important step for efficient data processing considering the limitations of computer hardware. Moreover, wavelength selection is beneficial to improve model performance by eliminating irrelevant variables [29]. The top five wavelengths with high importance scores from MRMR were 1371.6, 1663.2, 1072.8, 1514.8, and 1141.5 nm (Figure 4a). The accuracy of classification models was compared based on the number of features to construct a suitable feature subset for each classification model (Figure 4b). Accuracy was defined as the ratio of correctly predicted samples to the total number of samples. The model accuracy increased as the number of features increased. However, the model accuracy no longer increased when the number of features crossed a certain threshold. The number of features was selected based on classifier accuracy as a function of the number of features, ensuring that the model accuracy for the feature model set deviated by less than 3% from the maximum accuracy. The selected feature numbers were 35, 20, and 20 for LDA, LSVM, and KNN, respectively.
The accuracy of the three algorithms was 76.9–100.0% in the training set and 80.6–98.9% in the testing set (Table 4). Overall, the results did not substantially differ between the training and testing sets. This indicated that the developed models were robust and did not show overfitting. Among these models, LDA exhibited the highest accuracy, followed by LSVM and KNN.
In addition to accuracy, other evaluation indices, such as recall, precision, and F1_score, were used to evaluate model performance. Recall represents the ratio of correctly predicted positive samples to the total number of positive samples, whereas precision represents the ratio of correctly predicted positive samples to the total number of positive samples predicted. Meanwhile, the F1_score is a weighted average of precision and recall [30]. The test set accuracy in LDA was 98.9%, recall was 97.8%, precision was 98.0%, and the F1-score was 97.8%. This indicated that LDA showed good performance in classifying different pericarp and seed ratios (Table 4). There was some misclassification of the Allura Red concentration at P75 and P100; however, LDA clearly determined the presence of seeds and Allura Red (Figure 5). LDA is regarded as a robust classifier, with an accuracy above 90% in studies on classification using HSI [13]. The superior performance of LDA in comparison with other machine learning methods was observed in classification studies of coffee bean contamination [31] and the infection of brown rice [32]. This is likely because LDA maximizes the rate between class variance and the interior of the class variance in any particular dataset to ensure the greatest separability [33].

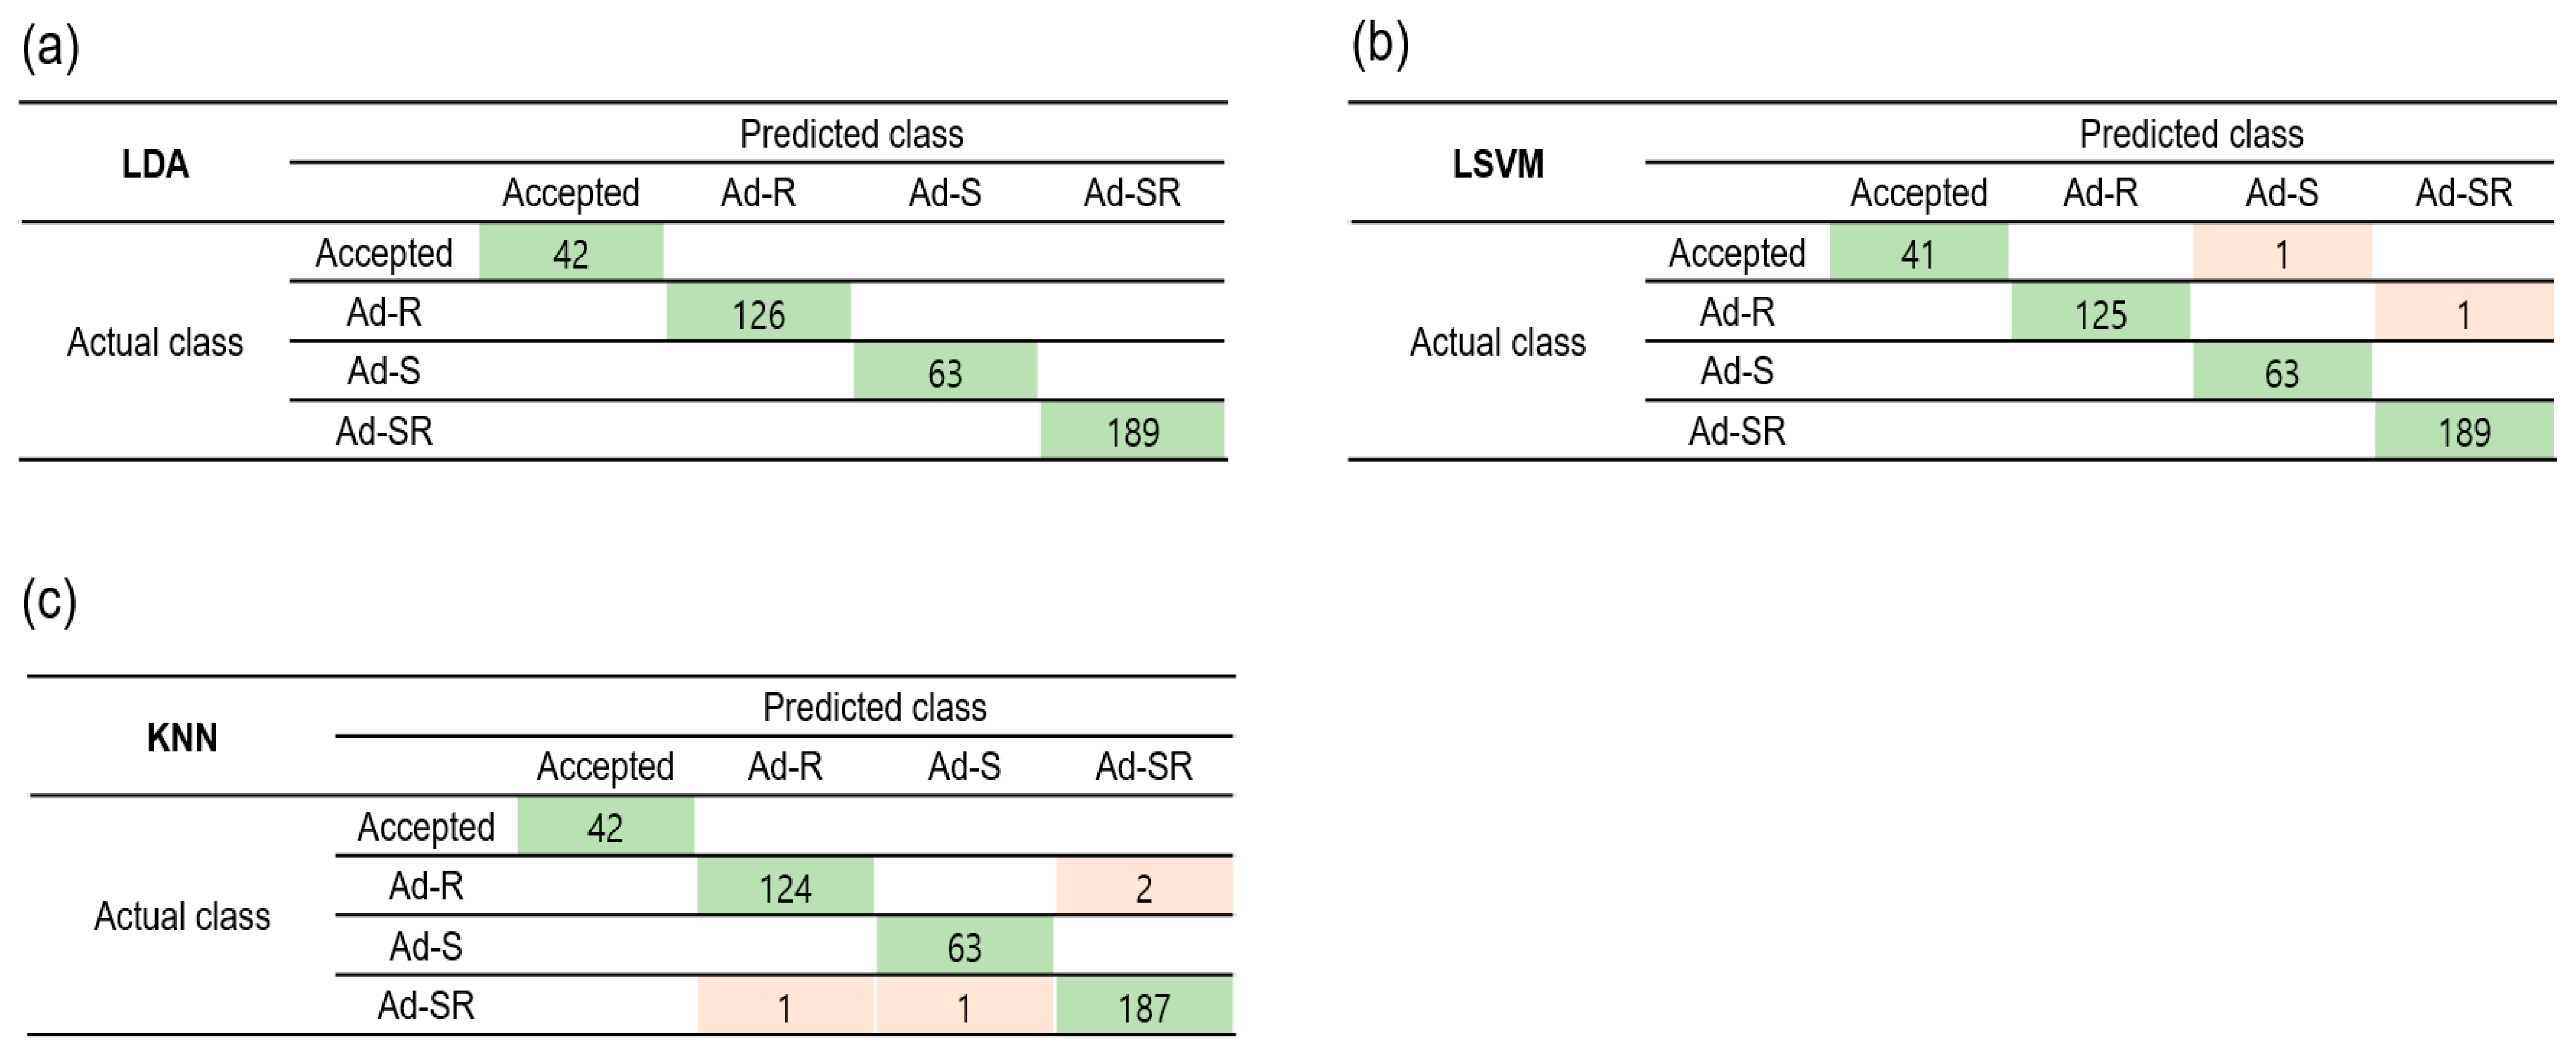
3.4. Classification of Adulterated Red Pepper Powder by Adulterant Types

In onsite assessments, identification of the presence of an adulterant may be more important than quantification of each adulterant. Therefore, the samples were divided into four categories: acceptable (P100 and P75), adulterated with Allura Red (Ad-R; P100A-C and P75A-C), adulterated with seeds (Ad-S; P0-50), and adulterated with seeds and Allura Red (Ad-SR; P0A-C, P25A-C, P50A-C, and P75A-C). P75 was included in the acceptable group, along with P100, since previous studies reported that the red pepper seed content in dried red pepper powder varies from less than 10% to as much as 25%, depending on the country of origin [34].
The first five wavelengths with a high importance score from MRMR were 1153.3, 1660.5, 1552.5, 1020.0, and 1375.6 nm (Figure 6a). The accuracy of LDA, LSVM, and KNN was 79.8–100%, 85.5–99.5%, and 93.1–99.3%, respectively, as the number of features varied from 3 to 220 spectral bands, (Figure 6b). The selected feature numbers for LDA, LSVM, and KNN were 35, 20, and 35, respectively. The accuracies of the classification models in the training and test sets were 99.0–100% and 94.4–100%, respectively (Table 5 and Figure 7). The 4-category classification model showed better classification performance than the 20-category model. A previous study also reported improved accuracy of classification models when the categories were appropriately adjusted [35]. LDA clearly classified four categories (100% accuracy), whereas LSVM misclassified some of the Ad-S and Ad-SR samples as acceptable, but its accuracy improved overall in comparison with the 20-category classification.
KNN poorly performed when adulterated red pepper powder was classified by different pericarp ratios and Allura Red concentrations (20 categories) (Table 4). However, the accuracy of KNN in the training set increased from 76.9% to 99.0% after adjusting the number of categories to four. The classification ability of KNN is based on the determination of sample-type attributes using a defined set of K neighbors, without relying on a function generated during training. Therefore, KNN had good classification ability only in the absence of overlap between classes [36]. Consequently, the improved accuracy of the KNN model can be attributed to the reduced overlap between classes resulting from category adjustment.
Phillips and Abdulla reported that when the amount of adulterant added to a product is small, the spectrum does not change, leading to misclassification [37]. In this study, the added concentration of Allura Red was small (0.05–0.15%), but SWIR and machine learning were able to identify adulteration with high probability. We believe that the combination of SWIR and machine learning technology is an effective tool for quality assurance of red pepper powder, considering the cost and time-intensive nature of conventional analytical methods used for detecting adulteration.

4. Conclusions

The color results obtained from the colorimeter (CIE L*, a*, and b* values; hue angle; and chroma) cannot reliably indicate the presence of Allura Red and red pepper seeds in red pepper powder. Therefore, this study developed a machine learning model based on HSI to detect adulteration in red pepper powder. LDA showed the highest accuracy, recall, precision, and F1_score after applying machine learning to a dataset of 20 groups categorized by pericarp/seed ratio and Allura Red concentration. This indicated the superiority of the LDA model for classifying adulterated red pepper powder. In addition, LDA, LSVM, and KNN effectively discriminated among the accepted and contaminated products when classifying the samples into four groups (acceptable, adulterated by Allura Red, adulterated by seeds, and adulterated by seeds and Allura Red).
This study focused on the adulteration of red pepper powder with Allura Red and red pepper seeds. It provided insights that SWIR combined with an appropriate machine learning classification method is a reliable tool to detect specific adulterants. Moreover, an effective quality-monitoring process for red pepper powder can be expected if the dataset classification and machine learning classification methods are selected according to the user’s specific purpose and the desired level of quality assessment. Furthermore, a greater number of sample sizes and types will improve the robustness of the model data.

Author Contributions

J.-J.P.: Conceptualization, investigation, methodology, software, and writing of the original draft. J.-S.C.: Methodology, conceptualization, software, and review and editing. G.L.: Methodology, investigation, and software. D.-Y.Y.: Software, and review and editing. S.-K.P.: Methodology, and review and editing. K.-J.P.: Supervision, and review and editing. J.-H.L.: Supervision, conceptualization, review and editing, and project administration. All authors have read and agreed to the published version of the manuscript.

Funding

This work was supported by the Korea Institute of Planning and Evaluation for Technology in Food, Agriculture, and Forestry (IPET) through the High Value-Added Food Technology Development Program funded by the Ministry of Agriculture, Food, and Rural Affairs (MAFRA) (321049-5).

Data Availability Statement

The datasets generated for this study are available on request to the corresponding author.

Conflicts of Interest

The authors declare no conflict of interest.

References

  1. Korea Food & Drug Administration (KFDA). Food Public Code. Available online: https://various.foodsafetykorea.go.kr/fsd/#/ext/Document/FC (accessed on 13 August 2023).
  2. Khan, M.H.; Saleem, Z.; Ahmad, M.; Sohaib, A.; Ayaz, H.; Mazzara, M.; Raza, R.A. Hyperspectral imaging-based unsupervised adulterated red chili content transformation for classification: Identification of red chili adulterants. Neural Comput. Appl. 2021, 33, 14507–14521. [Google Scholar] [CrossRef]
  3. Haughey, S.A.; Galvin-King, P.; Ho, Y.-C.; Bell, S.E.; Elliott, C.T. The feasibility of using near infrared and raman spectroscopic techniques to detect fraudulent adulteration of chili powders with sudan dye. Food Control 2015, 48, 75–83. [Google Scholar] [CrossRef]
  4. Ku, K.-H.; Choi, E.-J.; Park, J.-B. Chemical component analysis of red pepper (Capsicum annuum L.) seeds with various cultivars. J. Korean Soc. Food Sci. Nutr. 2008, 37, 1084–1089. [Google Scholar] [CrossRef]
  5. Khan, M.H.; Saleem, Z.; Ahmad, M.; Sohaib, A.; Ayaz, H.; Mazzara, M. Hyperspectral imaging for color adulteration detection in red chili. Appl. Sci. 2020, 10, 5955. [Google Scholar] [CrossRef]
  6. Rovina, K.; Siddiquee, S.; Shaarani, S.M. Extraction, analytical and advanced methods for detection of allura red ac (e129) in food and beverages products. Front. Microbiol. 2016, 7, 798. [Google Scholar] [CrossRef] [PubMed]
  7. Di Anibal, C.V.; Rodríguez, M.S.; Albertengo, L. Synchronous fluorescence and multivariate classification analysis as a screening tool for determining sudan i dye in culinary spices. Food Control 2015, 56, 18–23. [Google Scholar] [CrossRef]
  8. Modupalli, N.; Naik, M.; Sunil, C.; Natarajan, V. Emerging non-destructive methods for quality and safety monitoring of spices. Trends Food Sci. Technol. 2021, 108, 133–147. [Google Scholar] [CrossRef]
  9. Gowen, A.A.; O’Donnell, C.P.; Cullen, P.J.; Downey, G.; Frias, J.M. Hyperspectral imaging–an emerging process analytical tool for food quality and safety control. Trends Food Sci. Technol. 2007, 18, 590–598. [Google Scholar] [CrossRef]
  10. Soni, A.; Dixit, Y.; Reis, M.M.; Brightwell, G. Hyperspectral imaging and machine learning in food microbiology: Developments and challenges in detection of bacterial, fungal, and viral contaminants. Compr. Rev. Food Sci. Food Saf. 2022, 21, 3717–3745. [Google Scholar] [CrossRef]
  11. Wu, X.Y.; Zhu, S.P.; Huang, H.; Xu, D. Quantitative identification of adulterated sichuan pepper powder by near-infrared spectroscopy coupled with chemometrics. J. Food Qual. 2017, 2017, 5019816. [Google Scholar] [CrossRef]
  12. Aviara, N.A.; Liberty, J.T.; Olatunbosun, O.S.; Shoyombo, H.A.; Oyeniyi, S.K. Potential application of hyperspectral imaging in food grain quality inspection, evaluation and control during bulk storage. J. Agric. Food Res. 2022, 8, 100288. [Google Scholar] [CrossRef]
  13. Saha, D.; Manickavasagan, A. Machine learning techniques for analysis of hyperspectral images to determine quality of food products: A review. Curr. Res. Food Sci. 2021, 4, 28–44. [Google Scholar] [CrossRef] [PubMed]
  14. Lin, Y.; Ma, J.; Wang, Q.; Sun, D.-W. Applications of machine learning techniques for enhancing nondestructive food quality and safety detection. Crit. Rev. Food Sci. Nutr. 2023, 63, 1649–1669. [Google Scholar] [CrossRef] [PubMed]
  15. Sharma, S.; Sirisomboon, P.; Sumesh, K.; Terdwongworakul, A.; Phetpan, K.; Kshetri, T.B.; Sangwanangkul, P. Near-infrared hyperspectral imaging combined with machine learning for physicochemical-based quality evaluation of durian pulp. Postharvest Biol. Technol. 2023, 200, 112334. [Google Scholar] [CrossRef]
  16. Yang, F.; Sun, J.; Cheng, J.; Fu, L.; Wang, S.; Xu, M. Detection of starch in minced chicken meat based on hyperspectral imaging technique and transfer learning. J. Food Process Eng. 2023, 46, e14304. [Google Scholar] [CrossRef]
  17. Li, C.; He, M.; Cai, Z.; Qi, H.; Zhang, J.; Zhang, C. Hyperspectral imaging with machine learning approaches for assessing soluble solids content of tribute citru. Foods 2023, 12, 247. [Google Scholar] [CrossRef]
  18. Kim, D.; Park, H.; Cho, I.H. The effect of roasting on capsaicinoids, volatile compounds, and fatty acids in Capsicum annuum L. (red pepper) seeds. Food Sci. Biotechnol. 2022, 31, 211–220. [Google Scholar] [CrossRef]
  19. Baykan, N.A.; Yılmaz, N. A mineral classification system with multiple artificial neural network using k-fold cross validation. Math. Comput. Appl. 2011, 16, 22–30. [Google Scholar] [CrossRef]
  20. Bignardi, C.; Cavazza, A.; Rinaldi, M.; Corradini, C. Correlation between different markers for the assessment of red chilli pepper powders stability during shelf-life. Int. J. Food Sci. Nutr. 2016, 67, 391–399. [Google Scholar] [CrossRef]
  21. Guo, Z.; Zhang, J.; Dong, H.; Sun, J.; Huang, J.; Li, S.; Ma, C.; Guo, Y.; Sun, X. Spatio-temporal distribution patterns and quantitative detection of aflatoxin b1 and total aflatoxin in peanut kernels explored by short-wave infrared hyperspectral imaging. Food Chem. 2023, 424, 136441. [Google Scholar] [CrossRef]
  22. Shao, Y.; Xuan, G.; Hu, Z.; Gao, X. Identification of adulterated cooked millet flour with hyperspectral imaging analysis. IFAC-Pap. 2018, 51, 96–101. [Google Scholar] [CrossRef]
  23. Choi, J.Y.; Cho, J.S.; Park, K.J.; Kim, S.S.; Lim, J.H. Grading the pungency of red pepper powder using hyperspectral imaging coupled with multivariate analysis. Korean J. Food Preserv. 2022, 29, 918–931. [Google Scholar] [CrossRef]
  24. Jing, B.; Song, W.; Gao, X.; He, K.; Sun, Q.; Tang, X. A feasibility quantification study of capsaicin content in chili powder for rapid evaluation using near-infrared reflectance spectroscopy. J. Food Meas. Charact. 2023, 17, 4405–4414. [Google Scholar] [CrossRef]
  25. Wu, S.; Wang, L.; Zhou, G.; Liu, C.; Ji, Z.; Li, Z.; Li, W. Strategies for the content determination of capsaicin and the identification of adulterated pepper powder using a hand-held near-infrared spectrometer. Food Res. Int. 2023, 163, 112192. [Google Scholar] [CrossRef] [PubMed]
  26. Park, T.S.; Bae, Y.M.; Sim, M.J.; Kim, D.E.; Cho, S.I. Analysis of capsaicinoids from hot red pepper powder by near-infrared spectroscopy. ASABE 2008, 083703. [Google Scholar]
  27. Kamil, M.M.; Mohamed, G.F.; Shaheen, M.S. Fourier transformer infrared spectroscopy for quality assurance of tomato products. J. Am. Sci. 2011, 7, 559–572. [Google Scholar]
  28. Xie, S.; Zhang, Y.; Lv, D.; Chen, X.; Lu, J.; Liu, J. A new improved maximal relevance and minimal redundancy method based on feature subset. J. Supercomput. 2023, 79, 3157–3180. [Google Scholar] [CrossRef] [PubMed]
  29. Fan, S.; Li, C.; Huang, W.; Chen, L. Detection of blueberry internal bruising over time using nir hyperspectral reflectance imaging with optimum wavelengths. Postharvest Biol. Technol. 2017, 134, 55–66. [Google Scholar] [CrossRef]
  30. Li, J.; Zhang, L.; Zhu, F.; Song, Y.; Yu, K.; Zhao, Y. Rapid qualitative detection of titanium dioxide adulteration in persimmon icing using portable raman spectrometer and machine learning. Spectrochim. Acta Part A Mol. Biomol. Spectrosc. 2023, 290, 122221. [Google Scholar] [CrossRef]
  31. Ruttanadech, N.; Phetpan, K.; Srisang, N.; Srisang, S.; Chungcharoen, T.; Limmun, W.; Youryon, P.; Kongtragoul, P. Rapid and accurate classification of Aspergillus ochraceous contamination in robusta green coffee bean through near-infrared spectral analysis using machine learning. Food Control 2023, 145, 109446. [Google Scholar] [CrossRef]
  32. Jiarpinijnun, A.; Osako, K.; Siripatrawan, U. Visualization of volatomic profiles for early detection of fungal infection on storage jasmine brown rice using electronic nose coupled with chemometrics. Measurement 2020, 157, 107561. [Google Scholar] [CrossRef]
  33. Ordukaya, E.; Karlik, B. Quality control of olive oils using machine learning and electronic nose. J. Food Qual. 2017, 2017, 9272404. [Google Scholar] [CrossRef]
  34. Yoon, H.S.; Kwon, J.H.; Bae, M.J.; Hwang, J.H. Studies on the development of food resources from waste seeds iv. Chemical composition of red pepper seed. J. Korean Soc. Food Sci. Nutr. 1983, 12, 46–50. [Google Scholar]
  35. Zhang, J.; Dai, L.; Cheng, F. Identification of corn seeds with different freezing damage degree based on hyperspectral reflectance imaging and deep learning method. Food Anal. Methods 2021, 14, 389–400. [Google Scholar] [CrossRef]
  36. Nugrahaeni, R.A.; Mutijarsa, K. Comparative analysis of machine learning knn, svm, and random forests algorithm for facial expression classification. In Proceedings of the 2016 International Seminar on Application for Technology of Information and Communication (ISemantic), Semarang, Indonesia, 5–6 August 2016; IEEE: Piscataway, NJ, USA, 2016; pp. 163–168. [Google Scholar]
  37. Phillips, T.; Abdulla, W. A new honey adulteration detection approach using hyperspectral imaging and machine learning. Eur. Food Res. Technol. 2023, 249, 259–272. [Google Scholar] [CrossRef]
Figure 1. Principal component analysis (PCA) score plot for different pericarp/seed ratios and Allura Red concentrations. P0: pure seeds; P25: pepper powder consisting of 25% pericarp and 75% seeds; P50: pepper powder consisting of 50% pericarp and 50% seeds; P75: pepper powder consisting of 75% pericarp and 25% seeds; P100: pure pericarp; A, B, and C: Allura Red concentrations of 0.05%, 0.1%, and 0.15%, respectively, in the pericarp, seeds, and pericarp/seed mixture.
Foods 12 03471 g001
Figure 2. Shortwave infrared (SWIR) spectra (a), principal component analysis score (b), and loading plots (c) of red pepper powder with different pericarp and seed ratios (P0-P100) and SWIR spectra (d), principal component analysis score (e), and loading plots (f) of red pepper powder with Allura Red. P0: pure seeds; P25: pepper powder consisting of 25% pericarp and 75% seeds; P50: pepper powder consisting of 50% pericarp and 50% seeds; P75: pepper powder consisting of 75% pericarp and 25% seeds; P100: pure pericarp; P100C: pericarp adulterated with 0.15% Allura Red; R: Allura Red.
Foods 12 03471 g002
Figure 3. Principal component analysis score (a) and loading plots (b) of red pepper powder with different pericarp/seed ratios and Allura Red concentrations. P0: pure seeds; P25: pepper powder consisting of 25% pericarp and 75% seeds; P50: pepper powder consisting of 50% pericarp and 50% seeds; P75: pepper powder consisting of 75% pericarp and 25% seeds; P100: pure pericarp; A, B, and C: Allura Red concentrations in the pericarp, seeds, and pericarp/seed mixture at 0.05%, 0.1%, and 0.15%, respectively.
Foods 12 03471 g003
Figure 4. The first five wavelengths with high importance scores (a) and the classification accuracy by a selected number of features (b) from the minimum redundancy maximal relevance algorithm for 20-class classification. LDA: linear discriminant analysis; LVSM: linear support vector machine; KNN: k-nearest neighbors.
Foods 12 03471 g004
Figure 5. Confusion matrices of LDA in the training set for classification of red pepper powder by Allura Red concentration and pericarp/seed ratio (P0, P0A-C (a), P25, P25A-C (b), P50, P50A-C (c), P75, P75A-C (d), and P100, P100A-C (e), 20-class classification). P0: pure seeds; P25: pepper powder consisting of 25% pericarp and 75% seeds; P50: pepper powder consisting of 50% pericarp and 50% seeds; P75: pepper powder consisting of 75% pericarp and 25% seeds; P100: pure pericarp; A, B, and C: Allura Red concentrations in the pericarp, seeds, and pericarp/seed mixture at 0.05%, 0.1%, and 0.15%, respectively.
Foods 12 03471 g005
Figure 6. The first five wavelengths with high importance scores (a) and the classification accuracy by a selected number of features (b) from the minimum redundancy maximal relevance algorithm for 4-class classification. LDA: linear discriminant analysis; LSVM: linear support vector machine; KNN: k-nearest neighbors.
Foods 12 03471 g006
Figure 7. Confusion matrices of LDA (a), LSVM (b), and KNN (c) in the training set for classification of red pepper powder by adulterant types (4-class classification). Acceptable (P100 and P75), adulterated with Allura Red (Ad-R; P100A-C and P75A-C), adulterated with seeds (Ad-S; P0-50), and adulterated with seeds and Allura Red (Ad-SR; P0A-C, P25A-C, P50A-C, and P75A-C).
Foods 12 03471 g007
Table 1. Appearance and composition of red pepper powder.
GroupAppearancePericarp (%)Seed (%)Allura Red (%)
P0Foods 12 03471 i001100.000.000.00
P0AFoods 12 03471 i00299.950.000.05
P0BFoods 12 03471 i00399.900.000.10
P0CFoods 12 03471 i00499.850.000.15
P25Foods 12 03471 i00575.0025.000.00
P25AFoods 12 03471 i00674.9624.990.05
P25BFoods 12 03471 i00774.9324.980.10
P25CFoods 12 03471 i00874.8924.960.15
P50Foods 12 03471 i00950.0050.000.00
P50AFoods 12 03471 i01049.9849.980.05
P50BFoods 12 03471 i01149.9549.950.10
P50CFoods 12 03471 i01249.9349.930.15
P75Foods 12 03471 i01325.0075.000.00
P75AFoods 12 03471 i01424.9974.960.05
P75BFoods 12 03471 i01524.9874.930.10
P75CFoods 12 03471 i01624.9674.890.15
P100Foods 12 03471 i0170.00100.000.00
P100AFoods 12 03471 i0180.0099.950.05
P100BFoods 12 03471 i0190.0099.900.10
P100CFoods 12 03471 i0200.0099.850.15
P0: pure seeds; P25: pepper powder consisting of 25% pericarp and 75% seeds; P50: pepper powder consisting of 50% pericarp and 50% seeds; P75: pepper powder consisting of 75% pericarp and 25% seeds; P100: pure pericarp; A, B, and C: Allura Red concentrations of 0.05%, 0.1%, and 0.15%, respectively, in the pericarp, seeds, and pericarp/seed mixture.
Table 2. Color values for different pericarp/seed ratios and Allura Red concentrations.
L*a*b*Hue AngleChroma
P058.6 ± 0.7m26.6 ± 1.1a52.3 ± 1.5gh63.1 ± 0.7n58.7 ± 1.7de
P0A43.2 ± 0.5k31.1 ± 0.3b34.1 ± 0.6a47.7 ± 0.5c46.2 ± 0.6a
P0B41.1 ± 0.6j38.9 ± 0.3h34.9 ± 0.5a41.8 ± 0.3a52.3 ± 0.5c
P0C37.3 ± 0.5gh36.9 ± 0.6efg34.1 ± 0.6a42.7 ± 0.4a50.2 ± 0.8b
P2549.8 ± 1.0l33.7 ± 0.8c48.2 ± 1.3c55.0 ± 1.0ij58.8 ± 1.2de
P25A41.0 ± 0.5j37.1 ± 0.2fg43.2 ± 1.1b49.4 ± 0.7d57.0 ± 0.9d
P25B38.9 ± 0.5i40.4 ± 0.2i44.6 ± 0.6b47.8 ± 0.4c60.2 ± 0.5ef
P25C37.7 ± 0.4h41.9 ± 0.1j43.3 ± 1.0b46.0 ± 0.6b60.2 ± 0.8ef
P5043.5 ± 0.5k36.2 ± 0.5de49.1 ± 1.3cde53.6 ± 0.8gh61.0 ± 1.1f
P50A38.5 ± 0.4i37.1 ± 0.4fg48.6 ± 1.1cd52.7 ± 0.7fg61.2 ± 0.9f
P50B35.9 ± 0.5f40.2 ± 0.5i49.5 ± 1.9cde50.9 ± 0.9e63.8 ± 1.8g
P50C33.4 ± 1.0d41.4 ± 0.5j50.5 ± 1.0ef50.7 ± 0.5e65.3 ± 1.0gh
P7536.8 ± 0.6g36.1 ± 0.5d50.0 ± 1.3def54.1 ± 0.6hi61.6 ± 1.3f
P75A34.1 ± 0.4e37.6 ± 0.4g55.8 ± 1.7i56.0 ± 0.8kl67.3 ± 1.5ij
P75B33.2 ± 0.4cd39.9 ± 0.5i56.4 ± 0.7i54.7 ± 0.3ij69.1 ± 0.8j
P75C32.5 ± 0.4bc39.9 ± 0.4i53.8 ± 1.0h53.4 ± 0.3fgh67.0 ± 1.0hi
P10029.7 ± 0.6a36.7 ± 1.1def47.9 ± 2.4c52.5 ± 0.6f60.4 ± 2.5ef
P100A32.9 ± 0.5cd31.4 ± 0.4b51.6 ± 1.4fg58.7 ± 0.4m60.4 ± 1.4ef
P100B32.6 ± 0.7bcd37.4 ± 0.5fg55.8 ± 1.2i56.2 ± 0.46l67.2 ± 1.2hij
P100C32.0 ± 0.7b37.2 ± 0.5fg53.6 ± 1.0h55.2 ± 0.3jk65.3 ± 1.1gh
Means in the same column with different letters are significantly different as per Tukey’s test (p < 0.05). P0: pure seeds; P25: pepper powder consisting of 25% pericarp and 75% seeds; P50: pepper powder consisting of 50% pericarp and 50% seeds; P75: pepper powder consisting of 75% pericarp and 25% seeds; P100: pure pericarp; A, B, and C: Allura Red concentrations of 0.05%, 0.1%, and 0.15%, respectively, in the pericarp, seeds, and pericarp/seed mixture.
Table 3. Capsaicin content of pericarp and seed of red pepper.
PericarpSeed
Capsaicin (mg/kg)47.6 ± 0.22.0 ± 0.1
Dihydrocapsaicin (mg/kg)32.0 ± 0.11.3 ± 0.1
Table 4. Machine learning results for the classification of red pepper powder by different Allura Red concentrations and pericarp/seed ratio (20-class classification).
Feature Number AccuracyRecallPrecisionF1_Score
Linear discriminant analysis
(LDA)
35Train100.0100.0100.0100.0
Test98.997.898.097.8
Linear support vector machine
(LSVM)
20Train85.585.587.185.3
Test85.685.686.485.2
K-nearest neighbors
(KNN)
20Train76.977.077.076.9
Test80.680.681.080.0
Table 5. Machine learning results for classification of red pepper powder by adulterant types (4-class classification).
Feature Number AccuracyRecallPrecisionF1_Score
Linear discriminant analysis
(LDA)
35Train100.0100.0100.0100.0
Test100.0100.0100.0100.0
Linear support vector machine
(LSVM)
20Train99.599.299.599.3
Test99.499.199.799.4
K-nearest neighbors
(KNN)
35Train99.099.399.199.2
Test99.499.199.799.4
Disclaimer/Publisher’s Note: The statements, opinions and data contained in all publications are solely those of the individual author(s) and contributor(s) and not of MDPI and/or the editor(s). MDPI and/or the editor(s) disclaim responsibility for any injury to people or property resulting from any ideas, methods, instructions or products referred to in the content.

