
Strategies to Formulate Value-Added Pastry Products from Composite Flours Based on Spelt Flour and Grape Pomace Powder

 , ,
, ,  and
and
Abstract
:
1. Introduction
2. Materials and Methods
2.1. Chemicals and Reagents
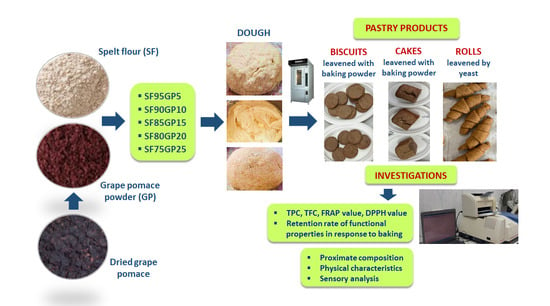
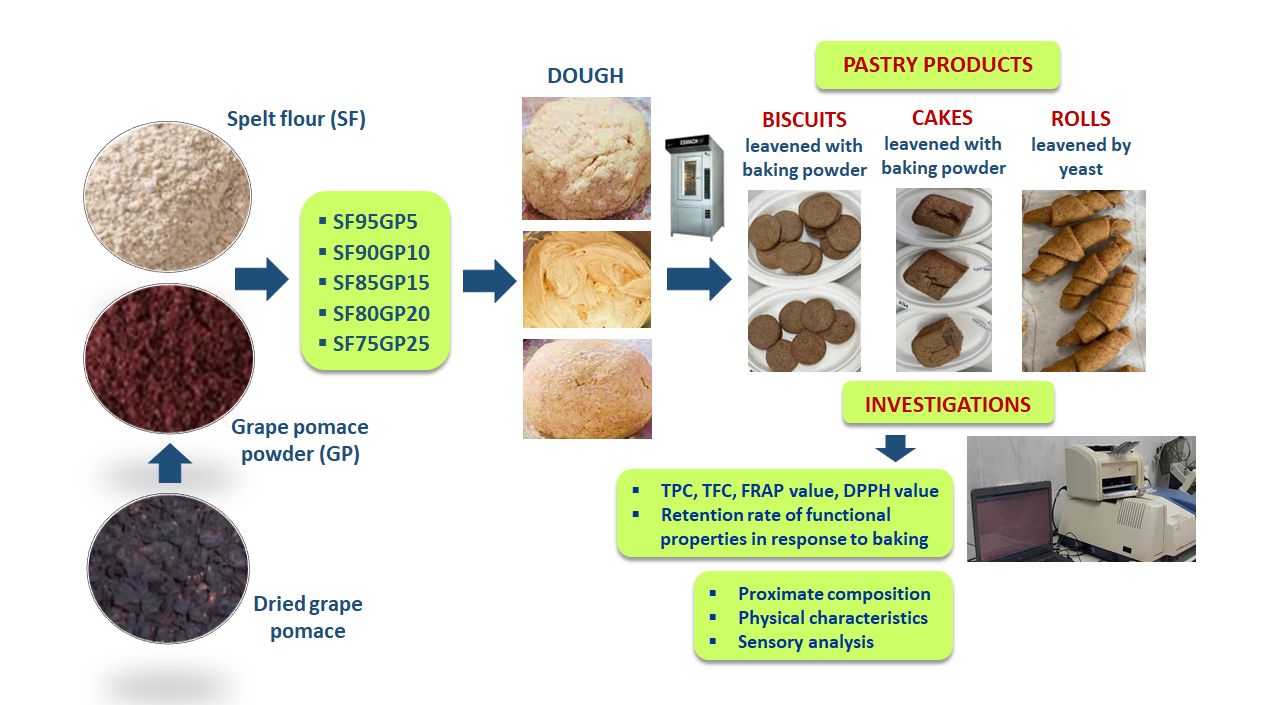
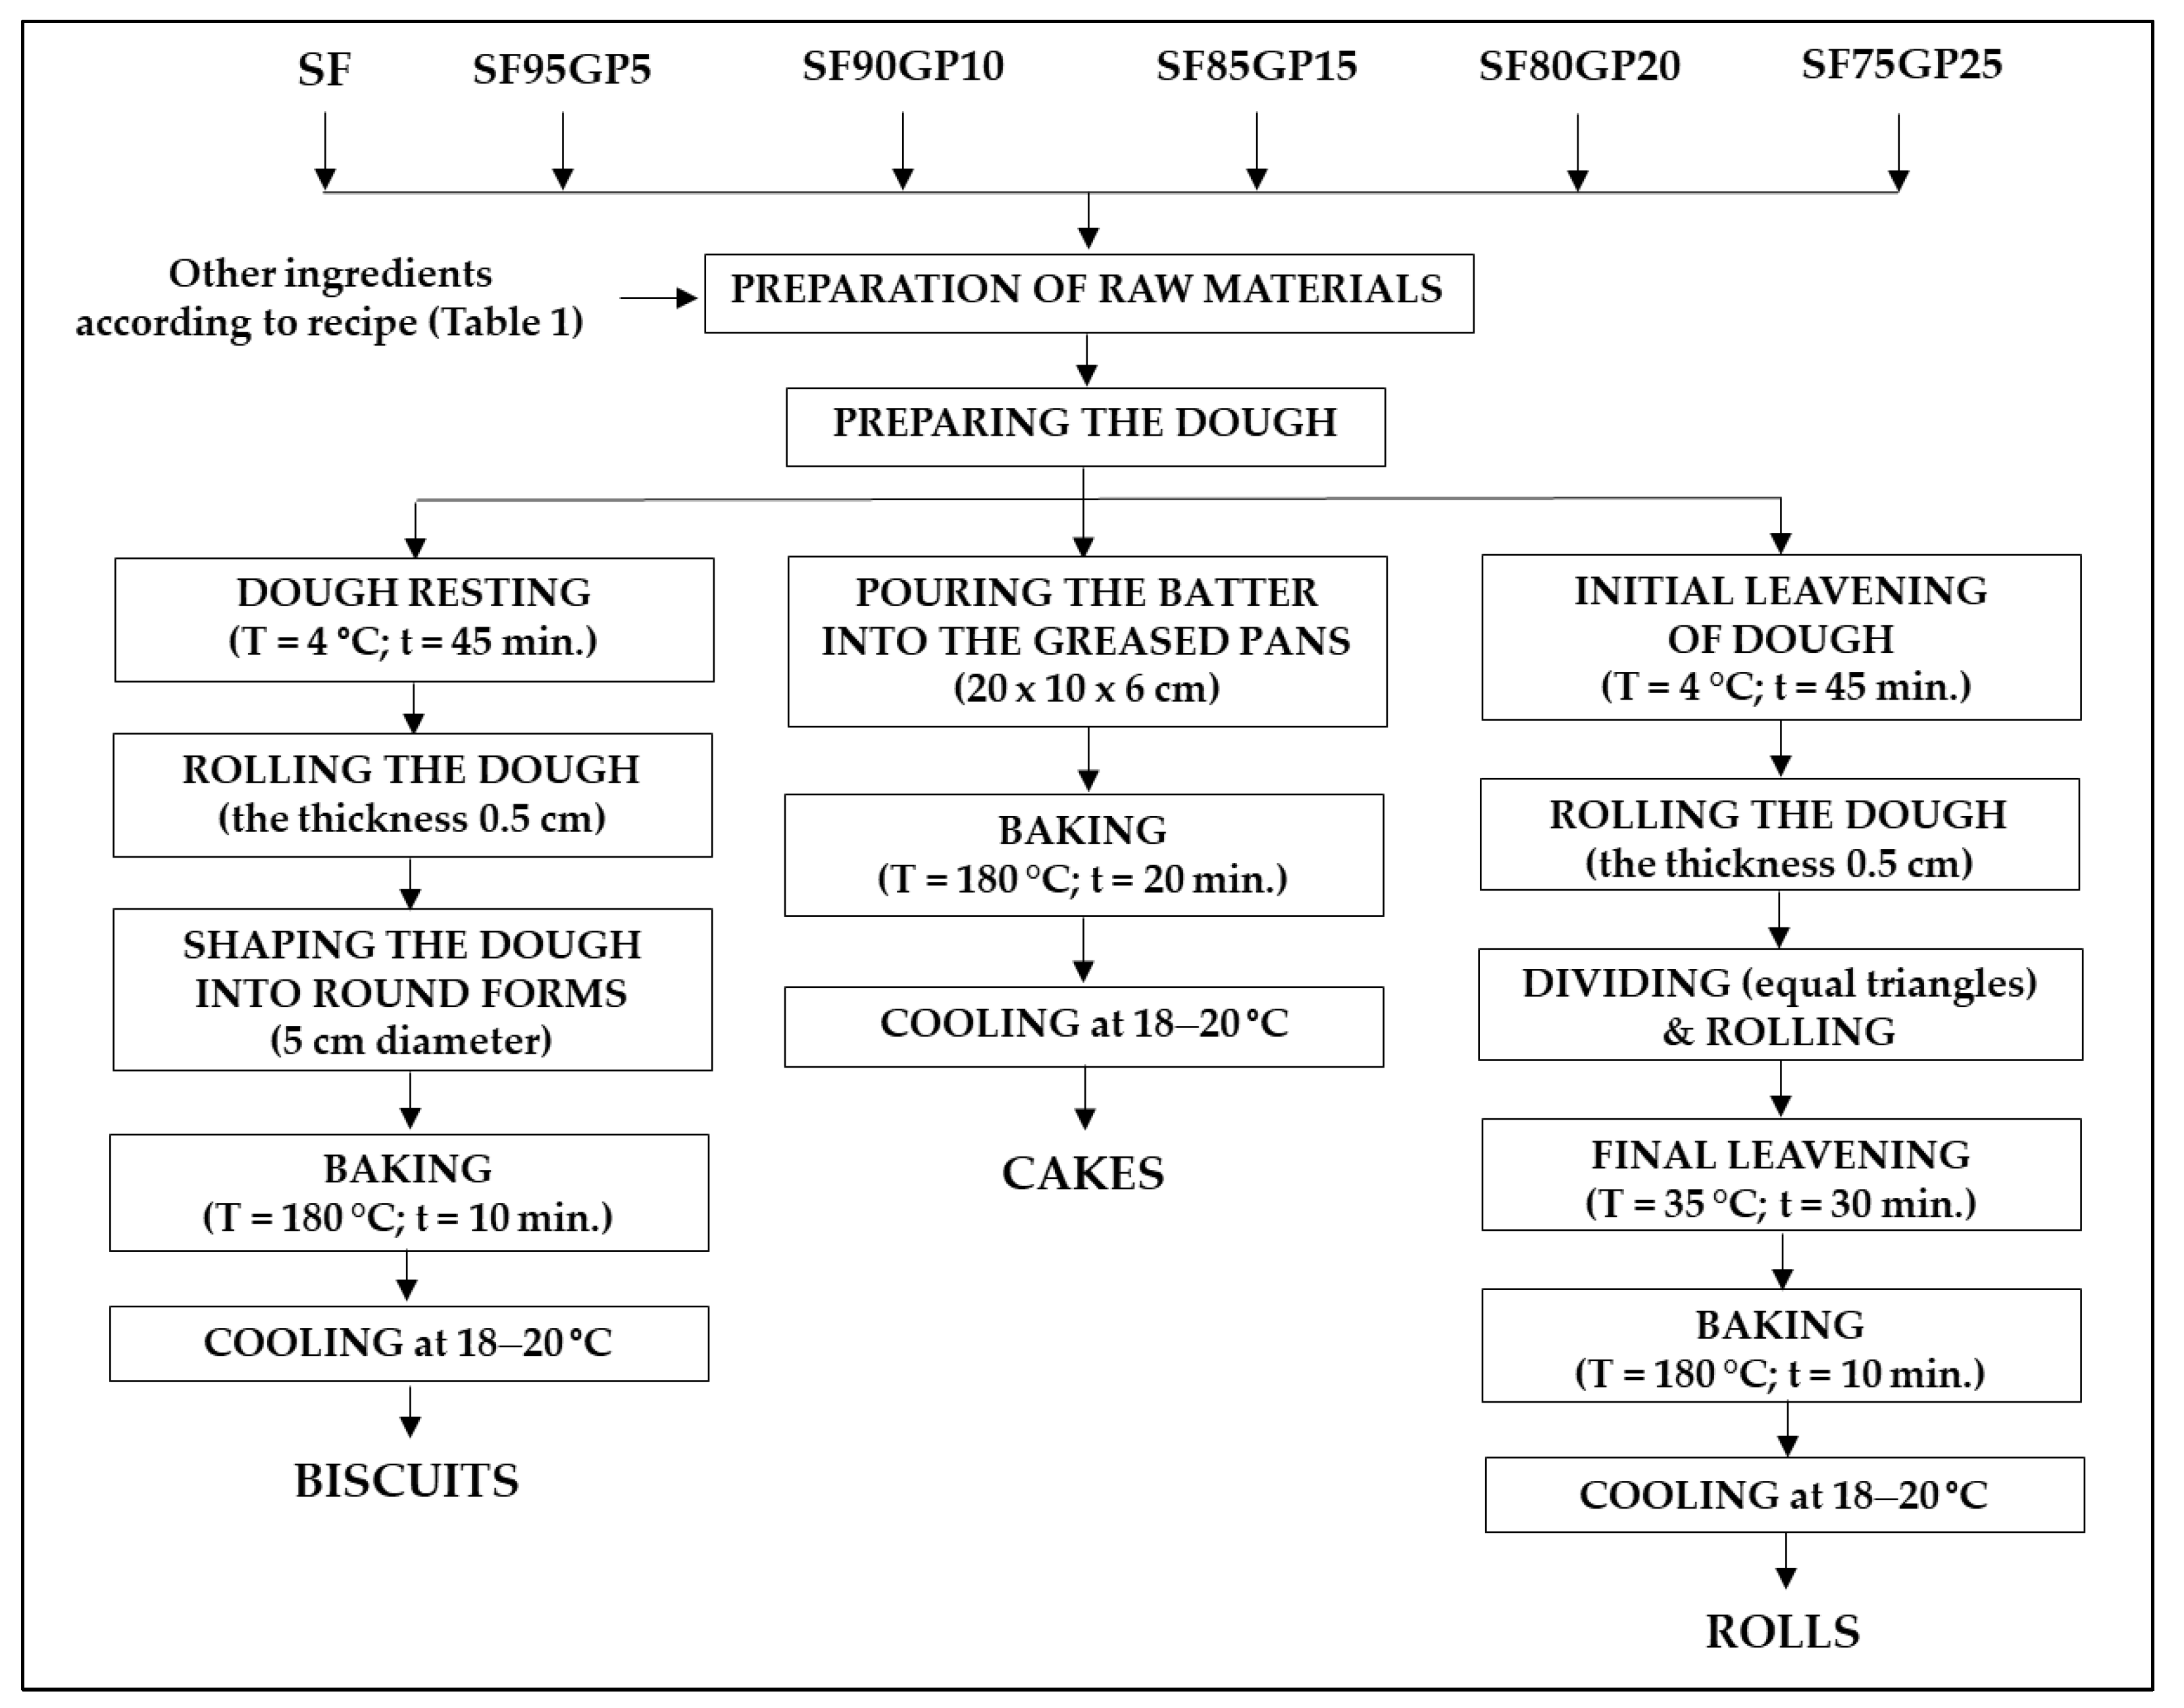
2.2. Ingredients and Manufacture of Pastry Products
2.3. Proximate Composition and Energy Value Evaluation of SF, GP and Pastry Products
2.4. Phytochemical Content and Antioxidant Activity of SF, GP and Pastry Products
2.4.1. Alcoholic Extract Preparation
2.4.2. Evaluation of Total Phenolic Content
2.4.3. Evaluation of Total Flavonoids Content (TFC)
2.4.4. Assessment of Antioxidant Activity by 1,1-Diphenyl-2-picrylhydrazyl (DPPH) Assay
2.4.5. Assessment of Antioxidant Activity by Ferric-Reducing Antioxidant Power (FRAP) Assay
2.5. Assessment of Physical Characteristics
2.6. Sensory Evaluation
2.7. Statistical Analysis
3. Results and Discussion
3.1. Proximate Composition of GP, SF and Pastry Products
3.2. Phytochemical Content and Antioxidant Activity of GP and SF
3.3. Phytochemical Content and Antioxidant Activity of Dough and Pastry Products
3.4. Retention Rate of Phytochemical Content and Antioxidant Activity in Pastry Products in Response to Baking
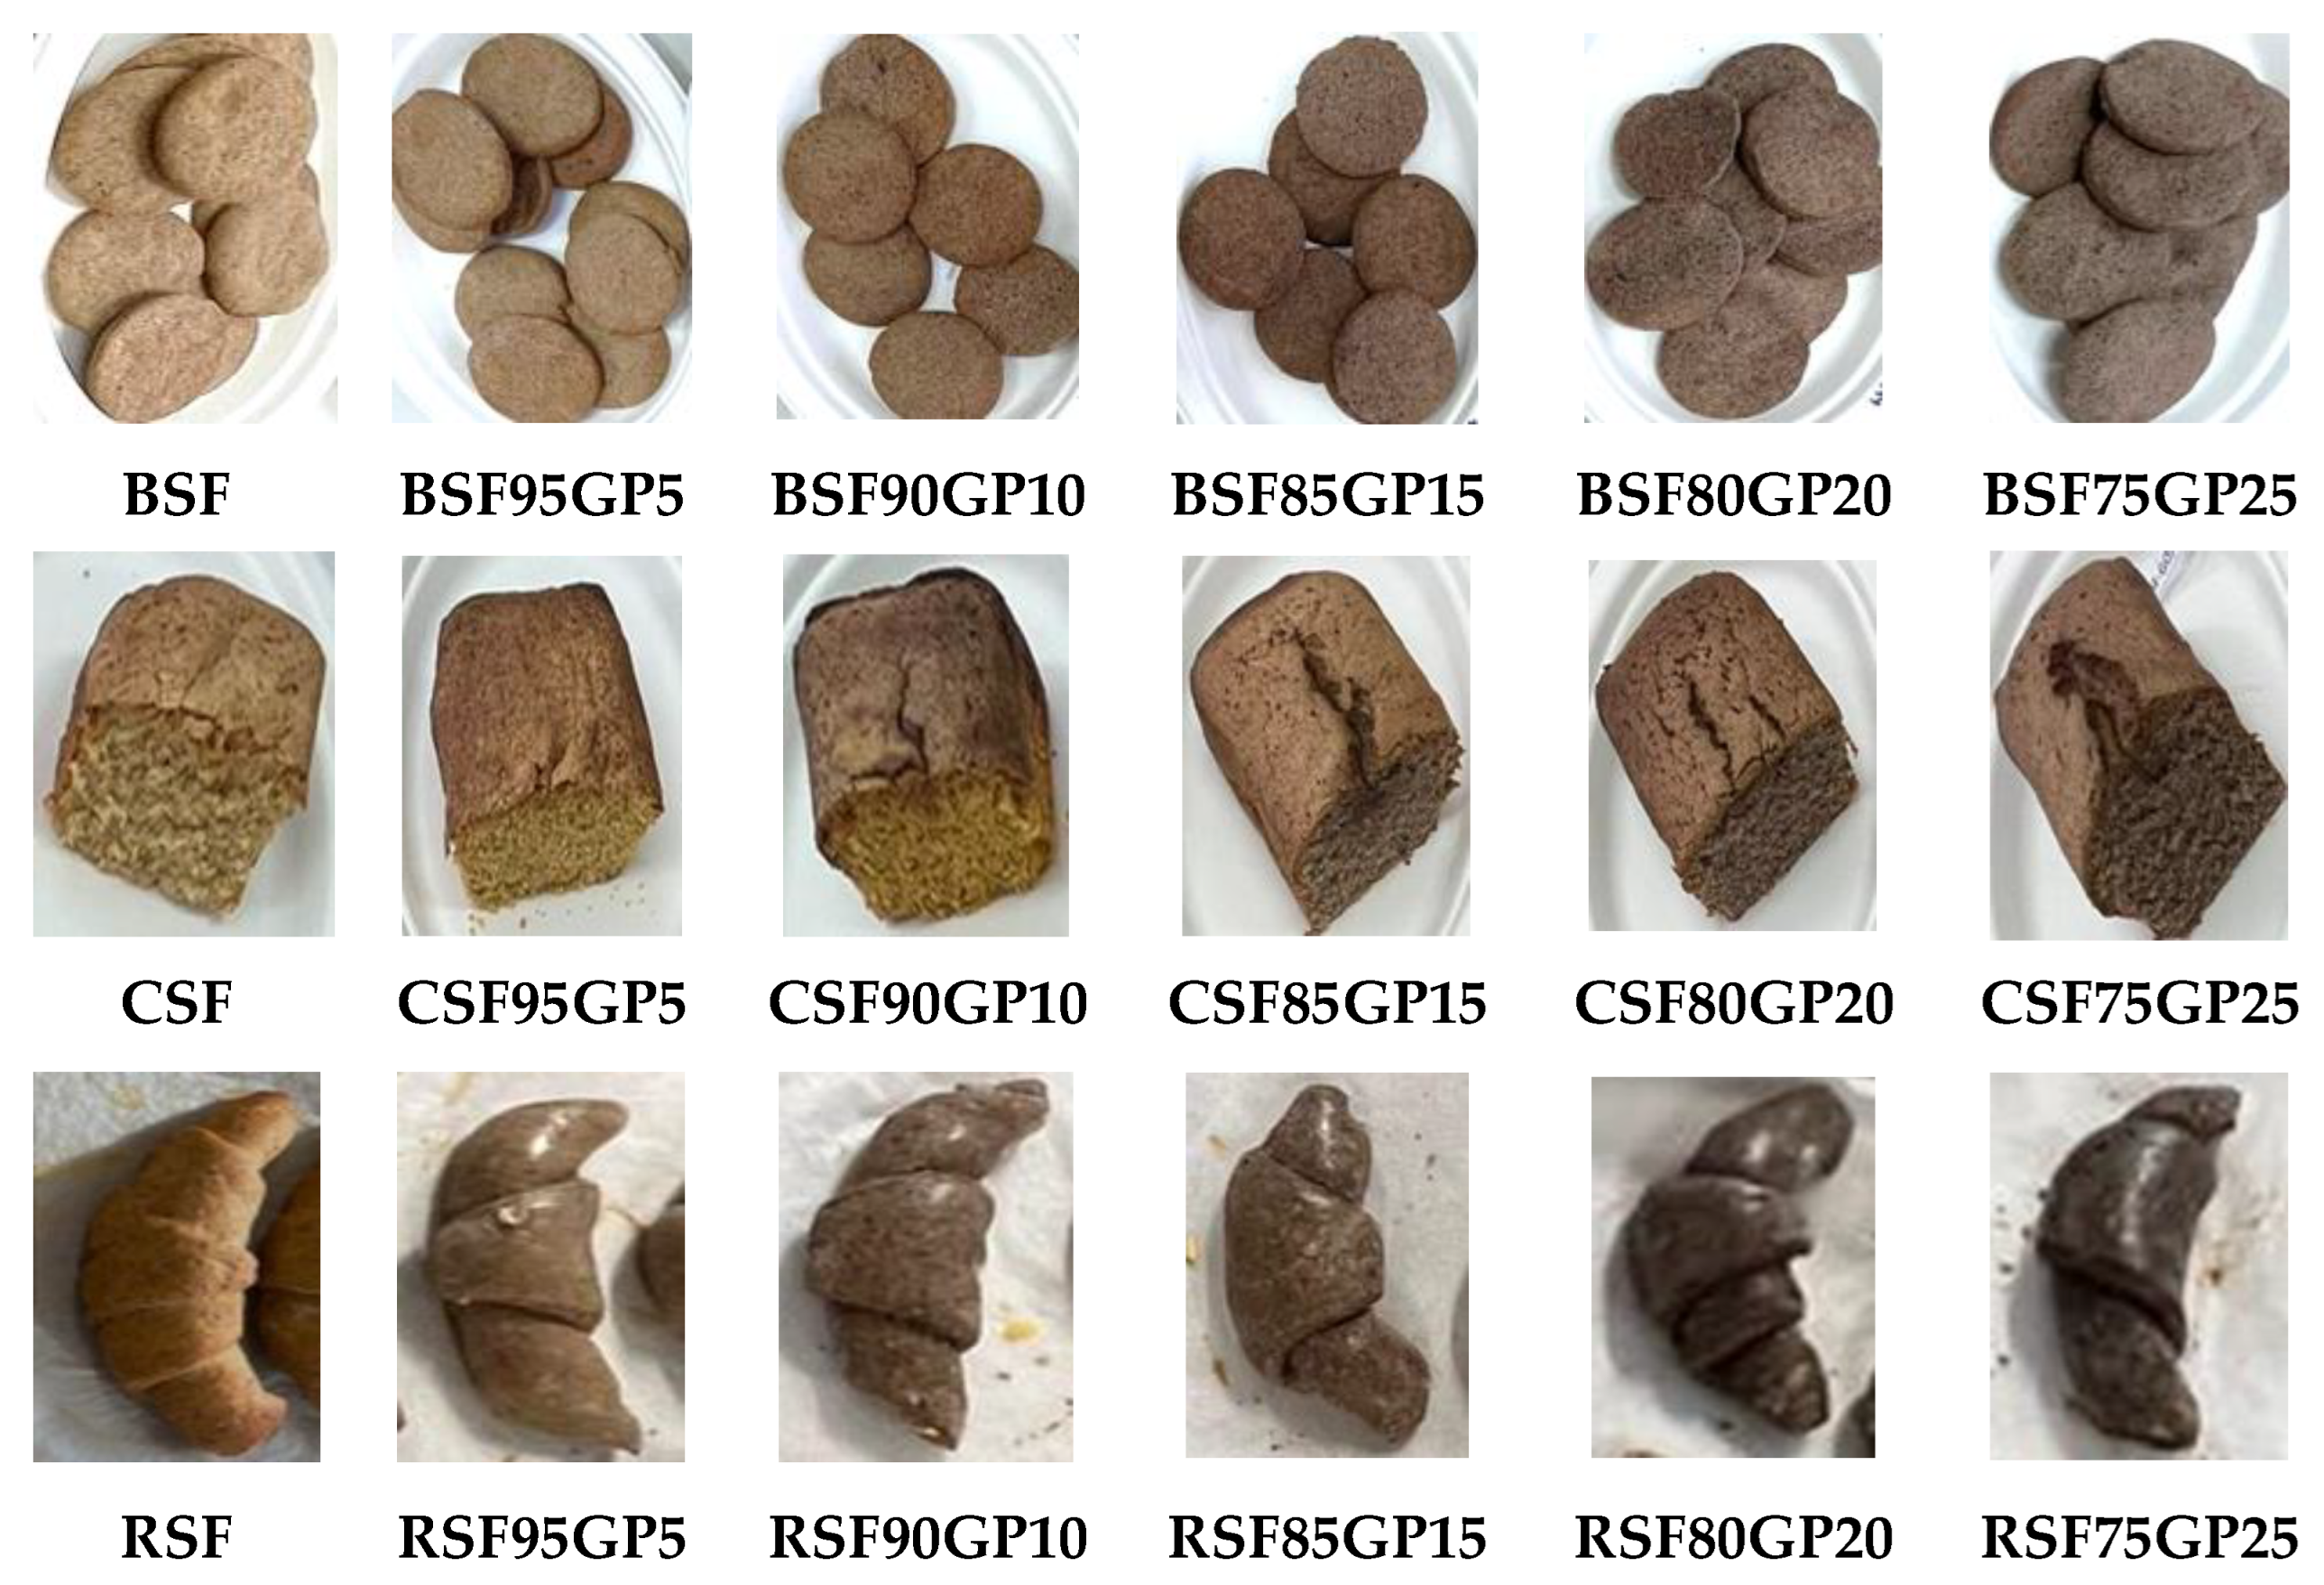
3.5. Physical Characteristics of Pastry Products
3.6. Sensory Evaluation of Pastry Products
4. Conclusions
Author Contributions
Funding
Institutional Review Board Statement
Informed Consent Statement
Data Availability Statement
Acknowledgments
Conflicts of Interest
References
- Nakov, G.; Brandolini, A.; Estivi, L.; Bertuglia, K.; Ivanova, N.; Jukić, M.; Komlenić, D.K.; Lukinac, J.; Hidalgo, A. Effect of Tomato Pomace Addition on Chemical, Technological, Nutritional, and Sensorial Properties of Cream Crackers. Antioxidants 2022, 11, 2087. [Google Scholar] [CrossRef]
- Trigo, J.P.; Alexandre, E.M.; Saraiva, J.A.; Pintado, M.E. High value-added compounds from fruit and vegetable by-products–Characterization, bioactivities, and application in the development of novel food products. Crit. Rev. Food Sci. Nutr. 2022, 60, 1388–1416. [Google Scholar] [CrossRef]
- Antonic, B.; Dordevic, D.; Jancikova, S.; Holeckova, D.; Tremlova, B.; Kulawik, P. Effect of Grape Seed Flour on the Antioxidant Profile, Textural and Sensory Properties of Waffles. Processes 2021, 9, 131. [Google Scholar] [CrossRef]
- Tournour, H.H.; Segundo, M.A.; Magalhaes, L.M.; Barreiros, L.; Queiroz, J.; Cunha, L.M. Valorization of grape pomace: Extraction of bioactive phenolics with antioxidant properties. Ind. Crops Prod. 2015, 74, 397–406. [Google Scholar] [CrossRef]
- Lau, K.Q.; Sabran, M.R.; Shafie, S.R. Utilization of vegetable and fruit by-products as functional ingredient and food. Front. Nutr. 2021, 8, 661693. [Google Scholar] [CrossRef] [PubMed]
- Beres, C.; Costa, G.N.; Cabezudo, I.; Da Silva-James, N.K.; Teles, A.S.; Cruz, A.P.; Mellinger-Silva, C.; Tonon, R.V.; Cabral, L.M.; Freitas, S.P. Towards integral utilization of grape pomace from winemaking process: A review. Waste Manag. 2017, 68, 581–594. [Google Scholar] [CrossRef] [PubMed]
- Gómez-Brandón, M.; Lores, M.; Insam, H.; Domínguez, J. Strategies for recycling and valorization of grape marc. Crit. Rev. Biotechnol. 2019, 39, 437–450. [Google Scholar] [CrossRef]
- Iuga, M.; Mironeasa, S. Potential of grape byproducts as functional ingredients in baked goods and pasta. Compr. Rev. Food Sci. Food Saf. 2020, 19, 2473–2505. [Google Scholar] [CrossRef] [PubMed]
- Yu, J.; Ahmedna, M. Functional components of grape pomace: Their composition, biological properties and potential applications. Int. J. Food Sci. Technol. 2013, 48, 221–237. [Google Scholar] [CrossRef]
- García-Lomillo, J.; González-SanJosé, M.L. Applications of wine pomace in the food industry: Approaches and functions. Compr. Rev. Food Sci. Food Saf. 2017, 16, 3–22. [Google Scholar] [CrossRef]
- Pinelo, M.; Rubilar, M.; Jerez, M.; Sineiro, J.; Núñez, M.J. Effect of solvent, temperature, and solvent-to-solid ratio on the total phenolic content and antiradical activity of extracts from different components of grape pomace. J. Agric. Food Chem. 2005, 53, 2111–2117. [Google Scholar] [CrossRef]
- Monteiro, G.C.; Minatel, I.O.; Junior, A.P.; Gomez-Gomez, H.A.; de Camargo, J.P.C.; Diamante, M.S.; Pereira Basilio, L.S.; Tecchio, M.A.; Lima, G.P.P. Bioactive compounds and antioxidant capacity of grape pomace flours. LWT-Food Sci. Technol. 2021, 135, 110053. [Google Scholar] [CrossRef]
- Ferrer-Gallego, R.; Silva, P. The Wine Industry By-Products: Applications for Food Industry and Health Benefits. Antioxidants 2022, 11, 2025. [Google Scholar] [CrossRef] [PubMed]
- Bender, A.B.; Speroni, C.S.; Salvador, P.R.; Loureiro, B.B.; Lovatto, N.M.; Goulart, F.R.; Lovattoc, M.T.; Mirandad, M.Z.; Silvab, L.P.; Penna, N.G. Grape pomace skins and the effects of its inclusion in the technological properties of muffins. J. Culin. Sci. Technol. 2017, 15, 143–157. [Google Scholar] [CrossRef]
- Chowdhary, P.; Gupta, A.; Gnansounou, E.; Pandey, A.; Chaturvedi, P. Current trends and possibilities for exploitation of Grape pomace as a potential source for value addition. Environ. Pollut. 2021, 278, 116796. [Google Scholar] [CrossRef]
- Troilo, M.; Difonzo, G.; Paradiso, V.M.; Pasqualone, A.; Caponio, F. Grape Pomace as Innovative Flour for the Formulation of Functional Muffins: How Particle Size Affects the Nutritional, Textural and Sensory Properties. Foods 2022, 11, 1799. [Google Scholar] [CrossRef]
- Muhlack, R.A.; Potumarthi, R.; Jeffery, D.W. Sustainable wineries through waste valorisation: A review of grape marc utilisation for value-added products. Waste Manag. 2018, 72, 99–118. [Google Scholar] [CrossRef]
- Torbica, A.; Škrobot, D.; Hajnal, E.J.; Belović, M.; Zhang, N. Sensory and physico-chemical properties of wholegrain wheat bread prepared with selected food by-products. LWT-Food Sci. Technol. 2019, 114, 108414. [Google Scholar] [CrossRef]
- Boff, J.M.; Strasburg, V.J.; Ferrari, G.T.; de Oliveira Schmidt, H.; Manfroi, V.; de Oliveira, V.R. Chemical, Technological, and Sensory Quality of Pasta and Bakery Products Made with the Addition of Grape Pomace Flour. Foods 2022, 11, 3812. [Google Scholar] [CrossRef] [PubMed]
- Hayta, M.; Özuğur, G.; Etgü, H.; Şeker, İ.T. Effect of Grape (Vitis vinifera L.) Pomace on the Quality, Total Phenolic Content and Anti-Radical Activity of Bread. J. Food Process. Preserv. 2014, 38, 980–986. [Google Scholar] [CrossRef]
- Šporin, M.; Avbelj, M.; Kovač, B.; Možina, S.S. Quality characteristics of wheat flour dough and bread containing grape pomace flour. Food Sci. Technol. Int. 2018, 24, 251–263. [Google Scholar] [CrossRef]
- Rosales Soto, M.U.; Brown, K.; Ross, C.F. Antioxidant activity and consumer acceptance of grape seed flour-containing food products. Int. J. Food Sci. Technol. 2012, 47, 592–602. [Google Scholar] [CrossRef]
- Samohvalova, O.; Grevtseva, N.; Brykova, T.; Grigorenko, A. The effect of grape seed powder on the quality of butter biscuits. East. Eur. J. Enterpr. Technol. 2016, 3, 61–66. [Google Scholar] [CrossRef]
- Meral, R.; Doğan, İ.S. Grape seed as a functional food ingredient in bread-making. Int. J. Food Sci. Nutr. 2013, 64, 372–379. [Google Scholar] [CrossRef] [PubMed]
- Tolve, R.; Simonato, B.; Rainero, G.; Bianchi, F.; Rizzi, C.; Cervini, M.; Giuberti, G. Wheat Bread Fortification by Grape Pomace Powder: Nutritional, Technological, Antioxidant, and Sensory Properties. Foods 2021, 10, 75. [Google Scholar] [CrossRef] [PubMed]
- Mildner-Szkudlarz, S.; Bajerska, J.; Zawirska-Wojtasiak, R.; Górecka, D. White grape pomace as a source of dietary fibre and polyphenols and its effect on physical and nutraceutical characteristics of wheat biscuits. J. Sci. Food Agric. 2013, 93, 389–395. [Google Scholar] [CrossRef]
- Palma, M.L.; Nunes, M.C.; Gameiro, R.; Rodrigues, M.; Gothe, S.; Tavares, N.; Pego, C.; Nicolai, M.; Pereira, P. Preliminary sensory evaluation of salty crackers with grape pomace flour. Biomed. Biopharm. Res. 2020, 17, 33–43. [Google Scholar] [CrossRef]
- Sant’Anna, V.; Christiano, F.D.P.; Marczak, L.D.F.; Tessaro, I.C.; Thys, R.C.S. The effect of the incorporation of grape marc powder in fettuccini pasta properties. LWT-Food Sci. Technol. 2014, 58, 497–501. [Google Scholar] [CrossRef]
- Oliveira, B.E.; Contini, L.; Garcia, V.A.D.S.; Cilli, L.P.D.L.; Chagas, E.G.L.; Andreo, M.A.; Vanin, F.M.; Carvalho, R.A.; Sinnecker, P.; Venturini, A.C.; et al. Valorization of grape by-products as functional and nutritional ingredients for healthy pasta development. J. Food Process. Preserv. 2022, 46, e17245. [Google Scholar] [CrossRef]
- Nakov, G.; Brandolini, A.; Hidalgo, A.; Ivanova, N.; Stamatovska, V.; Dimov, I. Effect of grape pomace powder addition on chemical, nutritional and technological properties of cakes. LWT-Food Sci. Technol. 2020, 134, 109950. [Google Scholar] [CrossRef]
- Karnopp, A.R.; Figueroa, A.M.; Los, P.R.; Teles, J.C.; Simões, D.R.S.; Barana, A.C.; Kubiaki, F.T.; Oliveira, J.G.B.d.; Granato, D. Effects of whole-wheat flour and bordeaux grape pomace (Vitis labrusca L.) on the sensory, physicochemical and functional properties of cookies. Food Sci. Technol. 2015, 35, 750–756. [Google Scholar] [CrossRef]
- Fontana, M.; Murowaniecki Otero, D.; Pereira, A.M.; Santos, R.B.; Gularte, M.A. Grape Pomace Flour for Incorporation into Cookies: Evaluation of Nutritional, Sensory and Technological Characteristics. J. Culin. Sci. Technol. 2022, 1–20. [Google Scholar] [CrossRef]
- Gaita, C.; Alexa, E.; Moigradean, D.; Conforti, F.; Poiana, M.A. Designing of high value-added pasta formulas by incorporation of grape pomace skins. Rom. Biotechnol. Lett. 2020, 25, 1607–1614. [Google Scholar] [CrossRef]
- Rainero, G.; Bianchi, F.; Rizzi, C.; Cervini, M.; Giuberti, G.; Simonato, B. Breadstick fortification with red grape pomace: Effect on nutritional, technological and sensory properties. J. Sci. Food Agric. 2022, 102, 2545–2552. [Google Scholar] [CrossRef]
- Larrosa, A.P.Q.; Otero, D.M. Flour made from fruit by-products: Characteristics, processing conditions, and applications. J. Food Process. Preserv. 2021, 45, e15398. [Google Scholar] [CrossRef]
- Hasmadi, M.; Noorfarahzilah, M.; Noraidah, H.; Zainol, M.K.; Jahurul, M.H.A. Functional properties of composite flour: A review. Food Res. 2020, 4, 1820–1831. [Google Scholar] [CrossRef]
- Kohajdová, Z.; Karovicova, J. Nutritional value and baking application of spelt wheat. Acta Sci. Pol. Technol. Aliment. 2008, 7, 5–14. [Google Scholar]
- Biel, W.; Stankowski, S.; Jaroszewska, A.; Pużyński, S.; Bośko, P. The influence of selected agronomic factors on the chemical composition of spelt wheat (Triticum aestivum ssp. spelta L.) grain. J. Integr. Agric. 2016, 15, 1763–1769. [Google Scholar] [CrossRef]
- Escarnot, E.; Jacquemin, J.M.; Agneessens, R.; Paquot, M. Comparative study of the content and profiles of macronutrients in spelt and wheat, a review. Biotechnol. Agron. Soc. Environ. 2012, 16, 243–256. [Google Scholar]
- Wang, J.; Chatzidimitriou, E.; Wood, L.; Hasanalieva, G.; Markellou, E.; Iversen, P.O.; Seala, C.; Baranskib, M.; Vigarj, V.; Ernstj, L.; et al. Effect of wheat species (Triticum aestivum vs. T. spelta), farming system (organic vs. conventional) and flour type (wholegrain vs white) on composition of wheat flour–Results of a retail survey in the UK and Germany–2. Antioxidant activity, and phenolic and mineral content. Food Chem. 2020, 6, 100091. [Google Scholar] [CrossRef]
- Jung, J.; Cavender, G.; Zhao, Y. Impingement drying for preparing dried apple pomace flour and its fortification in bakery and meat products. J. Food Sci. Technol. 2015, 52, 5568–5578. [Google Scholar] [CrossRef]
- Santos, D.; da Silva, J.A.L.; Pintado, M. Fruit and vegetable by-products’ flours as ingredients: A review on production process, health benefits and technological functionalities. LWT-Food Sci. Technol. 2022, 154, 112707. [Google Scholar] [CrossRef]
- ISO 4833:2003; Microbiology of Food and Animal Feeding Stuffs—Horizontal Method for the Enumeration of Microorganisms—Colony-Count Technique at 30 Degrees C. ISO: Geneva, Switzerland, 2003.
- ISO 21528-2:2004; Microbiology of Food and Animal Feeding Stuffs—Horizontal Methods for the Detection and Enumeration of Enterobacteriaceae—Part 2: Colony-Count Method. ISO: Geneva, Switzerland, 2004.
- ISO 21527:2008; Microbiology of Food and Animal Feeding Stuffs—Horizontal Method for the Enumeration of Yeasts and Moulds—Part 2: Colony Count Technique in Products with Water Activity Less than or Equal to 0.95. ISO: Geneva, Switzerland, 2008.
- ISO 21871:2006; Microbiology of Food and Animal Feeding Stuffs—Horizontal Method for the Determination of Low Numbers of Presumptive Bacillus cereus—Most Probable Number Technique and Detection Method. ISO: Geneva, Switzerland, 2006.
- Commission Regulation (EC) No 2073/2005 of 15 November 2005 on Microbiological Criteria for Foodstuffs. Official Journal of the European Union L 338, 22.12.2005. pp. 1–26. Available online: https://www.eumonitor.eu/9353000/1/j4nvk6yhcbpeywk_j9vvik7m1c3gyxp/vi8rm2zgvzuf (accessed on 15 March 2023).
- Association of Official Analytical Chemists (AOAC). Official Methods of Analysis, 17th ed.; AOAC: Washington, DC, USA, 2000. [Google Scholar]
- Das, P.C.; Khan, M.J.; Rahman, M.S.; Majumder, S.; Islam, M.N. Comparison of the physico-chemical and functional properties of mango kernel flour with wheat flour and development of mango kernel flour based composite cakes. NFS J. 2019, 17, 1–7. [Google Scholar] [CrossRef]
- Litwinek, D.; Gumul, D.; Łukasiewicz, M.; Zięba, T.; Kowalski, S. The Effect of Red Potato Pulp Preparation and Stage of Its Incorporation into Sourdough or Dough on the Quality and Health-Promoting Value of Bread. Appl. Sci. 2023, 13, 7670. [Google Scholar] [CrossRef]
- Blanch, G.P.; Ruiz del Castillo, M.L. Effect of Baking Temperature on the Phenolic Content and Antioxidant Activity of Black Corn (Zea mays L.) Bread. Foods 2021, 10, 1202. [Google Scholar] [CrossRef] [PubMed]
- Al-Farsi, M.; Al-Amri, A.; Al-Hadhrami, A.; Al-Belushi, S. Color, flavonoids, phenolics and antioxidants of Omani honey. Heliyon 2018, 4, e00874. [Google Scholar] [CrossRef] [PubMed]
- Mekky, H.; El Sohafy, S.; Abu El-Khair, R.A.; El Hawiet, A.E. Total polyphenolic content and antioxidant activity of Silybum marianum cultures grown on different growth regulators. Int. J. Pharm. Pharm. Sci. 2017, 9, 44–47. [Google Scholar] [CrossRef]
- Metzner Ungureanu, C.-R.; Poiana, M.-A.; Cocan, I.; Lupitu, A.I.; Alexa, E.; Moigradean, D. Strategies to Improve the Thermo-Oxidative Stability of Sunflower Oil by Exploiting the Antioxidant Potential of Blueberries Processing Byproducts. Molecules 2020, 25, 5688. [Google Scholar] [CrossRef] [PubMed]
- SR 91:2007; Romanian Standard for Bread, Confectionery and Bakery Specialties—Methods of Analysis. ASRO—Romanian Standards Association: Bucharest, Romania, 2007.
- Raymundo, A.; Fradinho, P.; Nunes, M.C. Effect of Psyllium fibre content on the textural and rheological characteristics of biscuit and biscuit dough. Bioact. Carbohydr. Diet. Fibre 2014, 3, 96–105. [Google Scholar] [CrossRef]
- Alfonsi, A.; Coles, D.; Hasle, C.; Koppel, J.; Ladikas, M.; Schmucker von Koch, J.; Schroeder, D.; Sprumont, D.; Verbeke, W.; Zaruk, D. Guidance Note: Ethics and Food-Related Research; European Commission Ethics Review Sector: Brussels, Belgium, 2012.
- Pestorić, M.; Škrobot, D.; Žigon, U.; Šimurina, O.; Filipčev, B.; Belović, M.; Mišan, A. Sensory profile and preference mapping of cookies enriched with medicinal herbs. Int. J. Food Prop. 2017, 20, 350–361. [Google Scholar] [CrossRef]
- Beres, C.; Freitas, S.P.; de Oliveira Godoy, R.L.; de Oliveira, D.C.R.; Deliza, R.; Iacomini, M.; Mellinger-Silva, C.; Cabral, L.M.C. Antioxidant dietary fibre from grape pomace flour or extract: Does it make any difference on the nutritional and functional value? J. Funct. Foods 2019, 56, 276–285. [Google Scholar] [CrossRef]
- Yi, C.; Shi, J.; Kramer, J.; Xue, S.; Jiang, Y.; Zhang, M.; Ma, I.; Pohorly, J. Fatty acid composition and phenolic antioxidants of winemaking pomace powder. Food Chem. 2009, 114, 570–576. [Google Scholar] [CrossRef]
- Acun, S.; Gül, H. Effects of grape pomace and grape seed flours on cookie quality. Qual. Assur. Saf. Crop. Foods 2014, 6, 81–88. [Google Scholar] [CrossRef]
- Keriene, I.; Mankeviciene, A.; Bliznikas, S.; Jablonskyte-Rasce, D.; Maikštėnienė, S.; Česnulevičienė, R. Biologically active phenolic compounds in buckwheat, oats and winter spelt wheat. Zemdirb. Agric. 2015, 102, 289–296. [Google Scholar] [CrossRef]
- Rockenbach, I.; Rodrigues, E.; Gonzaga, L.V.; Genovese, M.I.; Gonçalves, A.E.; Fett, R. Phenolic compounds content and antioxidant activity in pomace from selected red grapes (Vitis vinifera L. and Vitis labrusca L.) widely produced in Brazil. Food Chem. 2011, 127, 174–179. [Google Scholar] [CrossRef]
- Iora, S.R.; Maciel, G.M.; Zielinski, A.A.; da Silva, M.V.; Pontes, P.V.D.A.; Haminiuk, C.W.; Granato, D. Evaluation of the bioactive compounds and the antioxidant capacity of grape pomace. Int. J. Food Sci. Technol. 2015, 50, 62–69. [Google Scholar] [CrossRef]
- Negro, C.; Aprile, A.; Luvisi, A.; De Bellis, L.; Miceli, A. Antioxidant Activity and Polyphenols Characterization of Four Monovarietal Grape Pomaces from Salento (Apulia, Italy). Antioxidants 2021, 10, 1406. [Google Scholar] [CrossRef]
- Cui, W.; Wang, Y.; Sun, Z.; Cui, C.; Li, H.; Luo, K.; Cheng, A. Effects of steam explosion on phenolic compounds and dietary fiber of grape pomace. LWT-Food Sci. Technol. 2023, 173, 114350. [Google Scholar] [CrossRef]
- Putnik, P.; Bursać Kovačević, D.; Radojčin, M.; Dragović-Uzelac, V. Influence of acidity and extraction time on the recovery of flavonoids from grape skin pomace optimized by response surface methodology. Chem. Biochem. Eng. Q. 2016, 30, 455–464. [Google Scholar] [CrossRef]
- Ivanišová, E.; Ondrejovič, M.; Šilhár, S. Antioxidant activity of milling fractions of selected cereals. Nova Biotechnol. Chim. 2012, 11, 45–56. [Google Scholar] [CrossRef]
- Sumczynski, D.; Bubelova, Z.; Sneyd, J.; Erb-Weber, S.; Mlcek, J. Total phenolics, flavonoids, antioxidant activity, crude fibre and digestibility in non-traditional wheat flakes and muesli. Food Chem. 2015, 174, 319–325. [Google Scholar] [CrossRef]
- Abdel-Aal, E.S.M.; Rabalski, I. Bioactive Compounds and their Antioxidant Capacity in Selected Primitive and Modern Wheat Species. Open Agric. J. 2008, 2, 7–14. [Google Scholar] [CrossRef]
- Maner, S.; Sharma, A.K.; Banerjee, K. Wheat flour replacement by wine grape pomace powder positively affects physical, functional and sensory properties of cookies. Proc. Natl. Acad. Sci. India Sect. B Biol. Sci. 2017, 87, 109–113. [Google Scholar] [CrossRef]
- Sęczyk, Ł.; Świeca, M.; Gawlik-Dziki, U. Changes of antioxidant potential of pasta fortified with parsley (Petroselinum Crispum mill.) leaves in the light of protein-phenolics interactions. Acta Sci. Pol. Technol. Aliment. 2015, 14, 29–36. [Google Scholar] [CrossRef] [PubMed]
- Kruczek, M.; Gumul, D.; Korus, A.; Buksa, K.; Ziobro, R. Phenolic Compounds and Antioxidant Status of Cookies Supplemented with Apple Pomace. Antioxidants 2023, 12, 324. [Google Scholar] [CrossRef]
- Ky, I.; Lorrain, B.; Kolbas, N.; Crozier, A.; Teissedre, P.-L. Wine by-Products: Phenolic Characterization and Antioxidant Activity Evaluation of Grapes and Grape Pomaces from Six Different French Grape Varieties. Molecules 2014, 19, 482–506. [Google Scholar] [CrossRef]
- Žilić, S.; Kocadağlı, T.; Vančetović, J.; Gökmen, V. Effects of baking conditions and dough formulations on phenolic compound stability, antioxidant capacity and color of cookies made from anthocyanin-rich corn flour. LWT 2016, 65, 597–603. [Google Scholar] [CrossRef]
- Francavilla, A.; Joye, I.J. Anthocyanin Content of Crackers and Bread Made with Purple and Blue Wheat Varieties. Molecules 2022, 27, 7180. [Google Scholar] [CrossRef]
- Santetti, G.S.; Dacoreggio, M.V.; Silva, A.C.M.; Biduski, B.; Bressiani, J.; Oro, T.; de Francisco, A.; Gutkoski, L.C.; Amboni, R.D.M.C. Effect of yerba mate (Ilex paraguariensis) leaves on dough properties, antioxidant activity, and bread quality using whole wheat flour. J. Food Sci. 2021, 86, 4354–4364. [Google Scholar] [CrossRef]
- Ozdal, T.; Capanoglu, E.; Altay, F. A review on protein-phenolic interactions and associated changes. Food Res. Int. 2013, 51, 954–970. [Google Scholar] [CrossRef]
- Chi, C.H.; Cho, S.J. Improvement of bioactivity of soybean meal by solid-state fermentation with Bacillus amyloliquefaciens versus Lactobacillus spp. and Saccharomyces cerevisiae. LWT-Food Sci. Technol. 2016, 68, 619–625. [Google Scholar] [CrossRef]
- Plustea, L.; Negrea, M.; Cocan, I.; Radulov, I.; Tulcan, C.; Berbecea, A.; Popescu, I.; Obistioiu, D.; Hotea, I.; Suster, G.; et al. Lupin (Lupinus spp.)-Fortified Bread: A Sustainable, Nutritionally, Functionally, and Technologically Valuable Solution for Bakery. Foods 2022, 11, 2067. [Google Scholar] [CrossRef] [PubMed]
- Dossa, S.; Negrea, M.; Cocan, I.; Berbecea, A.; Obistioiu, D.; Dragomir, C.; Alexa, E.; Rivis, A. Nutritional, Physico-Chemical, Phytochemical, and Rheological Characteristics of Composite Flour Substituted by Baobab Pulp Flour (Adansonia digitata L.) for Bread Making. Foods 2023, 12, 2697. [Google Scholar] [CrossRef]
- Lou, W.; Zhou, K.; Li, B.; Nataliya, G. Rheological, pasting and sensory properties of biscuits supplemented with grape pomace powder. Food Sci. Technol. 2022, 42, e78421. [Google Scholar] [CrossRef]
- Sharma, A.K.; Dagadkhair, R.A.; Somkuwar, R.G. Evaluation of grape pomace and quality of enriched cookies after standardizing baking conditions: Evaluation of grape pomace and quality of enriched cookies. J. AgriSearch 2018, 5, 50–55. [Google Scholar] [CrossRef]
- Azami, S.; Roufegari-Nejad, L. The Effect of Red Grape Pomace Powder Replacement on Physical Characteristics and Acrylamide Content of Biscuit. Iranian J. Nutr. Sci. Food Technol. 2019, 14, 109–117. [Google Scholar]
- Ajila, C.M.; Leelavathi, K.; Prasada Rao, U.J.S. Improvement of dietary fiber content and antioxidant properties in soft dough biscuits with the incorporation of mango peel powder. J. Cereal Sci. 2008, 48, 319–326. [Google Scholar] [CrossRef]


| Ingredients | BSF | BSF95GP5 | BSF90GP10 | BSF85GP15 | BSF80GP20 | BSF75GP25 |
|---|---|---|---|---|---|---|
| SF (g) | 250 | - | - | - | - | - |
| Composite flour (g) | - | 250 | 250 | 250 | 250 | 250 |
| Sugar (g) | 85 | 85 | 85 | 85 | 85 | 85 |
| Butter (g) | 125 | 125 | 125 | 125 | 125 | 125 |
| Eggs (g) | 60 | 60 | 60 | 60 | 60 | 60 |
| Baking powder (g) | 3.500 | 3.500 | 3.500 | 3.500 | 3.500 | 3.500 |
| Salt (g) | 1 | 1 | 1 | 1 | 1 | 1 |
| Total materials (g) | 524.500 | 524.500 | 524.5 | 524.5 | 524.5 | 524.5 |
| Biscuits (g) | 455.967 | 454.724 | 453.718 | 452.821 | 451.833 | 450.668 |
| CSF | CSF95GP5 | CSF90GP10 | CSF85GP15 | CSF80GP20 | CSF75GP25 | |
| SF (g) | 105 | - | - | - | - | - |
| Composite flour (g) | - | 105 | 105 | 105 | 105 | 105 |
| Sugar (g) | 105 | 105 | 105 | 105 | 105 | 105 |
| Butter (g) | 105 | 105 | 105 | 105 | 105 | 105 |
| Eggs (g) | 105 | 105 | 105 | 105 | 105 | 105 |
| Baking powder | 1.500 | 1.500 | 1.500 | 1.500 | 1.500 | 1.500 |
| Salt | 1 | 1 | 1 | 1 | 1 | 1 |
| Total materials (g) | 422.500 | 422.500 | 422.500 | 422.500 | 422.500 | 422.500 |
| Cakes (g) | 392.460 | 391.592 | 390.770 | 389.689 | 388.870 | 387.932 |
| RSF | RSF95GP5 | RSF90GP10 | RSF85GP15 | RSF80GP20 | RSF75GP25 | |
| SF (g) | 250 | - | - | - | - | - |
| Composite flour (g) | - | 250 | 250 | 250 | 250 | 250 |
| Sugar (g) | 50 | 50 | 50 | 50 | 50 | 50 |
| Milk (g) | 100 | 100 | 100 | 100 | 100 | 100 |
| Butter (g) | 37.500 | 37.500 | 37.500 | 37.500 | 37.500 | 37.500 |
| Eggs (g) | 60 | 60 | 60 | 60 | 60 | 60 |
| Yeast (g) | 20 | 20 | 20 | 20 | 20 | 20 |
| Salt (g) | 4.400 | 4.400 | 4.400 | 4.400 | 4.400 | 4.400 |
| Total materials (g) | 521.900 | 523.900 | 521.900 | 521.900 | 521.900 | 521.900 |
| Rolls (g) | 478.080 | 476.101 | 474.328 | 472.589 | 470.836 | 468.860 |
| Sample | Moisture (g/100 g) | Ash (g/100 g) | Protein (g/100 g) | Lipids (g/100 g) | Carbohydrates (g/100 g) | Sugar (g/100 g) | Energy Value (kcal/100 g) |
|---|---|---|---|---|---|---|---|
| SF | 12.291 ± 0.026 a | 1.608 ± 0.008 b | 14.594 ± 0.066 a | 2.506 ± 0.012 b | 69.001 | 1.619 ± 0.014 a | 356.934 |
| GP | 4.872 ± 0.011 b | 6.634 ± 0.023 a | 13.421 ± 0.054 b | 8.861 ± 0.043 a | 66.212 | 1.517 ± 0.011 b | 398.281 |
| Pastry products | |||||||
| BSF | 6.024 ± 0.030 a | 1.841 ± 0.006 f | 8.803 ± 0.027 a | 21.788 ± 0.071 e | 61.544 | 18.708 ± 0.075 a | 477.480 |
| BSF95GP5 | 5.767 ± 0.034 b | 1.927 ± 0.010 e | 8.678 ± 0.039 b | 21.916 ± 0.066 e | 61.712 | 18.664 ± 0.066 a | 478.804 |
| BSF90GP10 | 5.558 ± 0.037 c | 2.019 ± 0.014 d | 8.567 ± 0.033 c | 22.037 ± 0.068 d | 61.819 | 18.625 ± 0.053 a | 479.877 |
| BSF85GP15 | 5.371 ± 0.028 d | 2.119 ± 0.011 c | 8.456 ± 0.040 d | 22.169 ± 0.075 c | 61.885 | 18.582 ± 0.070 a | 480.885 |
| BSF80GP20 | 5.164 ± 0.022 e | 2.208 ± 0.012 b | 8.348 ± 0.032 e | 22.297 ± 0.056 b | 61.983 | 18.541 ± 0.061 a | 481.997 |
| BSF75GP25 | 4.919 ± 0.025 f | 2.290 ± 0.015 a | 8.242 ± 0.038 f | 22.431 ± 0.080 a | 62.118 | 18.519 ± 0.073 a | 483.319 |
| CSF | 15.622 ± 0.039 a | 0.987 ± 0.003 f | 6.831 ± 0.034 a | 27.669 ± 0.057 c | 48.891 | 23.651 ± 0.089 a | 471.909 |
| CSF95GP5 | 15.435 ± 0.054 b | 1.011 ± 0.005 e | 6.767 ± 0.033 a | 27.726 ± 0.071 c | 49.061 | 23.624 ± 0.069 a | 472.846 |
| CSF90GP10 | 15.257 ± 0.037 c | 1.052 ± 0.007 d | 6.708 ± 0.025 b | 27.795 ± 0.054 c | 49.188 | 23.578 ± 0.075 a | 473.739 |
| CSF85GP15 | 15.022 ± 0.046 d | 1.099 ± 0.011 c | 6.657 ± 0.037 c | 27.867 ± 0.079 c | 49.355 | 23.531 ± 0.065 a | 474.851 |
| CSF80GP20 | 14.843 ± 0.050 e | 1.149 ± 0.009 b | 6.602 ± 0.027 d | 27.928 ± 0.084 b | 49.478 | 23.473 ± 0.073 a | 475.672 |
| CSF75GP25 | 14.637 ± 0.036 f | 1.201 ± 0.012 a | 6.537 ± 0.034 e | 28.001 ± 0.098 a | 49.624 | 23.452 ± 0.083 a | 476.653 |
| RSF | 26.163 ± 0.046 a | 2.212 ± 0.006 f | 10.668 ± 0.040 a | 9.857 ± 0.025 f | 51.100 | 10.961 ± 0.076 a | 335.785 |
| RSF95GP5 | 25.856 ± 0.050 b | 2.324 ± 0.005 e | 10.536 ± 0.046 b | 10.006 ± 0.030 e | 51.278 | 10.928 ± 0.063 a | 337.310 |
| RSF90GP10 | 25.579 ± 0.059 c | 2.435 ± 0.009 d | 10.409 ± 0.034 b | 10.155 ± 0.026 d | 51.422 | 10.901 ± 0.058 a | 338.719 |
| RSF85GP15 | 25.305 ± 0.064 d | 2.540 ± 0.010 c | 10.237 ± 0.058 c | 10.309 ± 0.041 c | 51.609 | 10.867 ± 0.055 a | 340.165 |
| RSF80GP20 | 25.027 ± 0.046 e | 2.653 ± 0.008 b | 10.138 ± 0.051 c | 10.456 ± 0.038 b | 51.726 | 10.821 ± 0.076 a | 341.560 |
| RSF75GP25 | 24.711 ± 0.053 f | 2.761 ± 0.011 a | 10.009 ± 0.047 d | 10.612 ± 0.027 a | 51.907 | 10.779 ± 0.081 a | 343.172 |
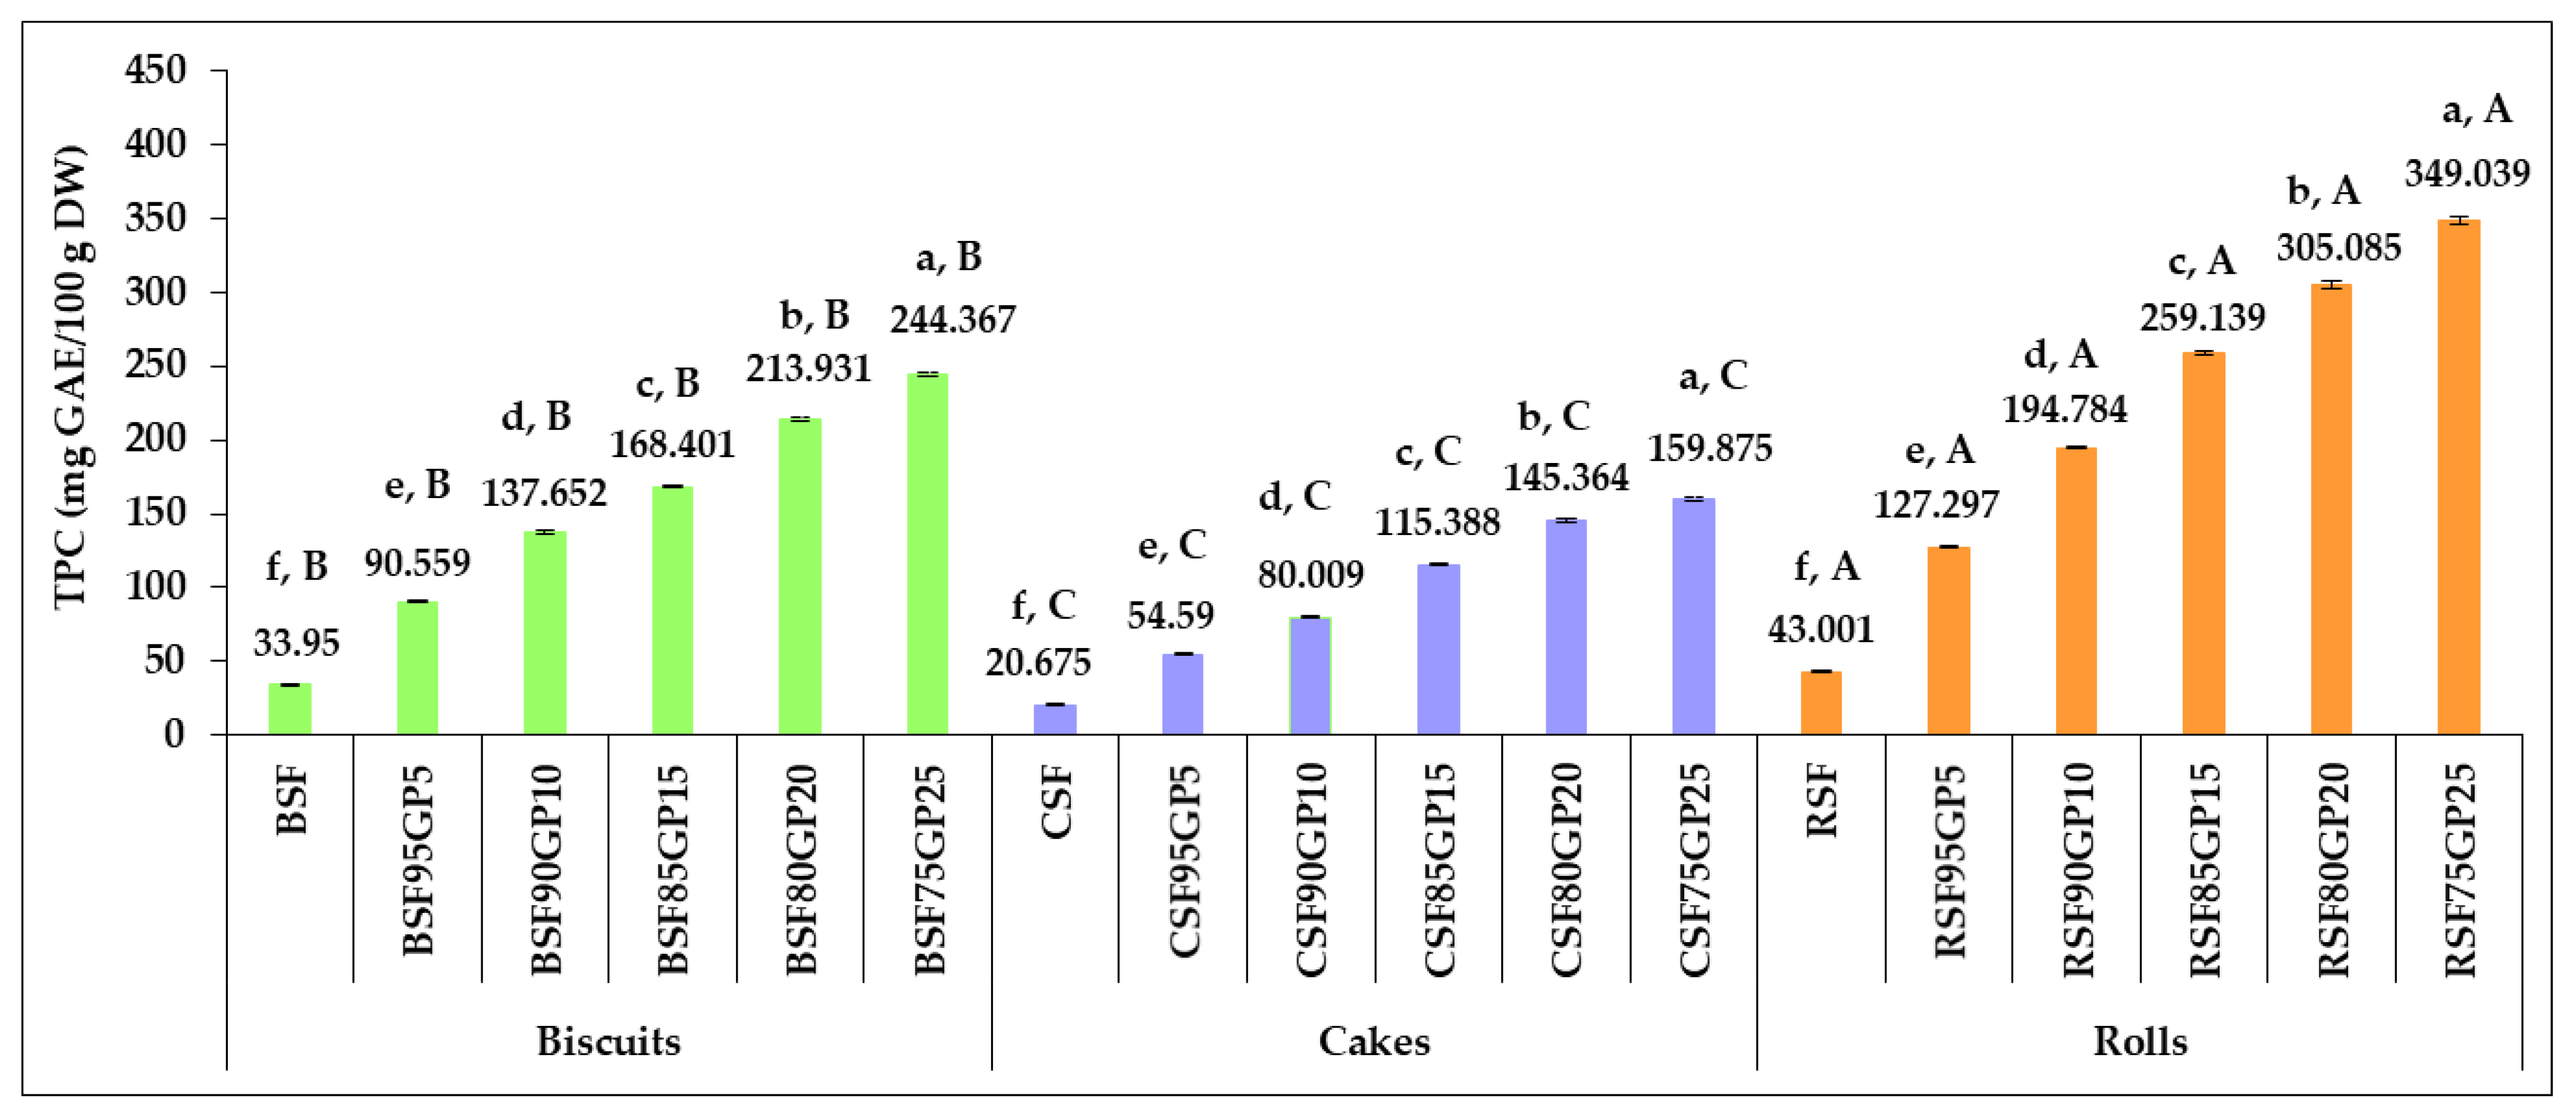
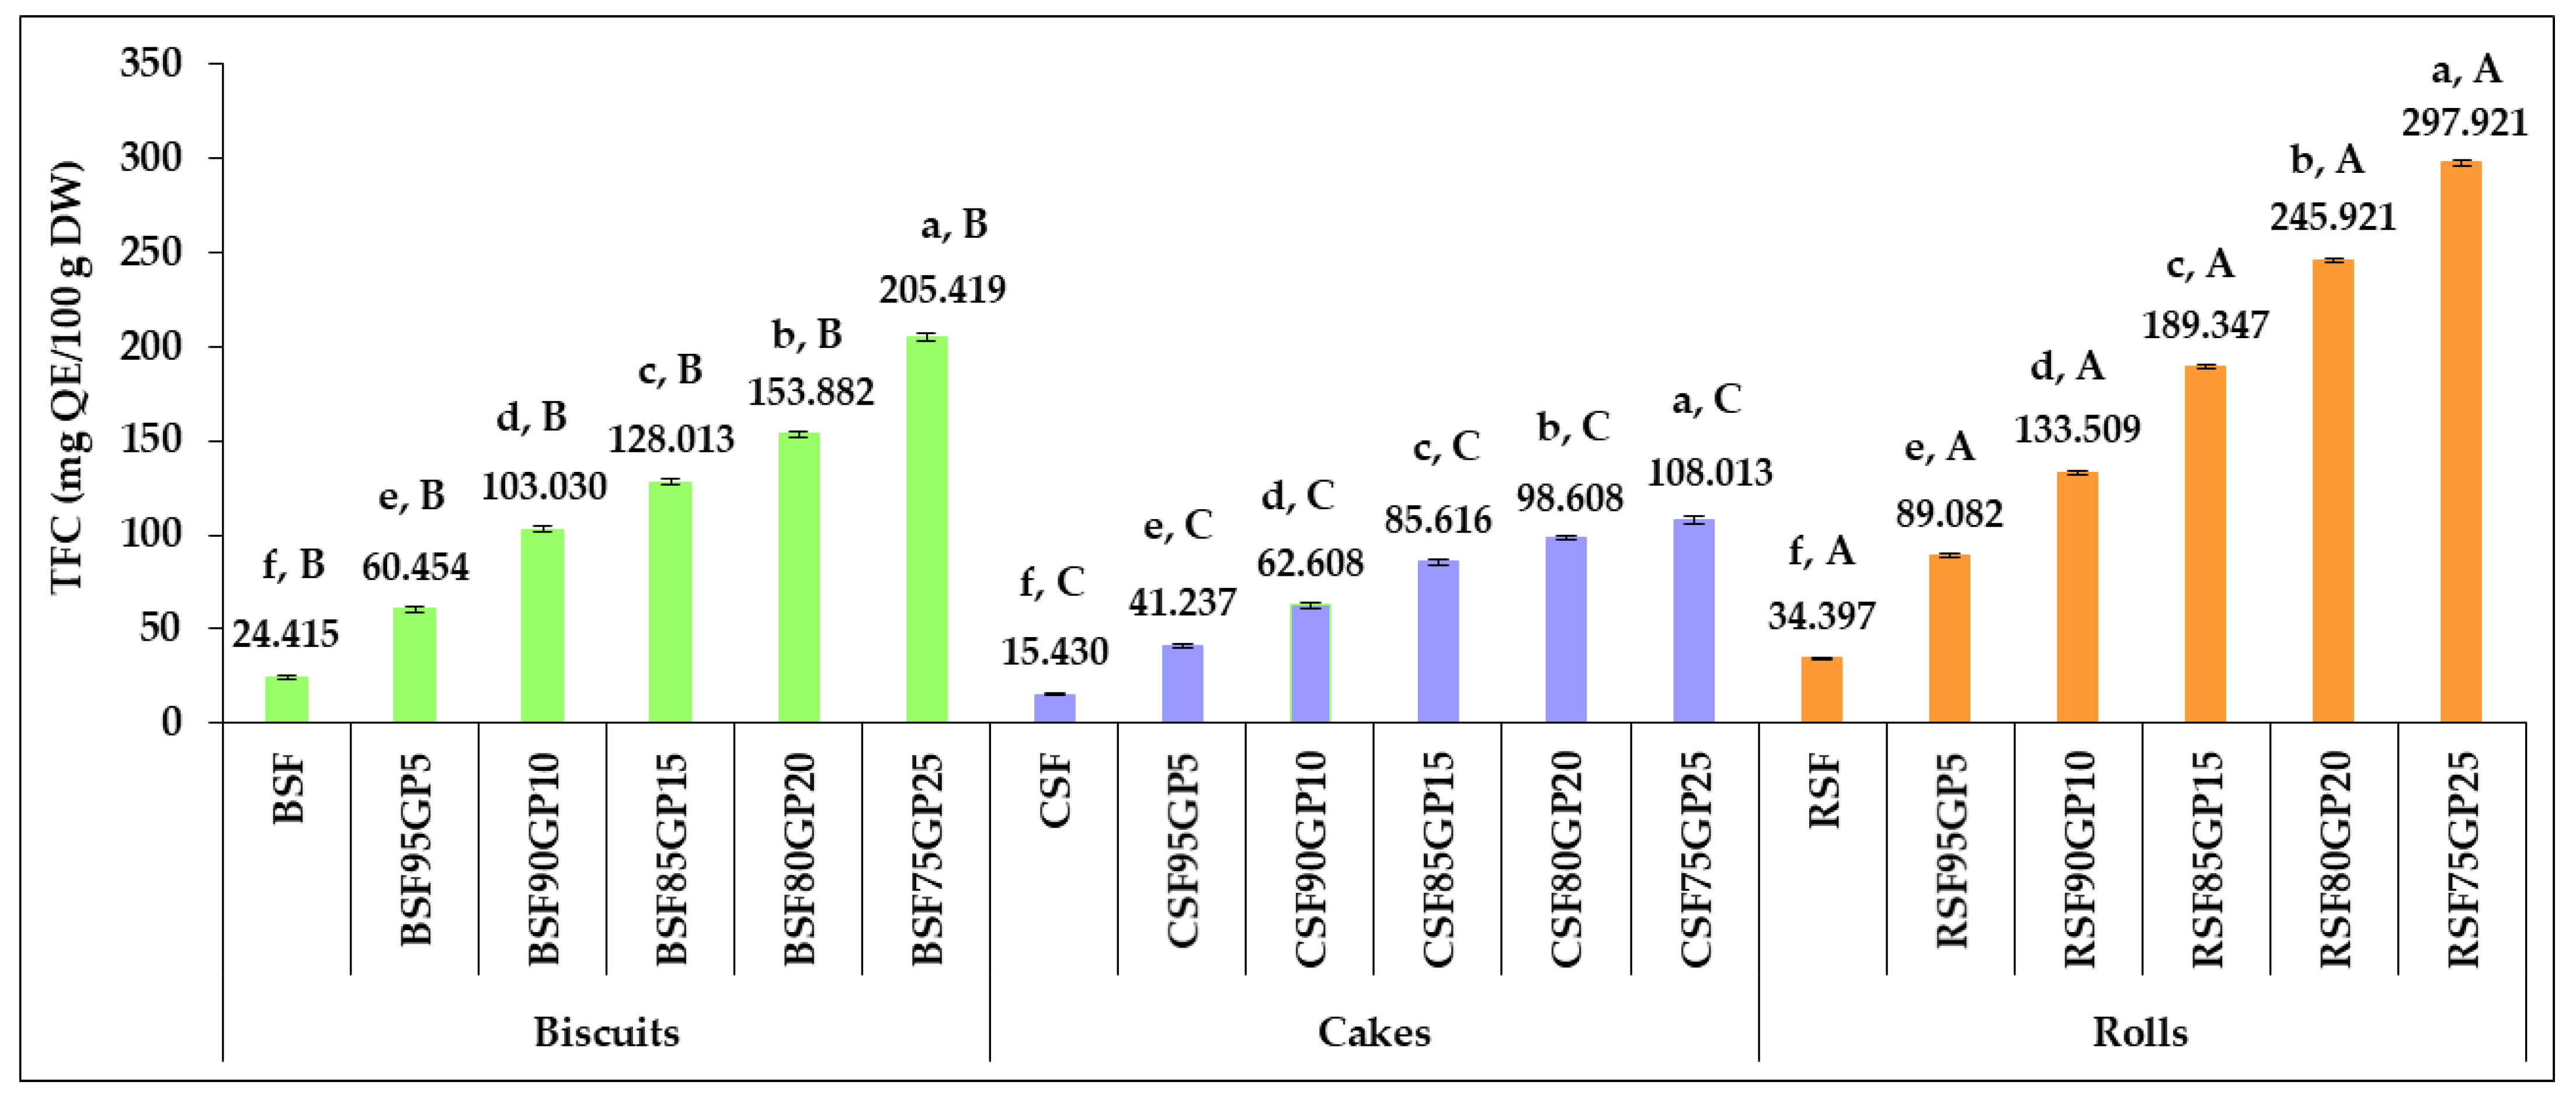
| Sample | TPC (mg GAE/100 g DW) | TFC (mg QE/100 g DW) | FRAP (µM Fe2+/g DW) | DPPH (µM TE/g DW) |
|---|---|---|---|---|
| SF | 130.211 ± 0.584 b | 81.156 ± 0.437 b | 3.689 ± 0.028 b | 4.937 ± 0.041 b |
| GP | 4708.683 ± 4.053 a | 3975.457 ± 3.291 a | 305.925 ± 1.817 a | 409.378 ± 2.019 a |
| Sample | TPC (mg GAE/100 g DW) | TFC (mg QE/100 g DW) | FRAP (µM Fe2+/g DW) | DPPH (µM TE/g DW) |
|---|---|---|---|---|
| DBSF | 66.323 ± 0.362 f, B | 48.137 ± 0.294 f, B | 1.879 ± 0.024 f, B | 2.515 ± 0.029 f, B |
| DBSF95GP5 | 180.267± 0.767 e, B | 132.465 ± 0.604 e, B | 8.917 ± 0.108 e, B | 11.978 ± 0.143 e, B |
| DBSF90GP10 | 291.244 ± 1.486 d, B | 216.605 ± 1.211 d, B | 16.138 ± 0.173 d, B | 22.518 ± 0.181 d, B |
| DBSF85GP15 | 397.101 ± 1.877 c, B | 302.448 ± 1.547 c, B | 24.109 ± 0.208 c, B | 32.772 ± 0.193 c, B |
| DBSF80GP20 | 500.551 ± 1.935 b, B | 384.141 ± 1.628 b, B | 32.259 ± 0.246 b, B | 42.841 ± 0.260 b, B |
| DBSF75GP25 | 599.799 ± 2.104 a, B | 479.135 ± 1.714 a, B | 40.200 ± 0.361 a, B | 54.256 ± 0.412 a, B |
| DCSF | 37.871 ± 0.275 f, C | 27.501 ± 0.224 f, C | 1.017 ± 0.021 f, C | 1.361 ± 0.025 f, C |
| DCSF95GP5 | 98.084 ± 0.439 e, C | 73.841 ± 0.331 e, C | 5.401 ± 0.059 e, C | 6.481 ± 0.073 e, C |
| DCSF90GP10 | 158.134 ± 0.501 d, C | 127.487 ± 0.593 d, C | 9.887 ± 0.115 d, C | 12.185 ± 0.136 d, C |
| DCSF85GP15 | 222.448 ± 0.547 c, C | 181.512 ± 0.602 c, C | 13.864 ± 0.137 c, C | 17.733 ± 0.159 c, C |
| DCSF80GP20 | 282.755 ± 1.219 b, C | 238.541 ± 0.903 b, C | 17.586 ± 0.154 b, C | 23.181 ± 0.178 b, C |
| DCSF75GP25 | 348.479 ± 1.425 a, C | 290.651 ± 1.071 a, C | 21.265 ± 0.188 a, C | 29.358 ± 0.185 a, C |
| DRSF | 73.128 ± 0.463 f, A | 53.128 ± 0.342 f, A | 2.279 ± 0.031 f, A | 3.049 ± 0.037 f, A |
| DRSF95GP5 | 201.818 ± 0.854 e, A | 157.487 ± 0.611 e, A | 13.223 ± 0.147 e, A | 14.526 ± 0.147 e, A |
| DRSF90GP10 | 314.397 ± 1.207 d, A | 251.012 ± 1.004 d, A | 22.157 ± 0.164 d, A | 27.307 ± 0.191 d, A |
| DRSF85GP15 | 426.532 ± 1.446 c, A | 358.009 ± 1.317 c, A | 31.070 ± 0.183 c, A | 39.742 ± 0.239 c, A |
| DRS0GP20 | 535.685 ± 1.913 b, A | 466.108 ± 1.629 b, A | 40.961 ± 0.209 b, A | 51.952 ± 0.308 b, A |
| DRSF75GP25 | 630.041 ± 2.307 a, A | 562.083 ± 1.853 a, A | 49.6674 ± 0.252 a, A | 63.795 ± 0.363 a, A |
| Sample | Retention Rate of TPC (%) | Retention Rate of TFC (%) | Retention Rate of FRAP (%) | Retention Rate of DPPH (%) |
|---|---|---|---|---|
| BSF | 51.189 ± 0.125 a, C | 50.721 ± 0.114 a, C | 63.006 ± 0.154 a, B | 59.905 ± 0.147 c, C |
| BSF95GP5 | 50.236 ± 0.153 b, C | 45.638 ± 0.138 c, C | 61.811 ± 0.189 b, B | 65.254 ± 0.161 a, B |
| BSF90GP10 | 47.263 ± 0.102 c, C | 47.566 ± 0.103 b, C | 58.849 ± 0.127 c, C | 62.360 ± 0.134 b, B |
| BSF85GP15 | 42.408 ± 0.129 d, C | 42.326 ± 0.129 d, C | 54.075 ± 0.165 d, C | 55.389 ± 0.169 d, C |
| BSF80GP20 | 42.739 ± 0.121 d, C | 40.059 ± 0.113 e, C | 49.356 ± 0.140 e, C | 51.367 ± 0.146 e, C |
| BSF75GP25 | 40.741 ± 0.097 e, C | 42.873 ± 0.102 f, B | 48.102 ± 0.111 f, C | 45.488 ± 0.107 f, C |
| CSF | 54.593 ± 0.132 b, B | 56.108 ± 0.137 a, B | 60.954 ± 0.149 a, C | 61.099 ±0.151 c, B |
| CSF95GP5 | 55.656 ± 0.170 a, B | 55.846 ± 0.158 a, B | 58.489 ± 0.178 c, C | 58.714 ±0.179 d, C |
| CSF90GP10 | 50.596 ± 0.117 e, B | 49.110 ± 0.108 b, B | 61.090 ± 0.132 a, B | 61.677 ±0.133 b, C |
| CSF85GP15 | 51.872 ± 0.158 c, B | 47.168 ± 0.144 c, B | 59.882 ± 0.183 b, B | 62.558 ±0.172 a, B |
| CSF80GP20 | 51.410 ± 0.146 d, B | 41.338 ± 0.118 d, B | 57.334 ± 0.162 d, B | 58.960 ±0.167 d, B |
| CSF75GP25 | 45.878 ± 0.109 f, B | 37.163 ± 0.107 e, C | 52.209 ± 0.143 e, B | 50.709 ±0.124 e, B |
| RSF | 58.802 ± 0.144 d, A | 64.744 ± 0.159 a, A | 70.332 ± 0.172 a, A | 68.087 ± 0.167 c, A |
| RSF95GP5 | 63.075 ± 0.172 a, A | 56.564 ± 0.173 b, A | 70.144 ± 0.184 a, A | 69.617 ± 0.149 a, A |
| RSF90GP10 | 61.955 ± 0.134 b, A | 53.188 ± 0.137 c, A | 69.801 ± 0.150 b, A | 68.647 ± 0.152 b, A |
| RSF85GP15 | 60.755 ± 0.179 c, A | 52.889 ± 0.143 c, A | 66.052 ± 0.167 c, A | 69.403 ± 0.132 a, A |
| RS0GP20 | 56.952 ± 0.161 e, A | 52.761 ± 0.160 c, A | 61.157 ± 0.173 d, A | 63.166 ± 0.154 d, A |
| RSF75GP25 | 55.399 ± 0.133 f, A | 53.003 ± 0.164 c, A | 60.198 ± 0.143 e, A | 61.102 ± 0.140 e, A |
| Physical Characteristics | Pastry Products | |||||
|---|---|---|---|---|---|---|
| BSF | BSF95GP5 | BSF90GP10 | BSF85GP15 | BSF80GP20 | BSF75GP25 | |
| SR | 5.001 ± 0.012 e | 5.109 ± 0.011 d | 5.158 ± 0.013 c | 5.206 ± 0.010 b | 5.229 ± 0.013 a | 5.257 ± 0.011 a |
| CSF | CSF95GP5 | CSF90GP10 | CSF85GP15 | CSF80GP20 | CSF75GP25 | |
| Porosity (%) | 84.697 ± 0.282 a | 84.431 ± 0.273 a | 83.224 ± 0.258 b | 82.877 ± 0.249 b | 80.149 ± 0.227 c | 78.113 ± 0.221 d |
| Elasticity (%) | 97.146 ± 0.301 a | 97.148 ± 0.294 a | 95.653 ± 0.285 b | 94.129 ± 0.279 c | 92.181 ± 0.232 d | 91.435 ± 0.229 e |
| RSF | RSF95GP5 | RSF90GP10 | RSF85GP15 | RS0GP20 | RSF75GP25 | |
| Porosity (%) | 73.395 ± 0.223 a | 68.403 ± 0.207 b | 68.226 ± 0.198 b | 67.724 ± 0.186 c | 67.431 ± 0.173 c | 66.762 ± 0.169 d |
| Elasticity (%) | 75.008 ± 0.249 a | 72.229 ± 0.233 b | 68.903 ± 0.219 c | 62.511 ± 0.188 d | 61.507 ± 0.164 e | 60.104 ± 0.151 f |
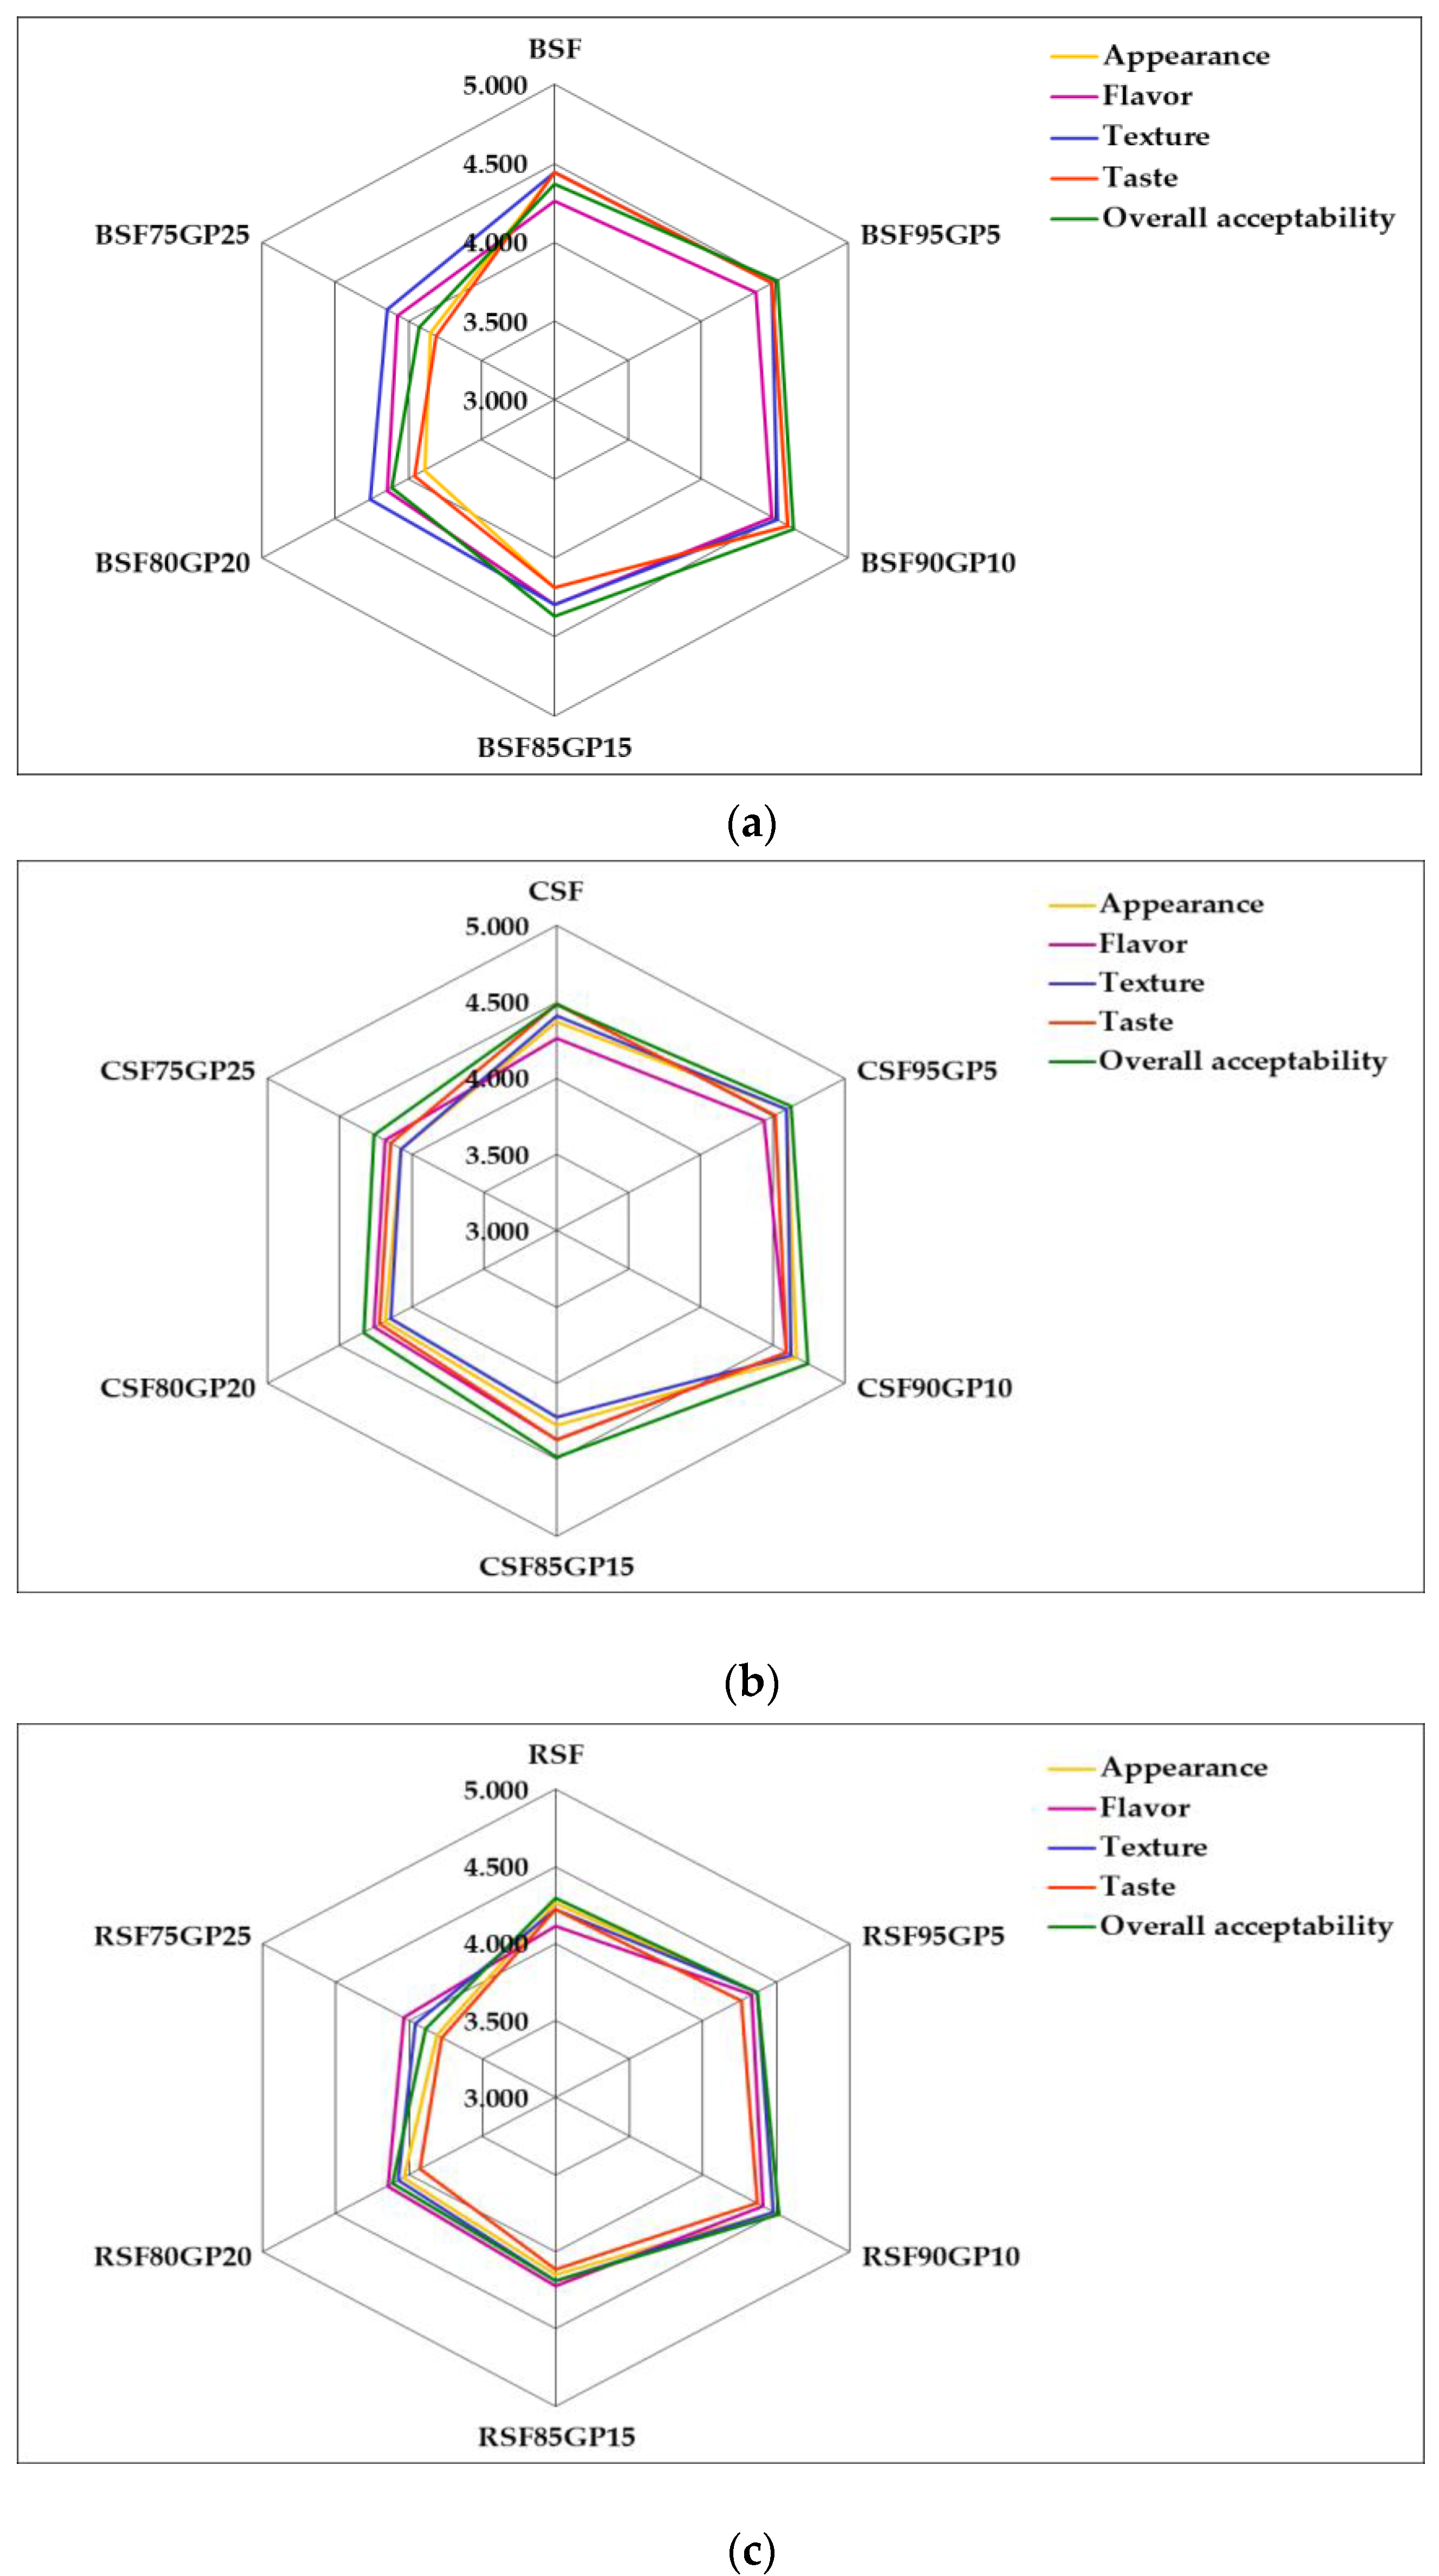
| Sample | Scores (5-Point Hedonic Scale) | ||||
|---|---|---|---|---|---|
| Appearance | Flavour | Texture | Taste | Overall Acceptability | |
| BSF | 4.444 ± 0.506 a | 4.259 ± 0.447 a | 4.444 ± 0.506 a | 4.444 ± 0.506 a | 4.370 ± 0.565 a |
| BSF95GP5 | 4.481 ± 0.509 a | 4.370 ± 0.492 a | 4.481 ± 0.509 a | 4.481 ± 0.509 a | 4.519 ± 0.509 a |
| BSF90GP10 | 4.593 ± 0.501 a | 4.481 ± 0.509 a | 4.519 ± 0.509 a | 4.593 ± 0.501 a | 4.630 ± 0.492 a |
| BSF85GP15 | 4.185 ± 0.396 b | 4.296 ± 0.465 a | 4.296 ± 0.465 a | 4.185 ± 0.483 b | 4.370 ± 0.492 a |
| BSF80GP20 | 3.889 ± 0.320 c | 4.148 ± 0.362 a | 4.259 ± 0.447 a | 3.963 ± 0.338 c | 4.111 ± 0.320 b |
| BSF75GP25 | 3.852 ± 0.362 c | 4.074 ± 0.267 b | 4.148 ± 0.362 b | 3.815 ± 0.396 d | 3.926 ± 0.267 c |
| CSF | 4.370 ± 0.492 a | 4.259 ± 0.447 a | 4.407 ± 0.501 a | 4.481 ± 0.509 a | 4.481 ± 0.509 a |
| CSF95GP5 | 4.593 ± 0.501 a | 4.444 ± 0.506 a | 4.593 ± 0.501 a | 4.519 ± 0.509 a | 4.556 ± 0.506 a |
| CSF90GP10 | 4.667 ± 0.480 a | 4.593 ± 0.501 a | 4.630 ± 0.492 a | 4.593 ± 0.501 a | 4.630 ± 0.492 a |
| CSF85GP15 | 4.296 ± 0.465 b | 4.370 ± 0.492 a | 4.222 ± 0.424 b | 4.370 ± 0.492 a | 4.481 ± 0.509 a |
| CSF80GP20 | 4.185 ± 0.483 c | 4.259 ± 0.526 a | 4.148 ± 0.362 b | 4.222 ± 0.424 b | 4.259 ± 4.259 a |
| CSF75GP25 | 4.074 ± 0.267 c | 4.185 ± 0.396 b | 4.074 ± 0.385 b | 4.148 ± 0.362 c | 4.185 ± 0.396 b |
| RSF | 4.259 ± 0.447 a | 4.111 ± 0.320 a | 4.222 ± 0.424 a | 4.222 ± 0.424 a | 4.296 ± 0.465 a |
| RSF95GP5 | 4.370 ± 0.492 a | 4.333 ± 0.480 a | 4.370 ± 0.492 a | 4.259 ± 0.447 a | 4.370 ± 0.492 a |
| RSF90GP10 | 4.485 ± 0.509 a | 4.407 ± 0.501 a | 4.481 ± 0.509 a | 4.370 ± 0.492 a | 4.519 ± 0.509 a |
| RSF85GP15 | 4.148 ± 0.362 b | 4.222 ± 0.424 a | 4.185 ± 0.396 a | 4.111 ± 0.320 a | 4.185 ± 0.396 b |
| RS0GP20 | 4.037 ± 0.192 b | 4.148 ± 0.362 a | 4.074 ± 0.267 b | 3.926 ± 0.267 b | 4.111 ± 0.320 b |
| RSF75GP25 | 3.815 ± 0.396 c | 4.037 ± 0.192 b | 3.963 ± 0.338 c | 3.778 ± 0.424 c | 3.889 ± 0.320 c |
Disclaimer/Publisher’s Note: The statements, opinions and data contained in all publications are solely those of the individual author(s) and contributor(s) and not of MDPI and/or the editor(s). MDPI and/or the editor(s) disclaim responsibility for any injury to people or property resulting from any ideas, methods, instructions or products referred to in the content. |
© 2023 by the authors. Licensee MDPI, Basel, Switzerland. This article is an open access article distributed under the terms and conditions of the Creative Commons Attribution (CC BY) license (https://creativecommons.org/licenses/by/4.0/).
Share and Cite
Poiana, M.-A.; Alexa, E.; Radulov, I.; Raba, D.-N.; Cocan, I.; Negrea, M.; Misca, C.D.; Dragomir, C.; Dossa, S.; Suster, G. Strategies to Formulate Value-Added Pastry Products from Composite Flours Based on Spelt Flour and Grape Pomace Powder. Foods 2023, 12, 3239. https://doi.org/10.3390/foods12173239
Poiana M-A, Alexa E, Radulov I, Raba D-N, Cocan I, Negrea M, Misca CD, Dragomir C, Dossa S, Suster G. Strategies to Formulate Value-Added Pastry Products from Composite Flours Based on Spelt Flour and Grape Pomace Powder. Foods. 2023; 12(17):3239. https://doi.org/10.3390/foods12173239
Chicago/Turabian StylePoiana, Mariana-Atena, Ersilia Alexa, Isidora Radulov, Diana-Nicoleta Raba, Ileana Cocan, Monica Negrea, Corina Dana Misca, Christine Dragomir, Sylvestre Dossa, and Gabriel Suster. 2023. "Strategies to Formulate Value-Added Pastry Products from Composite Flours Based on Spelt Flour and Grape Pomace Powder" Foods 12, no. 17: 3239. https://doi.org/10.3390/foods12173239