
Physicochemical, Structural, and Functional Properties of Snake Melon (Cucumis melo subsp. melo Var. flexuosus) Microencapsulated with Pea Protein and Pea Fibre by Freeze-Drying

 , , , and
Abstract
:1. Introduction
2. Materials and Methods
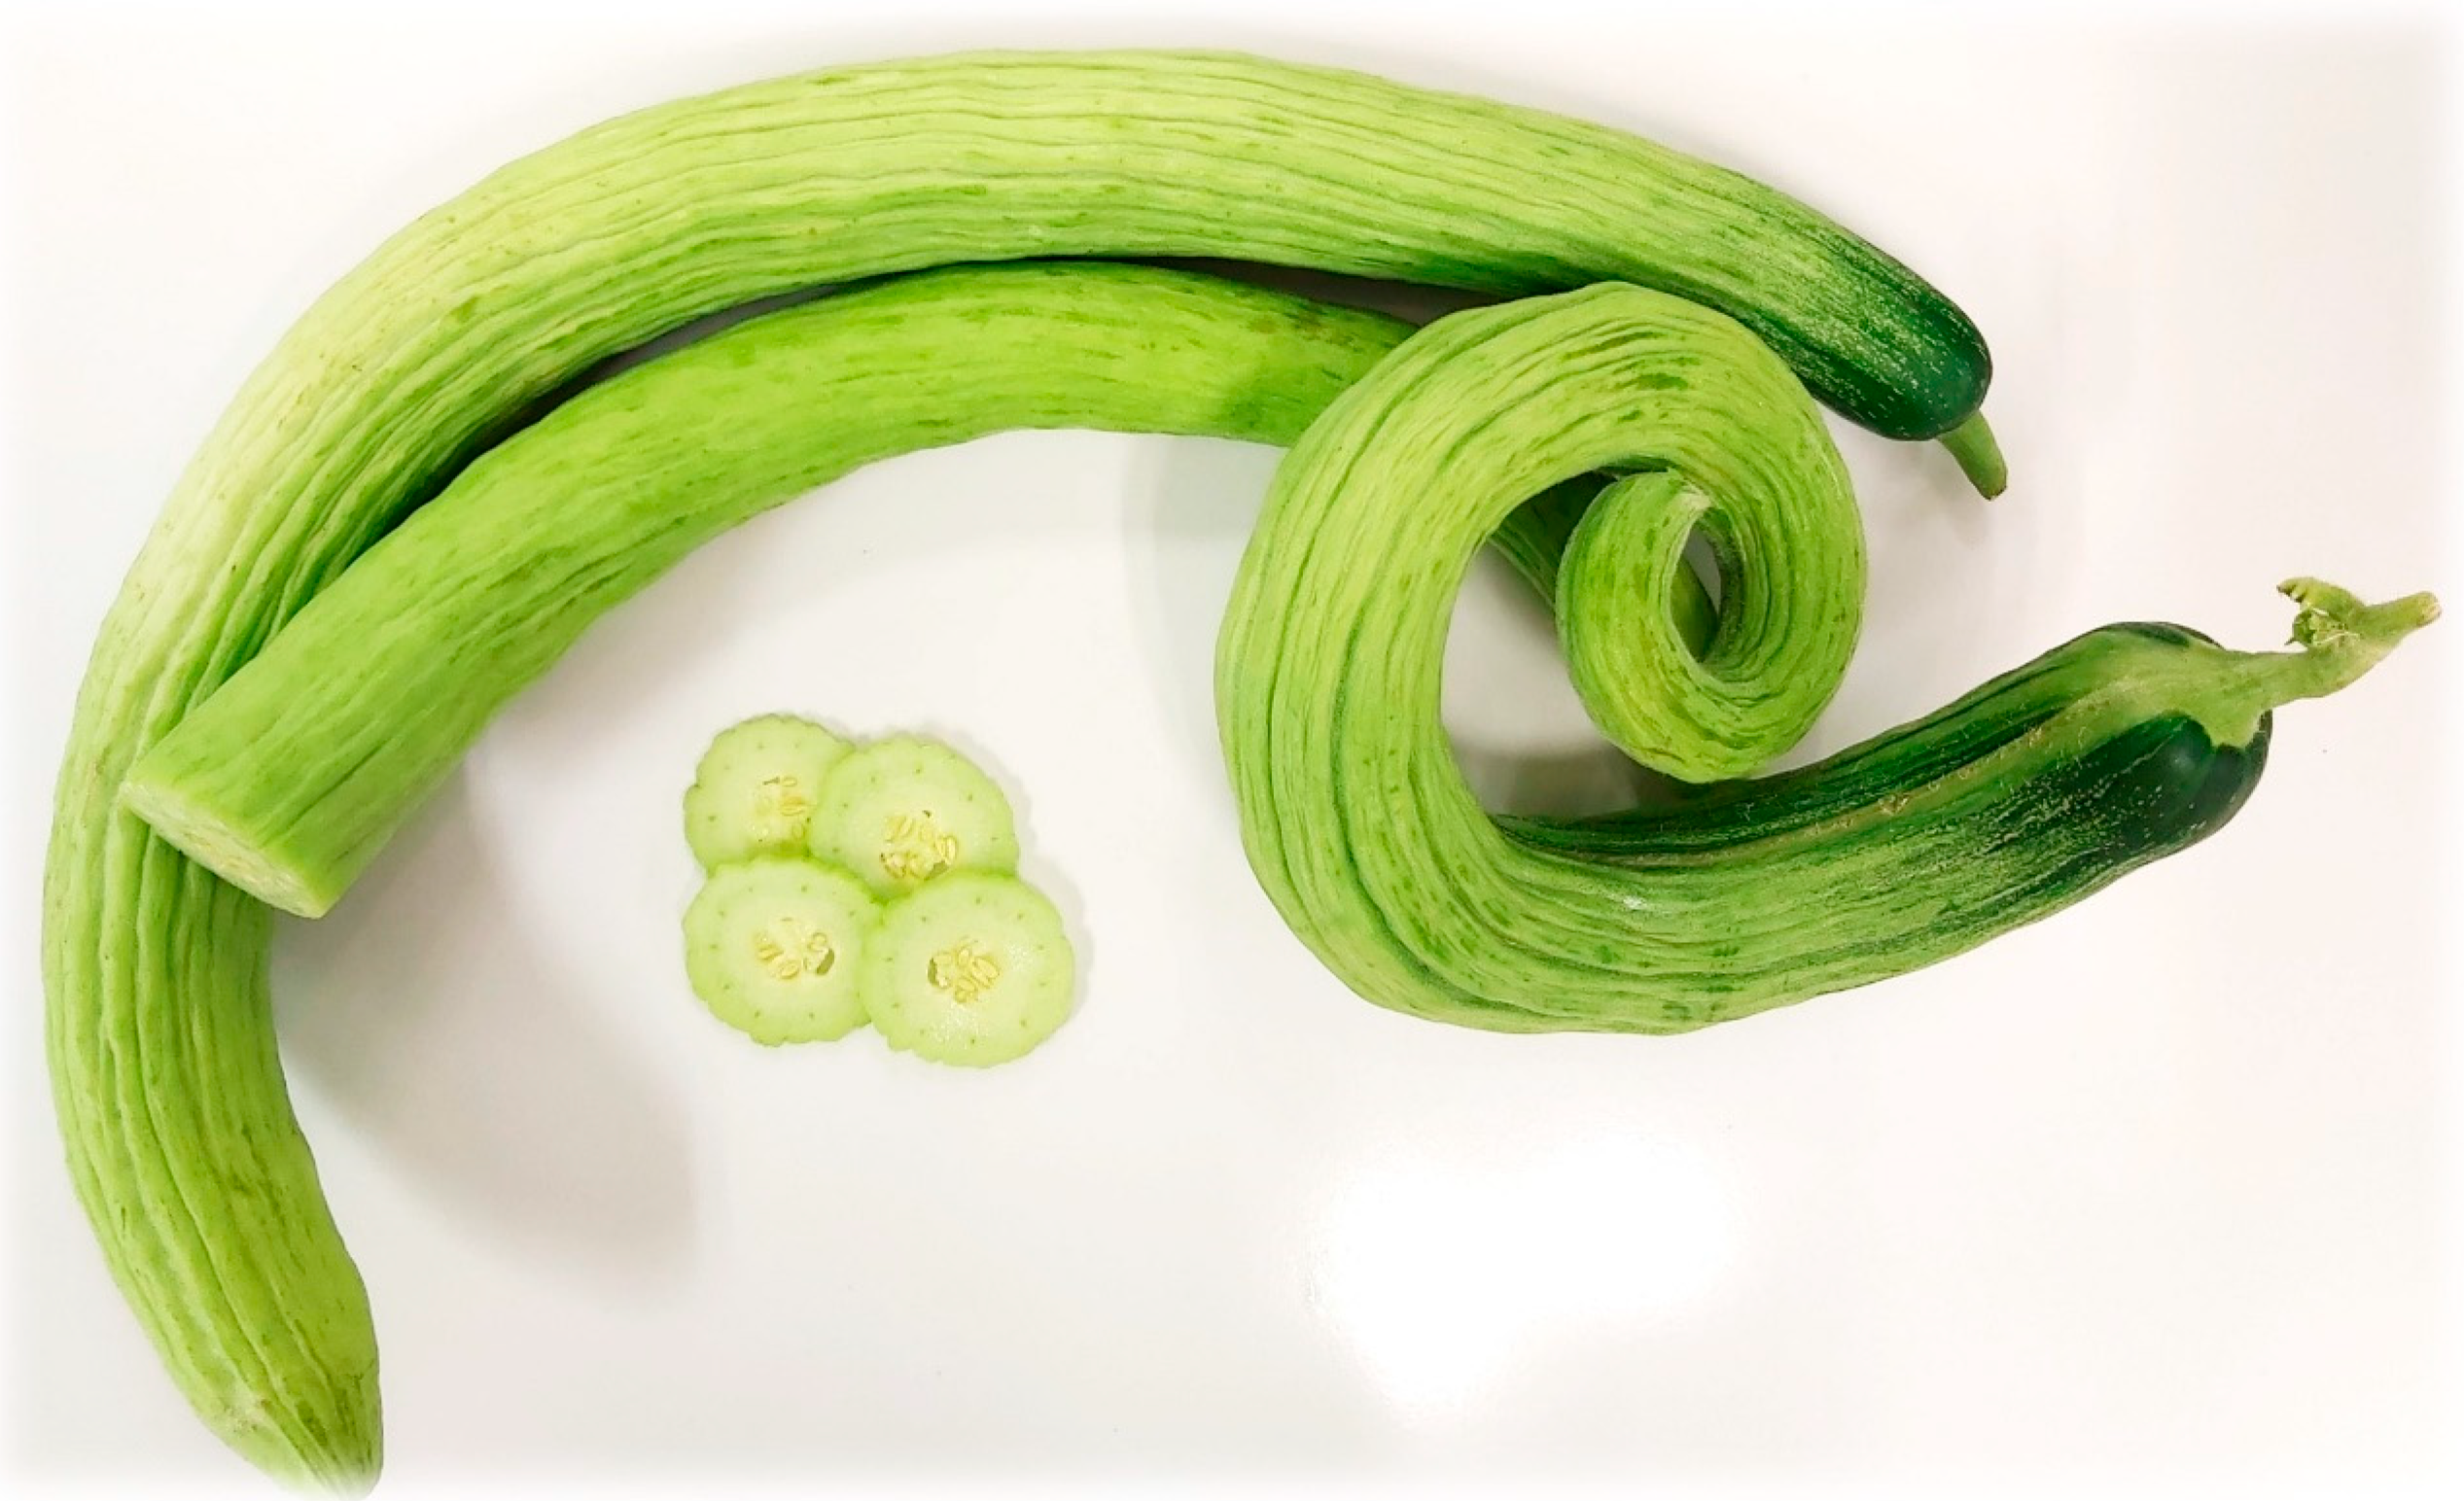
2.1. Raw Materials
2.2. Sample Preparation
2.3. Physicochemical and Microstructural Properties
2.4. Bioactive Compound Determination
2.5. Encapsulation Efficiencies (EEs)
2.6. Statistical Analysis
3. Results
3.1. Physicochemical and Microstructural Properties of SM Powders
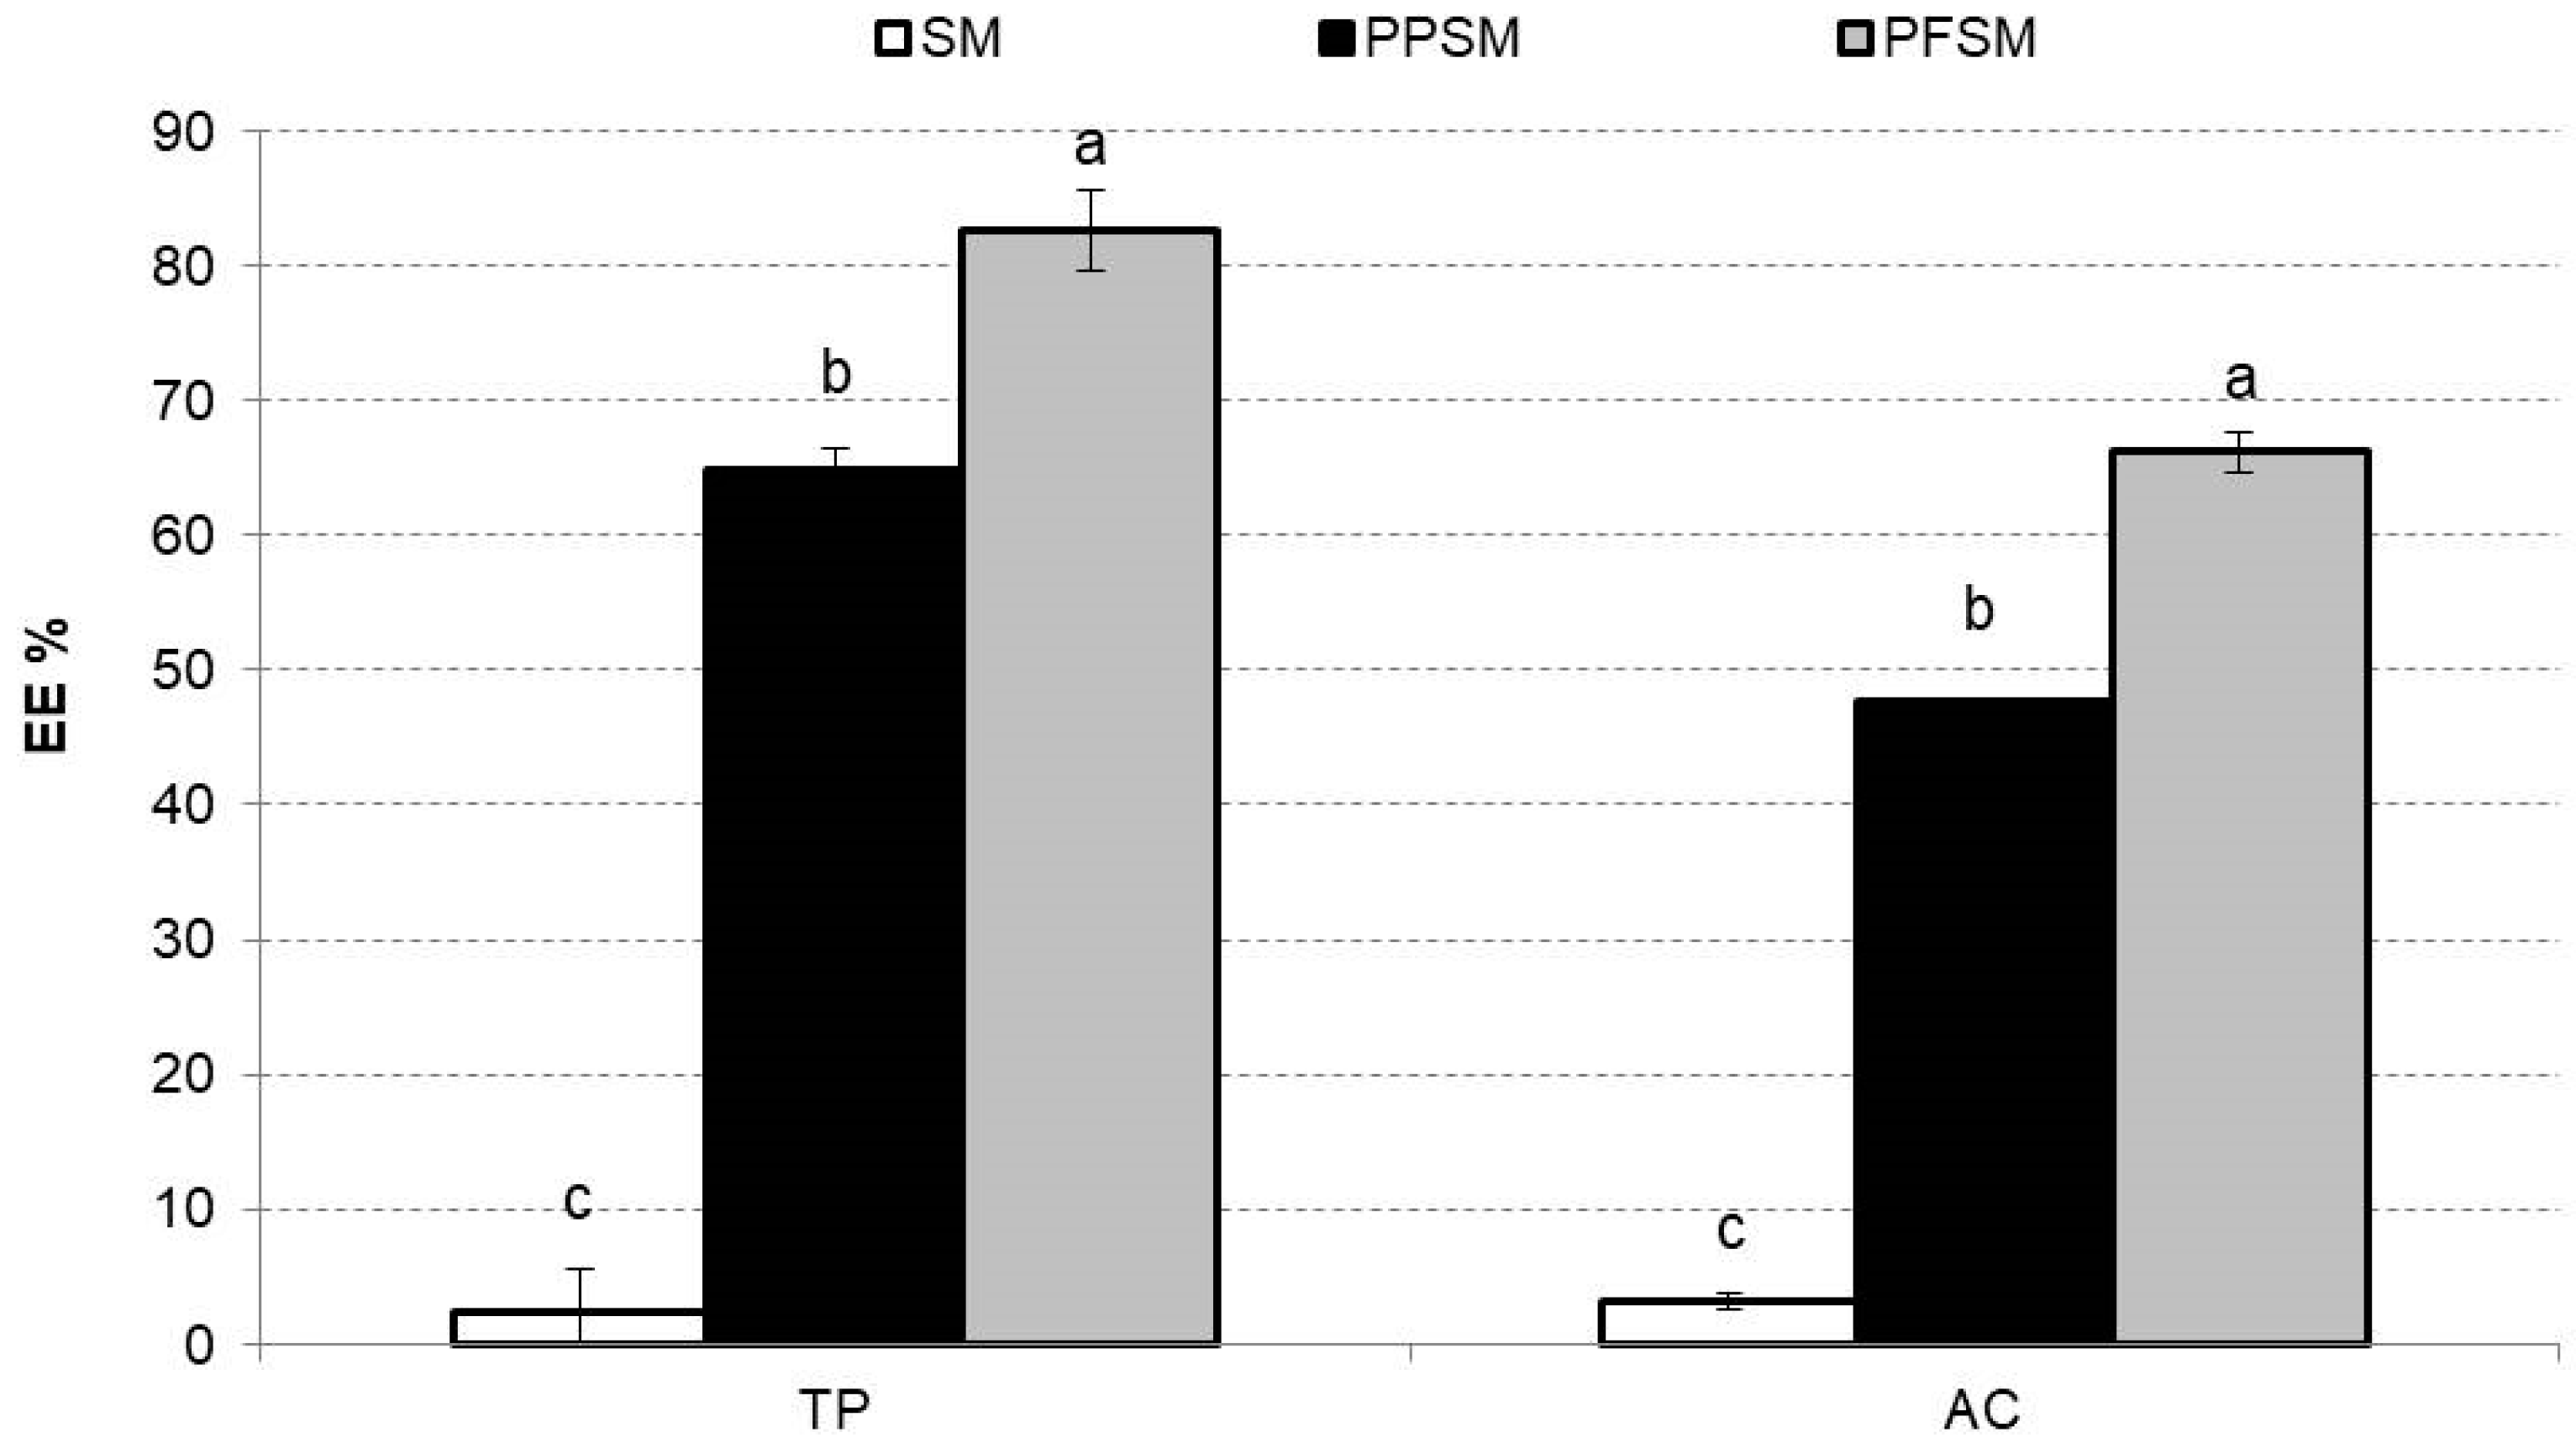
3.2. Bioactive Compounds and Efficiency Encapsulation
4. Conclusions
Author Contributions
Funding
Data Availability Statement
Acknowledgments
Conflicts of Interest
References
- Fanourakis, N.; Tsekoura, Z.; Nanou, E. Morphological Characteristics and Powdery Mildew Resistance of Cucumis Melo Land Races in Greece. In VII Eucarpia Meeting on Cucurbit Genetics and Breeding 510; ISHS: Neijiang, China, 2000. [Google Scholar]
- Pitra, M. Vegetables. In Handbook of Plant Breeding; Springer: New York, NY, USA, 2008. [Google Scholar]
- Janick, J.; Paris, H.S.; Parrish, D.C. The cucurbits of Mediterranean antiquity: Identification of taxa from ancient images and descriptions. Ann. Bot. 2007, 100, 1441–1457. [Google Scholar] [CrossRef]
- Merheb, J.; Pawełkowicz, M.; Branca, F.; Bolibok-Brągoszewska, H.; Skarzyńska, A.; Pląder, W.; Chalak, L. Characterization of Lebanese germplasm of snake melon (Cucumis melo subsp. melo var. flexuosus) using morphological traits and SSR markers. Agronomy 2020, 10, 1293. [Google Scholar] [CrossRef]
- Flores-León, A.; García-Martínez, S.; González, V.; Garcés-Claver, A.; Martí, R.; Julián, C.; Picó, B. Grafting snake melon [Cucumis melo L. subsp. melo Var. flexuosus (L.) Naudin] in organic farming: Effects on agronomic performance; resistance to pathogens; sugar, acid, and VOC profiles; and consumer acceptance. Front. Plant Sci. 2021, 12, 613845. [Google Scholar] [CrossRef]
- Omari, S.; Kamenir, Y.; Benichou, J.I.; Pariente, S.; Sela, H.; Perl-Treves, R. Landraces of snake melon, an ancient Middle Eastern crop, reveal extensive morphological and DNA diversity for potential genetic improvement. BMC Genet. 2018, 19, 34. [Google Scholar]
- Mendí, Y.Y.; Eldoğan, S.; Gutakev, R.; İpek, M.; Çürük, P.; Cetiner, S. Regeneration and histological analysis of snake melon (Cucumis melo var. flexuosus (L.) Naudin) by direct organogenesis. Turk. J. Agric. For. 2010, 34, 309–317. [Google Scholar] [CrossRef]
- Pitrat, M. Melon Genetic Resources: Phenotypic Diversity and Horticultural Taxonomy. In Genetics and Genomics of Cucurbitaceae; Springer: Cham, Switzerland, 2016. [Google Scholar]
- Sleiman, L.; Alkhatib, A.; Tlais, S.; Hussein, H.H. Adding Functional Foods to Fermented Snake Melon (Cucumis melo var. flexuosus) to Increase Consumption and Reduce Crop Loss. Int. J. Environ. Agric Biotech. 2021, 6, 3. [Google Scholar] [CrossRef]
- Mariod, A.A.; Mirghani, M.E.S.; Hussein, I. Unconventional Oilseeds and Oil Sources; The Armenian Cucumber or Snake Melon: Cambridge, MA, USA, 2017; pp. 293–297. [Google Scholar]
- Amini, A.; Asadi-Gharneh, H.A.; Foroozandeh, E. Quantitative and qualitative assessment of fatty acids of seeds in Armenian cucumber (Cucumis melo var. flexuosus). J. Herb. Med. 2019, 10, 133–137. [Google Scholar]
- Pandey, A.; Ranjan, P.; Ahlawat, S.P.; Bhardwaj, R.; Dhariwal, O.P.; Singh, P.K.; Agrawal, A. Studies on fruit morphology, nutritional and floral diversity in less-known melons (Cucumis melo L.) of India. Genet. Resour. Crop Evol. 2021, 68, 1453–1470. [Google Scholar] [CrossRef]
- Ilahy, R.; Tlili, I.; Chikh, R.H.; R’him, T.; Homa, F.; Hdider, C.; Lenucci, M.S. Functional quality traits of snake melon (Cucumis melo var. flexuosus L.) fruits as affected by genotypic differences. J. Postharvest Technol. 2019, 7, 1–10. [Google Scholar]
- Hui, Y.H.; Clary, C.; Farid, M.M.; Fasina, O.O.; Noomhorm, A.; Welti-Chanes, J. Journal of Food Drying, Science and Technology; DEStech Publications Inc.: Lancaster, PA, USA, 2008. [Google Scholar]
- Liapis, A.I.; Bruttini, R. Freeze Drying. In Handbook of Industrial Drying; Mujumdar, A.S., Ed.; CRC Press: Boca Raton, FL, USA, 2007; p. 257. [Google Scholar]
- An, K.; Zhao, D.; Wang, Z.; Wu, J.; Xu, Y.; Xiao, G. Comparison of different drying methods on Chinese ginger (Zingiber officinale Roscoe): Changes in volatiles, chemical profile, antioxidant properties, and microstructure. Food Chem. 2016, 197, 1292–1300. [Google Scholar] [CrossRef]
- Igual, M.; Chiş, M.S.; Păucean, A.; Vodnar, D.C.; Muste, S.; Man, S.; Martínez-Monzó, J.; García-Segovia, P. Valorization of rose hip (Rosa canina) puree co-product in enriched corn extrudates. Foods 2021, 10, 2787. [Google Scholar] [CrossRef] [PubMed]
- Otálora, M.C.; Carriazo, J.G.; Iturriaga, L.; Nazareno, M.A.; Osorio, C. Microencapsulation of betalains obtained from cactus fruit (Opuntia ficus-indica) by spray drying using cactus cladode mucilage and maltodextrin as encapsulating agents. Food Chem. 2021, 187, 174–181. [Google Scholar] [CrossRef] [PubMed]
- Telis, V.R.N.; Martínez-Navarrete, N. Collapse and color changes in grapefruit juice powder as affected by water activity, glass transition, and addition of carbohydrate polymers. Food Biophys. 2009, 4, 83–93. [Google Scholar] [CrossRef]
- García-Segovia, P.; Igual, M.; Martínez-Monzó, J. Beetroot microencapsulation with pea protein using spray drying: Physicochemical, structural and functional properties. Appl. Sci. 2021, 11, 6658. [Google Scholar] [CrossRef]
- Igual, M.; García-Herrera, P.; Cámara, R.M.; Martínez-Monzó, J.; García-Segovia, P.; Cámara, M. Bioactive Compounds in Rosehip (Rosa canina) Powder with Encapsulating Agents. Molecules 2022, 27, 4737. [Google Scholar] [CrossRef] [PubMed]
- Silva-Espinoza, M.A.; Ayed, C.; Camacho, M.D.M.; Foster, T.; Martínez-Navarrete, N. Impact of maltodextrin, gum Arabic, different fibres and starches on the properties of freeze-dried orange puree powder. Food Biophys. 2021, 16, 270–279. [Google Scholar] [CrossRef]
- Gharsallaoui, A.; Roudaut, G.; Chambin, O.; Voilley, A.; Saurel, R. Applications of spray-drying in microencapsulation of food ingredients: An overview. Food Res. Int. 2007, 40, 1107–1121. [Google Scholar] [CrossRef]
- Bajaj, S.R.; Marathe, S.J.; Singhal, R.S. Co-encapsulation of vitamins B12 and D3 using spray drying: Wall material optimization, product characterization, and release kinetics. Food Chem. 2021, 335, 127642. [Google Scholar] [CrossRef]
- Solomando, J.C.; Antequera, T.; Ruiz-Carrascal, J.; Perez-Palacios, T. Improvement of encapsulation and stability of EPA and DHA from monolayered and multilayered emulsions by high-pressure homogenization. J. Food Process Preserv. 2020, 44, e14290. [Google Scholar] [CrossRef]
- Chindapan, N.; Niamnuy, C.; Devahastin, S. Physical properties, morphology and saltiness of salt particles as affected by spray drying conditions and potassium chloride substitution. Powder Technol. 2018, 326, 265–271. [Google Scholar] [CrossRef]
- AOAC. Official Methods of Analysis of AOAC International, 17th ed.; AOAC International: Gaithersburg, MD, USA, 2002. [Google Scholar]
- Singh, N.; Smith, A.C. A comparison of wheat starch, whole wheat meal and oat flour in the extrusion cooking process. J. Food Eng. 1997, 34, 15–32. [Google Scholar] [CrossRef]
- Cai, Y.Z.; Corke, H. Production and Properties of Spray-dried Amaranthus Betacyanin Pigments. JFS 2000, 65, 1248–1252. [Google Scholar] [CrossRef]
- AENOR. Spanish Association for Standardization and Certification. In Particle Size Analysis-Laser Diffraction Methods; AENOR: Madrid, Spain, 2009. [Google Scholar]
- Hausner, H.H. Friction Conditions in a Mass of Metal Powder; Polytechnic Inst. of Brooklyn.: Los Angeles, CA, USA, 1967. [Google Scholar]
- Carr, R.L. Evaluating flow properties of powders. Chem. Eng. 1965, 18, 163–168. [Google Scholar]
- Igual, M.; García-Segovia, P.; Martínez-Monzó, J. Resistant maltodextrin’s effect on the physicochemical and structure properties of spray dried orange juice powders. Eur. Food Res. Technol. 2021, 247, 1125–1132. [Google Scholar] [CrossRef]
- Igual, M.; García-Martínez, E.; Camacho, M.M.; Martínez-Navarrete, N. Stability of micronutrients and phytochemicals of grapefruit jam as affected by the obtention process. Food Sci. Technol. Int. 2016, 22, 203–212. [Google Scholar] [CrossRef] [PubMed]
- Igual, M.; Chiş, M.S.; Păucean, A.; Vodnar, D.C.; Ranga, F.; Mihăiescu, T.; Török, A.I.; Martínez-Monzó, J.; García-Segovia, P. Effect on Nutritional and Functional Characteristics by Encapsulating Rose canina Powder in Enriched Corn Extrudates. Foods 2021, 10, 2401. [Google Scholar] [CrossRef]
- Olives Barba, A.I.; Cámara Hurtado, M.; Sánchez Mata, M.C.; Fernández Ruiz, V.; López Sáenz De Tejada, M. Application of a UV-vis detection-HPLC method for a rapid determination of lycopene and β-carotene in vegetables. Food Chem. 2006, 95, 328–336. [Google Scholar] [CrossRef]
- AOAC. Association of Official Analytical Chemist. In Agricultural Chemicals, Contaminants, Drugs; Horwitz, W., Ed.; AOAC: Rockville, MD, USA, 2000; Volume I. [Google Scholar]
- Lichtenthaler, H.K.; Buschmann, C. Chlorophylls and carotenoids: Measurement and characterization by UV-VIS spectroscopy. Curr. Protoc. Food Anal. Chem. 2001, 1, F4.3.1–F4.3.8. [Google Scholar] [CrossRef]
- Zvezdanović, J.; Marković, D. Bleaching of chlorophylls by UV irradiation in vitro: The effects on chlorophyll organization in acetone and n-hexane. J. Serbian. Chem. Soc. 2008, 73, 271–282. [Google Scholar] [CrossRef]
- Idham, Z.; Muhamad, I.I.; Sarmidi, M.R. Degradation kinetics and color stability of spray-dried encapsulated anthocyanins from Hibiscus sabdariffa L. J. Food Process Eng. 2012, 35, 522–542. [Google Scholar] [CrossRef]
- Mahdavi, S.A.; Jafari, S.M.; Assadpoor, E.; Dehnad, D. Microencapsulation optimization of natural anthocyanins with maltodextrin, gum Arabic and gelatin. Int. J. Biol. Macromol. 2016, 85, 379–385. [Google Scholar] [CrossRef]
- Mezreb, K.; Goullieux, A.; Ralainirina, R.; Queneudec, M. Application of image analysis to measure screw speed influence on physical properties of corn and wheat extrudates. J. Food Eng. 2003, 57, 145–152. [Google Scholar] [CrossRef]
- Augusto-Ruiz, W.; Bonato, S.; Arrieche, L.; Risso, F. Characterization of pregelatinized whole rice flour produced from broken rice grains. Rev. Ciênc. Exatas. Eng. 2003, 13, 25–46. [Google Scholar]
- Tonon, R.V.; Baroni, A.F.; Brabet, C.; Gibert, O.; Pallet, D.; Hubinger, M.D. Water sorption and glass transition temperature of spray dried açai (Euterpe oleracea Mart.) juice. J. Food Eng. 2009, 94, 215–221. [Google Scholar] [CrossRef]
- Mosquera, L.H.; Moraga, G.; Martínez-Navarrete, N. Effect of maltodextrin on the stability of freeze-dried borojó (Borojoa patinoi Cuatrec.) powder. J. Food Eng. 2010, 97, 72–78. [Google Scholar] [CrossRef]
- Mosquera, L.H.; Moraga, G.; Martínez-Navarrete, N. Critical water activity and critical water content of freeze-dried strawberry powder as affected by maltodextrin and arabic gum. Food Res. Int. 2012, 47, 201–206. [Google Scholar] [CrossRef]
- Barbosa-Cánocas, G.V.; Malave-Lopez, J.; Peleg, M. Density and compressibility of selected food powders mixture. J. Food Process Eng. 1987, 10, 1–9. [Google Scholar]
- Rahman, M.S. Toward prediction of porosity in foods during drying: A brief review. Dry Technol. 2001, 19, 1–13. [Google Scholar] [CrossRef]
- Fazaeli, M.; Emam-Djomeh, Z.; Ashtari, A.K.; Omid, M. Effect of spray drying conditions and feed composition on the physical properties of black mulberry juice powder. Food Bioprod. Process 2012, 90, 667–675. [Google Scholar] [CrossRef]
- Hayes, G.D. Food Engineering Data Handbook; Longman Scientific & Technical; Wiley: Hoboken, NJ, USA, 1987. [Google Scholar]
- Šeregelj, V.; Tumbas Šaponjac, V.; Lević, S.; Kalušević, A.; Ćetković, G.; Čanadanović-Brunet, J.; Vidaković, A. Application of encapsulated natural bioactive compounds from red pepper waste in yogurt. J. Microencapsul. 2019, 36, 704–714. [Google Scholar] [CrossRef]
- Agudelo, C.; Igual, M.; Camacho, M.M.; Martínez-Navarrete, N. Effect of process technology on the nutritional, functional, and physical quality of grapefruit powder. Food Sci. Technol. Int. 2017, 23, 61–74. [Google Scholar] [CrossRef] [PubMed] [Green Version]
- González, F.; Igual, M.; Camacho, M.M.; Martínez-Navarrete, N. Impact of temperature, gum Arabic and carboxymethyl cellulose on some physical properties of spray-dried grapefruit. Int. J. Food Eng. 2018, 14, 20170387. [Google Scholar] [CrossRef]
- Bodart, M.; de Peñaranda, R.; Deneyer, A.; Flamant, G. Photometry and colorimetry characterisation of materials in daylighting evaluation tools. Build Environ. 2008, 43, 2046–2058. [Google Scholar] [CrossRef]
- Rusell, L.F. Handbook of Food Analysis; Physical Characterisation and Nutrient Analysis; Marcel Dekker: New York, NY, USA, 2004. [Google Scholar]
- Pérez-Alonso, C.; Beristain, C.I.; Lobato-Calleros, C.; Rodríguez-Huezo, M.E.; Vernon-Carter, E.J. Thermodynamic analysis of the sorption isotherms of pure and blended carbohydrate polymers. J. Food Eng. 2006, 77, 753–760. [Google Scholar] [CrossRef]
- Igual, M.; Cebadera, L.; Cámara, R.M.; Agudelo, C.; Martínez-Navarrete, N.; Cámara, M. Novel ingredients based on grapefruit freeze-dried formulations: Nutritional and bioactive value. Foods 2019, 8, 506. [Google Scholar] [CrossRef] [Green Version]


| SM | PPSM | PFSM | |
|---|---|---|---|
| xw (gw/gsample) | 0.048 (0.014) a | 0.003 (0.002) b | 0.006 (0.004) b |
| aw | 0.225 (0.003) a | 0.031 (0.03) b | 0.039 (0.003) b |
| WAI (gsed/100 gdry solid) | 9.075 (0.012) a | 6.4 (0.3) b | 5.36 (0.18) c |
| WSI (%) | 24.4 (0.2) b | 16.2 (0.9) c | 29.0 (0.6) a |
| Hy (gw/100 gdry solid) | 106.2 (1.5) a | 58.40 (0.06) b | 53.9 (0.2) c |
| SM | PPSM | PFSM | |
|---|---|---|---|
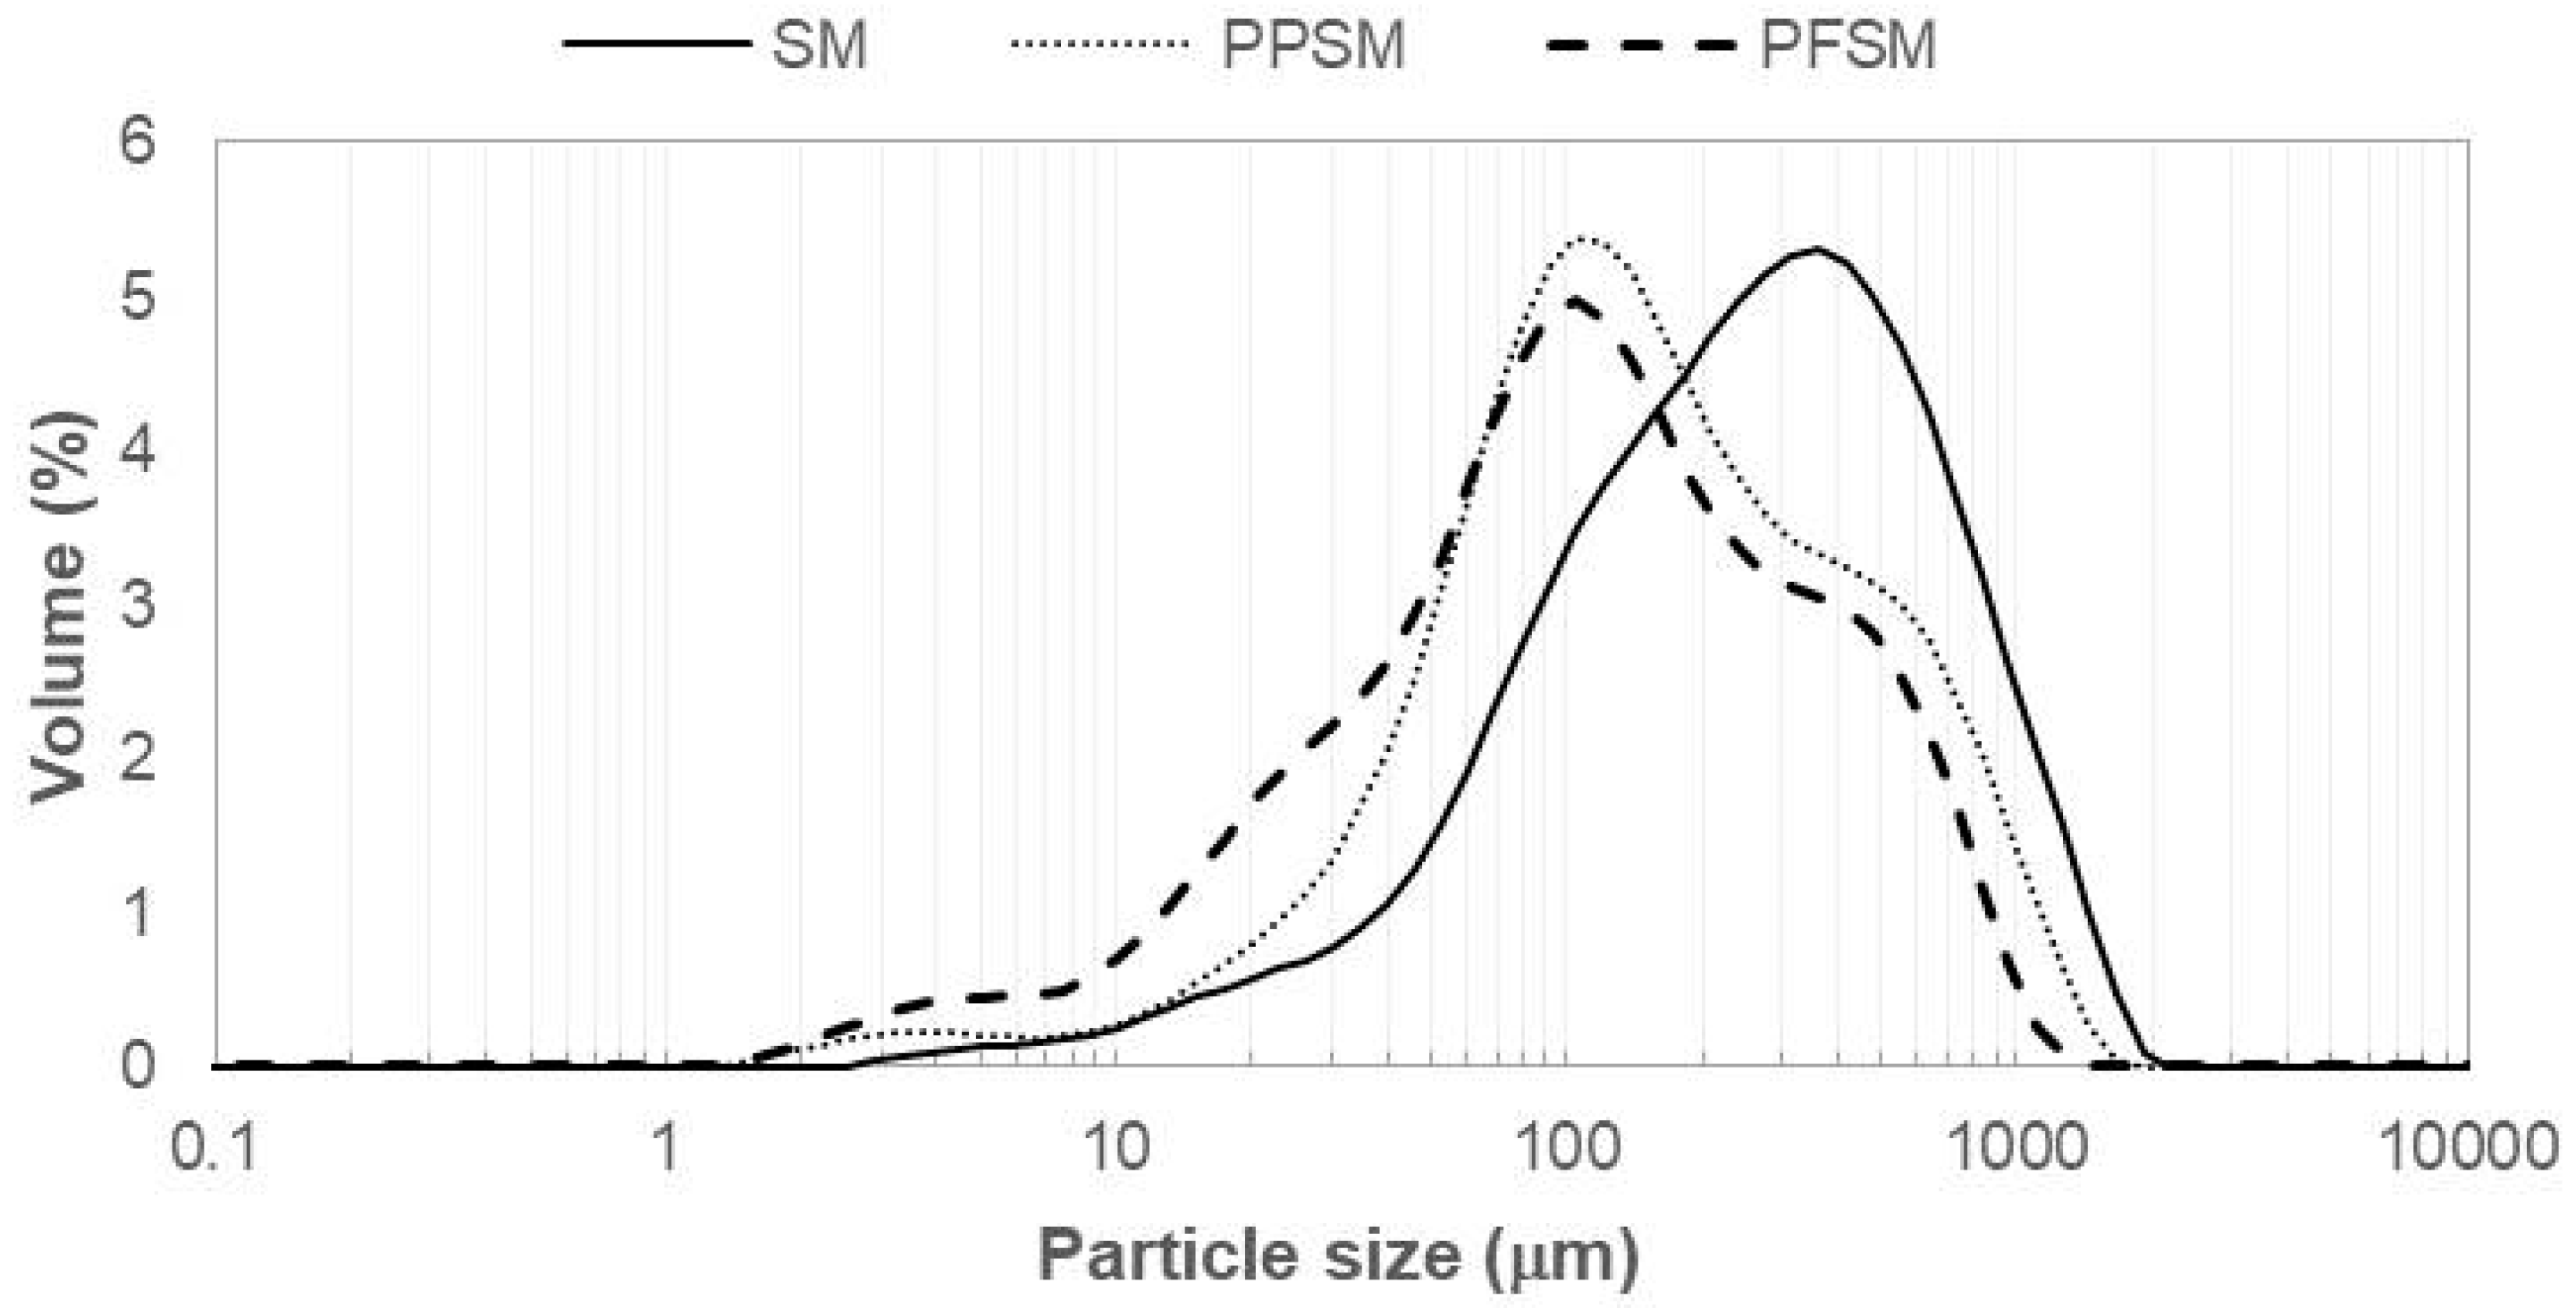
| D(4,3) (μm) | 340 (22) a | 230 (21) b | 163 (14) c |
| d(0.1) (μm) | 50.1 (1.4) a | 32.5 (1.2) b | 16 (2) c |
| d(0.5) (μm) | 242 (11) a | 132 (7) b | 95 (7) c |
| d(0.9) (μm) | 781 (63) a | 587 (62) b | 430 (39) c |
| ρb (g/cm3) | 0.1060 (0.0007) c | 0.253 (0.002) b | 0.323 (0.009) a |
| HR | 1.260 (0.014) a | 1.151 (0.012) b | 1.1765 (0.0012) b |
| CI | 20.6 (0.9) a | 13.1 (0.9) b | 15.0 (0.2) b |
| ε | 0.9333 (0.0013) a | 0.835 (0.002) b | 0.766 (0.002) c |
| aw | WAI | WSI | Hy | D(4,3) | d(0.1) | d(0.5) | d(0.9) | ρb | HR | CI | ε | |
|---|---|---|---|---|---|---|---|---|---|---|---|---|
| xw | 0.9552 * | 0.9061 * | 0.2202 | 0.9433 * | 0.8782 * | 0.7991 * | 0.9168 * | 0.8376 * | −0.8820 * | 0.9029 * | 0.9024 * | 0.8500 * |
| aw | 0.9471 * | 0.1956 | 0.9932 * | 0.9340 * | 0.8567 * | 0.9599 * | 0.8699 * | −0.9359 * | 0.9704 * | 0.9666 * | 0.8957 * | |
| WAI | −0.1237 | 0.9761 * | 0.9905 * | 0.9655 * | 0.9925 * | 0.9711 * | −0.9922 * | 0.8544 * | 0.8450 * | 0.9877 * | ||
| WSI | 0.0830 | −0.1589 | −0.3276 | −0.0770 | −0.2918 | 0.1559 | 0.3756 | 0.3932 | −0.2583 | |||
| Hy | 0.9677 * | 0.9090 * | 0.9836 * | 0.9155 * | −0.9691 * | 0.9454 * | 0.9397 * | 0.9403 * | ||||
| D(4,3) | 0.9844 * | 0.9954 * | 0.9831 * | −0.9999 * | 0.8430 * | 0.8337 * | 0.9926 * | |||||
| d(0.1) | 0.9649 * | 0.9912 * | −0.9835 * | 0.7398 | 0.7281 | 0.9936 * | ||||||
| d(0.5) | 0.9725 * | −0.9960 | 0.8758 * | 0.8679 * | 0.9814 * | |||||||
| d(0.9) | −0.9830 * | 0.7399 | 0.7289 | 0.9906 * | ||||||||
| ρb | −0.8443 * | −0.8349 * | −0.9930 * | |||||||||
| HR | 0.9997 * | 0.7850 | ||||||||||
| CI | 0.7741 |
| SM | PPSM | PFSM | |
|---|---|---|---|
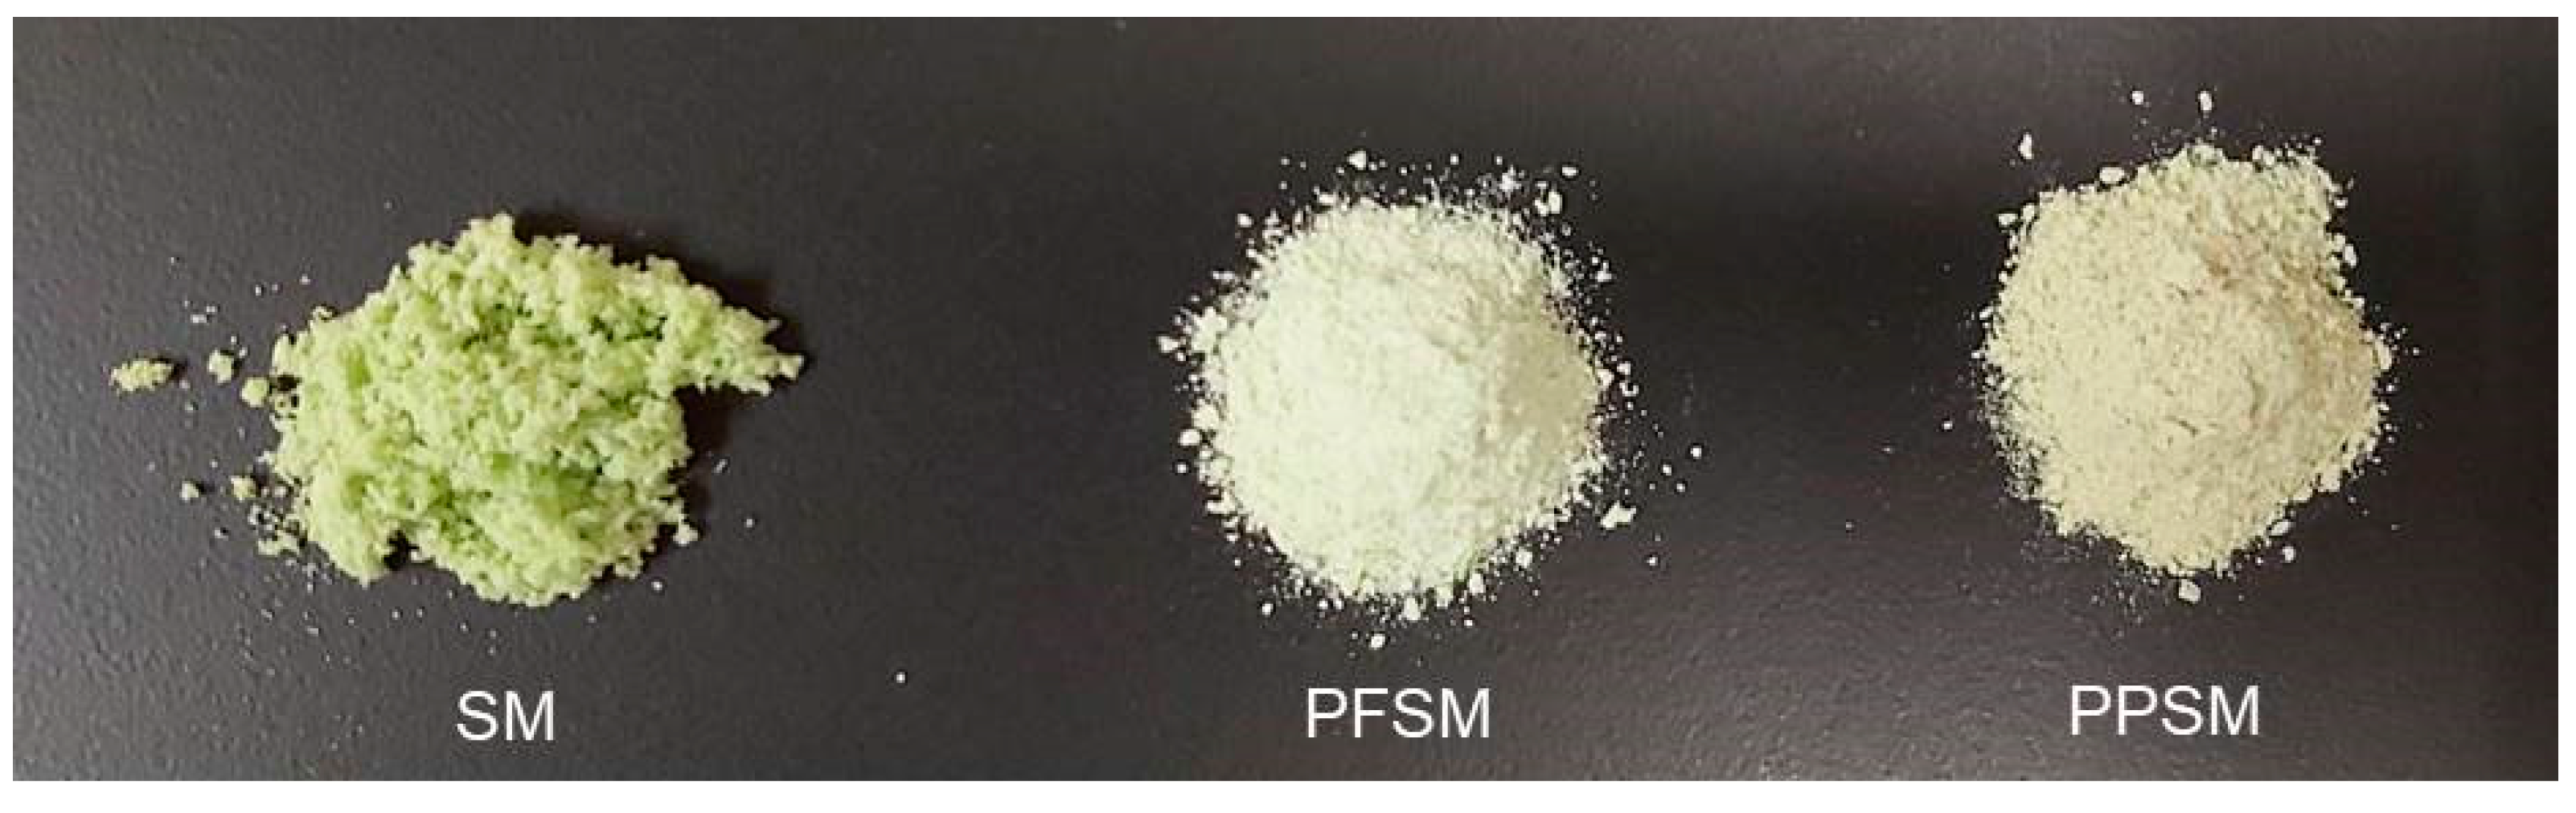
| L * | 70.6 (0.5) c | 75.3 (0.2) b | 79.4 (0.7) a |
| a * | −9.42 (0.03) c | −2.92 (0.07) a | −6.69 (0.13) b |
| b * | 28.65 (0.15) a | 25.1 (0.2) b | 20.8 (0.4) c |
| C * | 30.16 (0.13) a | 25.26 (0.18) b | 21.9 (0.4) c |
| h * | 288.20 (0.13) a | 276.6 (0.2) c | 287.82 (0.18) b |
| ΔE | 8.795 (0.105) b | 12.1 (0.6) a |
| SM | PPSM | PFSM | |
|---|---|---|---|
| AA | 25.91 (0.09) b | 28.9 (0.3) a | 25.52 (0.03) c |
| VC | 54.86 (0.09) c | 65.3 (0.9) b | 70.63 (0.12) a |
| TF | 1.038 (0.003) b | 1.12 (0.12) b | 1.44 (0.06) a |
| TC | 32.85 (0.13) b | 32.05 (0.09) c | 40.7 (0.3) a |
| Cha | 84.7 (0.9) b | 86.5 (0.7) b | 99. (2) a |
| TP | 258 (5) b | 291 (21) ab | 307 (4) a |
| AC | 186 (9) b | 229 (2) a | 240 (4) a |
Disclaimer/Publisher’s Note: The statements, opinions and data contained in all publications are solely those of the individual author(s) and contributor(s) and not of MDPI and/or the editor(s). MDPI and/or the editor(s) disclaim responsibility for any injury to people or property resulting from any ideas, methods, instructions or products referred to in the content. |
© 2023 by the authors. Licensee MDPI, Basel, Switzerland. This article is an open access article distributed under the terms and conditions of the Creative Commons Attribution (CC BY) license (https://creativecommons.org/licenses/by/4.0/).
Share and Cite
Igual, M.; Flores-León, A.; Picó, B.; Martínez-Monzó, J.; García-Segovia, P. Physicochemical, Structural, and Functional Properties of Snake Melon (Cucumis melo subsp. melo Var. flexuosus) Microencapsulated with Pea Protein and Pea Fibre by Freeze-Drying. Foods 2023, 12, 2679. https://doi.org/10.3390/foods12142679
Igual M, Flores-León A, Picó B, Martínez-Monzó J, García-Segovia P. Physicochemical, Structural, and Functional Properties of Snake Melon (Cucumis melo subsp. melo Var. flexuosus) Microencapsulated with Pea Protein and Pea Fibre by Freeze-Drying. Foods. 2023; 12(14):2679. https://doi.org/10.3390/foods12142679
Chicago/Turabian StyleIgual, Marta, Alejandro Flores-León, Belén Picó, Javier Martínez-Monzó, and Purificación García-Segovia. 2023. "Physicochemical, Structural, and Functional Properties of Snake Melon (Cucumis melo subsp. melo Var. flexuosus) Microencapsulated with Pea Protein and Pea Fibre by Freeze-Drying" Foods 12, no. 14: 2679. https://doi.org/10.3390/foods12142679