
Effects of UV-B and Water Deficit on Aroma Precursors in Grapes and Flavor Release during Wine Micro-Vinification and Consumption

 ,
,
Abstract
:1. Introduction
2. Materials and Methods
2.1. Treatments
2.2. UV-B Treatment
- (1)
- UV-B control treatment (−UV): 12 vines were exposed to normal sunlight and day length in the glasshouse. A UV filter was placed between the –UV chamber and +UV chamber to block UV. The environment in the glasshouse was maintained at 22 °C/18 °C, day/night, and a relative humidity of 70–80%.
- (2)
- UV-B treatment (+UV): UV-B-313 UV fluorescent tubes (313, Q-Lab Company, Westlake, OH, USA) were supported above the 12 vines. Fluence rates of UV-B (280–313 nm) were measured by a UV-B Biometer model 501 radiometer (Solar Light Company, Glenside, PA, USA). The environment in the glasshouse was the same as for the control. In the UV area, the intensity of UV-B was maintained at UVI-6 for 8 h/d (9:00–17:00).
2.3. Water Treatment
- (1)
- Well-watered control treatment (+W): Six vines in each UV treatment were regularly irrigated. The soil volumetric water content was around 30%.
- (2)
- Water-deficit treatment (−W): Six vines received less than 50% of the water used in the well-watered irrigation treatment. The soil volumetric water content was around 10%.
2.4. Micro-Vinification
2.5. Amino Acid Analysis of Grapes and Wine by HPLC
2.6. General Wine Parameters
2.7. Wine Volatile Compound Analysis by GC-MS
2.8. Statistical Analysis
3. Result
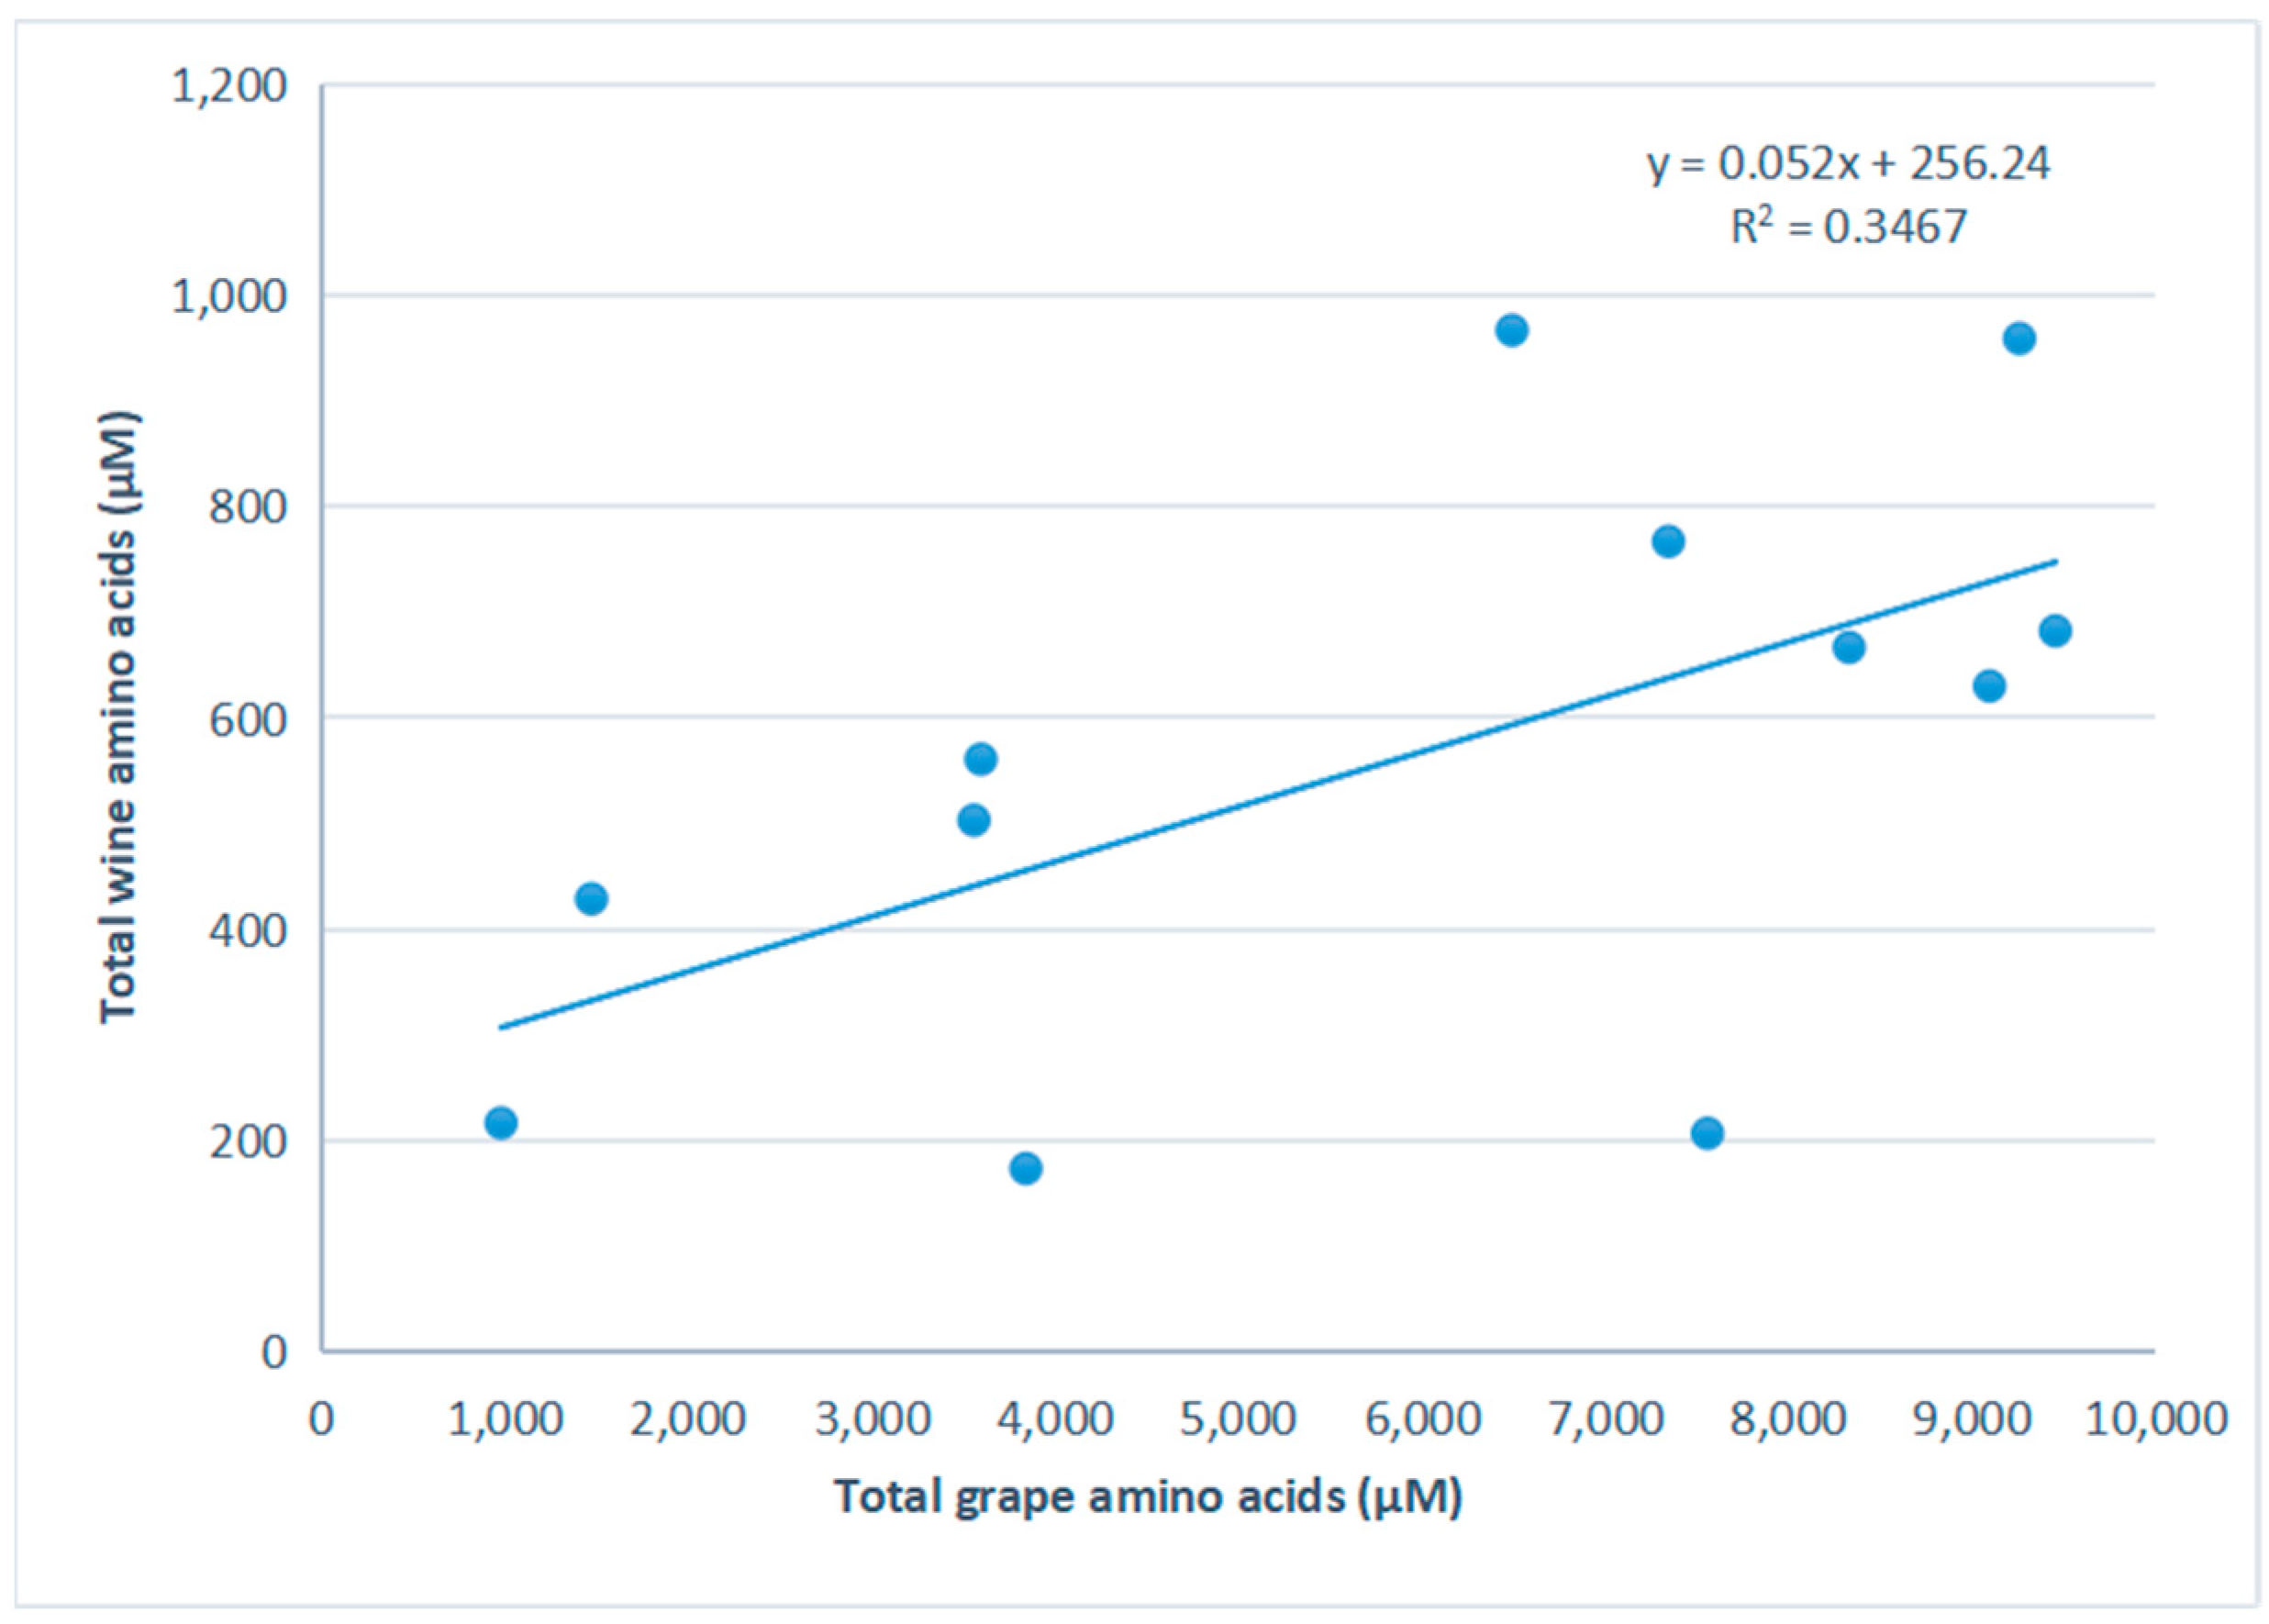
3.1. Grape and Wine Amino Acids
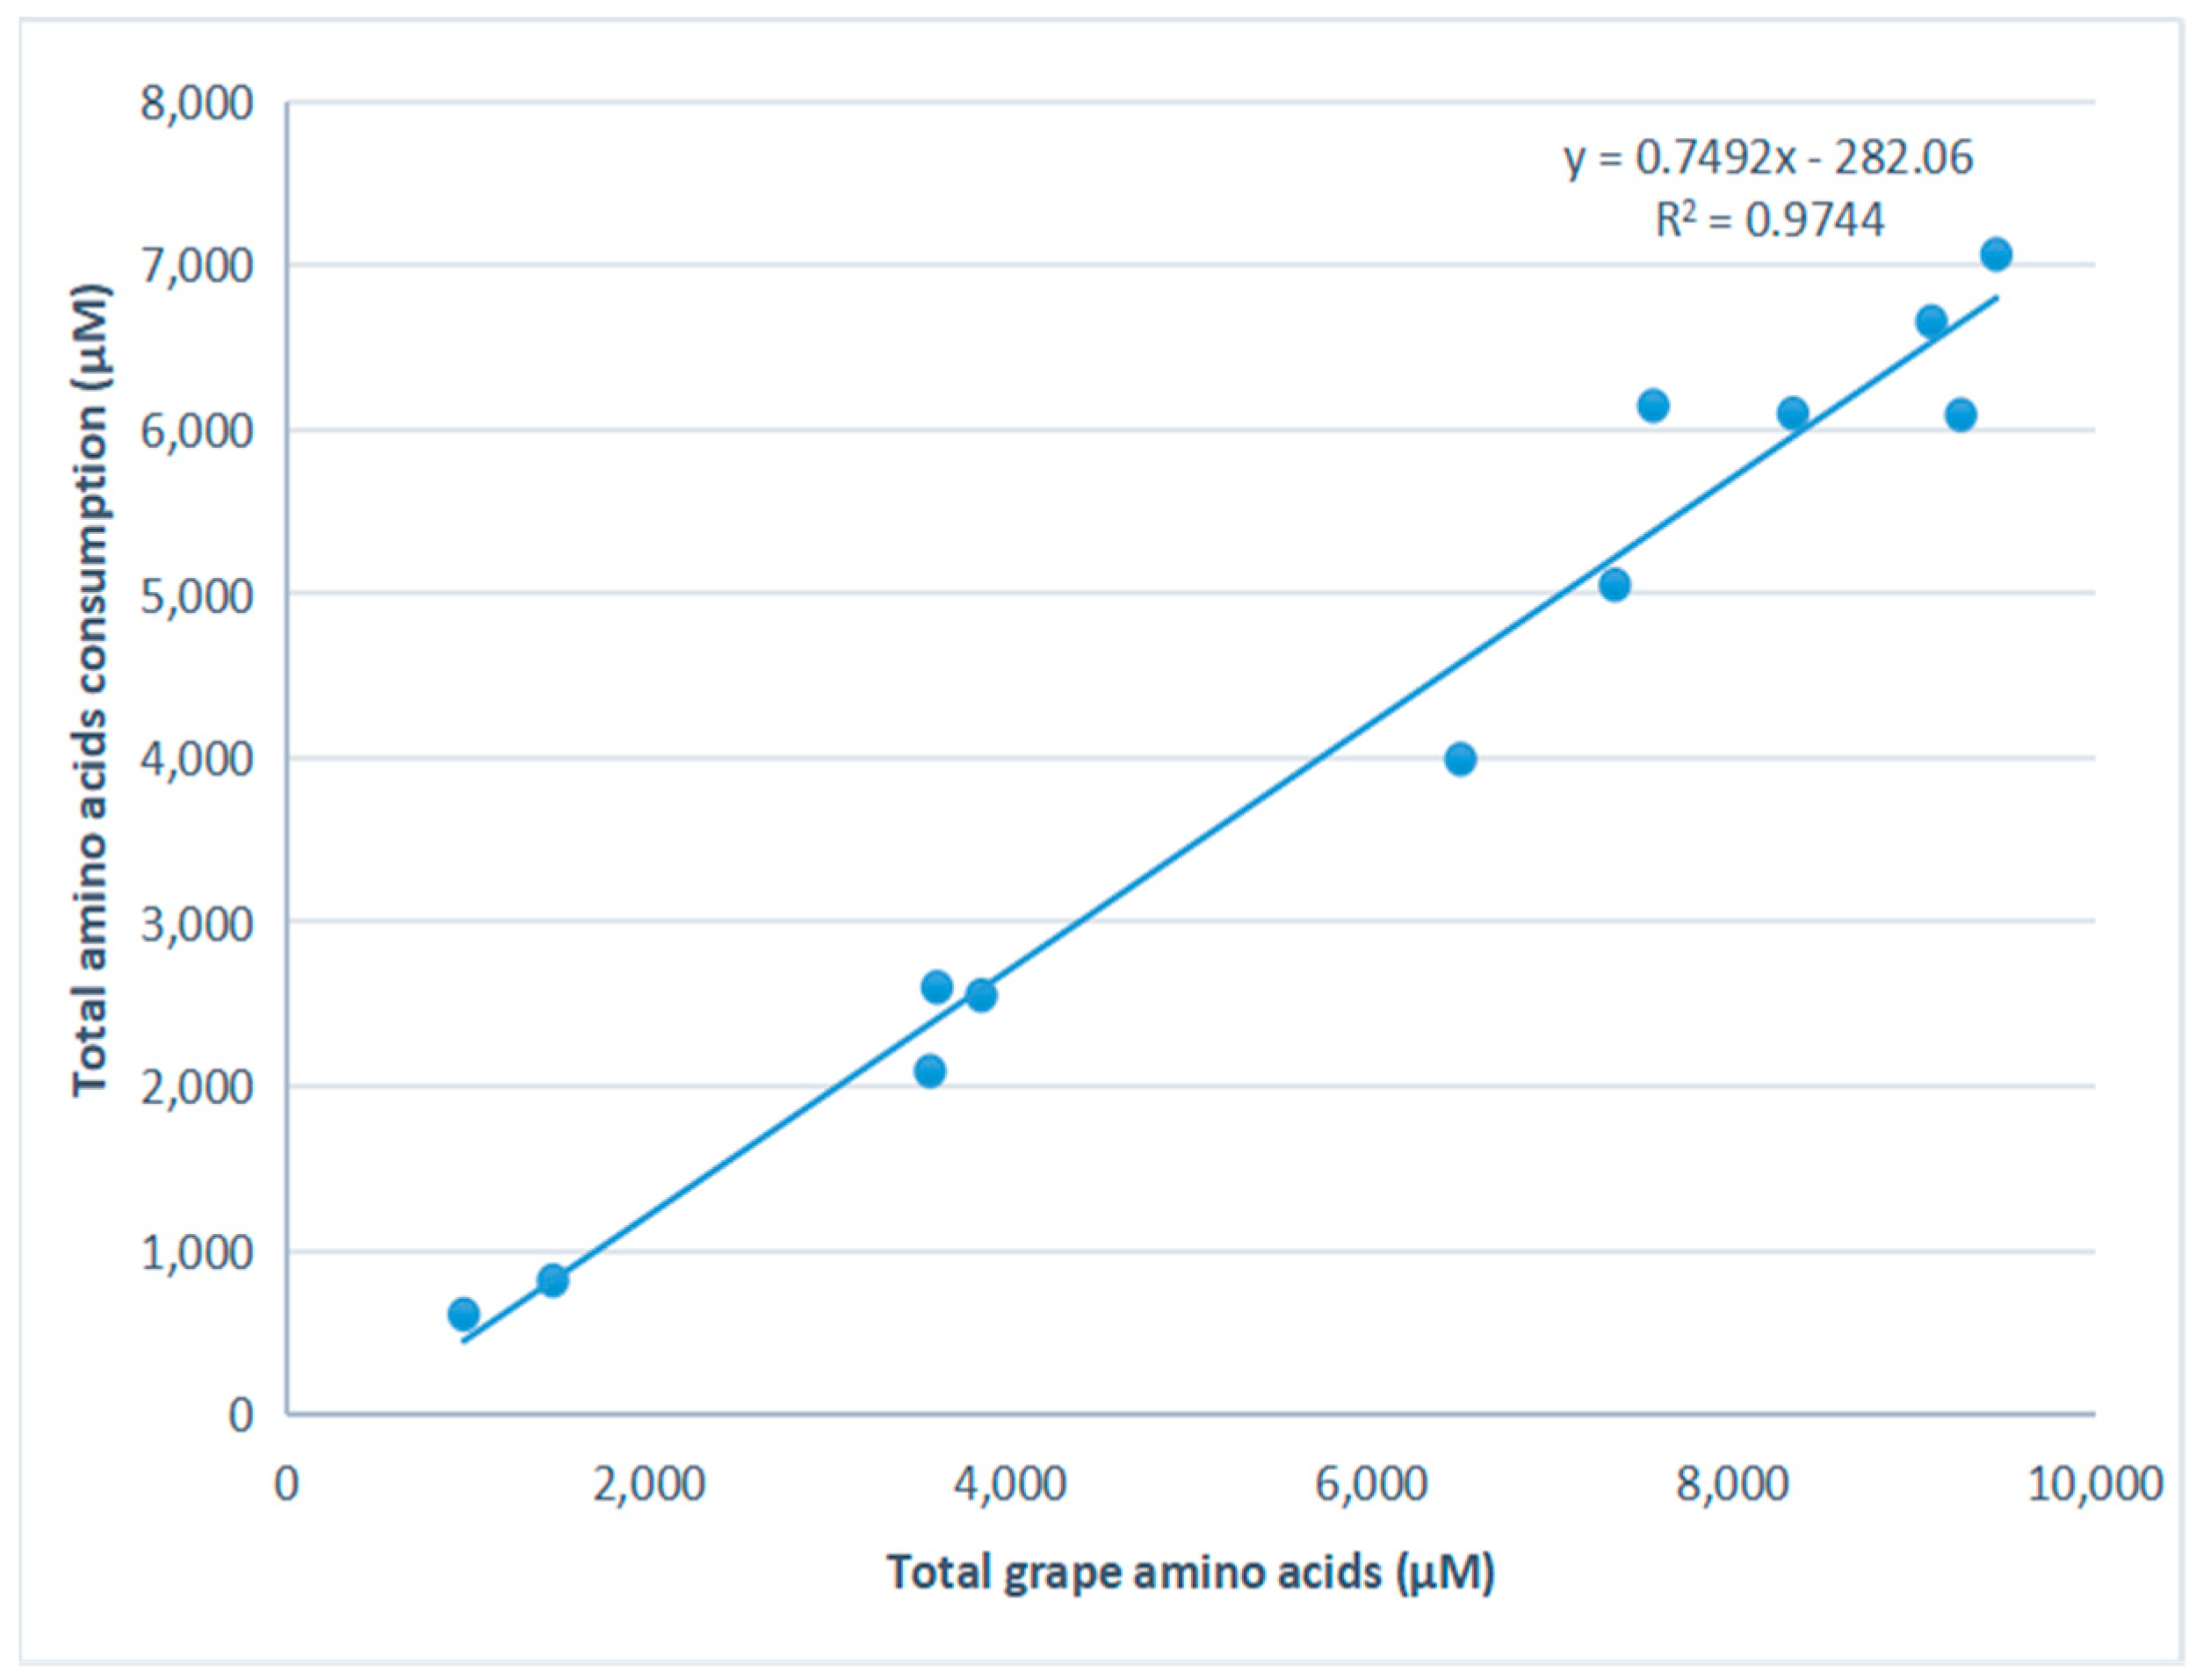
3.2. Amino Acid Consumption
3.3. Wine Aroma
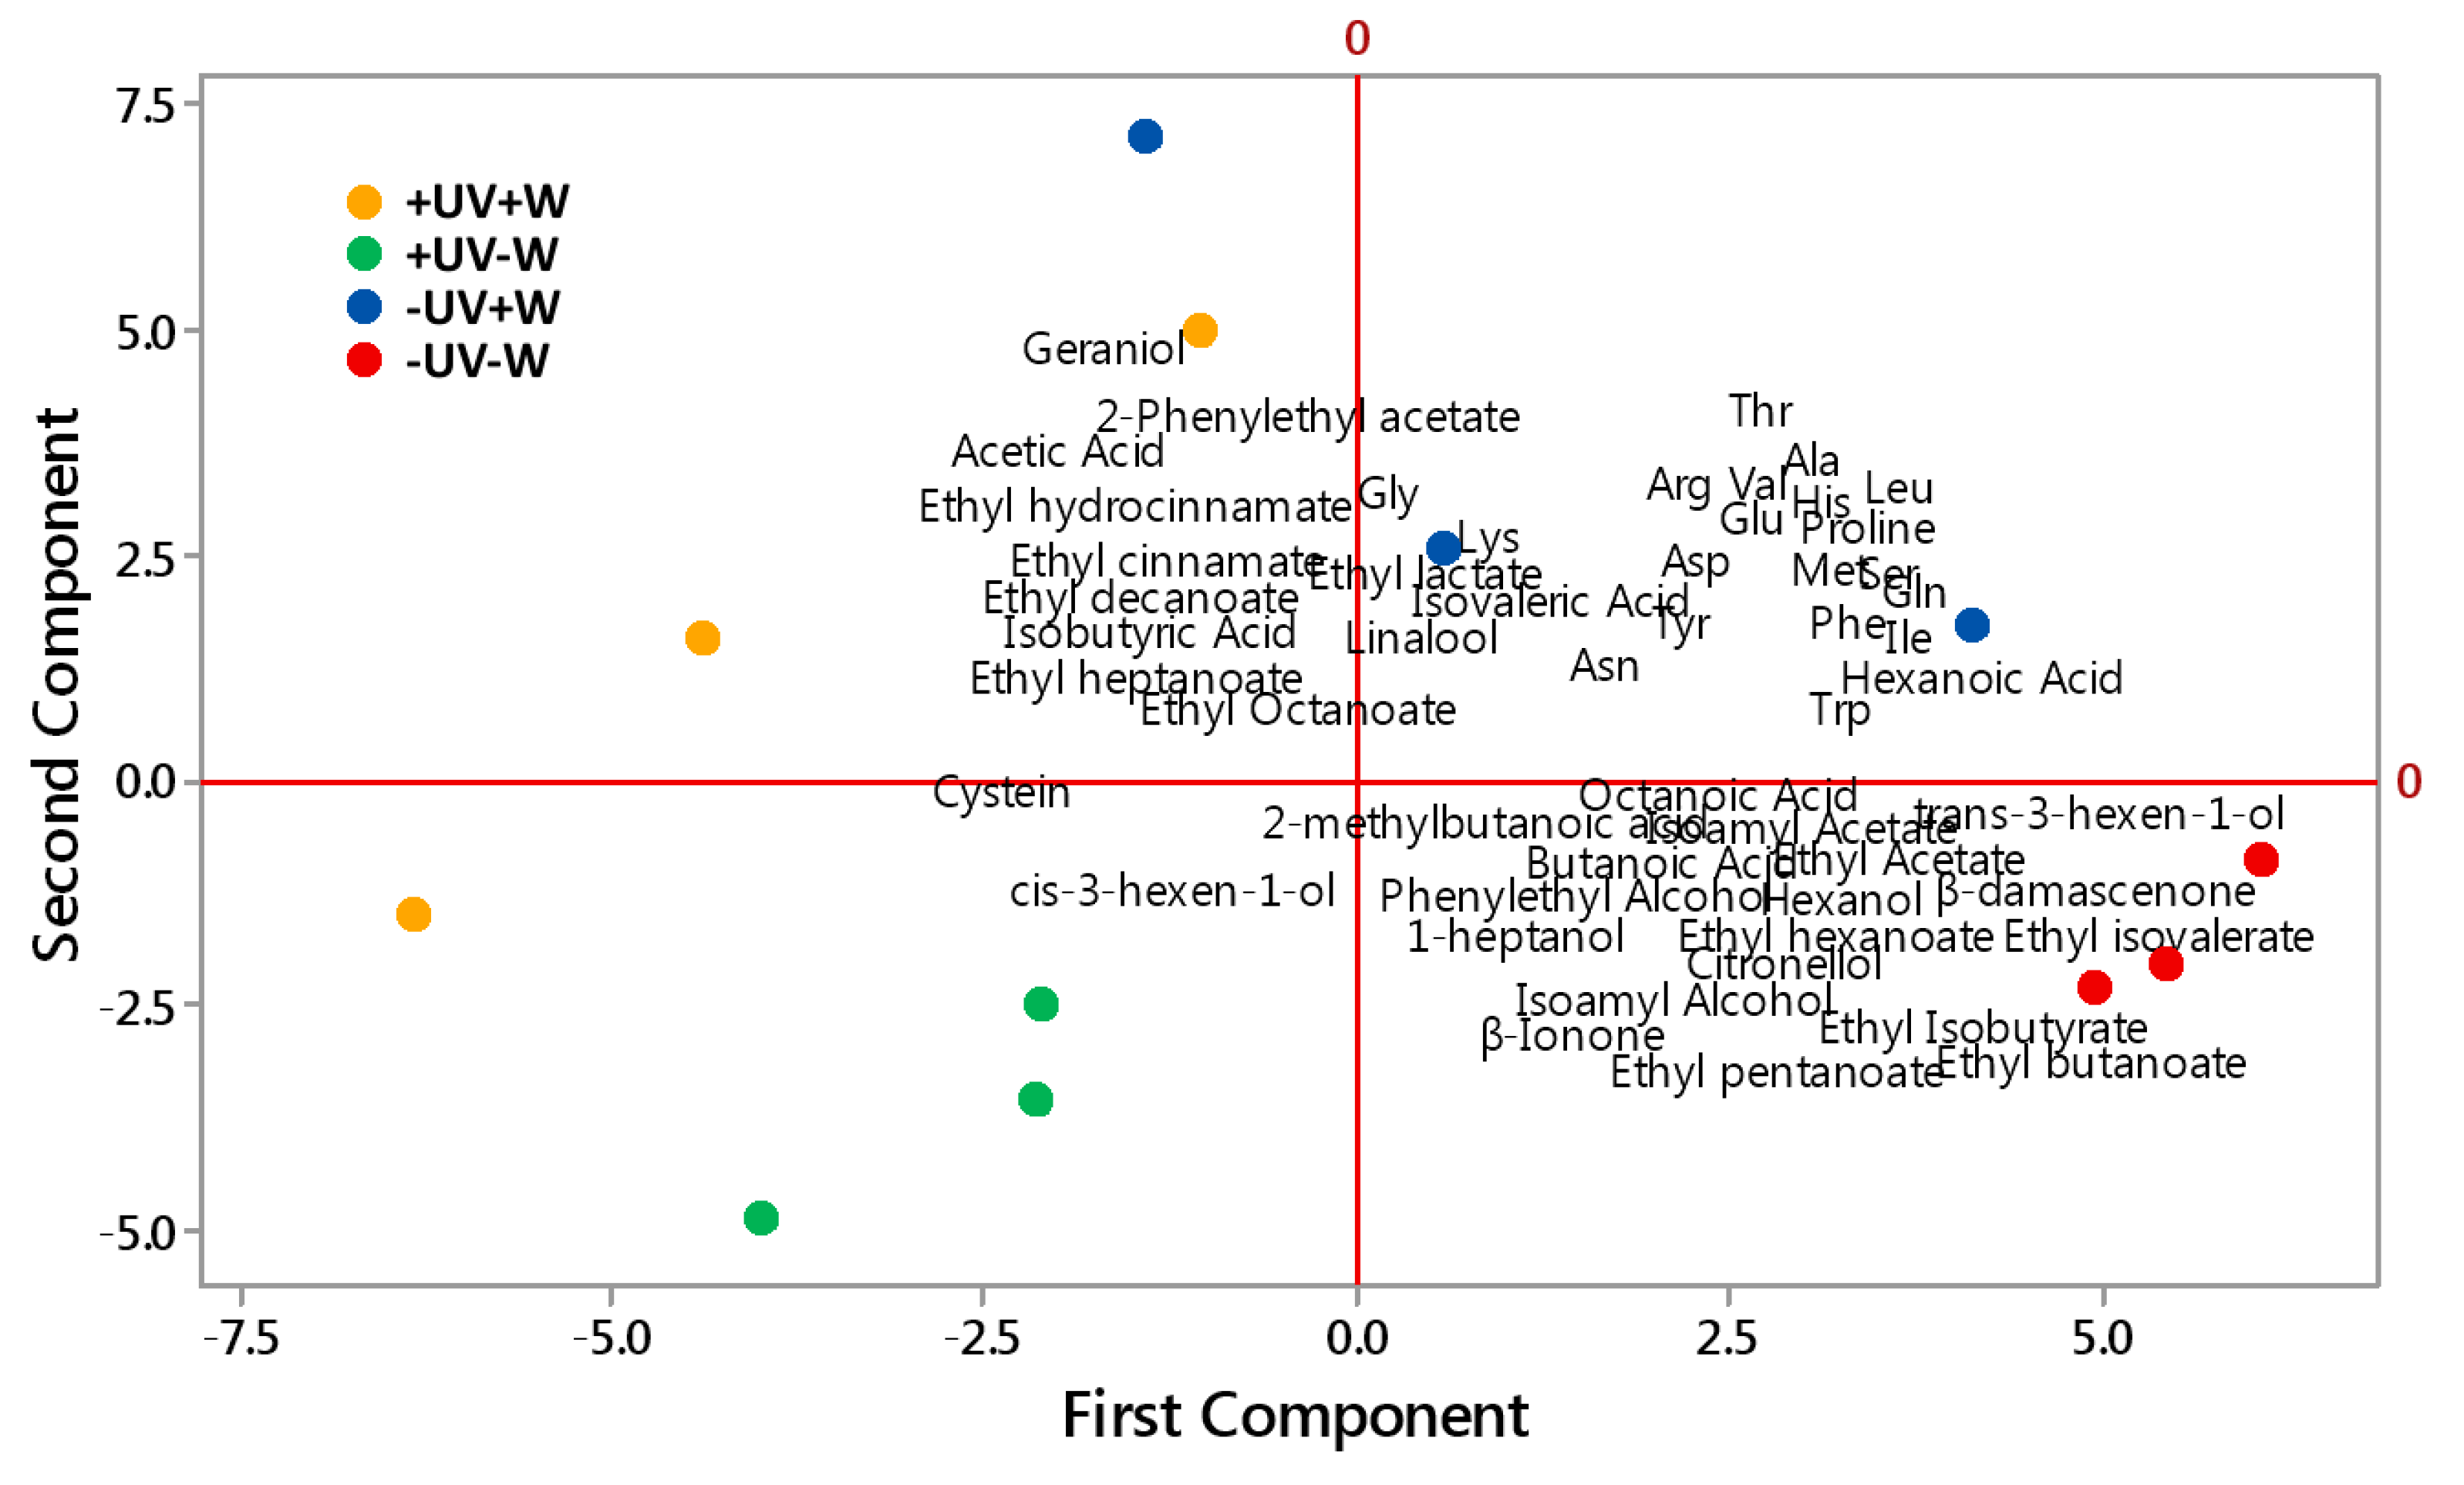
3.4. PCA
4. Discussion
4.1. The Alteration of Amino Acids
4.2. Amino Acid Consumption
4.3. Changing Wine Aroma Compounds
4.3.1. Terpenes
4.3.2. C13-Norisoprenoids
4.3.3. Alcohols
4.3.4. Fatty Acids
4.3.5. Esters
4.4. PCA
5. Conclusions
Supplementary Materials
Author Contributions
Funding
Institutional Review Board Statement
Informed Consent Statement
Data Availability Statement
Conflicts of Interest
References
- Rapp, A.; Versini, G. Influence of nitrogen compounds in grapes on aroma compounds of wines. Dev. Food Sci. 1995, 37, 1659–1694. [Google Scholar]
- González-Barreiro, C.; Rial-Otero, R.; Cancho-Grande, B.; Simal-Gándara, J. Wine Aroma Compounds in Grapes: A Critical Review. Crit. Rev. Food Sci. Nutr. 2015, 55, 202–218. [Google Scholar] [CrossRef] [PubMed]
- Li, Z.; Howell, K.; Fang, Z.; Zhang, P. Sesquiterpenes in grapes and wines: Occurrence, biosynthesis, functionality, and influence of winemaking processes. Compr. Rev. Food Sci. Food Saf. 2020, 19, 247–281. [Google Scholar] [CrossRef] [PubMed]
- Cohen, S.D.; Kennedy, J.A. Plant Metabolism and the Environment: Implications for Managing Phenolics. Crit. Rev. Food Sci. Nutr. 2010, 50, 620–643. [Google Scholar] [CrossRef] [PubMed]
- Martínez-Lüscher, J.; Torres, N.; Hilbert, G.; Richard, T.; Sánchez-Díaz, M.; Delrot, S.; Gomès, E. Ultraviolet-B radiation modifies the quantitative and qualitative profile of flavonoids and amino acids in grape berries. Phytochemistry 2014, 102, 106–114. [Google Scholar] [CrossRef] [PubMed]
- Jiménez-Martí, E.; Del Olmo, M.L. Addition of ammonia or amino acids to a nitrogen-depleted medium affects gene expression patterns in yeast cells during alcoholic fermentation. FEMS Yeast Res. 2010, 8, 245–256. [Google Scholar] [CrossRef] [Green Version]
- Yoshizawa, K.; Yamada, M. The Formation of Higher Alcoholsin the Fermentation of Amino Acids by Yeast. Agric. Biol. Chem. 2014. [Google Scholar]
- Bell, S.J.; Henschke, P.A. Implications of nitrogen nutrition for grapes, fermentation and wines. Aust. J. Grape Wine Res. 2005, 11, 242–295. [Google Scholar] [CrossRef]
- Ancín-Azpilicueta, G. Effect of the addition of different quantities of amino acids to nitrogen-deficient must on the formation of esters, alcohols, and acids during wine alcoholic fermentation. LWT-Food Sci. Technol. 2008, 41, 501–510. [Google Scholar]
- Dambergs, R.G.; Sparrow, A.M. The “Bodum French Press”: A simple, reliable small-lot red wine fermentation method. In Proceedings of the 14th Australian Wine Industry Technical Conference, Adelaide, Australia, 3–8 July 2010; p. 353. [Google Scholar]
- Gregan, S.M.; Wargent, J.J.; Liu, L.; Shinkle, J.; Hofmann, R.; Winefield, C.; Jordan, B. Effects of solar ultraviolet radiation and canopy manipulation on the biochemical composition of Sauvignon Blanc grapes. Aust. J. Grape Wine Res. 2012, 18, 227–238. [Google Scholar] [CrossRef]
- Iland, P.; Ewart, A.; Sitters, J.; Markides, A.; Bruer, N. Techniques for Chemical Analysis and Quality Monitoring During Winemaking; Patrick Iland Wine Productions: Adelaide, Australia, 2000. [Google Scholar]
- Tomasino, E.; Harrison, R.; Breitmeyer, J.; Sedcole, R.; Sherlock, R.; Frost, A. Aroma composition of 2-year-old New Zealand Pinot Noir wine and its relationship to sensory characteristics using canonical correlation analysis and addition/omission tests. Aust. J. Grape Wine Res. 2015, 21, 376–388. [Google Scholar] [CrossRef]
- Song, J.; Smart, R.; Wang, H.; Dambergs, B.; Sparrow, A.; Qian, M.C. Effect of grape bunch sunlight exposure and UV radiation on phenolics and volatile composition of Vitis vinifera L. cv. Pinot noir wine. Food Chem. 2015, 173, 424–431. [Google Scholar] [CrossRef] [PubMed]
- Arias-Gil, M.; Garde-Cerdan, T.; Ancin-Azpilicueta, C. Influence of addition of ammonium and different amino acid concentrations on nitrogen metabolism in spontaneous must fermentation. Food Chem. 2007, 103, 1312–1318. [Google Scholar] [CrossRef]
- Jiménez-Moreno, N.; Moler, J.A.; Palacios, M.B.; Esparza, I.; Ancín-Azpilicueta, C. Foliar application of urea to Tempranillo vines increased the amino acid concentration of the must. Food Addit. Contam. Part A 2019, 37, 216–227. [Google Scholar] [CrossRef]
- Jacob, F.F. The Biodiversity of Yeast Extract Produced from Brewer’s Spent Yeast and Its Reuse in the Brewing Process; Technische Universität Berlin: Berlin, Germany, 2020. [Google Scholar]
- Henschke, P.A.; Jiranek, V. Yeasts-Metabolism of Nitrogen Compounds in Wine Microbiology and Biotechnology; GlenOsmond, Australia, 1993. [Google Scholar]
- Styger, G.; Prior, B.; Bauer, F.F. Wine flavor and aroma. J. Ind. Microbiol. Biotechnol. 2011, 38, 1145–1159. [Google Scholar] [CrossRef]
- Sasaki, K.; Takase, H.; Matsuyama, S.; Kobayashi, H.; Matsuo, H.; Ikoma, G.; Takata, R. Effect of light exposure on linalool biosynthesis and accumulation in grape berries. Biosci. Biotechnol. Biochem. 2016, 80, 2376–2382. [Google Scholar] [CrossRef] [Green Version]
- Fang, Y.; Qian, M.C. Quantification of Selected Aroma-Active Compounds in Pinot Noir Wines from Different Grape Maturities. J. Agric. Food Chem. 2006, 54, 8567–8573. [Google Scholar] [CrossRef]
- Wang, J.; Abbey, T.; Kozak, B.; Madilao, L.L.; Tindjau, R.; Nin, J.D.; Castellarin, S.D. Evolution over the growing season of volatile organic compounds in Viognier (Vitis vinifera L.) grapes under three irrigation regimes. Food Res. Int. 2019, 125, 108511–108514. [Google Scholar] [CrossRef]
- Ribéreaugayon, P.; Dubourdieu, D.; Donèche, B.; Lonvaud, A.; Ribéreaugayon, P.; Dubourdieu, D.; Lonvaud, A. Handbook of Enology, Volume 1, 2nd Edition, The Microbiology of Wine and Vinifications; John Wiley & Sons: Hoboken, NJ, USA, 2006. [Google Scholar]
- Kwasniewski, M.T.; Heuvel, J.V.; Pan, B.S.; Sacks, G.L. Timing of cluster light environment manipulation during grape development affects C13 norisoprenoid and carotenoid concentrations in Riesling. J. Agric. Food Chem. 2010, 58, 6841–6849. [Google Scholar] [CrossRef]
- Hernandez-Orte, P.; Cersosimo, M.; Loscos, N.; Cacho, J.; Garcia-Moruno, E.; Ferreira, V. The development of varietal aroma from non-floral grapes by yeasts of different genera. Food Chem. 2008, 107, 1064–1077. [Google Scholar] [CrossRef]
- Oliveira, C.; Ferreira, A.C.; Costa, P.; Guerra, J.; Pinho, P. Effect of Some Viticultural Parameters on the Grape Carotenoid Profile. J. Agric. Food Chem. 2004, 52, 4178–4184. [Google Scholar] [CrossRef] [PubMed]
- Ugliano, M.; Henschke, P.A. Yeasts and Wine Flavour. In Wine Chemistry and Biochemistry; Springer: New York, NY, USA, 2009. [Google Scholar]
- Valdes, M.E.; Talaverano, M.I.; Moreno, D.; Prieto, M.H.; Mancha, L.A.; Uriarte, D.; Vilanova, M. Effect of the timing of water deficit on the must amino acid profile of Tempranillo grapes grown under the semiarid conditions of SW Spain. Food Chem. 2019, 292, 24–31. [Google Scholar] [CrossRef] [PubMed]
- Zhao, X.; Yang, X.; Sun, Y.; Dong, S.; Yang, Z. Effects of Low Nitrogen Stress on the Amount of Higher Alcohols in Wine in Saccharomyces Cerevisiae. In Proceedings of the 2019 2nd International Conference on Sustainable Energy, Environment and Information Engineering (SEEIE 2019), Beijing, China, 24–25 March 2019. [Google Scholar]
- Torija, M.J.; Beltran, G.; Novo, M.; Poblet, M.; Rozès, N. Effects of fermentation temperature and Saccharomyces species on the cell fatty acid composition and presence of volatile compounds in wine. Int. J. Food Microbiol. 2003, 85, 127–136. [Google Scholar] [CrossRef]
- Cheng, X.; Liang, Y.; Zhang, A.; Wang, P.; Sun, X. Using foliar nitrogen application during veraison to improve the flavor components of grape and wine. J. Sci. Food Agric. 2020, 101, 1288–1300. [Google Scholar] [CrossRef] [PubMed]
- Borren, E.; Tian, B. The Important Contribution of Non-Saccharomyces Yeasts to the Aroma Complexity of Wine: A Review. Foods 2020, 10, 13. [Google Scholar] [CrossRef] [PubMed]
- Wang, Y.-Q. Synergistic effects of branched-chain amino acids and phenylalanine addition on major volatile compounds in wine during alcoholic fermentation. S. Afr. J. Enol. Vitic. 2016, 37, 169–175. [Google Scholar] [CrossRef] [Green Version]
- Paul, B.; Anthony, P.; Zhao, Y.; Emily, N.; Eric, D.; David, J. Potential Grape-Derived Contributions to Volatile Ester Concentrations in Wine. Molecules 2015, 20, 7845–7873. [Google Scholar]
- Kong, C.L.; Li, A.H.; Jin, G.J.; Zhu, X.L.; Tao, Y.S. Evolution of volatile compounds treated with selected non-Saccharomyces extracellular extract during Pinot noir winemaking in monsoon climate. Food Res. Int. 2019, 119, 177–186. [Google Scholar] [CrossRef]
- Giorgi, E.G.; Sadras, V.O.; Keller, M.; Pena, J.P. Interactive effects of high temperature and water deficit on Malbec grapevines. Aust. J. Grape Wine Res. 2019, 25, 345–356. [Google Scholar] [CrossRef]


| UV-B Radiation | UV-B Exclusion | |
|---|---|---|
| Well water | +UV+W (6 vines) | −UV+W (6 vines) |
| Water stress | +UV−W (6 vines) | −UV−W (6 vines) |
| Treatment | p Value | ||||||
|---|---|---|---|---|---|---|---|
| +UV+W | +UV−W | −UV+W (Control) | −UV−W | UV | W | UV*Water | |
| °Brix | 21.0 | 19.1 | 21.0 | 22.0 | n.s. | n.s. | n.s. |
| TA | 5.4 | 5.4 | 6.6 | 6.4 | n.s. | n.s. | n.s. |
| pH | 3.69 | 3.66 | 3.76 | 3.76 | 0.04 | n.s. | n.s. |
| α-ketoglutarate | |||||||
| Proline (Pro) | 891 | 608 | 1765 | 1869 | 0.00 | n.s. | n.s. |
| Argnine (Arg) | 976 | 494 | 2176 | 1324 | 0.00 | 0.00 | n.s. |
| Glutamate (Glu) | 331 | 253 | 532 | 485 | 0.00 | 0.01 | n.s. |
| Glutamine (Gln) | 158 | 127 | 380 | 417 | 0.00 | n.s. | n.s. |
| Histidine (His) | 84 | 72 | 174 | 150 | 0.00 | n.s. | n.s. |
| Shikimate (Aromatic) | |||||||
| Phenylalanine (Phe) | 34 | 26 | 70 | 101 | 0.00 | 0.01 | 0.00 |
| Tryptophane (Trp) | 35 | 52 | 59 | 69 | 0.00 | 0.02 | n.s. |
| Tyrosine (Tyr) | 4 | 0 | 9 | 22 | 0.00 | 0.02 | 0.00 |
| Pyruvate | |||||||
| Leucine (Leu) | 56 | 46 | 150 | 163 | 0.00 | n.s. | n.s. |
| Valine (Val) | 93 | 95 | 203 | 178 | 0.00 | n.s. | n.s. |
| Alanine (Ala) | 692 | 490 | 1532 | 1238 | 0.00 | 0.04 | n.s. |
| Aspartate | |||||||
| Aspartic acid (Asp) | 174 | 99 | 363 | 309 | 0.00 | 0.01 | n.s. |
| Asparagine (Asn) | 5 | 15 | 49 | 60 | 0.00 | 0.00 | n.s. |
| Threonine (Thr) | 283 | 206 | 713 | 540 | 0.00 | 0.02 | n.s. |
| Isoleucine (Ile) | 27 | 39 | 86 | 118 | 0.00 | 0.02 | n.s. |
| Methionine (Met) | 11 | 5 | 23 | 31 | 0.00 | n.s. | 0.05 |
| Lysine (Lys) | 17 | 28 | 55 | 39 | 0.00 | n.s. | 0.00 |
| 3-phosphoglycerate | |||||||
| Cysteine (Cys) | N.A | N.A | N.A | N.A | N.A | N.A | N.A |
| Serine (Ser) | 242 | 198 | 571 | 517 | 0.00 | n.s. | n.s. |
| Glycine (Gly) | 11 | 20 | 49 | 67 | 0.02 | 0.01 | n.s. |
| Total | 4124 | 2873 | 8959 | 7697 | 0.00 | n.s. | n.s. |
| Treatment | p Value | ||||||
|---|---|---|---|---|---|---|---|
| +UV+W | +UV−W | −UV+W (control) | −UV−W | UV | W | UV*Water | |
| TA | 7.1 | 5.9 | 7.2 | 6.0 | n.s. | n.s. | n.s. |
| pH | 4.4 | 4.0 | 4.4 | 4.7 | n.s. | n.s. | n.s. |
| α-ketoglutarate | |||||||
| Pro | 69.8 | 69.9 | 72.8 | 114.9 | 0.00 | n.s. | n.s. |
| Arg | 4.4 | 3.2 | 2.5 | 4.6 | 0.03 | n.s. | n.s. |
| Glu | 17.7 | 40.3 | 49.6 | 67.2 | 0.00 | 0.00 | n.s. |
| Gln | 2.8 | 18.5 | 19.0 | 24.5 | 0.00 | n.s. | n.s. |
| His | 3.2 | 9.3 | 10.9 | 14.5 | 0.03 | n.s. | n.s. |
| Shikimate (Aromatic) | |||||||
| Phe | 1.2 | 10.5 | 16.4 | 22.7 | 0.02 | n.s. | n.s. |
| Trp | 0.8 | 1.2 | 1.4 | 2.2 | n.s. | n.s. | n.s. |
| Tyr | 1.4 | 7.5 | 11.6 | 16.8 | n.s. | n.s. | 0.02 |
| Pyruvate | |||||||
| Leu | 1.9 | 20.4 | 30.3 | 45.5 | 0.01 | n.s. | n.s. |
| Val | 7.2 | 27.8 | 36.0 | 53.3 | 0.02 | n.s. | n.s. |
| Ala | 7.3 | 48.4 | 77.1 | 119.9 | 0.01 | n.s. | n.s. |
| Aspartate | |||||||
| Asp | 3.4 | 17.4 | 24.8 | 32.5 | 0.00 | 0.00 | 0.02 |
| Asn | 3.6 | 37.1 | 50.1 | 62.7 | 0.00 | 0.00 | 0.04 |
| Thr | 11.1 | 31.6 | 35.2 | 52.1 | 0.00 | n.s. | n.s. |
| Ile | 1.5 | 13.1 | 18.9 | 29.3 | 0.01 | n.s. | n.s. |
| Met | 0.6 | 3.4 | 4.8 | 7.3 | 0.02 | n.s. | n.s. |
| Lys | 4.2 | 15.9 | 24.4 | 32.6 | n.s. | n.s. | n.s. |
| 3-phosphoglycerate | |||||||
| Cys | 47.7 | 73.4 | 102.0 | 86.1 | 0.00 | n.s. | 0.00 |
| Ser | 5.4 | 17.1 | 21.8 | 33.5 | 0.00 | 0.00 | n.s. |
| Gly | 3.8 | 31.7 | 50.1 | 75.2 | n.s. | n.s. | n.s. |
| Total | 199 | 497.7 | 659.7 | 897.4 | 0.00 | n.s. | n.s. |
| Treatment | p Value | ||||||
|---|---|---|---|---|---|---|---|
| +UV+W | +UV−W | −UV+W | −UV−W | UV | W | UV*Water | |
| a-ketoglutarate | |||||||
| Arg | 972 | 491 | 2173 | 1320 | 0.03 | n.s. | n.s. |
| Glu | 314 | 213 | 482 | 418 | 0.00 | n.s. | n.s. |
| Gln | 155 | 109 | 361 | 393 | 0.00 | n.s. | n.s. |
| His | 81 | 62 | 163 | 136 | 0.03 | n.s. | n.s. |
| Shikimate (Aromatic) | |||||||
| Phe | 33 | 16 | 53 | 78 | 0.02 | n.s. | n.s. |
| Trp | 34 | 51 | 57 | 67 | n.s. | n.s. | n.s. |
| Tyr | 2 | −7 | −2 | 5 | n.s. | n.s. | 0.02 |
| Pyruvate | |||||||
| Leu | 54 | 26 | 120 | 118 | 0.01 | n.s. | n.s. |
| Val | 86 | 67 | 167 | 125 | 0.02 | n.s. | n.s. |
| Ala | 685 | 442 | 1455 | 1118 | 0.01 | n.s. | n.s. |
| Aspartate | |||||||
| Asp | 171 | 82 | 338 | 277 | 0.02 | n.s. | n.s. |
| Asn | 1 | −22 | −1 | −3 | n.s. | n.s. | n.s. |
| Thr | 272 | 175 | 678 | 488 | 0.00 | n.s. | n.s. |
| Ile | 26 | 25 | 67 | 88 | 0.01 | n.s. | n.s. |
| Met | 11 | 1 | 19 | 23 | 0.02 | n.s. | n.s. |
| Lys | 13 | 12 | 31 | 7 | n.s. | n.s. | n.s. |
| 3-phosphoglycerate | |||||||
| Cys | −48 | −73 | −102 | −86 | 0.00 | n.s. | 0.00 |
| Ser | 236 | 181 | 549 | 483 | 0.00 | n.s. | n.s. |
| Gly | 7 | −11 | −1 | −8 | n.s. | n.s. | n.s. |
| Total | 3104 | 1838 | 6608 | 5045 | 0.00 | n.s. | n.s. |
| Treatment | p Value | ||||||
|---|---|---|---|---|---|---|---|
| +UV+W | +UV−W | −UV+W | −UV−W | UV | W | UV*water | |
| Ethyl isobutyrate | 9.89 | 15.85 | 12.92 | 19.08 | 0.03 | 0.00 | n.s. |
| Ethyl butanoate | 12.06 | 22.48 | 15.88 | 32.51 | 0.02 | 0.00 | n.s. |
| Ethyl isovalerate | 0.28 | 0.45 | 0.38 | 0.64 | 0.00 | 0.00 | n.s. |
| Isoamyl acetate | 147 | 115 | 115 | 174 | 0.05 | 0.05 | 0.00 |
| Ethyl pentanoate | 0.35 | 0.4 | 0.36 | 0.43 | n.s. | 0.00 | n.s. |
| Isoamyl alcohol | 131,416 | 160,616 | 128,260 | 194,095 | n.s. | 0.01 | n.s. |
| Ethyl hexanoate | 67.13 | 71.06 | 66.04 | 90.71 | 0.04 | 0.01 | 0.03 |
| Hexyl acetate | 0.99 | 0.73 | 0.8 | 0.94 | n.s. | n.s. | 0.00 |
| Hexanol | 812 | 833 | 798 | 1120 | n.s. | n.s. | n.s. |
| trans-3-hexen-1-ol | 16.14 | 15.73 | 17.46 | 21.33 | n.s. | n.s. | n.s. |
| Ethyl heptanoate | 0.52 | 0.42 | 0.46 | 0.41 | n.s. | n.s. | n.s. |
| cis-3-Hexen-1-ol | 17.65 | 24.79 | 18.72 | 16.15 | 0.04 | n.s. | 0.02 |
| 1-Heptanol | 15.73 | 16.22 | 14.89 | 17.25 | n.s. | n.s. | n.s. |
| Ethyl octanoate | 252 | 188 | 190 | 240 | n.s. | n.s. | 0.00 |
| Benzaldehyde | 12.97 | 10.53 | 13.84 | 11.96 | n.s. | 0.03 | n.s. |
| Ethyl decanoate | 394 | 235 | 266 | 292 | 0.04 | 0.00 | 0.00 |
| Phenylethyl alcohol | 39223 | 45285 | 44826 | 49417 | 0.01 | 0.00 | n.s. |
| Ethyl acetate | 44,458 | 39,546 | 42,704 | 79,278 | 0.00 | 0.00 | 0.00 |
| Acetic acid | 2,727,645 | 1,265,985 | 2,040,245 | 1,499,374 | n.s. | 0.02 | n.s. |
| Isobutyric acid | 3498 | 3864 | 3672 | 3009 | n.s. | n.s. | n.s. |
| Butanoic acid | 825 | 1038 | 1008 | 1025 | n.s. | 0.04 | n.s. |
| Isovaleric acid | 302 | 299 | 355 | 365 | n.s. | n.s. | n.s. |
| 2-Methylbutanoic acid | 374 | 452 | 413 | 419 | n.s. | n.s. | n.s. |
| Hexanoic acid | 672 | 672 | 785 | 826 | 0.00 | n.s. | n.s. |
| Octanoic acid | 464 | 378 | 441 | 565 | n.s. | n.s. | n.s. |
| Linalool | 9.48 | 10.58 | 13.9 | 9.83 | 0.01 | 0.03 | 0.00 |
| Citronellol | 8.16 | 11.46 | 10.28 | 13.29 | 0.05 | 0.01 | n.s. |
| Phenylethyl acetate | 22.68 | 14.94 | 21.68 | 19.82 | n.s. | n.s. | n.s. |
| β-Damascenone | 4.71 | 4.76 | 4.94 | 6.36 | 0.00 | 0.01 | 0.02 |
| Geraniol | 3.81 | 3.06 | 3.93 | 2.92 | n.s. | 0.00 | n.s. |
| Ethyl hydrocinnamate | 0.07 | 0.05 | 0.07 | 0.05 | n.s. | n.s. | n.s. |
| β-Ionone | 0.45 | 0.5 | 0.43 | 0.5 | n.s. | n.s. | n.s. |
| Ethyl cinnamate | 0.53 | 0.19 | 0.45 | 0.22 | n.s. | 0.03 | n.s. |
Publisher’s Note: MDPI stays neutral with regard to jurisdictional claims in published maps and institutional affiliations. |
© 2022 by the authors. Licensee MDPI, Basel, Switzerland. This article is an open access article distributed under the terms and conditions of the Creative Commons Attribution (CC BY) license (https://creativecommons.org/licenses/by/4.0/).
Share and Cite
Zhu, Y.; Sun, M.; Harrison, R.; Jordan, B.; Creasy, G.; Hofmann, R. Effects of UV-B and Water Deficit on Aroma Precursors in Grapes and Flavor Release during Wine Micro-Vinification and Consumption. Foods 2022, 11, 1336. https://doi.org/10.3390/foods11091336
Zhu Y, Sun M, Harrison R, Jordan B, Creasy G, Hofmann R. Effects of UV-B and Water Deficit on Aroma Precursors in Grapes and Flavor Release during Wine Micro-Vinification and Consumption. Foods. 2022; 11(9):1336. https://doi.org/10.3390/foods11091336
Chicago/Turabian StyleZhu, Yifan, Meng Sun, Roland Harrison, Brian Jordan, Glen Creasy, and Rainer Hofmann. 2022. "Effects of UV-B and Water Deficit on Aroma Precursors in Grapes and Flavor Release during Wine Micro-Vinification and Consumption" Foods 11, no. 9: 1336. https://doi.org/10.3390/foods11091336