
Impact of Hop Freshness on Dry Hopped Beer Quality


Abstract
:
1. Introduction
2. Materials and Methods
2.1. Chemicals and Standards
2.2. Hops Material
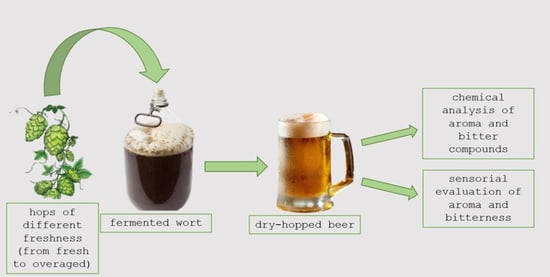
2.3. Dry Hopping
2.4. Sensory Analysis
2.5. Chemical Analysis
2.5.1. Hop Storage Index
2.5.2. Bitterness Units (BUs) of Beer
2.5.3. HPLC Analysis of Alpha Acids, Iso-Alpha Acids and Humulinones
2.5.4. HS-SPME-GC-MS Analysis of Aroma Components Derived from Hops
3. Results and Discussion
3.1. Hops Analysis
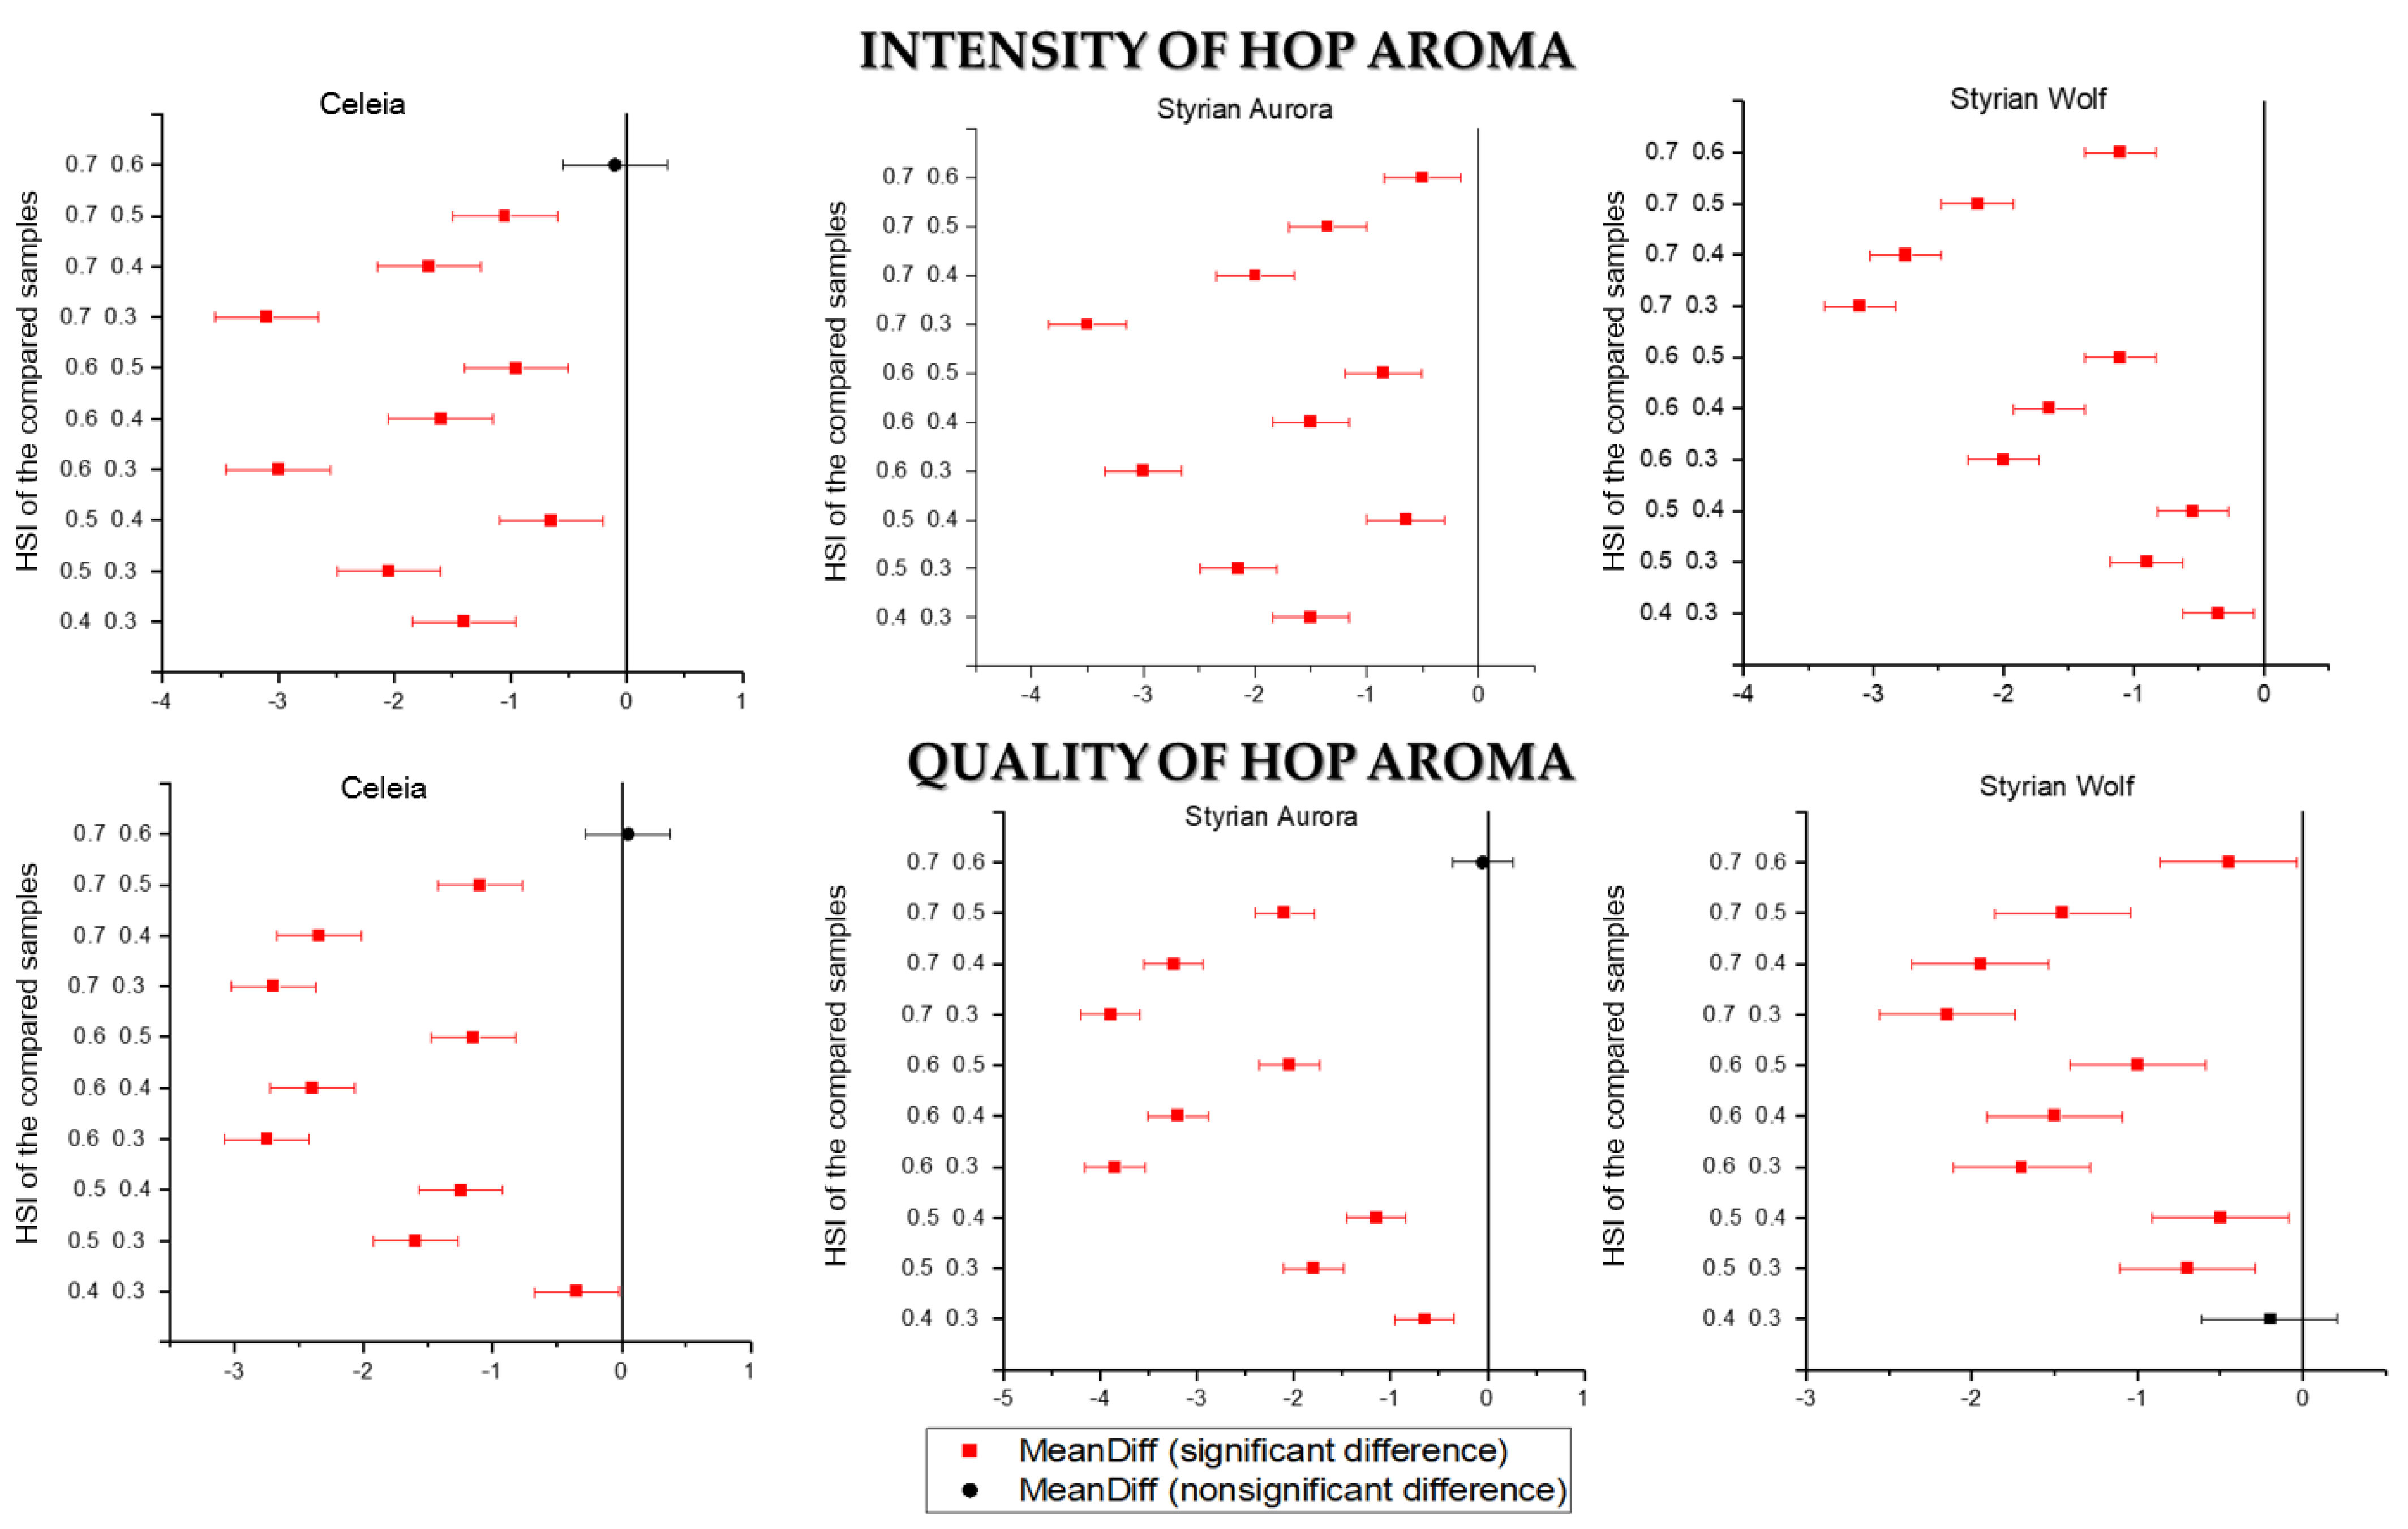
3.2. Beer Aroma
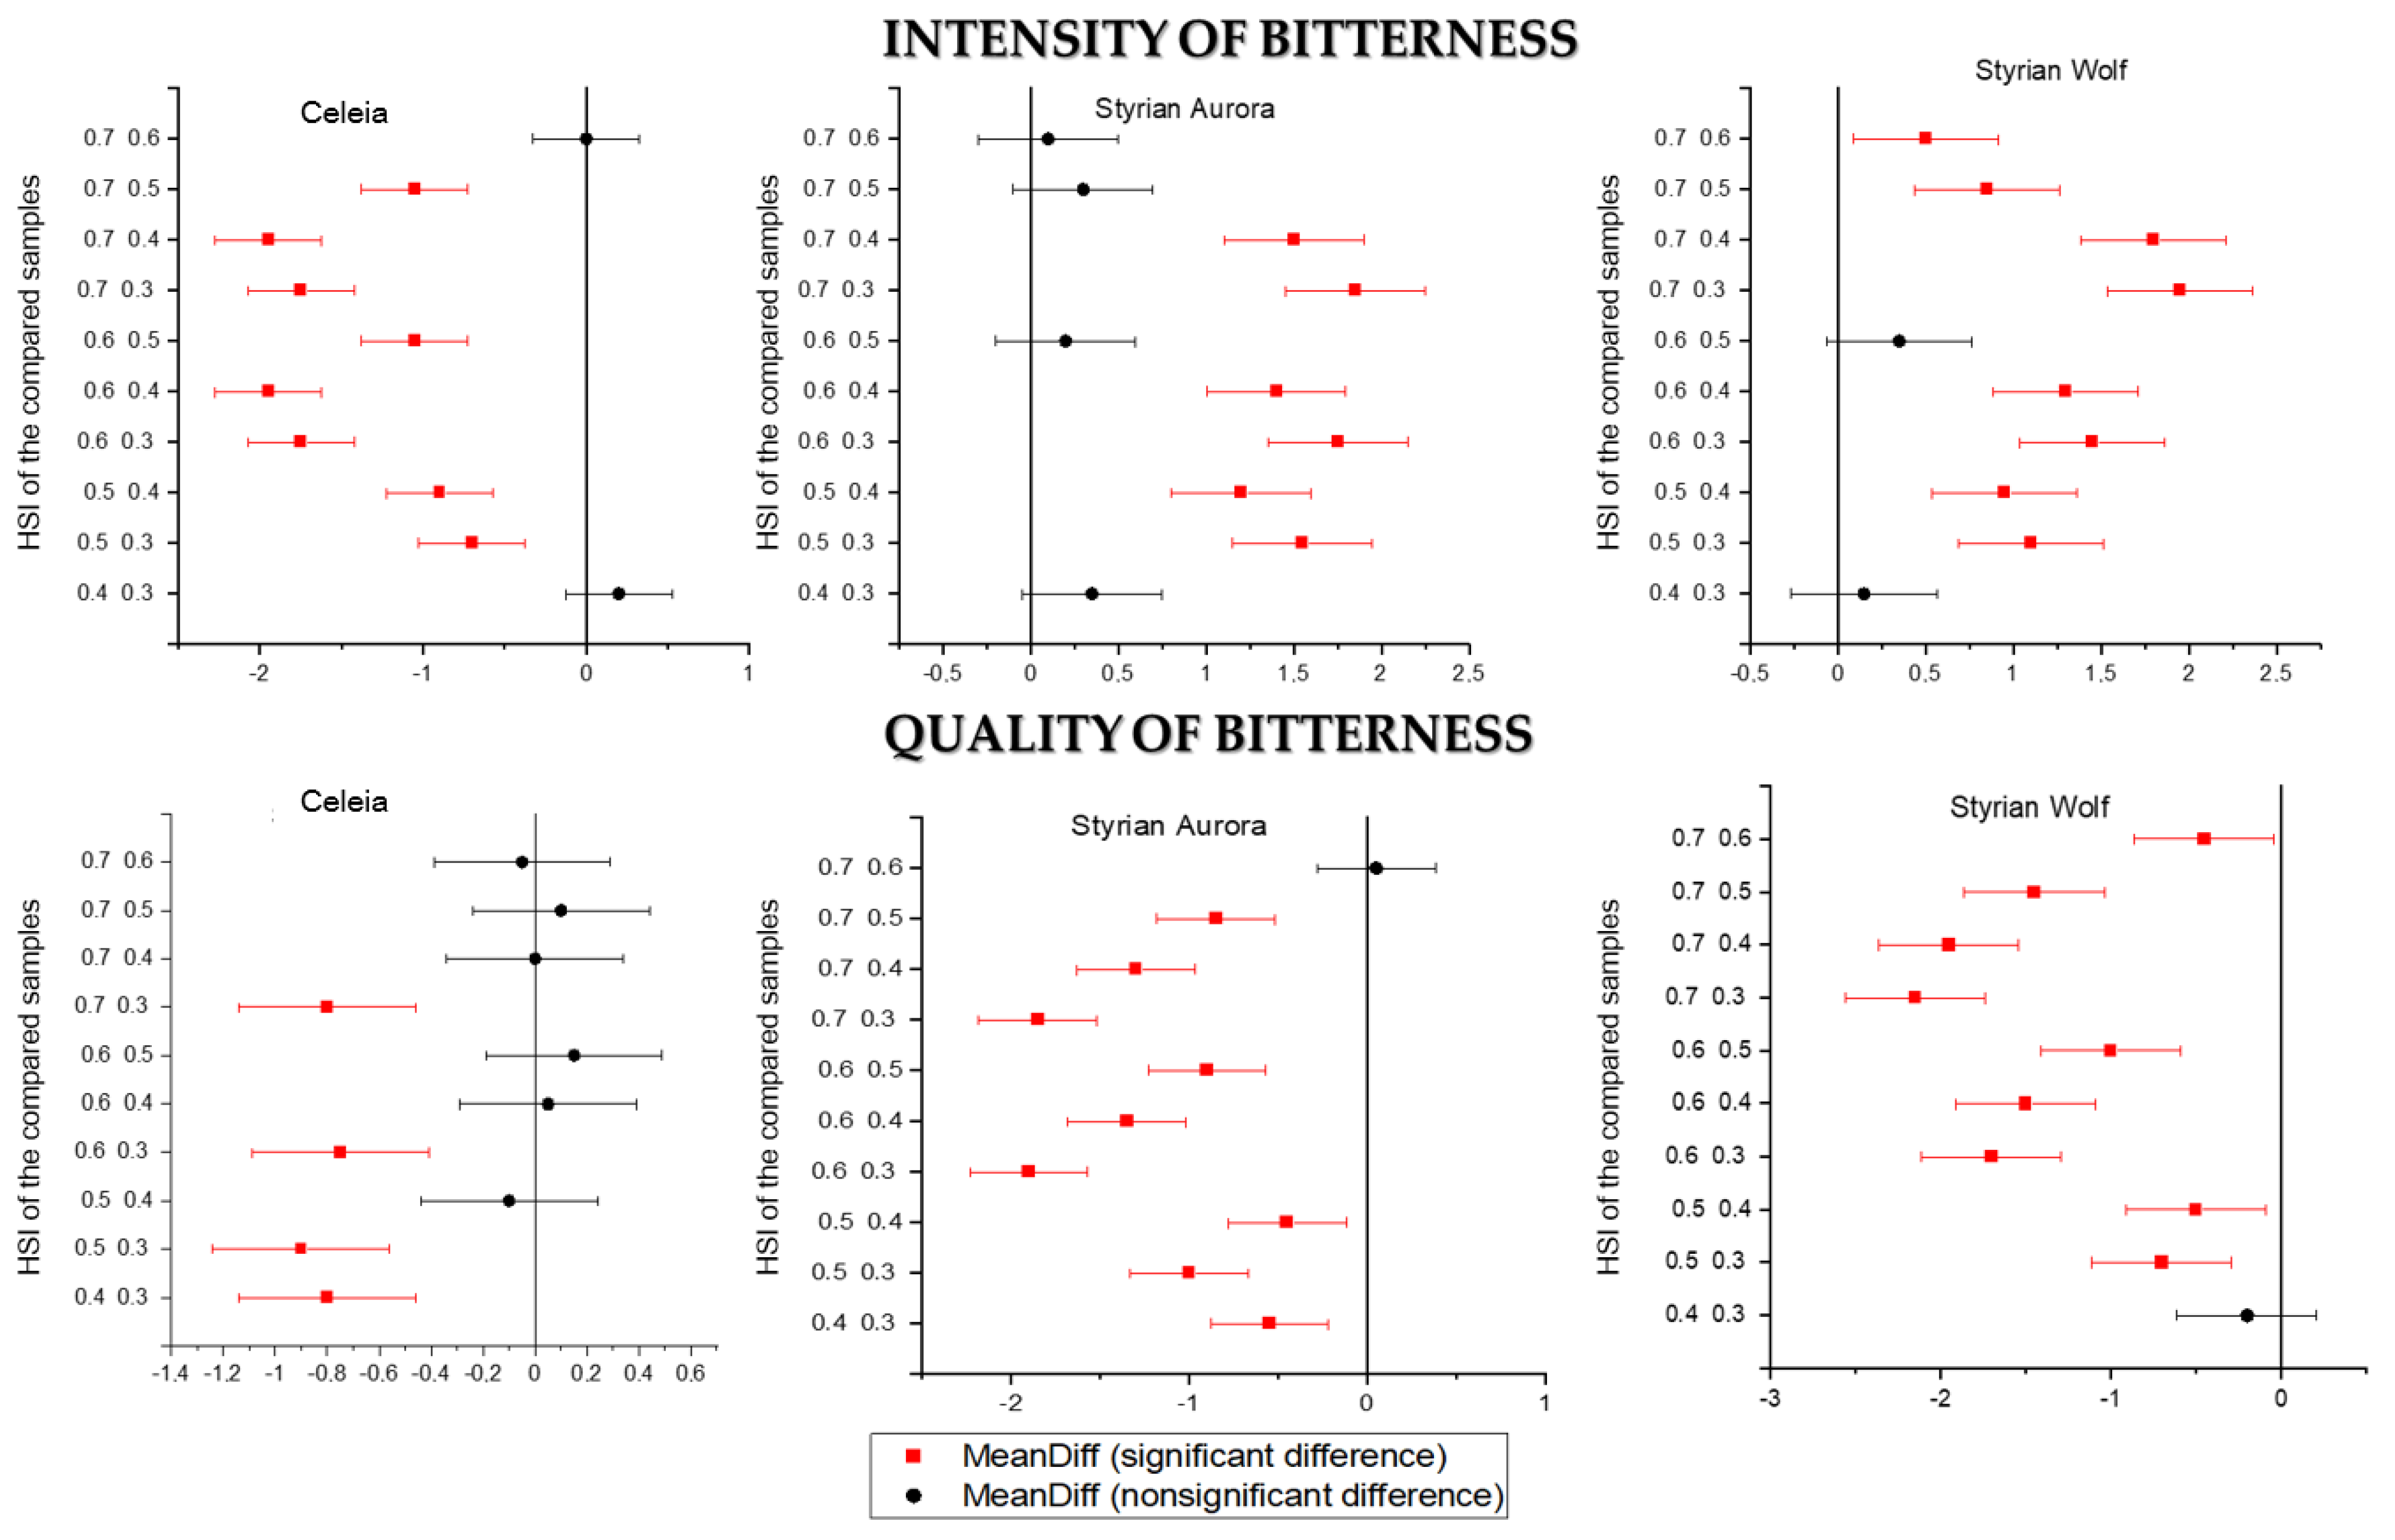
3.3. Beer Bitterness
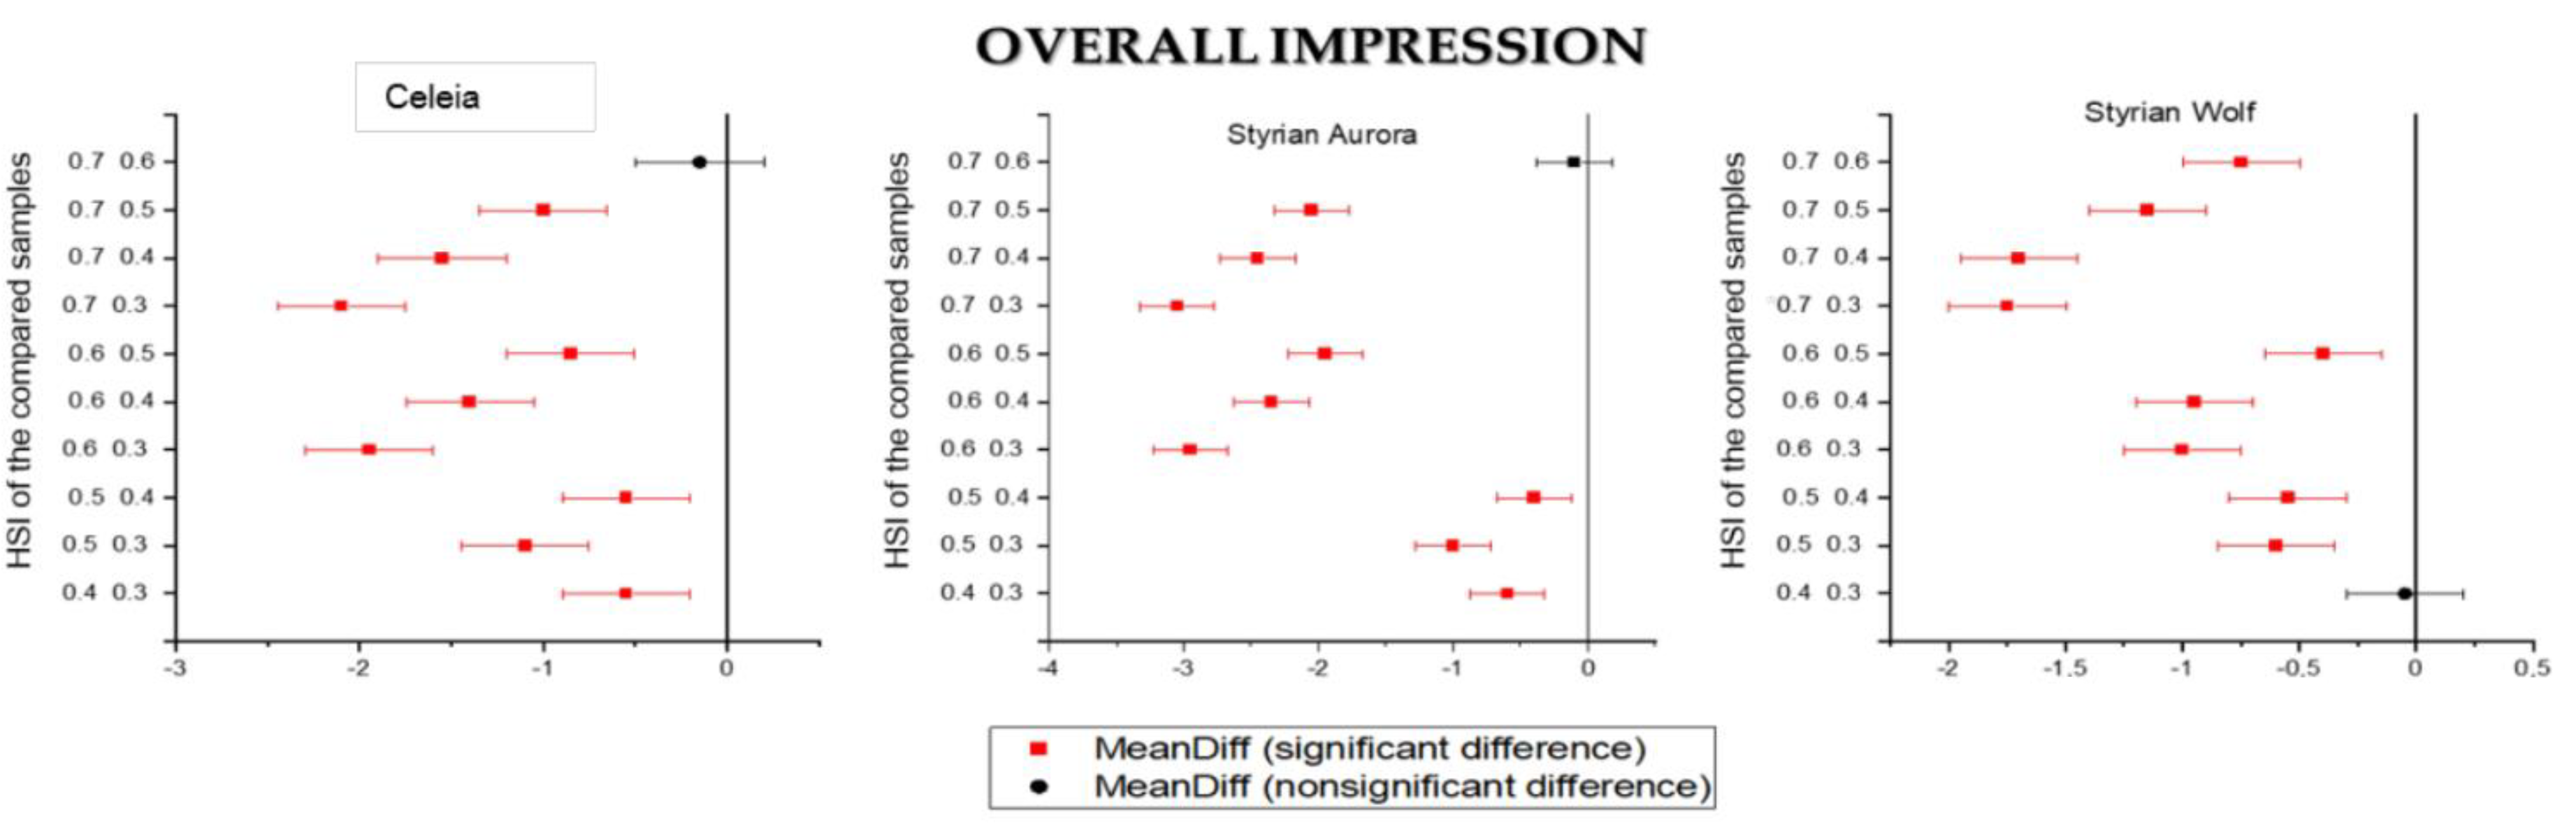
3.4. Overall Impression
4. Conclusions
Author Contributions
Funding
Institutional Review Board Statement
Informed Consent Statement
Data Availability Statement
Conflicts of Interest
References
- McGreger, C.; McGreger, N. The Beer Brewing Guide: The EBC Quality Handbook for Small Breweries; Uitgeverij Lannoo: Tielt, Belgium, 2021. [Google Scholar]
- Villacreces, S.; Blanco, C.A.; Caballero, I. Developments and characteristics of craft beer production processes. Food Biosci. 2022, 45, 101495. [Google Scholar] [CrossRef]
- Gomes, F.; Pontes Guimaraes, B.; Ceola, D.; Ghesti, G. Advances in dry hopping for industrial brewing: A review. Food Sci. Technol. 2022. [Google Scholar] [CrossRef]
- Parkin, E.; Shellhammer, T. Toward Understanding the Bitterness of Dry-Hopped Beer. J. Am. Soc. Brew. Chem. 2017, 75, 363–368. [Google Scholar] [CrossRef]
- Silva Ferreira, C.; Thibault de Chanvalon, E.; Bodart, E.; Collin, S. Why Humulinones are Key Bitter Constituents Only After Dry Hopping: Comparison With Other Belgian Styles. J. Am. Soc. Brew. Chem. 2018, 76, 236–246. [Google Scholar] [CrossRef]
- Maye, J.P.; Smith, R. Dry Hopping and Its Effects on the International Bitterness Unit Test and Beer Bitterness. Tech. Q. Master Brew. Assoc. Am. 2016, 53, 134–136. [Google Scholar]
- Hao, J.; Speers, R.A.; Fan, H.; Deng, Y.; Dai, Z. A Review of Cyclic and Oxidative Bitter Derivatives of Alpha, Iso-Alpha and Beta-Hop Acids. J. Am. Soc. Brew. Chem. 2020, 78, 89–102. [Google Scholar] [CrossRef]
- Algazzali, V.; Shellhammer, T. Bitterness Intensity of Oxidized Hop Acids: Humulinones and Hulupones. J. Am. Soc. Brew. Chem. 2016, 74, 36–43. [Google Scholar] [CrossRef]
- Liu, Z.; Wang, L.; Liu, Y. Analyzing Differences in Freshness of SA-1 Hops by Headspace Solid-Phase Microextraction Gas Chromatography–Mass Spectrometry Combined with Chemometrics. J. Am. Soc. Brew. Chem. 2017, 75, 193–200. [Google Scholar] [CrossRef]
- Adrian, F. The quality chain from hops to hop products. In Proceedings of the 29th EBC-Congress, Dublin, Ireland, 17–22 May 2003. [Google Scholar]
- Mikyška, A.; Krofta, K.; Hašková, D.; Culik, J.; Čejka, P. Impact of hop pellets storage on beer quality. Kvasný Průmysl 2012, 58, 148–154. [Google Scholar] [CrossRef]
- Srečec, S.; Rezic, T.; Santek, B.; Marić, V. Influence of Hops Pellets Age on α-acids Utilization and Organoleptic Quality of Beer. Agric. Conspec. Sci. 2008, 73, 103–107. [Google Scholar]
- Analytica EBC 13.13—Sensory Analysis: Routine Descriptive Test Guideline. Available online: https://brewup.eu/ebc-analytica/sensory/sensory-analysis-routine-descriptive-test-guideline/13.13 (accessed on 11 October 2021).
- Analytica EBC—7.13—Hop Storage Index of Hops and Hop Pellets. Available online: https://brewup.eu/ebc-analytica/hops-and-hop-products/hop-storage-index-of-hops-and-hop-pellets/7.13 (accessed on 17 November 2021).
- Analytica EBC, 9.8—Bitterness of Beer (IM). Available online: https://brewup.eu/ebc-analytica/beer/bitterness-of-beer-im/9.8 (accessed on 7 October 2021).
- Analytica EBC—7.7—α- and β-Acids in Hops and Hop Products by HPLC. Available online: https://brewup.eu/ebc-analytica/hops-and-hop-products/and-acids-in-hops-and-hop-products-by-hplc7/7.7 (accessed on 11 October 2021).
- Dennenlöhr, J.; Thörner, S.; Manowski, A.; Rettberg, N. Analysis of Selected Hop Aroma Compounds in Commercial Lager and Craft Beers Using HS-SPME-GC-MS/MS. J. Am. Soc. Brew. Chem. 2020, 78, 16–31. [Google Scholar] [CrossRef]
- Rutnik, K.; Knez Hrnčič, M.; Jože Košir, I. Hop Essential Oil: Chemical Composition, Extraction, Analysis, and Applications. Food Rev. Int. 2021, 1874413. [Google Scholar] [CrossRef]
- Kishimoto, T.; Wanikawa, A.; Kagami, N.; Kawatsura, K. Analysis of Hop-Derived Terpenoids in Beer and Evaluation of Their Behavior Using the Stir Bar−Sorptive Extraction Method with GC-MS. J. Agric. Food Chem. 2005, 53, 4701–4707. [Google Scholar] [CrossRef] [PubMed]
- Fidyt, K.; Fiedorowicz, A.; Strządała, L.; Szumny, A. β-caryophyllene and β-caryophyllene oxide—Natural compounds of anticancer and analgesic properties. Cancer Med. 2016, 5, 3007–3017. [Google Scholar] [CrossRef] [PubMed]
- Dietz, C.; Cook, D.; Huismann, M.; Wilson, C.; Ford, R. The multisensory perception of hop essential oil: A review. J. Inst. Brew. 2020, 126, 320–342. [Google Scholar] [CrossRef]
- Takoi, K.; Itoga, Y.; Koie, K.; Kosugi, T.; Shimase, M.; Katayama, Y.; Nakayama, Y.; Watari, J. The Contribution of Geraniol Metabolism to the Citrus Flavour of Beer: Synergy of Geraniol and β-Citronellol Under Coexistence with Excess Linalool. J. Inst. Brew. 2010, 116, 251–260. [Google Scholar] [CrossRef]
- Su, X.; Yin, Y. Aroma characterization of regional Cascade and Chinook hops (Humulus lupulus L.). Food Chem. 2021, 364, 130410. [Google Scholar] [CrossRef]
- Ocvirk, M.; Košir, I.J. Dynamics of Isomerization of Hop Alpha-Acids and Transition of Hop Essential Oil Components in Beer. Acta Chim. Slov. 2020, 67, 720–728. [Google Scholar] [CrossRef]
- Sanchez, N.B. Analytical and Sensory Evaluation of Hop Varieties. Master’s Thesis, Oregon State University, Corvallis, OR, USA, 1990. [Google Scholar]
- Oladokun, O.; James, S.; Cowley, T.; Dehrmann, F.; Smart, K.; Hort, J.; Cook, D. Perceived bitterness character of beer in relation to hop variety and the impact of hop aroma. Food Chem. 2017, 230, 215–224. [Google Scholar] [CrossRef]
- Taniguchi, Y.; Matsukura, Y.; Ozaki, H.; Nishimura, K.; Shindo, K. Identification and Quantification of the Oxidation Products Derived from α-Acids and β-Acids During Storage of Hops (Humulus lupulus L.). J. Agric. Food Chem. 2013, 61, 3121–3130. [Google Scholar] [CrossRef]
- Almaguer, C.; Gastl, M.; Arendt, E.K.; Becker, T. Comparative Study of the Contribution of Hop (Humulus Lupulus L.) Hard Resins Extracted from Different Hop Varieties to Beer Quality Parameters. J. Am. Soc. Brew. Chem. 2015, 73, 115–123. [Google Scholar] [CrossRef]
- Meilgaard, M.C. Flavor chemistry of beer. I. Flavor interaction between principal volatiles. Techical Q. 1975, 12, 107–117. [Google Scholar]
- Kaltner, D.; Mitter, W. Changes in hop derived compounds during beer production and ageing. In Proceedings of the 1st International Brewers Symposium, Corvallis, OR, USA, 9–10 August 2007; pp. 37–46. [Google Scholar]
- Gardner, R.J.; Laws, D.R.J.; McGuinness, J.D. The suppression of gushing by the use of hop oil. J. Inst. Brew. 1973, 79, 209–211. [Google Scholar] [CrossRef]
- Hanke, S.; Kern, M.; Herrmann, M.; Back, W.; Becker, T.; Krottenthaler, M. Suppression of gushing by hop constituents. Brew. Sci. 2009, 62, 181–186. [Google Scholar]
- Laws, D.R.J.; McGuinness, J.D. Origin and estimation of the gushing potential of isomerized hop extracts. J. Inst. Brew. 1972, 78, 302–308. [Google Scholar] [CrossRef]
- Shokribousjein, Z.; Sylvie, D.; Gebruers, K.; Lorgouilloux, Y.; Baggerman, G.; Verachtert, H.; Delcour, J.; Etienne, P.; Rock, J.-M.; Michiels, C.; et al. Hydrophobins, beer foaming and gushing. Cerevisia 2011, 35, 85–101. [Google Scholar] [CrossRef] [Green Version]
- Mastanjević, K.; Mastanjević, K.; Krstanović, V. The Gushing Experience—A Quick Overview. Beverages 2017, 3, 25. [Google Scholar] [CrossRef] [Green Version]


| Parameter | Value |
|---|---|
| SPME fibre | 50/30 μm DVB/CAR/PDMS (Supelco, Bellefonte, PA, USA) |
| Incubation time | 7.5 min |
| Extraction time | 20 min |
| Incubation temperature | 60 °C |
| Agitation rate | 500 rpm |
| Pre-desorption time | 20 min |
| Desorption temperature | 250 °C |
| Liner | Ultra Inert SPME Liner 0.75 mm |
| Split ratio | 1:20 |
| GC column | HP-5MS UI (30 m × 250 μm × 0.25 μm) (Agilent, USA) |
| Mobile phase | Helium (purity 5.0) |
| Temperature program | 50 °C–190 °C (10 °C/min) 190 °C–300 °C (70 °C/min), 1 min hold |
| Ion source temperature | 230 °C |
| MS quad temperature | 150 °C |
| Gain | 1.000 |
| Acquisition mode | SIM and SCAN |
| Sample Number | Variety | HSI | Essential Oil [mL/100 g] | Alpha-Acids [%] | Humulinones [%] |
|---|---|---|---|---|---|
| 1 | Celeia | 0.3 | 1.05 ± 0.04 | 3.19 ± 0.05 | 0.11 ± 0.01 |
| 2 | Celeia | 0.4 | 0.89 ± 0.03 | 2.38 ± 0.03 | 0.15 ± 0.01 |
| 3 | Celeia | 0.5 | 0.85 ± 0.03 | 2.06 ± 0.03 | 0.17 ± 0.01 |
| 4 | Celeia | 0.6 | 0.74 ± 0.03 | 1.80 ± 0.03 | 0.18 ± 0.01 |
| 5 | Celeia | 0.7 | 0.46 ± 0.02 | 1.60 ± 0.02 | 0.18 ± 0.01 |
| 6 | Aurora | 0.3 | 1.97 ± 0.08 | 12.36 ± 0.18 | 0.43 ± 0.03 |
| 7 | Aurora | 0.4 | 0.98 ± 0.04 | 10.38 ± 0.15 | 0.49 ± 0.03 |
| 8 | Aurora | 0.5 | 0.79 ± 0.03 | 8.36 ± 0.12 | 0.64 ± 0.04 |
| 9 | Aurora | 0.6 | 0.51 ± 0.02 | 7.36 ± 0.11 | 0.65 ± 0.04 |
| 10 | Aurora | 0.7 | 0.44 ± 0.02 | 6.05 ± 0.09 | 0.69 ± 0.04 |
| 11 | Styrian Wolf | 0.3 | 2.22 ± 0.09 | 11.87 ± 0.17 | 0.42 ± 0.03 |
| 12 | Styrian Wolf | 0.4 | 1.49 ± 0.06 | 8.66 ± 0.13 | 0.54 ± 0.03 |
| 13 | Styrian Wolf | 0.5 | 1.28 ± 0.05 | 9.21 ± 0.13 | 0.60 ± 0.04 |
| 14 | Styrian Wolf | 0.6 | 1.07 ± 0.04 | 7.71 ± 0.11 | 0.60 ± 0.04 |
| 15 | Styrian Wolf | 0.7 | 1.02 ± 0.04 | 7.66 ± 0.11 | 0.72 ± 0.05 |
| Variety | HSI of Hop Used for Beer | Myrcene [μg/L] | Linalool [μg/L] | Alpha-Terpineol [μg/L] | Beta-Citronellol and Nerol [μg/L] | Geraniol [μg/L] | Beta-Caryophyllene [μg/L] | Alpha-Humulene [μg/L] | Caryophyllene-Oxide [μg/L] | Humulene Epoxide [%] | Humulenol II [%] |
|---|---|---|---|---|---|---|---|---|---|---|---|
| Celeia | 0.3 | 9588 * ± 144 | 783 ± 19 | 115 ± 8 | 14 ± 1 | 108 ± 3 | 993 ± 75 | 448 ± 70 | 42 ± 5 | 0.18 ± 0.01 | 0.20 ± 0.01 |
| Celeia | 0.4 | 2801 ± 42 | 699 ± 17 | 92 ± 7 | 10 ± 1 | 90 ± 2 | 247 ± 19 | 135 ± 21 | 76 ± 8 | 0.36 ± 0.02 | 0.47 ± 0.03 |
| Celeia | 0.5 | 2018 ± 30 | 527 ± 13 | 85 ± 6 | 28 ± 1 | 68 ± 2 | 208 ± 16 | 121 ± 19 | 80 ± 8 | 0.74 ± 0.05 | 0.66 ± 0.04 |
| Celeia | 0.6 | 1172 ± 18 | 484 ± 12 | 86 ± 6 | 29 ± 1 | 62 ± 2 | 136 ± 10 | 80 ± 13 | 73 ± 8 | 0.93 ± 0.06 | 1.01 ± 0.07 |
| Celeia | 0.7 | 875 ± 13 | 443 ± 11 | 81 ± 6 | 28 ± 1 | 56 ± 1 | 53 ± 4 | 55 ± 9 | 105 ± 11 | 1.02 ± 0.07 | 1.41 ± 0.09 |
| Aurora | 0.3 | 13,721 * ± 206 | 974 ± 23 | 124 ± 9 | 30 ± 1 | 186 ± 5 | 606 ± 46 | 410 ± 64 | 4 ± 1 | 0.22 ± 0.01 | 0.19 ± 0.01 |
| Aurora | 0.4 | 2218 ± 33 | 594 ± 14 | 100 ± 7 | 29 ± 1 | 125 ± 3 | 153 ± 12 | 136 ± 21 | 23 ± 3 | 0.48 ± 0.03 | 0.51 ± 0.03 |
| Aurora | 0.5 | 1327 ± 20 | 582 ± 14 | 102 ± 7 | 10 ± 1 | 115 ± 3 | 68 ± 5 | 66 ± 10 | 34 ± 4 | 0.75 ± 0.05 | 1.25 ± 0.08 |
| Aurora | 0.6 | 639 ± 10 | 427 ± 10 | 84 ± 6 | 28 ± 1 | 85 ± 2 | 42 ± 3 | 44 ± 7 | 38 ± 4 | 0.91 ± 0.06 | 1.92 ± 0.12 |
| Aurora | 0.7 | 332 ± 5 | 321 ± 8 | 77 ± 6 | 25 ± 1 | 64 ± 2 | 26 ± 2 | 27 ± 4 | 39 ± 4 | 1.02 ± 0.07 | 2.52 ± 0.16 |
| Styrian Wolf | 0.3 | 4659 ± 70 | 1061 ± 25 | 92 ± 7 | 31 ± 1 | 421 ± 11 | 269 ± 20 | 162 ± 25 | 12 ± 1 | 0.15 ± 0.01 | 0.16 ± 0.01 |
| Styrian Wolf | 0.4 | 2778 ± 42 | 944 ± 23 | 100 ± 7 | 31 ± 1 | 337 ± 8 | 157 ± 12 | 101 ± 16 | 28 ± 3 | 0.35 ± 0.02 | 0.37 ± 0.02 |
| Styrian Wolf | 0.5 | 2625 ± 40 | 793 ± 19 | 99 ± 7 | 34 ± 1 | 268 ± 7 | 133 ± 10 | 93 ± 15 | 24 ± 3 | 0.46 ± 0.03 | 0.50 ± 0.03 |
| Styrian Wolf | 0.6 | 1678 ± 25 | 943 ± 23 | 124 ± 9 | 47 ± 2 | 296 ± 7 | 80 ± 6 | 55 ± 9 | 31 ± 3 | 0.53 ± 0.03 | 0.95 ± 0.06 |
| Styrian Wolf | 0.7 | 811 ± 12 | 925 ± 22 | 155 ± 11 | 58 ± 3 | 292 ± 7 | 60 ± 7 | 45 ± 7 | 40 ± 4 | 0.60 ± 0.04 | 1.11 ± 0.07 |
| Sample Number | Variety | HSI of Hop Used for Beer | Intensity of Hop Aroma | Quality of Hop Aroma |
|---|---|---|---|---|
| 1 | Celeia | 0.3 | 4.6 ± 0.32 | 4.7 ± 0.34 |
| 2 | Celeia | 0.4 | 3.2 ± 0.48 | 4.3 ± 0.26 |
| 3 | Celeia | 0.5 | 2.6 ± 0.44 | 3.1 ± 0.28 |
| 4 | Celeia | 0.6 | 1.6 ± 0.21 | 1.9 ± 0.21 |
| 5 | Celeia | 0.7 | 1.5 ± 0.24 | 2.0 ± 0.16 |
| 6 | Aurora | 0.3 | 4.6 ± 0.32 | 4.9 ± 0.21 |
| 7 | Aurora | 0.4 | 3.1 ± 0.21 | 4.3 ± 0.26 |
| 8 | Aurora | 0.5 | 2.5 ± 0.28 | 3.1 ± 0.39 |
| 9 | Aurora | 0.6 | 1.6 ± 0.32 | 1.1 ± 0.16 |
| 10 | Aurora | 0.7 | 1.1 ± 0.21 | 1.0 ± 0.00 |
| 11 | Styrian Wolf | 0.3 | 5.0 ± 0.16 | 5.0 ± 0.16 |
| 12 | Styrian Wolf | 0.4 | 4.6 ± 0.21 | 4.8 ± 0.26 |
| 13 | Styrian Wolf | 0.5 | 4.1 ± 0.28 | 4.3 ± 0.26 |
| 14 | Styrian Wolf | 0.6 | 3.0 ± 0.16 | 3.3 ± 0.35 |
| 15 | Styrian Wolf | 0.7 | 1.9 ± 0.24 | 2.8 ± 0.48 |
| Sample Number | Variety | HSI of Hop Used for Beer | BU | Alpha Acids [mg/L] | Iso-Alpha Acids [mg/L] | Humulinones [mg/L] |
|---|---|---|---|---|---|---|
| 1 | Celeia | 0.3 | 24 ± 1 | 3.60 ± 0.23 | 0.64 ± 0.05 | 4.81 ± 0.31 |
| 2 | Celeia | 0.4 | 28 ± 1 | 2.71 ± 0.18 | 0.51 ± 0.04 | 7.97 ± 0.51 |
| 3 | Celeia | 0.5 | 23 ± 1 | 1.78 ± 0.12 | 0.15 ± 0.01 | 6.45 ± 0.41 |
| 4 | Celeia | 0.6 | 22 ± 1 | <LOD * | < LOD * | 5.19 ± 0.33 |
| 5 | Celeia | 0.7 | 21 ± 1 | <LOD * | < LOD * | 3.78 ± 0.24 |
| 6 | Aurora | 0.3 | 22 ± 1 | 5.74 ± 0.37 | 1.52 ± 0.11 | 16.06 ± 1.03 |
| 7 | Aurora | 0.4 | 29 ± 1 | 5.47 ± 0.35 | 1.46 ± 0.11 | 19.00 ± 1.22 |
| 8 | Aurora | 0.5 | 39 ± 2 | 4.09 ± 0.26 | 1.27 ± 0.09 | 21.37 ± 1.37 |
| 9 | Aurora | 0.6 | 35 ± 1 | 3.51 ± 0.23 | 0.85 ± 0.06 | 19.00 ± 1.22 |
| 10 | Aurora | 0.7 | 34 ± 1 | 2.00 ± 0.13 | 0.42 ± 0.03 | 17.89 ± 1.14 |
| 11 | Styrian Wolf | 0.3 | 21 ± 1 | 4.45 ± 0.29 | 1.95 ± 0.14 | 14.03 ± 0.90 |
| 12 | Styrian Wolf | 0.4 | 25 ± 1 | 4.05 ± 0.26 | 1.91 ± 0.14 | 18.73 ± 1.20 |
| 13 | Styrian Wolf | 0.5 | 45 ± 2 | 3.87 ± 0.25 | 1.19 ± 0.09 | 30.30 ± 1.94 |
| 14 | Styrian Wolf | 0.6 | 42 ± 2 | 2.36 ± 0.15 | 1.14 ± 0.08 | 25.26 ± 1.62 |
| 15 | Styrian Wolf | 0.7 | 35 ± 1 | 2.94 ± 0.19 | 0.80 ± 0.06 | 19.19 ± 1.23 |
| Sample Number | Variety | HSI of Hop Used for Beer | Intensity of Bitterness | Quality of Bitterness |
|---|---|---|---|---|
| 1 | Celeia | 0.3 | 2.9 ± 0.32 | 4.9 ± 0.21 |
| 2 | Celeia | 0.4 | 3.1 ± 0.21 | 4.1 ± 0.32 |
| 3 | Celeia | 0.5 | 2.2 ± 0.26 | 4.0 ± 0.24 |
| 4 | Celeia | 0.6 | 1.2 ± 0.24 | 4.2 ± 0.24 |
| 5 | Celeia | 0.7 | 1.2 ± 0.24 | 4.1 ± 0.32 |
| 6 | Aurora | 0.3 | 2.4 ± 0.39 | 4.9 ± 0.21 |
| 7 | Aurora | 0.4 | 2.8 ± 0.26 | 4.4 ± 0.24 |
| 8 | Aurora | 0.5 | 4.0 ± 0.37 | 3.9 ± 0.21 |
| 9 | Aurora | 0.6 | 4.2 ± 0.24 | 3.0 ± 0.33 |
| 10 | Aurora | 0.7 | 4.3 ± 0.26 | 3.1 ± 0.28 |
| 11 | Styrian Wolf | 0.3 | 2.2 ± 0.35 | 5.0 ± 0.16 |
| 12 | Styrian Wolf | 0.4 | 2.4 ± 0.34 | 4.9 ± 0.21 |
| 13 | Styrian Wolf | 0.5 | 3.3 ± 0.35 | 4.9 ± 0.24 |
| 14 | Styrian Wolf | 0.6 | 3.7 ± 0.34 | 4.4 ± 0.21 |
| 15 | Styrian Wolf | 0.7 | 4.2 ± 0.24 | 4.0 ± 0.24 |
| Sample Number | Variety | HSI of Hop Used for Beer | Overall Impression |
|---|---|---|---|
| 1 | Celeia | 0.3 | 4.9 ± 0.21 |
| 2 | Celeia | 0.4 | 4.4 ± 0.24 |
| 3 | Celeia | 0.5 | 3.8 ± 0.35 |
| 4 * | Celeia | 0.6 | 3.0 ± 0.16 |
| 5 * | Celeia | 0.7 | 2.8 ± 0.35 |
| 6 | Aurora | 0.3 | 4.9 ± 0.21 |
| 7 | Aurora | 0.4 | 4.3 ± 0.26 |
| 8 * | Aurora | 0.5 | 3.9 ± 0.21 |
| 9 * | Aurora | 0.6 | 2.0 ± 0.16 |
| 10 * | Aurora | 0.7 | 1.9 ± 0.24 |
| 11 | Styrian Wolf | 0.3 | 5.0 ± 0.00 |
| 12 | Styrian Wolf | 0.4 | 5.0 ± 0.16 |
| 13 | Styrian Wolf | 0.5 | 4.4 ± 0.21 |
| 14 * | Styrian Wolf | 0.6 | 4.0 ± 0.24 |
| 15 * | Styrian Wolf | 0.7 | 3.3 ± 0.26 |
Publisher’s Note: MDPI stays neutral with regard to jurisdictional claims in published maps and institutional affiliations. |
© 2022 by the authors. Licensee MDPI, Basel, Switzerland. This article is an open access article distributed under the terms and conditions of the Creative Commons Attribution (CC BY) license (https://creativecommons.org/licenses/by/4.0/).
Share and Cite
Rutnik, K.; Ocvirk, M.; Košir, I.J. Impact of Hop Freshness on Dry Hopped Beer Quality. Foods 2022, 11, 1310. https://doi.org/10.3390/foods11091310
Rutnik K, Ocvirk M, Košir IJ. Impact of Hop Freshness on Dry Hopped Beer Quality. Foods. 2022; 11(9):1310. https://doi.org/10.3390/foods11091310
Chicago/Turabian StyleRutnik, Ksenija, Miha Ocvirk, and Iztok Jože Košir. 2022. "Impact of Hop Freshness on Dry Hopped Beer Quality" Foods 11, no. 9: 1310. https://doi.org/10.3390/foods11091310