
Interlaboratory Validation of a DNA Metabarcoding Assay for Mammalian and Poultry Species to Detect Food Adulteration

 , and
, and
Abstract
:1. Introduction
2. Materials and Methods
2.1. Participating Laboratories
2.2. Samples
2.3. Genomic DNA Extraction
2.4. Study Design
2.5. Statistical Data Analysis
2.5.1. Quantitative Statistical Analyses
2.5.2. Qualitative Statistical Analyses
3. Results and Discussion
3.1. Quantitative Evaluation of Ring Trial Data
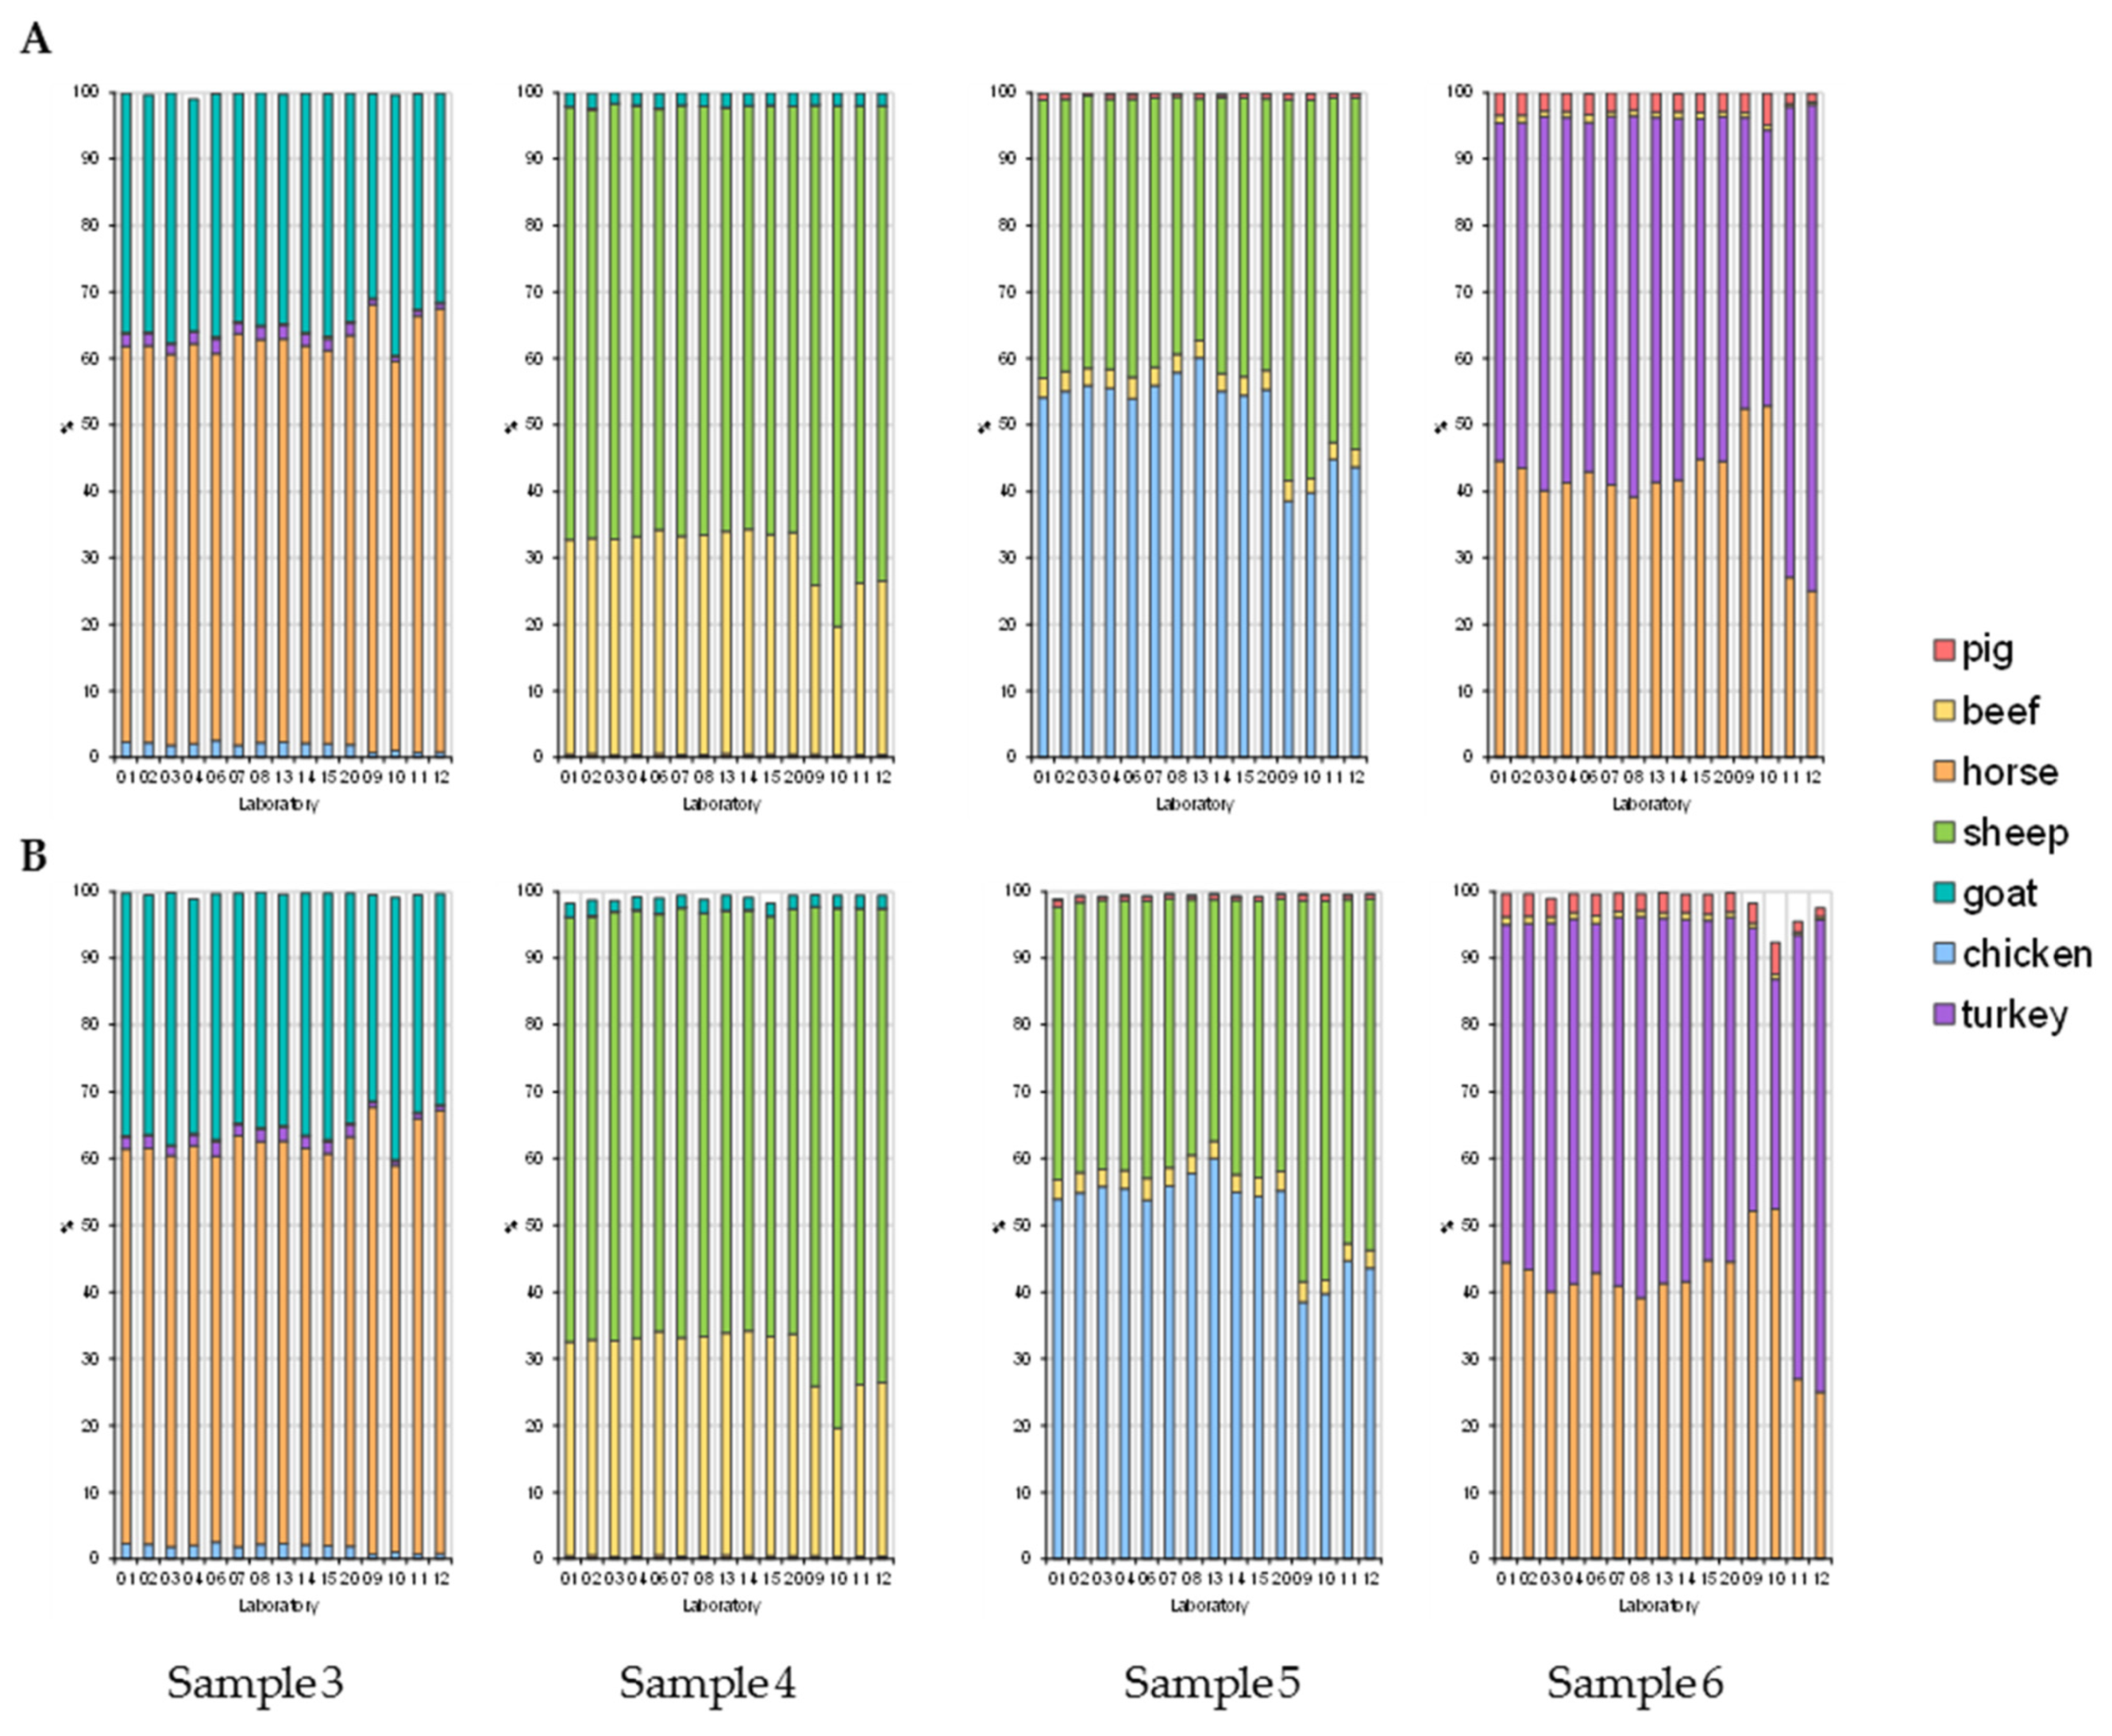
3.1.1. Proportions of Animal Species in Samples 1–7
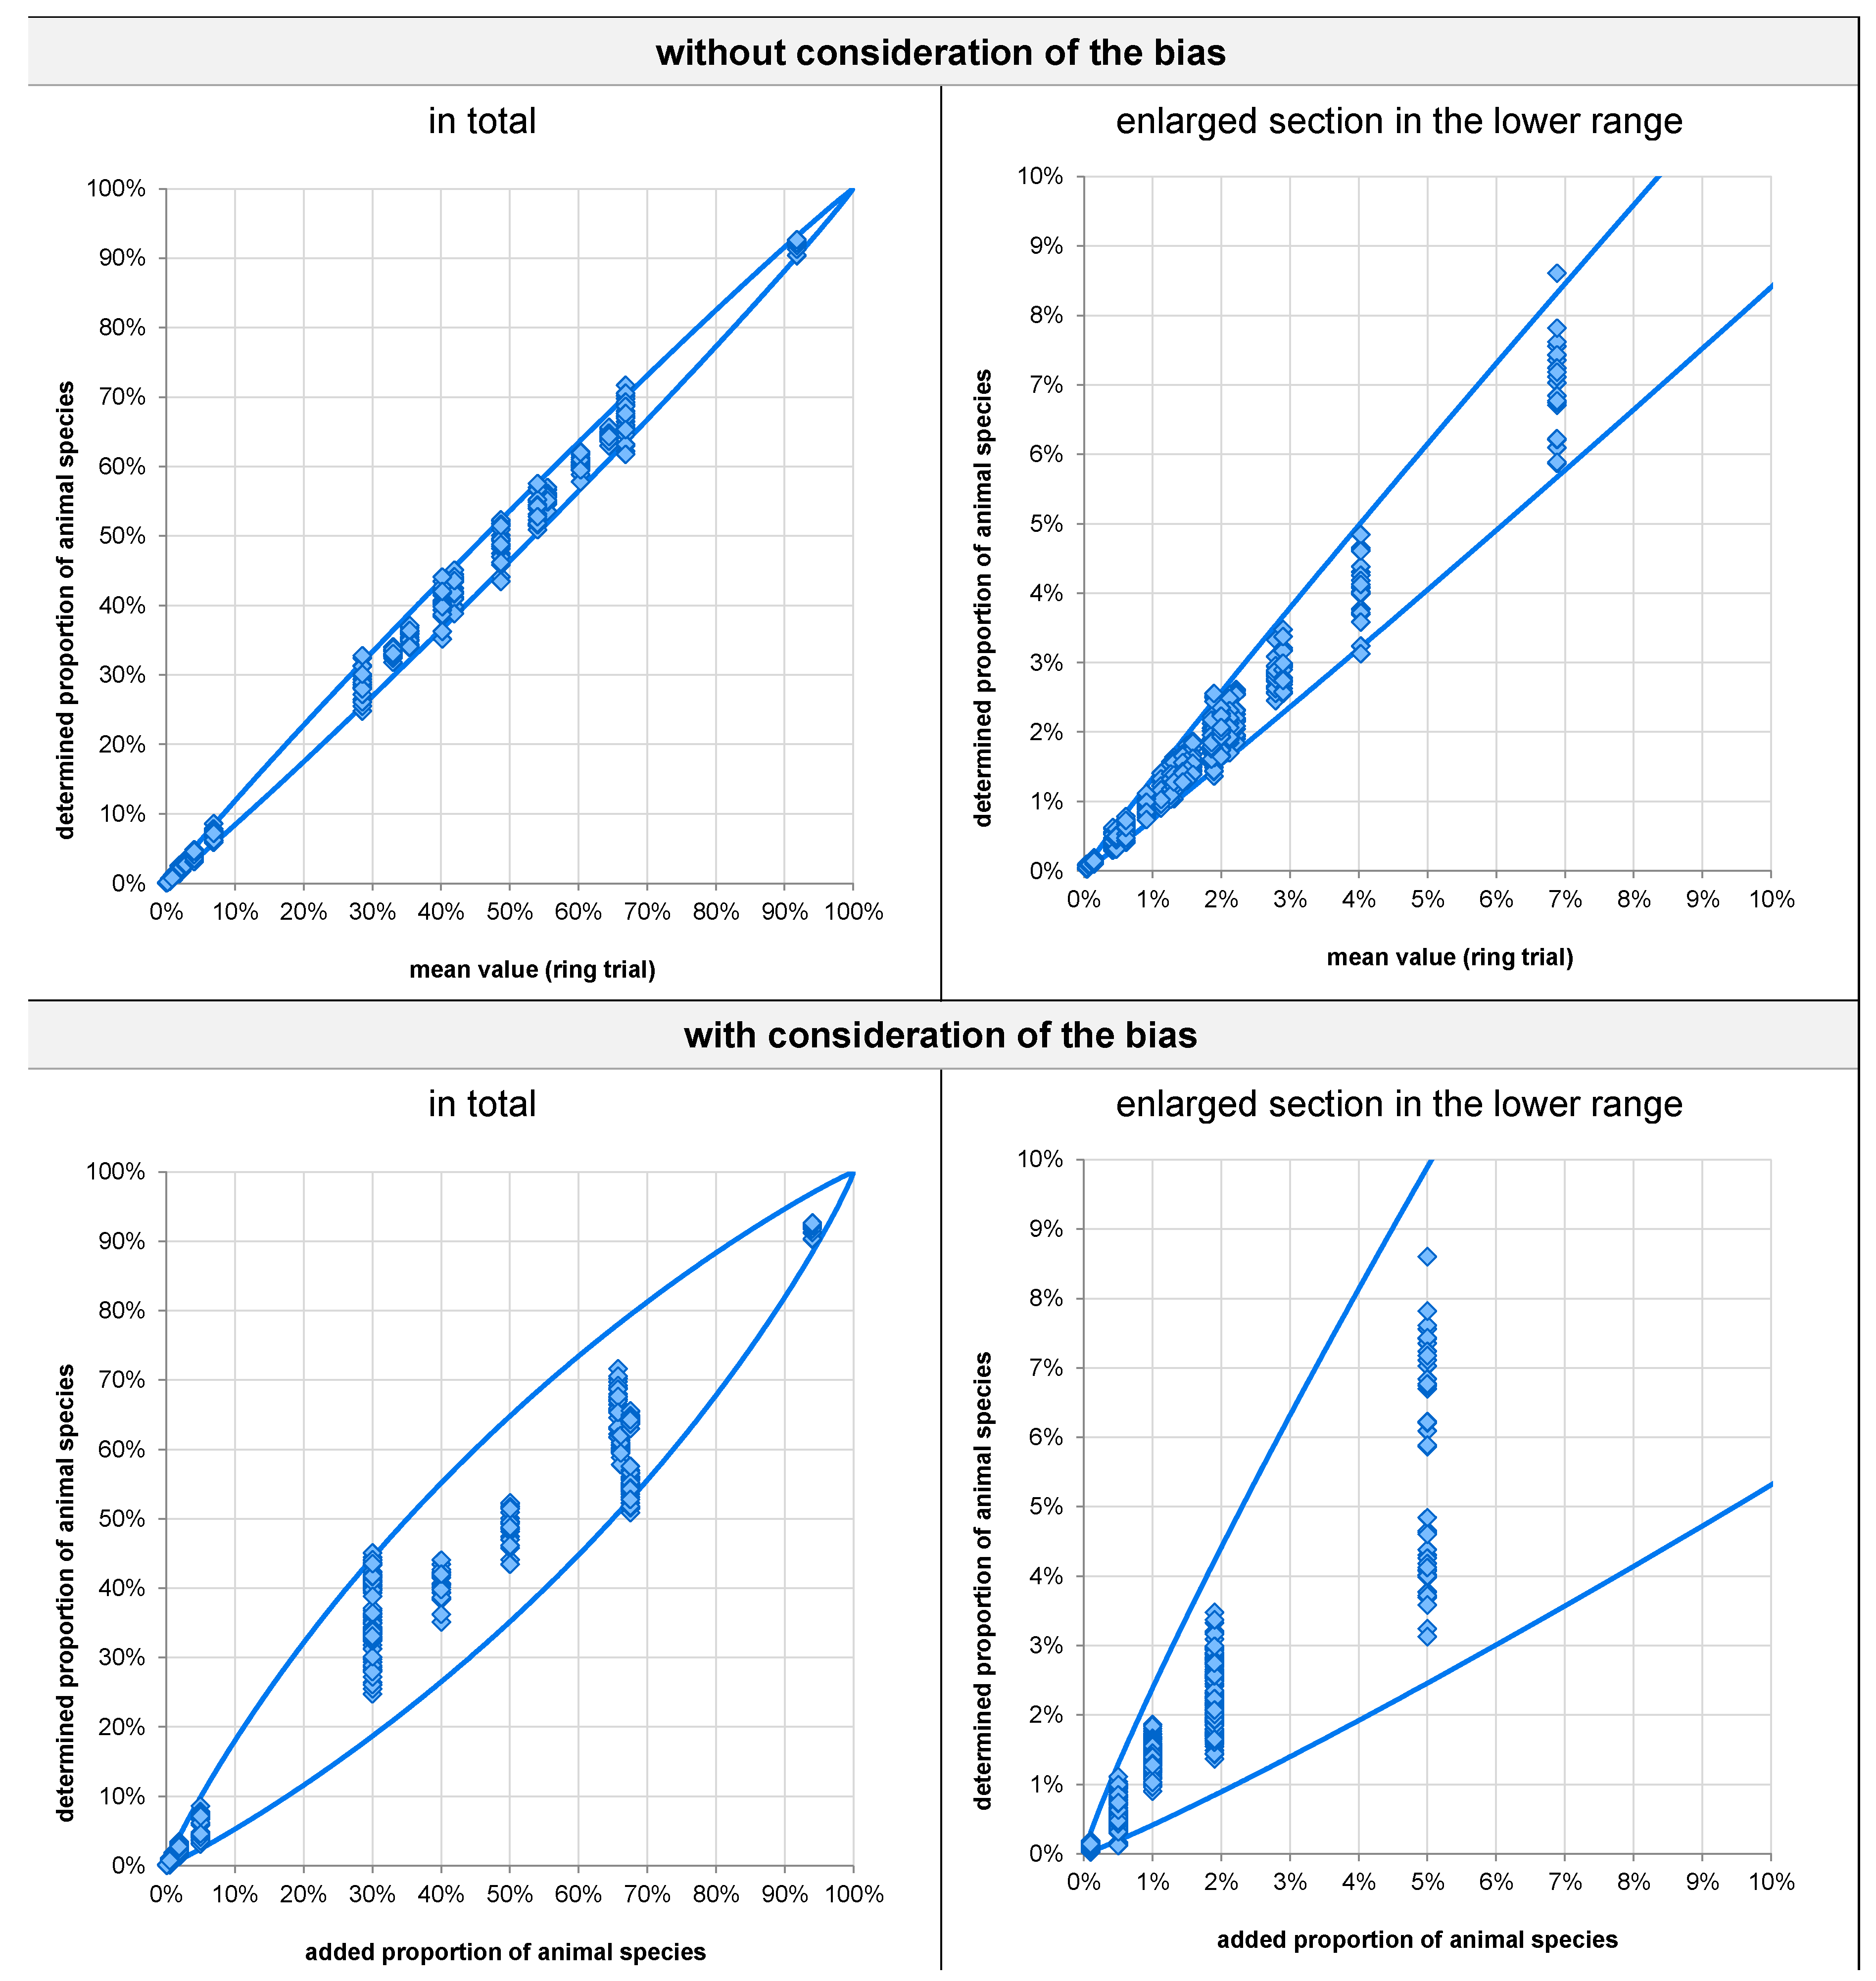
3.1.2. Logit Transformation
3.1.3. Outlier Tests
3.1.4. Distribution of Sample-Specific Proportions of Animal Species
3.1.5. Statistical Parameters According to ASU §64 LFGB
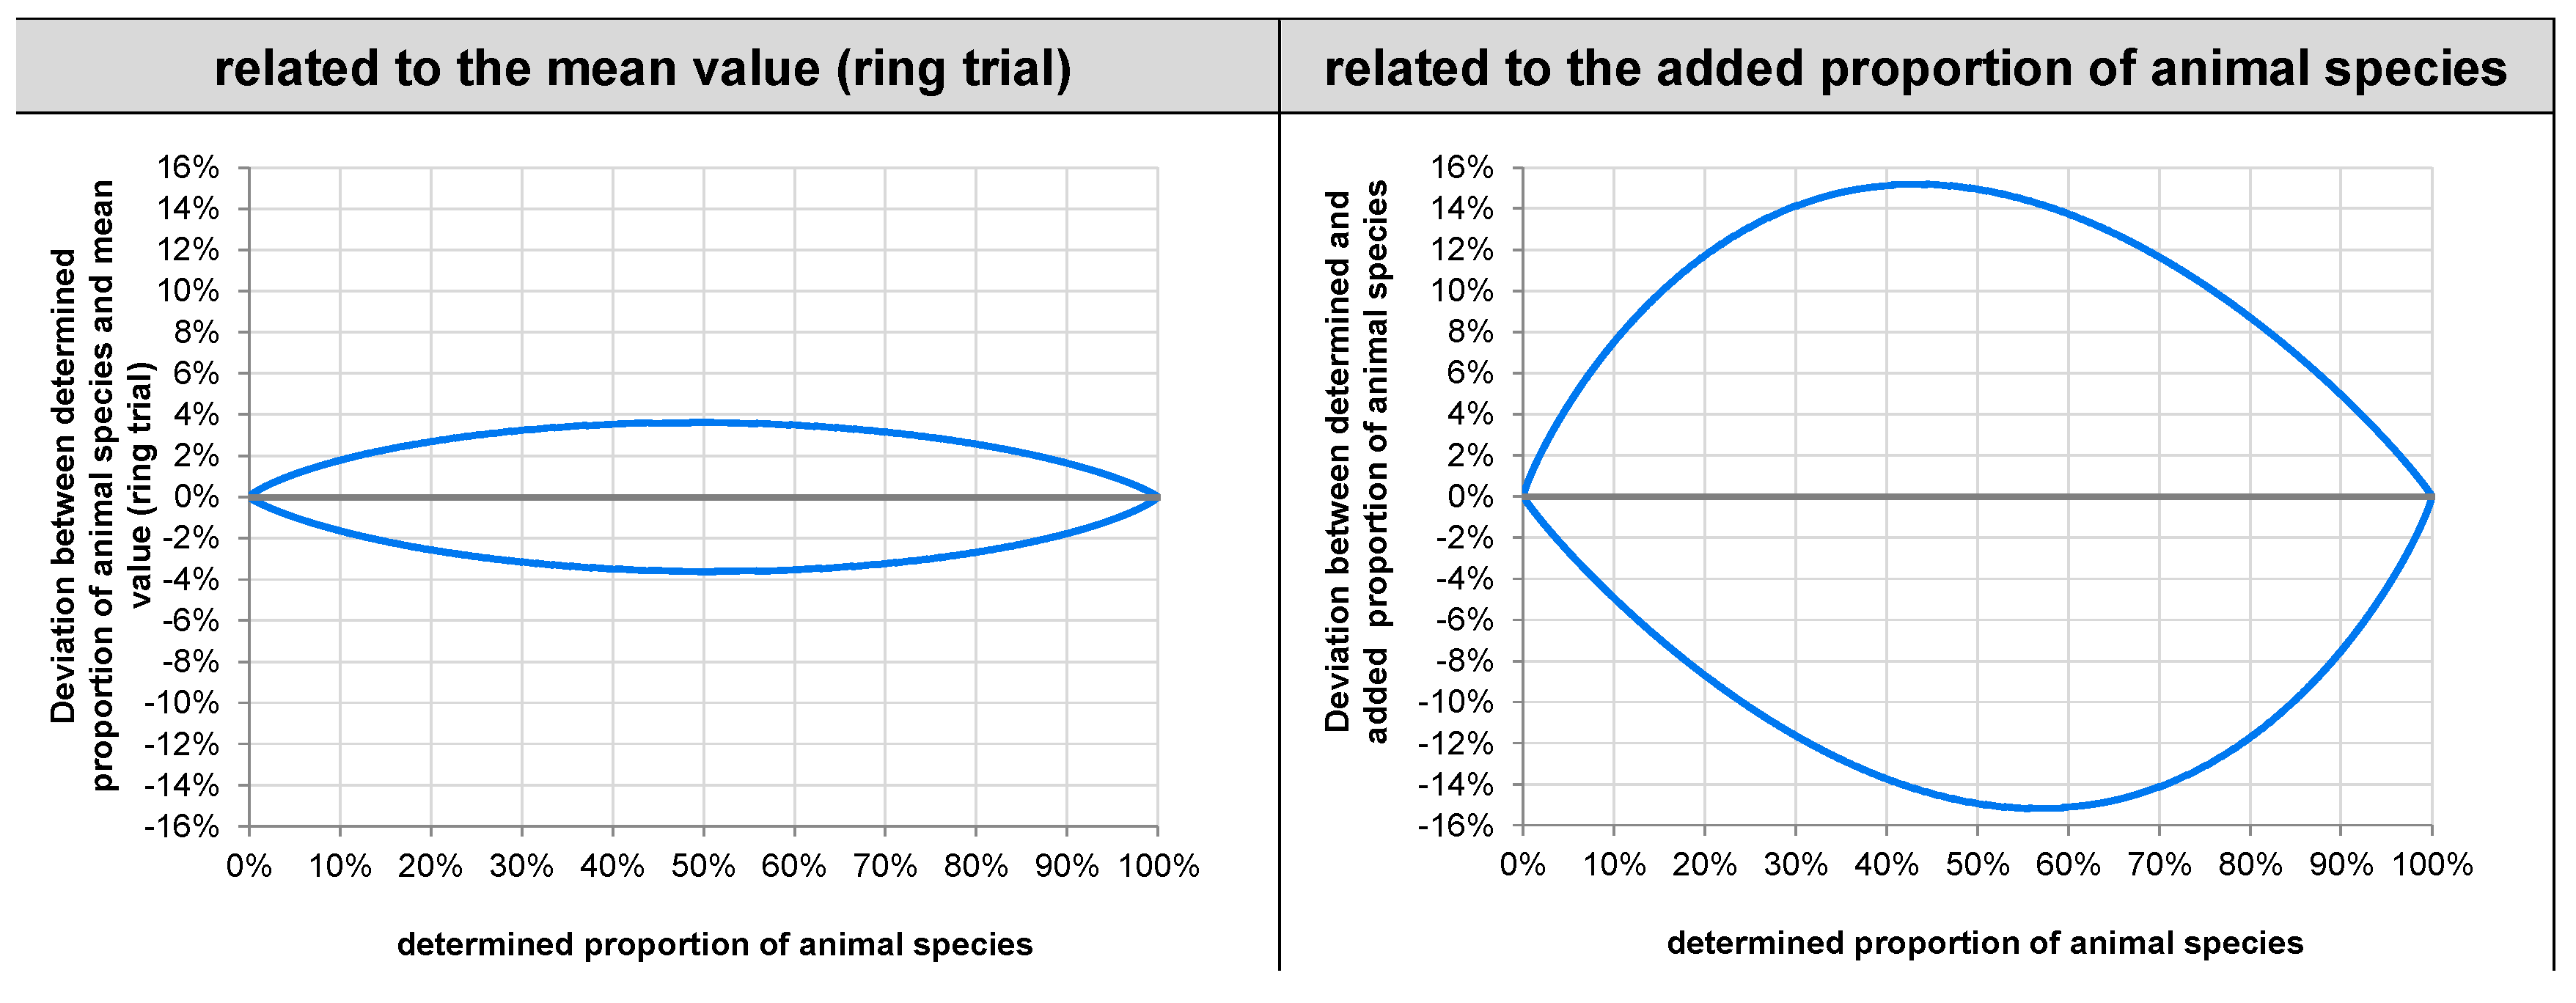
3.1.6. Dependence of Bias, Reproducibility Standard Deviation, and Repeatability Standard Deviation on the Mean Proportion of Animal Species
3.1.7. Variability across Animal Species and Measuring Uncertainty
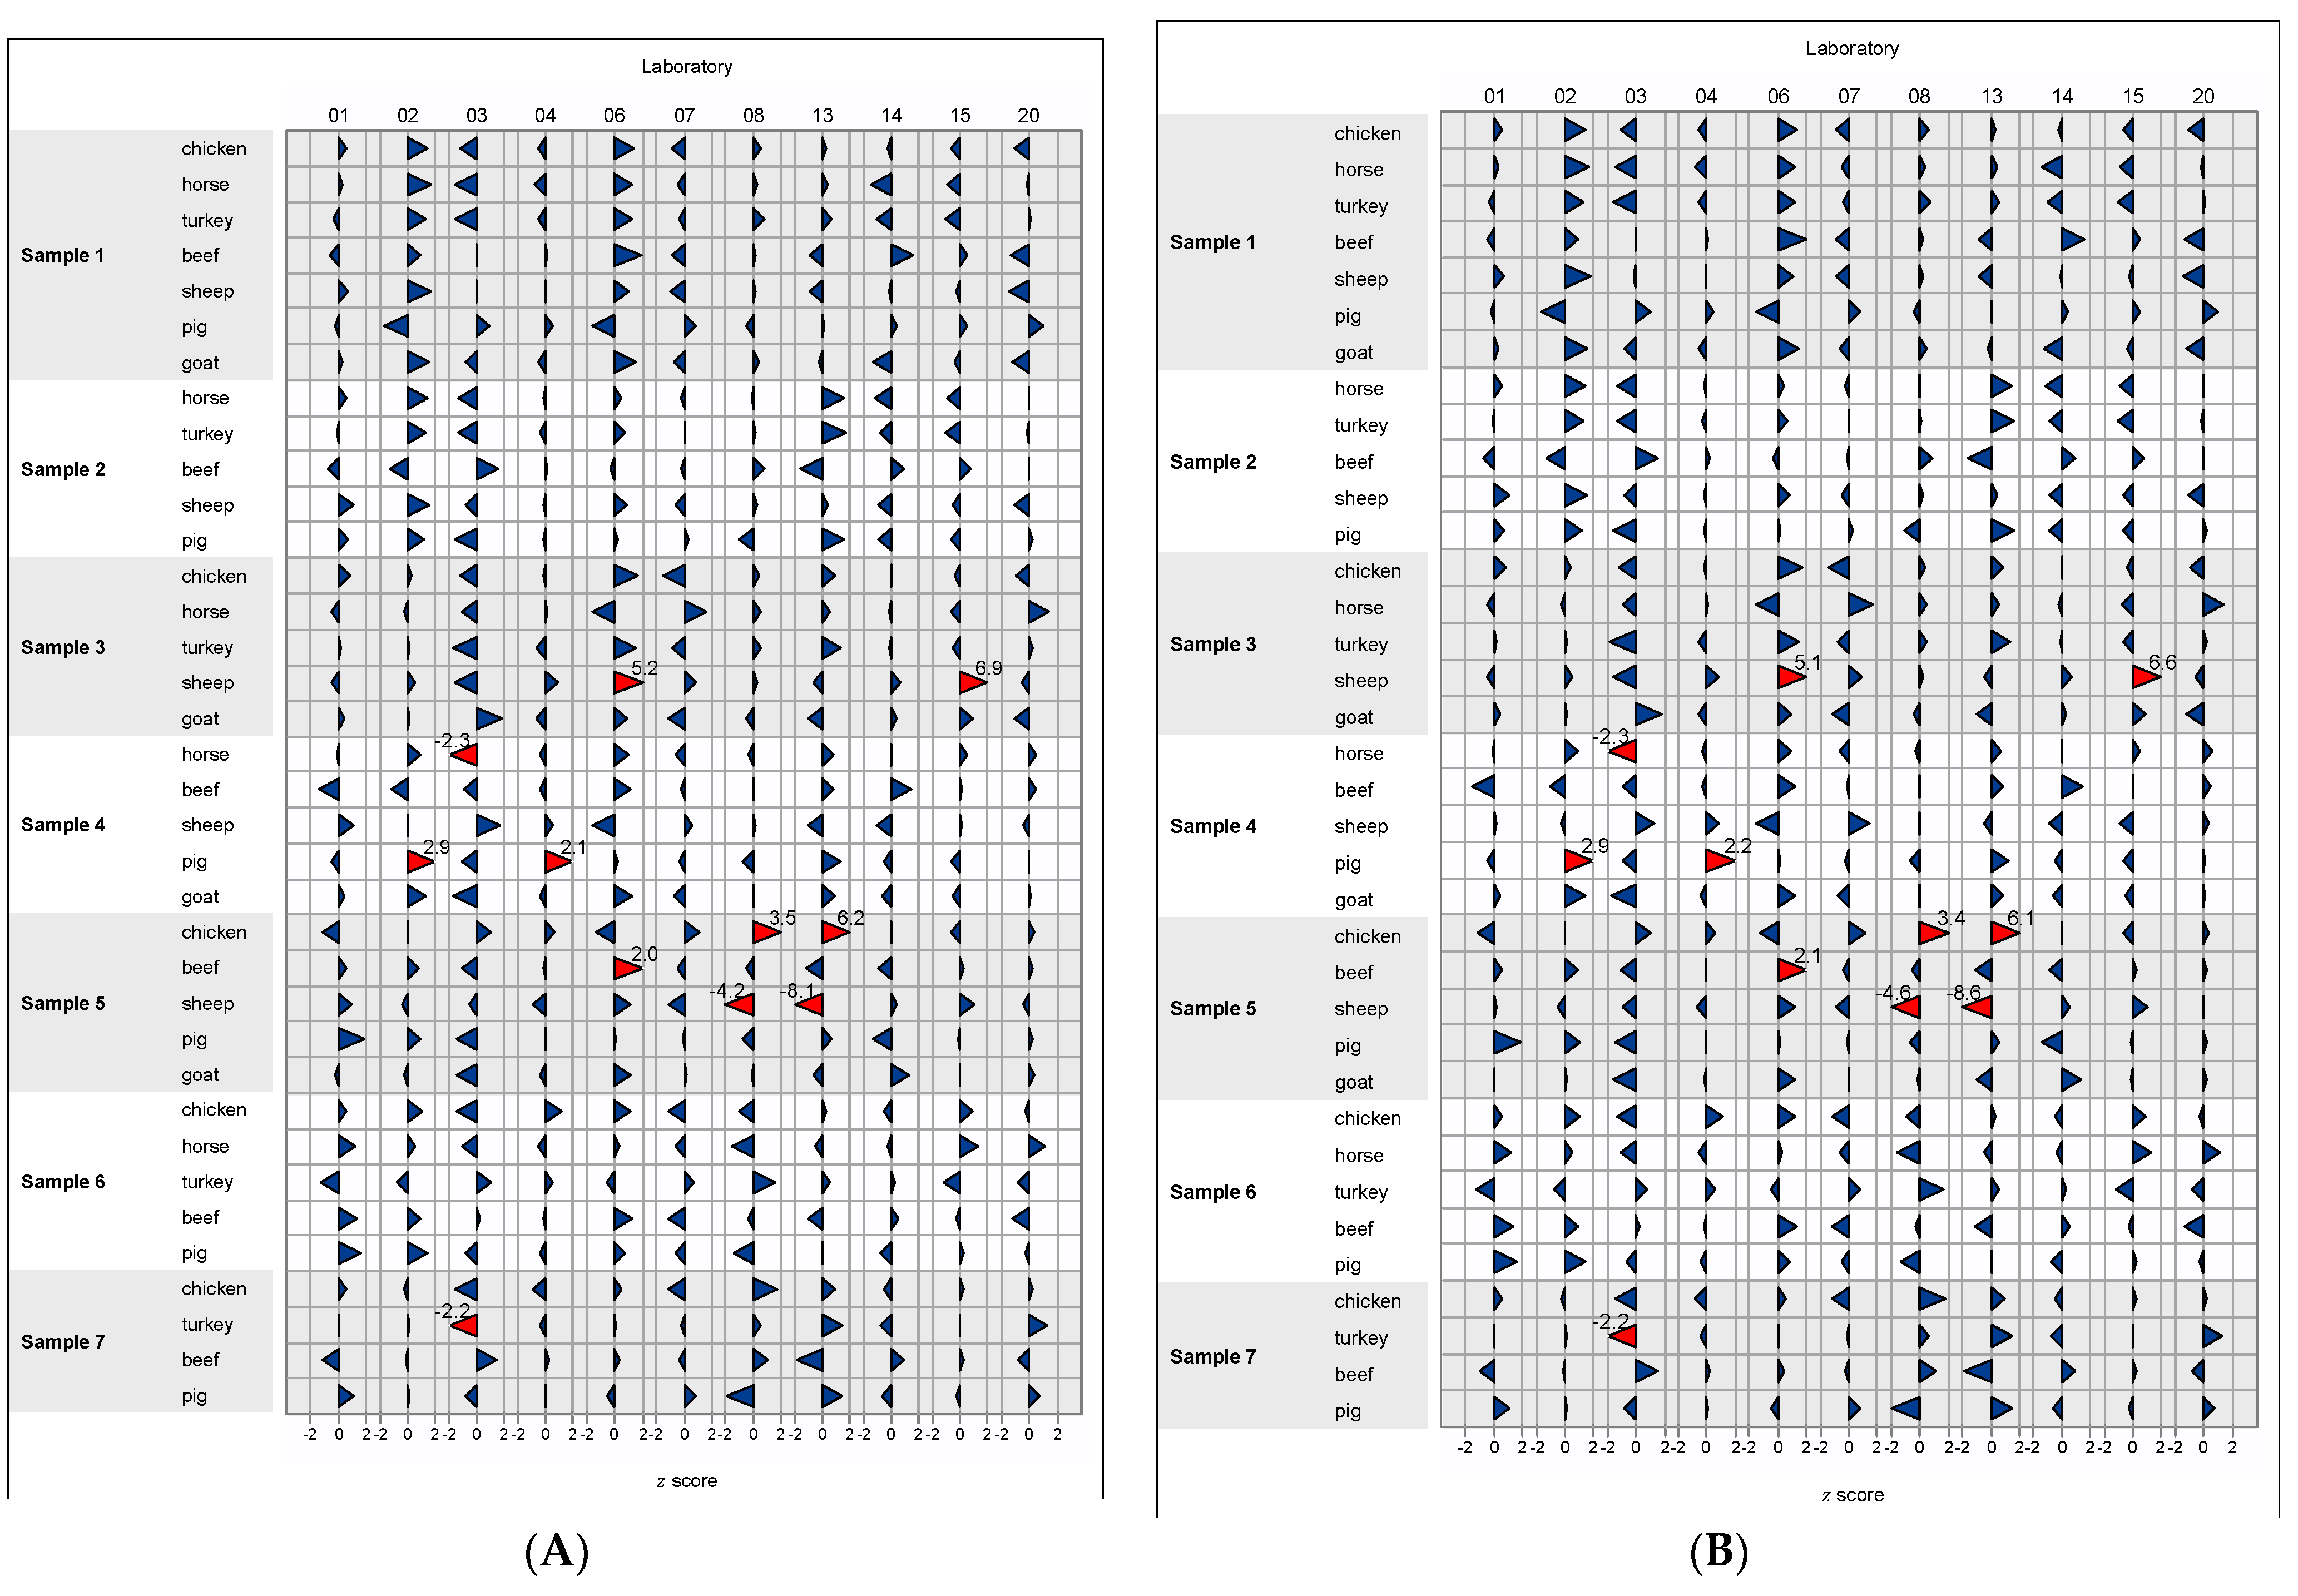
3.1.8. z Scores
3.2. Qualitative Evaluation of Ring Trial Data
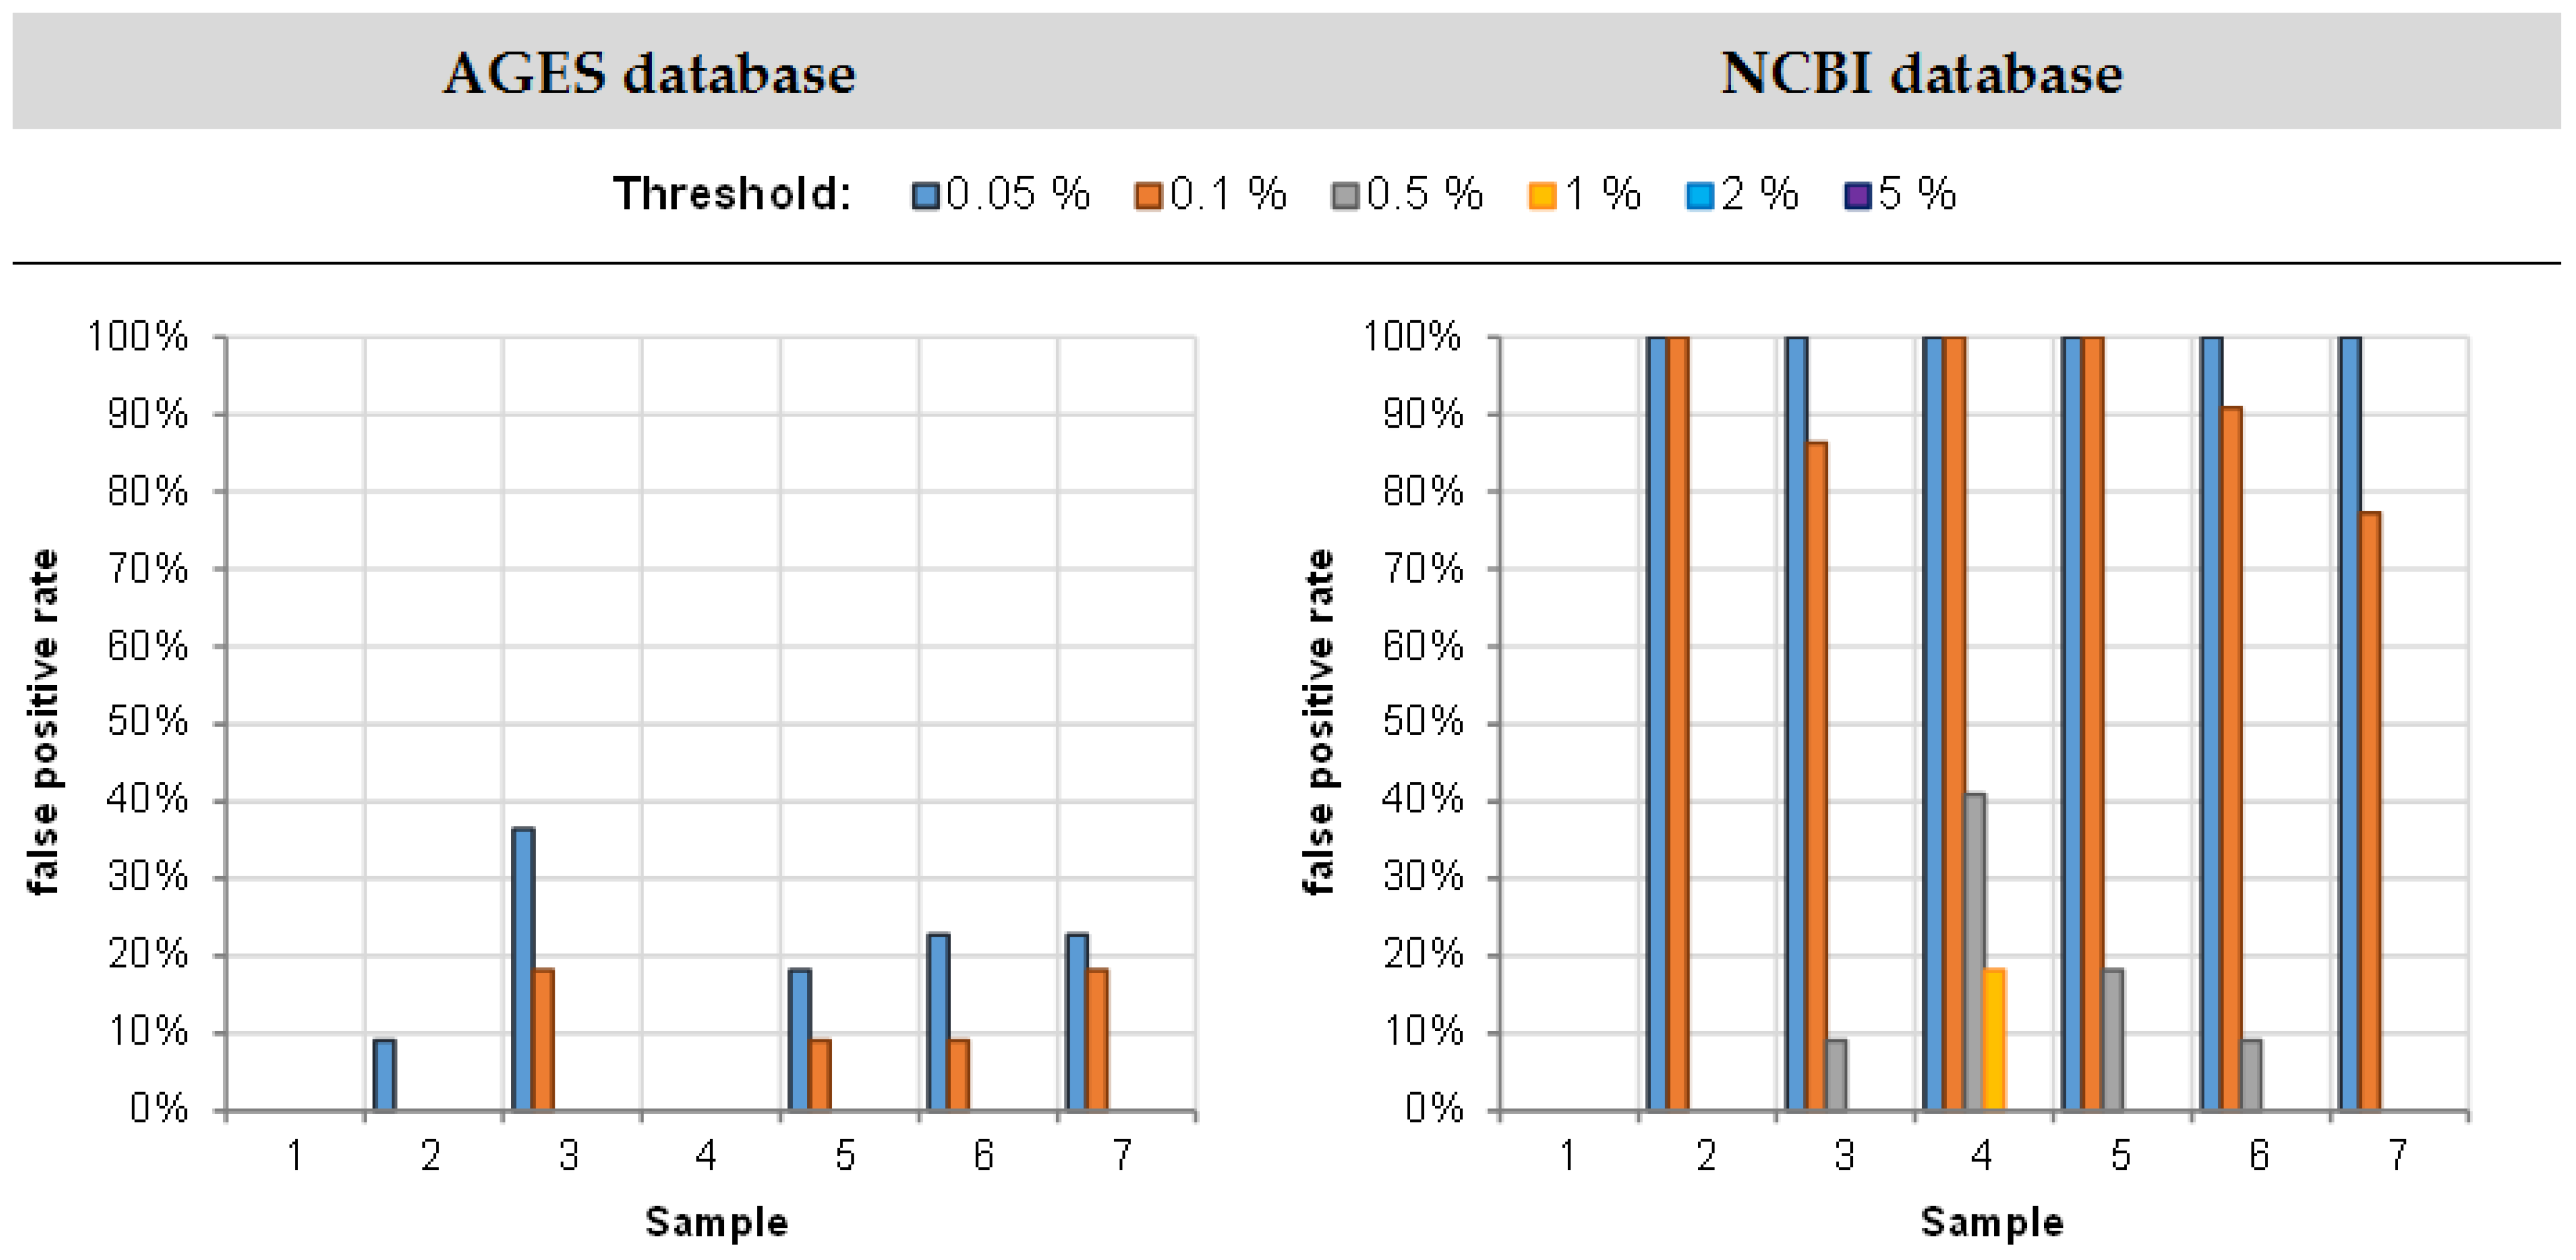
3.2.1. False Positive Rate
3.2.2. False Negative Rate
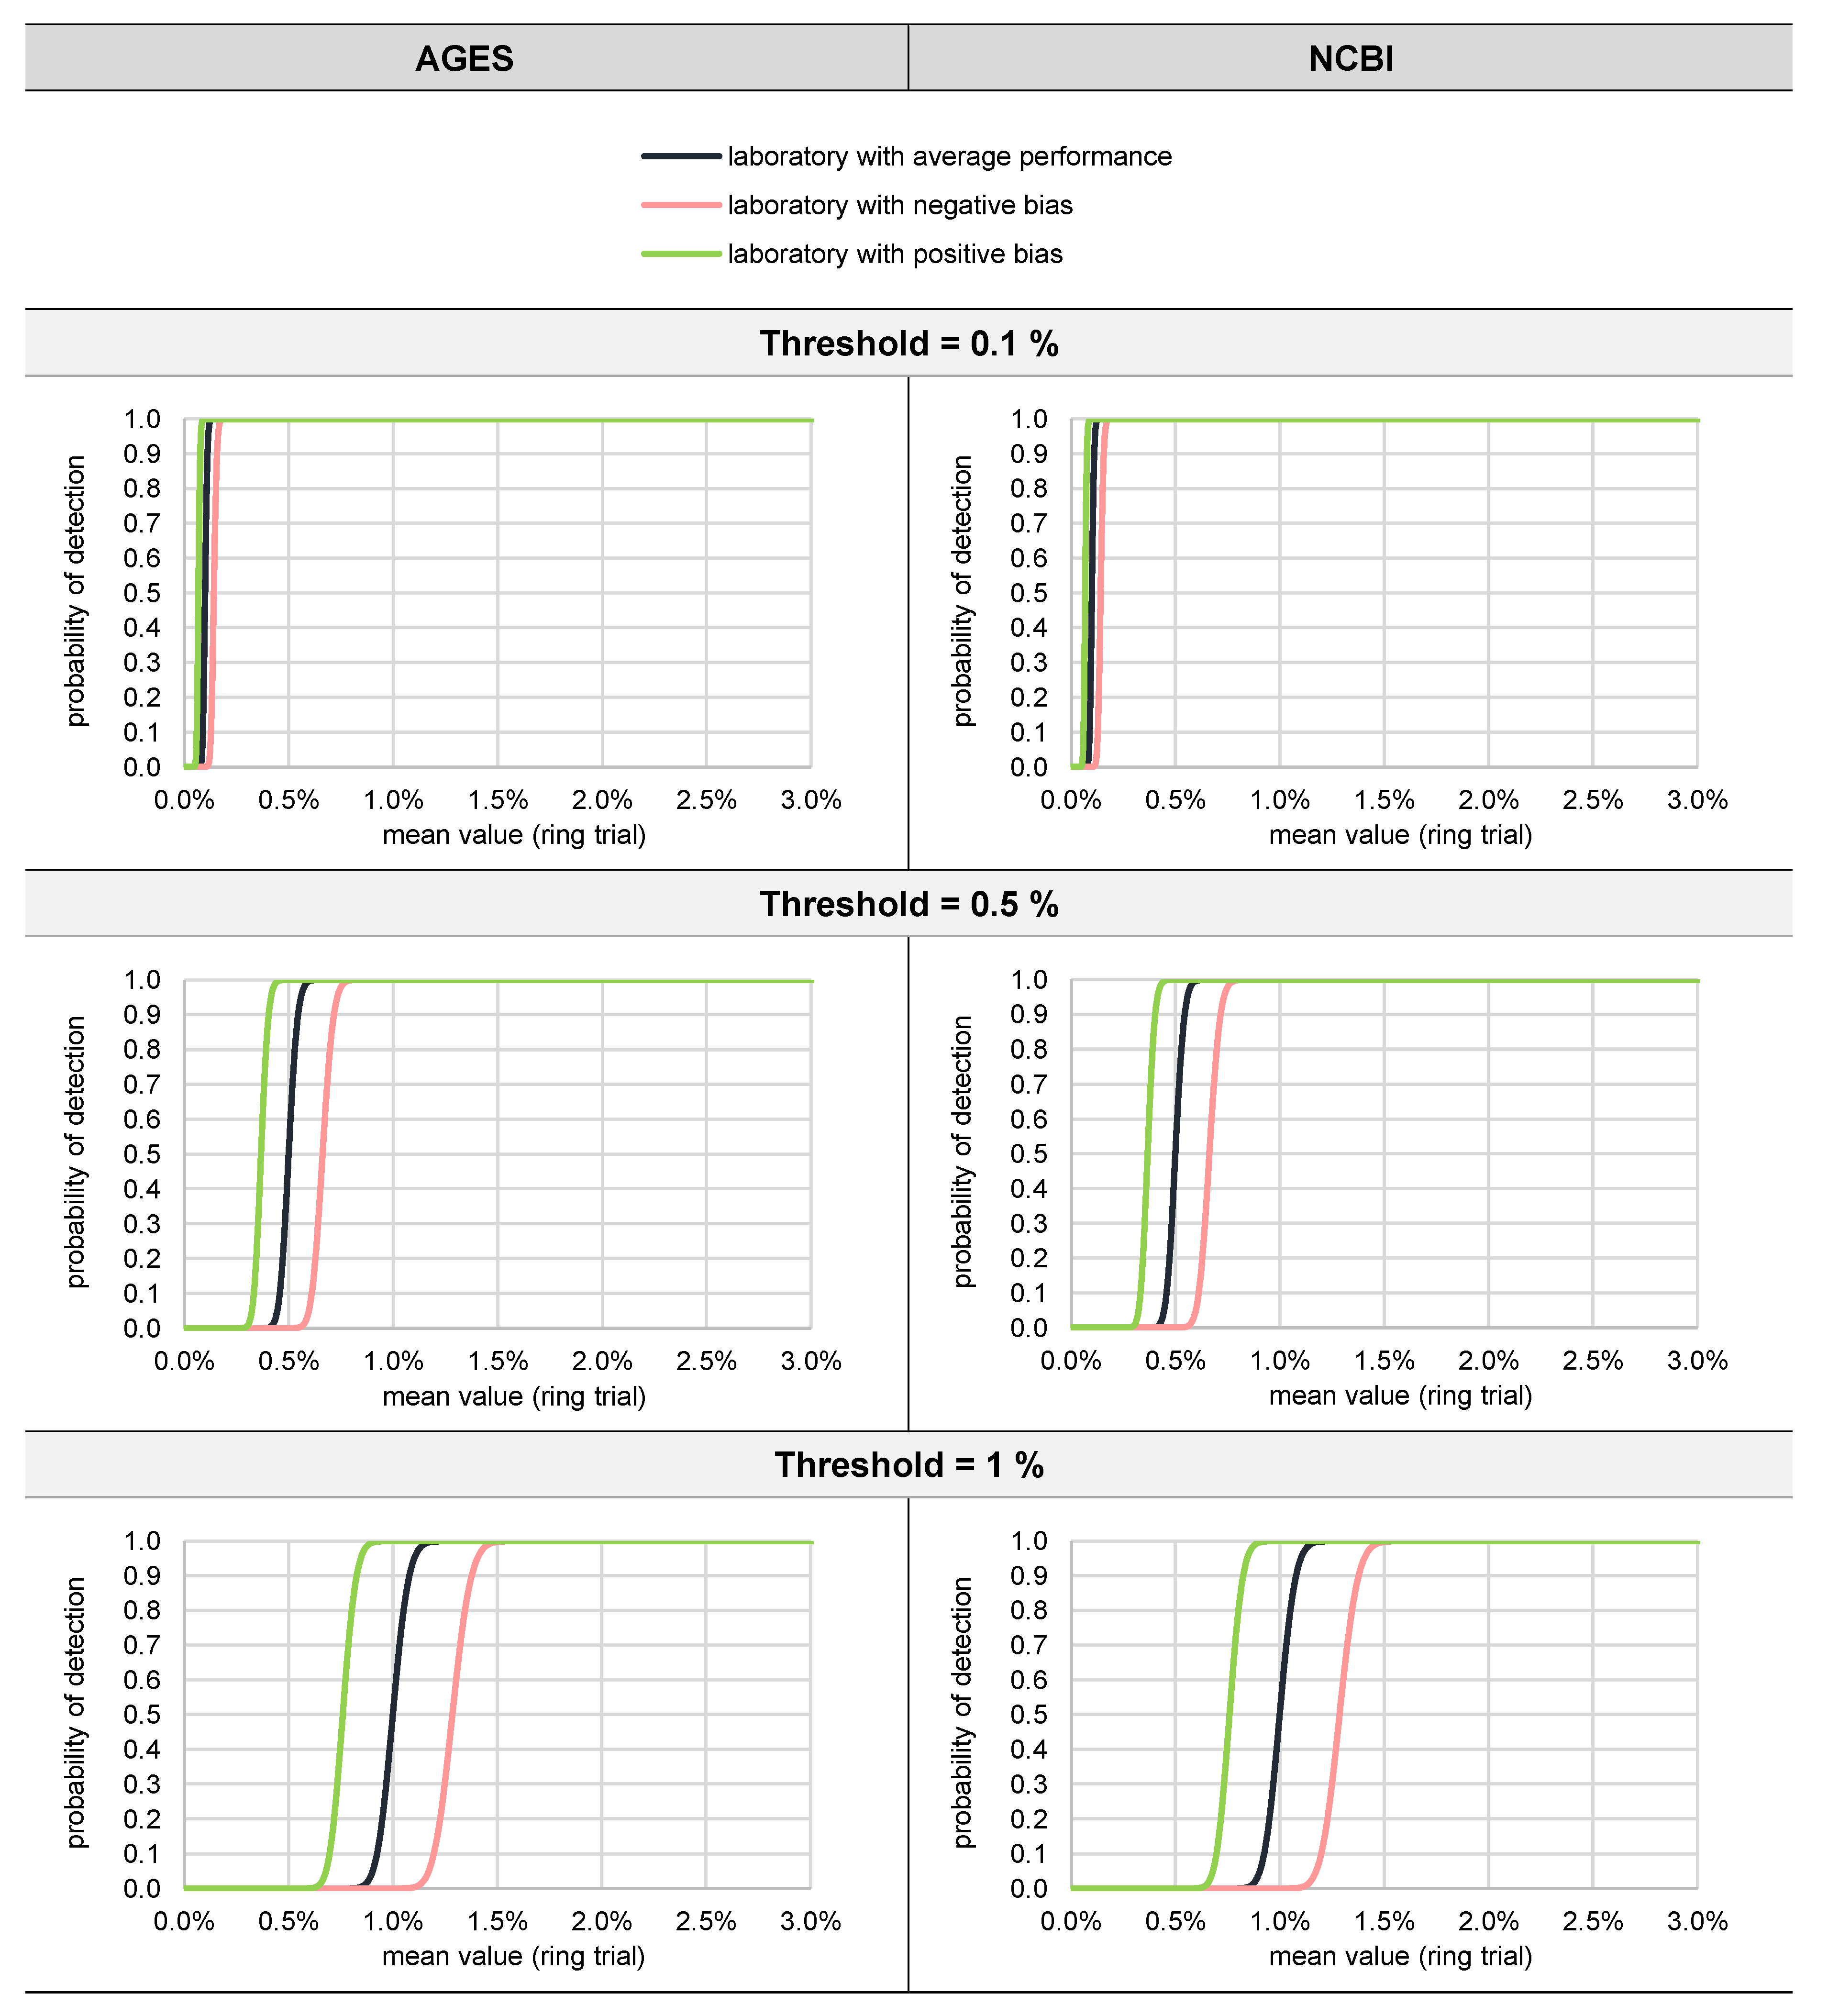
3.2.3. Probability of Detection (Qualitative Evaluation)
3.3. Negative Control
4. Conclusions
Supplementary Materials
Author Contributions
Funding
Institutional Review Board Statement
Data Availability Statement
Acknowledgments
Conflicts of Interest
References
- Ballin, N.Z.; Vogensen, F.K.; Karlsson, A.H. Species determination—Can we detect and quantify meat adulteration? Meat Sci. 2009, 83, 165–174. [Google Scholar] [CrossRef] [PubMed]
- Ballin, N.Z. Authentication of meat and meat products. Meat Sci. 2010, 86, 577–587. [Google Scholar] [CrossRef] [PubMed]
- Sajali, N.; Wong, S.C.; Abu Bakar, S.; Khairil Mokhtar, N.F.; Manaf, Y.N.; Yuswan, M.H.; Mohd Desa, M.N. Analytical approaches of meat authentication in food. Int. J. Food Sci. Technol. 2021, 56, 1535–1543. [Google Scholar] [CrossRef]
- Kumar, A.; Kumar, R.R.; Sharma, B.D.; Gokulakrishnan, P.; Mendiratta, S.K.; Sharma, D. Identification of species origin of meat and meat products on the DNA basis: A review. Crit. Rev. Food Sci. Nutr. 2015, 55, 1340–1351. [Google Scholar] [CrossRef] [PubMed]
- Köppel, R.; Ruf, J.; Zimmerli, F.; Breitenmoser, A. Multiplex real-time PCR for the detection and quantification of DNA from beef, pork, chicken and turkey. Eur. Food Res. Technol. 2008, 227, 1199–1203. [Google Scholar] [CrossRef]
- Köppel, R.; Ruf, J.; Rentsch, J. Multiplex real-time PCR for the detection and quantification of DNA from beef, pork, horse and sheep. Eur. Food Res. Technol. 2011, 232, 151–155. [Google Scholar] [CrossRef]
- Kaltenbrunner, M.; Hochegger, R.; Cichna-Markl, M. Tetraplex real-time PCR assay for the simultaneous identification and quantification of roe deer, red deer, fallow deer and sika deer for deer meat authentication. Food Chem. 2018, 269, 486–494. [Google Scholar] [CrossRef] [PubMed]
- Staats, M.; Arulandhu, A.J.; Gravendeel, B.; Holst-Jensen, A.; Scholtens, I.; Peelen, T.; Prins, T.W.; Kok, E. Advances in DNA metabarcoding for food and wildlife forensic species identification. Anal. Bioanal. Chem. 2016, 408, 4615–4630. [Google Scholar] [CrossRef] [PubMed] [Green Version]
- Nehal, N.; Choudhary, B.; Nagpure, A.; Gupta, R.K. DNA barcoding: A modern age tool for detection of adulteration in food. Crit. Rev. Biotechnol. 2021, 41, 767–791. [Google Scholar] [CrossRef] [PubMed]
- Galimberti, A.; Casiraghi, M.; Bruni, I.; Guzzetti, L.; Cortis, P.; Berterame, N.M.; Labra, M. From DNA barcoding to personalized nutrition: The evolution of food traceability. Curr. Opin. Food Sci. 2019, 28, 41–48. [Google Scholar] [CrossRef]
- Dobrovolny, S.; Blaschitz, M.; Weinmaier, T.; Pechatschek, J.; Cichna-Markl, M.; Indra, A.; Hufnagl, P.; Hochegger, R. Development of a DNA metabarcoding method for the identification of fifteen mammalian and six poultry species in food. Food Chem. 2019, 272, 354–361. [Google Scholar] [CrossRef] [PubMed]
- Preckel, L.; Brünen-Nieweler, C.; Denay, G.; Petersen, H.; Cichna-Markl, M.; Dobrovolny, S.; Hochegger, R. Identification of mammalian and poultry species in food and pet food samples using 16s rdna metabarcoding. Foods 2021, 10, 2875. [Google Scholar] [CrossRef] [PubMed]
- ISO 21571 I; Foodstuffs—Methods of Analysis for the Detection of Genetically Modified Organisms and Derived Products—Nucleic Acid Extraction. ISO: Geneva, Switzerland, 2005.
- Meyer, R.; Höfelein, C.; Lüthy, J.; Candrian, U. Polymerase chain reaction-restriction fragment length polymorphism analysis: A simple method for species identification in food. J. AOAC Int. 1995, 78, 1542–1551. [Google Scholar] [CrossRef] [PubMed]
- Palumbi, S.R.; Martin, A.; Romano, S.; McMillan, W.O.; Stice, L.; Grabowski, G. The Simple Fool’s Guide to PCR; Deptartment of Zoology and Kewalo Marine Laboratory, University of Hawaii: Honolulu, HI, USA, 2002. [Google Scholar]
- Martin, M. Cutadapt removes adapter sequences from high-throughput sequencing reads. EMBnet J. 2011, 17, 10. [Google Scholar] [CrossRef]
- Aronesty, E. Comparison of sequencing utility programs. Open Bioinform. J. 2013, 7, 1–8. [Google Scholar] [CrossRef]
- Edgar, R.C. Search and clustering orders of magnitude faster than BLAST. Bioinformatics 2010, 26, 2460–2461. [Google Scholar] [CrossRef] [PubMed] [Green Version]
- Quodata. PROLab Plus Software for Planning, Organizing, Performing and Analyzing Interlaboratory Studies. Available online: www.quodata.de (accessed on 10 December 2021).
- Official Collection of Test Methods A. Statistik—Planung und Statistische Auswertung von Ringversuchen zur Methodenvalidierung; Federal Office of Consumer Protection and Food Safety (BVL), Beuth Verlag: Berlin, Germany, 2006.
- MacConaill, L.E.; Burns, R.T.; Nag, A.; Coleman, H.A.; Slevin, M.K.; Giorda, K.; Light, M.; Lai, K.; Jarosz, M.; McNeill, M.S.; et al. Unique, dual-indexed sequencing adapters with UMIs effectively eliminate index cross-talk and significantly improve sensitivity of massively parallel sequencing. BMC Genom. 2018, 19, 30. [Google Scholar] [CrossRef] [PubMed] [Green Version]


| Sample | Chicken | Horse | Turkey | Beef | Sheep | Pig | Goat |
|---|---|---|---|---|---|---|---|
| Percentage (%) | |||||||
| 1 | 1 | 1 | 1 | 1 | 1 | 94 | 1 |
| 2 | - | 1.9 | 0.5 | 65.7 | 1.9 | 30 | - |
| 3 | 1.9 | 66.1 | 1.9 | - | 0.5 | - | 30 |
| 4 | - | 0.5 | - | 30 | 67.5 | 0.1 | 1.9 |
| 5 | 67.5 | - | - | 1.9 | 30 | 0.5 | 0.1 |
| 6 | 0.1 | 30 | 67.5 | 0.5 | - | 1.9 | - |
| 7 | 5 | - | 5 | 50 | - | 40 | - |
| 8 | - | - | - | - | - | - | - |
| (a). Sample 1 | |||||||||||
| Species | Spiking Level (%) | Laboratory | AGES Database | NCBI Database | Laboratory | AGES Database | NCBI Database | ||||
| A | B | A | B | A | B | A | B | ||||
| Pig | 94 | 01 | 91.25 | 91.77 | 91.21 | 91.74 | 10 | 95.58 | 94.83 | 95.56 | 94.81 |
| Chicken | 1 | 1.42 | 1.37 | 1.42 | 1.37 | 0.73 | 1.08 | 0.73 | 1.08 | ||
| Horse | 1 | 1.42 | 1.34 | 1.42 | 1.33 | 0.60 | 0.67 | 0.60 | 0.66 | ||
| Turkey | 1 | 1.17 | 1.03 | 1.16 | 1.02 | 0.49 | 0.66 | 0.41 | 0.56 | ||
| Beef | 1 | 1.55 | 1.51 | 1.55 | 1.51 | 0.57 | 0.58 | 0.57 | 0.58 | ||
| Sheep | 1 | 1.65 | 1.57 | 1.62 | 1.56 | 1.05 | 1.15 | 1.05 | 1.15 | ||
| Goat | 1 | 1.54 | 1.42 | 1.56 | 1.44 | 0.97 | 1.03 | 0.98 | 1.04 | ||
| Pig | 94 | 02 | 90.31 | 90.33 | 90.29 | 90.30 | 11 | 94.62 | 94.90 | 94.59 | 94.87 |
| Chicken | 1 | 1.50 | 1.57 | 1.50 | 1.57 | 0.47 | 0.30 | 0.47 | 0.30 | ||
| Horse | 1 | 1.64 | 1.59 | 1.64 | 1.59 | 1.01 | 1.09 | 1.00 | 1.09 | ||
| Turkey | 1 | 1.32 | 1.41 | 1.31 | 1.41 | 0.54 | 0.43 | 0.51 | 0.40 | ||
| Beef | 1 | 1.77 | 1.67 | 1.77 | 1.67 | 1.02 | 1.03 | 1.02 | 1.03 | ||
| Sheep | 1 | 1.81 | 1.73 | 1.79 | 1.72 | 1.19 | 1.16 | 1.19 | 1.16 | ||
| Goat | 1 | 1.66 | 1.69 | 1.68 | 1.71 | 1.15 | 1.10 | 1.16 | 1.11 | ||
| Pig | 94 | 03 | 92.67 | 92.48 | 92.65 | 92.46 | 12 | 94.30 | 94.68 | 94.27 | 94.65 |
| Chicken | 1 | 1.04 | 1.11 | 1.04 | 1.11 | 0.56 | 0.36 | 0.57 | 0.36 | ||
| Horse | 1 | 1.04 | 1.14 | 1.04 | 1.14 | 1.10 | 1.13 | 1.10 | 1.13 | ||
| Turkey | 1 | 0.90 | 0.90 | 0.89 | 0.89 | 0.66 | 0.48 | 0.64 | 0.47 | ||
| Beef | 1 | 1.60 | 1.55 | 1.60 | 1.55 | 0.98 | 1.03 | 0.98 | 1.04 | ||
| Sheep | 1 | 1.44 | 1.48 | 1.43 | 1.46 | 1.24 | 1.19 | 1.24 | 1.19 | ||
| Goat | 1 | 1.31 | 1.34 | 1.32 | 1.35 | 1.16 | 1.13 | 1.16 | 1.14 | ||
| Pig | 94 | 04 | 92.08 | 92.28 | 92.06 | 92.25 | 13 | 92.01 | 91.80 | 91.98 | 91.77 |
| Chicken | 1 | 1.16 | 1.21 | 1.16 | 1.21 | 1.27 | 1.33 | 1.27 | 1.33 | ||
| Horse | 1 | 1.22 | 1.14 | 1.22 | 1.14 | 1.35 | 1.38 | 1.35 | 1.38 | ||
| Turkey | 1 | 1.09 | 1.00 | 1.09 | 0.99 | 1.22 | 1.17 | 1.22 | 1.16 | ||
| Beef | 1 | 1.56 | 1.56 | 1.56 | 1.56 | 1.45 | 1.52 | 1.45 | 1.52 | ||
| Sheep | 1 | 1.45 | 1.49 | 1.45 | 1.48 | 1.38 | 1.37 | 1.38 | 1.37 | ||
| Goat | 1 | 1.43 | 1.33 | 1.44 | 1.34 | 1.32 | 1.43 | 1.34 | 1.44 | ||
| Pig | 94 | 06 | 90.36 | 90.41 | 90.33 | 90.38 | 14 | 90.44 | 93.48 | 90.41 | 93.46 |
| Chicken | 1 | 1.51 | 1.53 | 1.51 | 1.53 | 1.57 | 0.97 | 1.57 | 0.97 | ||
| Horse | 1 | 1.52 | 1.56 | 1.51 | 1.56 | 1.32 | 0.92 | 1.32 | 0.92 | ||
| Turkey | 1 | 1.36 | 1.33 | 1.36 | 1.32 | 1.14 | 0.82 | 1.13 | 0.82 | ||
| Beef | 1 | 1.87 | 1.84 | 1.87 | 1.84 | 2.17 | 1.50 | 2.17 | 1.50 | ||
| Sheep | 1 | 1.72 | 1.67 | 1.71 | 1.66 | 1.81 | 1.24 | 1.80 | 1.24 | ||
| Goat | 1 | 1.66 | 1.66 | 1.68 | 1.67 | 1.56 | 1.06 | 1.58 | 1.07 | ||
| Pig | 94 | 07 | 92.48 | 92.19 | 92.47 | 92.17 | 15 | 92.22 | 92.23 | 92.18 | 92.20 |
| Chicken | 1 | 1.08 | 1.17 | 1.08 | 1.17 | 1.19 | 1.18 | 1.19 | 1.18 | ||
| Horse | 1 | 1.21 | 1.27 | 1.21 | 1.27 | 1.14 | 1.21 | 1.14 | 1.21 | ||
| Turkey | 1 | 1.03 | 1.10 | 1.02 | 1.10 | 0.98 | 0.96 | 0.98 | 0.96 | ||
| Beef | 1 | 1.51 | 1.50 | 1.51 | 1.50 | 1.60 | 1.55 | 1.60 | 1.55 | ||
| Sheep | 1 | 1.36 | 1.38 | 1.37 | 1.38 | 1.48 | 1.45 | 1.47 | 1.44 | ||
| Goat | 1 | 1.32 | 1.39 | 1.32 | 1.40 | 1.39 | 1.41 | 1.41 | 1.42 | ||
| Pig | 94 | 08 | 91.31 | 91.28 | 91.28 | 91.25 | 20 | 92.59 | 92.63 | 92.58 | 92.61 |
| Chicken | 1 | 1.34 | 1.40 | 1.34 | 1.40 | 1.03 | 1.09 | 1.03 | 1.09 | ||
| Horse | 1 | 1.40 | 1.32 | 1.40 | 1.32 | 1.24 | 1.28 | 1.24 | 1.28 | ||
| Turkey | 1 | 1.28 | 1.23 | 1.27 | 1.23 | 1.11 | 1.03 | 1.11 | 1.02 | ||
| Beef | 1 | 1.68 | 1.62 | 1.68 | 1.62 | 1.44 | 1.39 | 1.44 | 1.39 | ||
| Sheep | 1 | 1.53 | 1.59 | 1.52 | 1.57 | 1.31 | 1.30 | 1.31 | 1.29 | ||
| Goat | 1 | 1.46 | 1.56 | 1.48 | 1.58 | 1.27 | 1.28 | 1.28 | 1.29 | ||
| Pig | 94 | 09 | 94.62 | 93.61 | 94.60 | 93.59 | |||||
| Chicken | 1 | 0.64 | 1.07 | 0.64 | 1.08 | ||||||
| Horse | 1 | 1.06 | 1.19 | 1.06 | 1.19 | ||||||
| Turkey | 1 | 0.63 | 1.10 | 0.61 | 1.07 | ||||||
| Beef | 1 | 0.92 | 0.90 | 0.92 | 0.90 | ||||||
| Sheep | 1 | 1.10 | 1.05 | 1.10 | 1.05 | ||||||
| Goat | 1 | 1.04 | 1.07 | 1.05 | 1.08 | ||||||
| (b). Sample 2 | |||||||||||
| Species | Spiking Level (%) | Laboratory | AGES Database | NCBI Database | Laboratory | AGES Database | NCBI Database | ||||
| A | B | A | B | A | B | A | B | ||||
| Beef | 65.7 | 01 | 64.59 | 65.91 | 64.42 | 65.73 | 10 | 53.26 | 55.43 | 53.14 | 55.32 |
| Pig | 30 | 30.04 | 29.36 | 29.93 | 29.24 | 41.44 | 40.09 | 41.25 | 39.91 | ||
| Horse | 1.9 | 2.24 | 1.97 | 2.23 | 1.96 | 2.21 | 1.63 | 2.19 | 1.61 | ||
| Sheep | 1.9 | 2.61 | 2.33 | 2.58 | 2.30 | 2.89 | 2.71 | 2.88 | 2.70 | ||
| Turkey | 0.5 | 0.46 | 0.40 | 0.45 | 0.39 | 0.19 | 0.13 | 0.16 | 0.11 | ||
| Beef | 65.7 | 02 | 62.99 | 63.18 | 62.83 | 63.01 | 11 | 66.01 | 65.78 | 65.89 | 65.68 |
| Pig | 30 | 31.30 | 31.24 | 31.20 | 31.12 | 29.52 | 29.75 | 29.40 | 29.63 | ||
| Horse | 1.9 | 2.49 | 2.44 | 2.48 | 2.43 | 2.03 | 2.00 | 2.02 | 1.98 | ||
| Sheep | 1.9 | 2.60 | 2.56 | 2.57 | 2.53 | 2.16 | 2.27 | 2.15 | 2.26 | ||
| Turkey | 0.5 | 0.61 | 0.54 | 0.60 | 0.53 | 0.28 | 0.20 | 0.26 | 0.18 | ||
| Beef | 65.7 | 03 | 71.67 | 70.55 | 71.48 | 70.36 | 12 | 66.29 | 64.97 | 66.22 | 64.88 |
| Pig | 30 | 24.75 | 25.50 | 24.68 | 25.43 | 29.13 | 30.25 | 28.98 | 30.08 | ||
| Horse | 1.9 | 1.37 | 1.44 | 1.36 | 1.44 | 2.08 | 2.23 | 2.06 | 2.21 | ||
| Sheep | 1.9 | 1.90 | 2.16 | 1.88 | 2.13 | 2.23 | 2.31 | 2.22 | 2.30 | ||
| Turkey | 0.5 | 0.30 | 0.33 | 0.29 | 0.33 | 0.27 | 0.24 | 0.25 | 0.23 | ||
| Beef | 65.7 | 04 | 67.22 | 67.55 | 67.05 | 67.39 | 13 | 62.21 | 61.73 | 62.00 | 61.52 |
| Pig | 30 | 28.26 | 28.10 | 28.17 | 28.01 | 32.37 | 32.75 | 32.26 | 32.64 | ||
| Horse | 1.9 | 1.90 | 1.76 | 1.89 | 1.75 | 2.52 | 2.55 | 2.51 | 2.54 | ||
| Sheep | 1.9 | 2.18 | 2.16 | 2.17 | 2.14 | 2.31 | 2.31 | 2.30 | 2.30 | ||
| Turkey | 0.5 | 0.40 | 0.37 | 0.39 | 0.37 | 0.56 | 0.62 | 0.55 | 0.62 | ||
| Beef | 65.7 | 06 | 66.46 | 65.45 | 66.28 | 65.24 | 14 | 70.20 | 68.65 | 69.99 | 68.47 |
| Pig | 30 | 28.63 | 29.35 | 28.54 | 29.24 | 26.07 | 27.18 | 25.99 | 27.11 | ||
| Horse | 1.9 | 2.09 | 2.10 | 2.08 | 2.09 | 1.44 | 1.63 | 1.43 | 1.62 | ||
| Sheep | 1.9 | 2.32 | 2.54 | 2.31 | 2.52 | 1.94 | 2.15 | 1.92 | 2.13 | ||
| Turkey | 0.5 | 0.47 | 0.52 | 0.47 | 0.52 | 0.32 | 0.36 | 0.32 | 0.36 | ||
| Beef | 65.7 | 07 | 65.64 | 66.96 | 65.46 | 66.77 | 15 | 69.77 | 67.63 | 69.61 | 67.48 |
| Pig | 30 | 29.78 | 28.89 | 29.68 | 28.80 | 26.43 | 27.98 | 26.36 | 27.90 | ||
| Horse | 1.9 | 1.93 | 1.73 | 1.92 | 1.72 | 1.49 | 1.77 | 1.48 | 1.76 | ||
| Sheep | 1.9 | 2.17 | 2.04 | 2.17 | 2.03 | 1.96 | 2.20 | 1.93 | 2.16 | ||
| Turkey | 0.5 | 0.47 | 0.37 | 0.47 | 0.37 | 0.31 | 0.37 | 0.31 | 0.37 | ||
| Beef | 65.7 | 08 | 68.90 | 69.26 | 68.70 | 69.06 | 20 | 68.01 | 65.33 | 67.81 | 65.14 |
| Pig | 30 | 26.45 | 26.12 | 26.36 | 26.03 | 28.10 | 30.10 | 28.02 | 30.01 | ||
| Horse | 1.9 | 1.92 | 1.85 | 1.91 | 1.84 | 1.69 | 2.06 | 1.69 | 2.05 | ||
| Sheep | 1.9 | 2.26 | 2.31 | 2.23 | 2.28 | 1.85 | 2.09 | 1.84 | 2.08 | ||
| Turkey | 0.5 | 0.43 | 0.43 | 0.43 | 0.43 | 0.34 | 0.42 | 0.34 | 0.42 | ||
| Beef | 65.7 | 09 | 63.64 | 63.11 | 63.64 | 63.11 | |||||
| Pig | 30 | 31.59 | 32.21 | 31.38 | 31.99 | ||||||
| Horse | 1.9 | 2.26 | 2.21 | 2.24 | 2.18 | ||||||
| Sheep | 1.9 | 2.26 | 2.25 | 2.24 | 2.23 | ||||||
| Turkey | 0.5 | 0.24 | 0.22 | 0.23 | 0.21 | ||||||
| (c). Sample 7 | |||||||||||
| Species | Spiking Level (%) | Laboratory | AGES Database | NCBI Database | Laboratory | AGES Database | NCBI Database | ||||
| A | B | A | B | A | B | A | B | ||||
| Beef | 50 | 01 | 45.79 | 45.80 | 45.75 | 45.78 | 10 | 34.33 | 34.58 | 34.34 | 34.59 |
| Pig | 40 | 42.31 | 42.71 | 42.25 | 42.64 | 61.16 | 60.60 | 61.03 | 60.47 | ||
| Chicken | 5 | 7.56 | 7.35 | 7.55 | 7.35 | 3.32 | 3.46 | 3.32 | 3.45 | ||
| Turkey | 5 | 4.31 | 4.08 | 4.28 | 4.05 | 1.16 | 1.33 | 0.95 | 1.13 | ||
| Beef | 50 | 02 | 48.54 | 48.18 | 48.50 | 48.16 | 11 | 45.20 | 43.03 | 45.19 | 43.03 |
| Pig | 40 | 40.68 | 40.46 | 40.62 | 40.40 | 50.41 | 45.73 | 50.30 | 45.63 | ||
| Chicken | 5 | 6.71 | 6.77 | 6.70 | 6.76 | 2.52 | 6.59 | 2.52 | 6.59 | ||
| Turkey | 5 | 3.99 | 4.26 | 3.97 | 4.25 | 1.81 | 4.60 | 1.70 | 4.35 | ||
| Beef | 50 | 03 | 52.15 | 52.30 | 52.08 | 52.24 | 12 | 45.87 | 42.72 | 45.91 | 42.76 |
| Pig | 40 | 38.50 | 38.68 | 38.45 | 38.64 | 49.65 | 44.84 | 49.50 | 44.72 | ||
| Chicken | 5 | 6.10 | 5.87 | 6.09 | 5.86 | 2.58 | 7.14 | 2.58 | 7.13 | ||
| Turkey | 5 | 3.24 | 3.13 | 3.20 | 3.10 | 1.84 | 5.24 | 1.78 | 5.08 | ||
| Beef | 50 | 04 | 49.31 | 49.59 | 49.29 | 49.57 | 13 | 44.13 | 43.46 | 44.08 | 43.41 |
| Pig | 40 | 40.47 | 40.16 | 40.42 | 40.11 | 43.46 | 44.09 | 43.40 | 44.03 | ||
| Chicken | 5 | 6.23 | 6.21 | 6.22 | 6.20 | 7.62 | 7.44 | 7.61 | 7.43 | ||
| Turkey | 5 | 3.70 | 3.77 | 3.69 | 3.76 | 4.63 | 4.85 | 4.62 | 4.84 | ||
| Beef | 50 | 06 | 50.05 | 49.52 | 50.01 | 49.46 | 14 | 50.95 | 51.46 | 50.90 | 51.40 |
| Pig | 40 | 38.40 | 39.33 | 38.35 | 39.27 | 38.49 | 38.71 | 38.44 | 38.66 | ||
| Chicken | 5 | 7.42 | 7.12 | 7.41 | 7.11 | 6.75 | 6.22 | 6.74 | 6.22 | ||
| Turkey | 5 | 4.08 | 4.00 | 4.07 | 3.99 | 3.78 | 3.59 | 3.76 | 3.58 | ||
| Beef | 50 | 07 | 47.44 | 48.52 | 47.39 | 48.47 | 15 | 49.53 | 48.78 | 49.49 | 48.74 |
| Pig | 40 | 42.22 | 41.83 | 42.18 | 41.78 | 39.38 | 39.84 | 39.34 | 39.80 | ||
| Chicken | 5 | 6.21 | 5.89 | 6.20 | 5.88 | 7.03 | 7.24 | 7.02 | 7.24 | ||
| Turkey | 5 | 4.09 | 3.72 | 4.08 | 3.72 | 4.02 | 4.13 | 4.00 | 4.11 | ||
| Beef | 50 | 08 | 51.82 | 51.73 | 51.75 | 51.67 | 20 | 46.99 | 46.15 | 46.94 | 46.11 |
| Pig | 40 | 35.16 | 36.23 | 35.11 | 36.18 | 41.48 | 42.03 | 41.45 | 42.00 | ||
| Chicken | 5 | 8.61 | 7.82 | 8.59 | 7.81 | 6.84 | 7.18 | 6.84 | 7.18 | ||
| Turkey | 5 | 4.38 | 4.18 | 4.37 | 4.16 | 4.66 | 4.61 | 4.65 | 4.60 | ||
| Beef | 50 | 09 | 44.59 | 43.04 | 44.70 | 43.14 | |||||
| Pig | 40 | 50.65 | 51.23 | 50.45 | 51.03 | ||||||
| Chicken | 5 | 2.87 | 3.47 | 2.86 | 3.46 | ||||||
| Turkey | 5 | 1.87 | 2.22 | 1.80 | 2.15 | ||||||
| Sample | Species | Laboratory | Reason |
|---|---|---|---|
| 1 | All species (n = 7) | 14 | Excessive variance of results for both subsamples |
| 3 | Sheep | 06 | Too high laboratory mean value |
| 15 | Too high laboratory mean value | ||
| 4 | Pig | 02 | Excessive variance of results for both subsamples |
| 5 | Chicken | 08 | Too high laboratory mean value |
| 13 | Too high laboratory mean value | ||
| Sheep | 08 | Too low laboratory mean value | |
| 13 | Too low laboratory mean value | ||
| 6 | Chicken | 15 | Excessive variance of results for both subsamples |
| Sample | |||||||||||||||
|---|---|---|---|---|---|---|---|---|---|---|---|---|---|---|---|
| Species | Parameter 1 | 1 | 2 | 3 | 4 | 5 | 6 | 7 | |||||||
| AGES | NCBI | AGES | NCBI | AGES | NCBI | AGES | NCBI | AGES | NCBI | AGES | NCBI | AGES | NCBI | ||
| Chicken | Number of labs | 11 | 11 | 11 | 11 | 11 | 11 | 11 | 11 | 11 | 11 | ||||
| Number of labs after outlier elimination | 10 | 10 | 11 | 11 | 9 | 9 | 10 | 10 | 11 | 11 | |||||
| Proportion (v/m) | 1% | 1.9% | 67.5% | 0.1% | 5% | ||||||||||
| Mean value | 1.27% | 1.26% | 2.12% | 2.11% | 55.49% | 55.34% | 0.15% | 0.15% | 6.89% | 6.88% | |||||
| sR | 0.18% | 0.18% | 0.23% | 0.23% | 0.84% | 0.84% | 0.03% | 0.03% | 0.72% | 0.71% | |||||
| sr | 0.04% | 0.04% | 0.08% | 0.08% | 0.57% | 0.57% | 0.01% | 0.01% | 0.24% | 0.24% | |||||
| Logit proportion | −4.60 | −4.60 | −3.94 | −3.94 | 0.73 | 0.73 | −6.91 | −6.91 | −2.94 | −2.94 | |||||
| Logit mean value | −4.36 | −4.36 | −3.83 | −3.83 | 0.22 | 0.21 | −6.53 | −6.53 | −2.60 | −2.61 | |||||
| Logit sr | 0.14 | 0.14 | 0.11 | 0.11 | 0.03 | 0.03 | 0.21 | 0.21 | 0.11 | 0.11 | |||||
| Logit sr | 0.03 | 0.03 | 0.04 | 0.04 | 0.02 | 0.02 | 0.05 | 0.05 | 0.04 | 0.04 | |||||
| Horse | Number of labs | 11 | 11 | 11 | 11 | 11 | 11 | 11 | 11 | 11 | 11 | ||||
| Number of labs after outlier elimination | 10 | 10 | 11 | 11 | 11 | 11 | 11 | 11 | 11 | 11 | |||||
| Proportion (v/m) | 1% | 1.9% | 66.1% | 0.5% | 30% | ||||||||||
| Mean value | 1.31% | 1.31% | 1.89% | 1.89% | 60.3% | 60.0% | 0.47% | 0.47% | 42.0% | 41.9% | |||||
| sR | 0.17% | 0.17% | 0.37% | 0.37% | 1.1% | 1.1% | 0.08% | 0.08% | 1.9% | 1.9% | |||||
| sr | 0.05% | 0.05% | 0.14% | 0.14% | 0.3% | 0.3% | 0.04% | 0.04% | 0.7% | 0.7% | |||||
| Logit proportion | −4.60 | −4.60 | −3.94 | −3.94 | 0.67 | 0.67 | −5.29 | −5.29 | −0.85 | −0.85 | |||||
| Logit mean value | −4.32 | −4.32 | −3.95 | −3.95 | 0.42 | 0.40 | −5.35 | −5.36 | −0.32 | −0.33 | |||||
| Logit sr | 0.13 | 0.13 | 0.20 | 0.20 | 0.05 | 0.05 | 0.18 | 0.17 | 0.08 | 0.08 | |||||
| Logit sr | 0.04 | 0.04 | 0.08 | 0.08 | 0.01 | 0.01 | 0.08 | 0.08 | 0.03 | 0.03 | |||||
| Turkey | Number of labs | 11 | 11 | 11 | 11 | 11 | 11 | 11 | 11 | 11 | 11 | ||||
| Number of labs after outlier elimination | 10 | 10 | 11 | 11 | 11 | 11 | 11 | 11 | 11 | 11 | |||||
| Proportion (v/m) | 1% | 0.5% | 1.9% | 67.5% | 5% | ||||||||||
| Mean value | 1.12% | 1.12% | 0.42% | 0.42% | 1.86% | 1.85% | 54.0% | 53.8% | 4.03% | 4.02% | |||||
| sR | 0.16% | 0.16% | 0.09% | 0.09% | 0.19% | 0.19% | 2.1% | 2.0% | 0.46% | 0.46% | |||||
| sr | 0.05% | 0.05% | 0.04% | 0.04% | 0.07% | 0.07% | 0.9% | 0.9% | 0.14% | 0.14% | |||||
| Logit proportion | −4.60 | −4.60 | −5.29 | −5.29 | −3.94 | −3.94 | 0.73 | 0.73 | −2.94 | −2.94 | |||||
| Logit mean value | −4.48 | −4.48 | −5.47 | −5.48 | −3.97 | −3.97 | 0.16 | 0.15 | −3.17 | −3.17 | |||||
| Logit sr | 0.14 | 0.14 | 0.22 | 0.22 | 0.10 | 0.10 | 0.08 | 0.08 | 0.12 | 0.12 | |||||
| Logit sr | 0.05 | 0.05 | 0.10 | 0.10 | 0.04 | 0.04 | 0.04 | 0.04 | 0.04 | 0.04 | |||||
| Beef | Number of labs | 11 | 11 | 11 | 11 | 11 | 11 | 11 | 11 | 11 | 11 | 11 | 11 | ||
| Number of labs after outlier elimination | 10 | 10 | 11 | 11 | 11 | 11 | 11 | 11 | 11 | 11 | 11 | 11 | |||
| Proportion (v/m) | 1% | 65.7% | 30% | 1.9% | 0.5% | 50% | |||||||||
| Mean value | 1.58% | 1.58% | 66.9% | 66.7% | 33.02% | 32.87% | 2.79% | 2.79% | 0.91% | 0.91% | 48.7% | 48.7% | |||
| sR | 0.13% | 0.13% | 2.8% | 2.8% | 0.55% | 0.56% | 0.20% | 0.20% | 0.09% | 0.09% | 2.6% | 2.6% | |||
| sr | 0.04% | 0.04% | 1.0% | 1.0% | 0.31% | 0.31% | 0.10% | 0.10% | 0.05% | 0.05% | 0.4% | 0.4% | |||
| Logit proportion | −4.60 | −4.60 | 0.65 | 0.65 | −0.85 | −0.85 | −3.94 | −3.94 | −5.29 | −5.29 | 0 | 0 | |||
| Logit mean value | −4.13 | −4.13 | 0.70 | 0.69 | −0.71 | −0.71 | −3.55 | −3.55 | −4.69 | −4.69 | −0.05 | −0.05 | |||
| Logit sr | 0.08 | 0.08 | 0.13 | 0.13 | 0.02 | 0.03 | 0.07 | 0.07 | 0.10 | 0.10 | 0.11 | 0.10 | |||
| Logit sr | 0.02 | 0.02 | 0.04 | 0.04 | 0.01 | 0.01 | 0.04 | 0.04 | 0.06 | 0.06 | 0.02 | 0.02 | |||
| Sheep | Number of labs | 11 | 11 | 11 | 11 | 11 | 11 | 11 | 11 | 11 | 11 | ||||
| Number of labs after outlier elimination | 10 | 10 | 11 | 11 | 9 | 9 | 11 | 11 | 9 | 9 | |||||
| Proportion (v/m) | 1% | 1.9% | 0.5% | 67.5% | 30% | ||||||||||
| Mean value | 1.50% | 1.49% | 2.21% | 2.19% | 0.14% | 0.14% | 64.41% | 63.67% | 40.92% | 40.62% | |||||
| sR | 0.15% | 0.14% | 0.22% | 0.22% | 0.01% | 0.01% | 0.65% | 0.60% | 0.62% | 0.65% | |||||
| sr | 0.03% | 0.03% | 0.14% | 0.13% | 0.01% | 0.01% | 0.27% | 0.27% | 0.49% | 0.46% | |||||
| Logit proportion | −4.60 | −4.60 | −3.94 | −3.94 | −5.29 | −5.29 | 0.73 | 0.73 | −0.85 | −0.85 | |||||
| Logit mean value | −4.18 | −4.19 | −3.79 | −3.80 | −6.58 | −6.60 | 0.59 | 0.56 | −0.37 | −0.38 | |||||
| Logit sr | 0.10 | 0.10 | 0.10 | 0.10 | 0.10 | 0.09 | 0.03 | 0.03 | 0.03 | 0.03 | |||||
| Logit sr | 0.02 | 0.02 | 0.06 | 0.06 | 0.08 | 0.08 | 0.01 | 0.01 | 0.02 | 0.02 | |||||
| Pig | Number of labs | 11 | 11 | 11 | 11 | 11 | 11 | 11 | 11 | 11 | 11 | 11 | 11 | ||
| Number of labs after outlier elimination | 10 | 10 | 11 | 11 | 10 | 10 | 11 | 11 | 11 | 11 | 11 | 11 | |||
| Proportion (v/m) | 94% | 30% | 0.1% | 0.5% | 1.9% | 40% | |||||||||
| Mean value | 91.77% | 91.74% | 28.5% | 28.4% | 0.04% | 0.04% | 0.61% | 0.61% | 2.90% | 2.90% | 40.2% | 40.1% | |||
| sR | 0.83% | 0.83% | 2.2% | 2.2% | 0.02% | 0.02% | 0.12% | 0.12% | 0.26% | 0.26% | 2.3% | 2.3% | |||
| sr | 0.16% | 0.16% | 0.7% | 0.7% | 0% | 0% | 0.04% | 0.04% | 0.13% | 0.13% | 0.4% | 0.4% | |||
| Logit proportion | 2.75 | 2.75 | −0.85 | −0.85 | −6.91 | −6.91 | −5.29 | −5.29 | −3.94 | −3.94 | −0.41 | −0.41 | |||
| Logit mean value | 2.41 | 2.41 | −0.92 | −0.92 | −7.73 | −7.74 | −5.09 | −5.10 | −3.51 | −3.51 | −0.40 | −0.40 | |||
| Logit sr | 0.11 | 0.11 | 0.11 | 0.11 | 0.41 | 0.41 | 0.19 | 0.19 | 0.09 | 0.09 | 0.10 | 0.10 | |||
| Logit sr | 0.02 | 0.02 | 0.03 | 0.03 | 0.10 | 0.10 | 0.07 | 0.07 | 0.05 | 0.05 | 0.02 | 0.02 | |||
| Goat | Number of labs | 11 | 11 | 11 | 11 | 11 | 11 | 11 | 11 | ||||||
| Number of labs after outlier elimination | 10 | 10 | 11 | 11 | 11 | 11 | 11 | 11 | |||||||
| Proportion (v/m) | 1% | 30% | 1.9% | 0.1% | |||||||||||
| Mean value | 1.44% | 1.45% | 35.4% | 35.6% | 2.00% | 2.01% | 0.09% | 0.09% | |||||||
| sR | 0.14% | 0.14% | 1.0% | 1.0% | 022% | 0.23% | 0.02% | 0.02% | |||||||
| sr | 0.05% | 0.05% | 0.3% | 0.3% | 0.10% | 0.10% | 0.02% | 0.02% | |||||||
| Logit proportion | −4.60 | −4.60 | 0.85 | −0.85 | −3.94 | −3.94 | −6.91 | −6.91 | |||||||
| Logit mean value | −4.23 | −4.22 | −0.60 | −0.59 | −3.89 | −3.89 | −7.05 | −6.99 | |||||||
| Logit sr | 0.10 | 0.10 | 0.04 | 0.05 | 0.11 | 0.11 | 0.19 | 0.19 | |||||||
| Logit sr | 0.04 | 0.04 | 0.01 | 0.01 | 0.05 | 0.05 | 0.19 | 0.17 | |||||||
| Standard Deviation | Proportion of Animal Species | |
|---|---|---|
| 5%/95% | 50% | |
| Absolute bias standard deviation | 1.8% | 7.2% |
| Absolute reproducibility standard deviation | 0.5% | 1.8% |
| Absolute repeatability standard deviation | 0.2% | 0.6% |
| (A) | ||||||||||||
| Sample | Subsample | Laboratory | ||||||||||
| 01 | 02 | 03 | 04 | 06 | 07 | 08 | 13 | 14 | 15 | 20 | ||
| 1 | A | 6 | 2 | 1 | - | 2 | - | 2 | - | 2 | 2 | - |
| B | 2 | 5 | - | 3 | 3 | - | - | 1 | 4 | - | ||
| 2 | A | 99 | 41 | 21 | 95 | 78 | 6 | 76 | 41 | 44 | 87 | 5 |
| B | 43 | 89 | 31 | 121 | 73 | 8 | 74 | 43 | 34 | 121 | ||
| 3 | A | 49 | 325 | 14 | 1234 | 177 | 91 | 47 | 359 | 91 | 88 | 64 |
| B | 51 | 369 | 40 | 1356 | 196 | 85 | 44 | 355 | 79 | 52 | 35 | |
| 4 | A | 55 | 5 | 12 | 38 | 106 | 69 | 57 | 3 | 90 | 57 | 10 |
| B | 38 | 34 | 20 | 64 | 117 | 37 | 80 | 10 | 100 | 67 | 10 | |
| 5 | A | 6 | 51 | 2 | 286 | 173 | 121 | 56 | 124 | 271 | 79 | 65 |
| B | 9 | 57 | 3 | 286 | 212 | 62 | 66 | 137 | 396 | 39 | 32 | |
| 6 | A | 8 | 37 | 2 | 111 | 274 | 80 | 110 | 33 | 161 | 41 | 64 |
| B | 5 | 50 | 7 | 102 | 314 | 46 | 106 | 50 | 169 | 71 | 27 | |
| 7 | A | 45 | 188 | 42 | 608 | 99 | 62 | 69 | 250 | 61 | 62 | 39 |
| B | 80 | 717 | 42 | 596 | 140 | 83 | 86 | 294 | 49 | 28 | 25 | |
| (B) | ||||||||||||
| Sample | Subsample | Laboratory | ||||||||||
| 01 | 02 | 03 | 04 | 06 | 07 | 08 | 13 | 14 | 15 | 20 | ||
| 1 | A | 104 | 75 | 122 | 49 | 72 | 40 | 65 | 20 | 48 | 72 | 19 |
| B | 120 | 91 | 164 | 59 | 81 | 24 | 58 | 35 | 29 | 54 | 25 | |
| 2 | A | 630 | 715 | 612 | 743 | 804 | 242 | 891 | 465 | 526 | 637 | 388 |
| B | 489 | 783 | 1047 | 753 | 898 | 388 | 752 | 540 | 432 | 682 | 345 | |
| 3 | A | 387 | 766 | 456 | 1639 | 497 | 394 | 209 | 583 | 355 | 297 | 242 |
| B | 241 | 798 | 633 | 1792 | 606 | 383 | 229 | 621 | 365 | 177 | 127 | |
| 4 | A | 2133 | 400 | 2738 | 1482 | 1908 | 1095 | 2214 | 670 | 1164 | 2428 | 585 |
| B | 1584 | 2043 | 2896 | 1717 | 1941 | 1477 | 2182 | 837 | 1390 | 2585 | 668 | |
| 5 | A | 987 | 846 | 1963 | 1127 | 1259 | 1177 | 988 | 531 | 863 | 924 | 487 |
| B | 1711 | 1179 | 2261 | 1063 | 1368 | 468 | 1202 | 628 | 1165 | 547 | 297 | |
| 6 | A | 501 | 590 | 2354 | 634 | 796 | 584 | 556 | 437 | 525 | 371 | 261 |
| B | 627 | 580 | 2619 | 584 | 853 | 394 | 518 | 440 | 612 | 543 | 200 | |
| 7 | A | 250 | 452 | 496 | 788 | 322 | 210 | 426 | 459 | 244 | 229 | 175 |
| B | 260 | 950 | 422 | 819 | 627 | 366 | 388 | 519 | 245 | 192 | 132 | |
| Sample | Species | Spiking Level (%) | Proportion of Results below a Threshold of | |||||||
|---|---|---|---|---|---|---|---|---|---|---|
| 0.05% | 0.1% | 0.5% | 1% | 0.05% | 0.1% | 0.5% | 1% | |||
| AGES Database | NCBI Database | |||||||||
| 1 | Pig | 94 | - | - | - | - | - | - | - | - |
| Chicken | 1 | - | - | - | 1/22 (5%) | - | - | - | 1/22 (5%) | |
| Horse | 1 | - | - | - | 1/22 (5%) | - | - | - | 1/22 (5%) | |
| Turkey | 1 | - | - | - | 5/22 (23%) | - | - | - | 6/22 (27%) | |
| Beef | 1 | - | - | - | - | - | - | - | - | |
| Sheep | 1 | - | - | - | - | - | - | - | - | |
| Goat | 1 | - | - | - | - | - | - | - | - | |
| 2 | Beef | 65.7 | - | - | - | - | - | - | - | - |
| Pig | 30.0 | - | - | - | - | - | - | - | - | |
| Horse | 1.9 | - | - | - | - | - | - | - | - | |
| Sheep | 1.9 | - | - | - | - | - | - | - | - | |
| Turkey | 0.5 | - | - | 17/22 (77%) | 22/22 (100%) | - | - | 17/22 (77%) | 22/22 (100%) | |
| 3 | Horse | 66.1 | - | - | - | - | - | - | - | - |
| Goat | 30.0 | - | - | - | - | - | - | - | - | |
| Chicken | 1.9 | - | - | - | - | - | - | - | - | |
| Turkey | 1.9 | - | - | - | - | - | - | - | - | |
| Sheep | 0.5 | - | - | 22%22 (100%) | 22/22 (100%) | - | - | 22/22 (100%) | 22/22 (100%) | |
| 4 | Sheep | 67.5 | - | - | - | - | - | - | - | - |
| Beef | 30.0 | - | - | - | - | - | - | - | - | |
| Goat | 1.9 | - | - | - | - | - | - | - | - | |
| Horse | 0.5 | - | - | 13/22 (59%) | 22/22 (100%) | - | - | 14/22 (64%) | 22/22 (100%) | |
| Pig | 0.1 | 14/22 (64%) | 20/22 (91%) | 22/22 (100%) | 22/22 (100%) | 14/22 (64%) | 20/22 (91%) | 22/22 (100%) | 22/22 (100%) | |
| 5 | Chicken | 67.5 | - | - | - | - | - | - | - | - |
| Sheep | 30.0 | - | - | - | - | - | - | - | - | |
| Beef | 1.9 | - | - | - | - | - | - | - | - | |
| Pig | 0.5 | - | - | 4/22 (18%) | 22/22 (100%) | - | - | 4/22 (18%) | 22/22 (100%) | |
| Goat | 0.1 | - | 15/22 (68%) | 22/22 (100%) | 22/22 (100%) | - | 12/22 (55%) | 22/22 (100%) | 22/22 (100%) | |
| 6 | Turkey | 67.5 | - | - | - | - | - | - | - | - |
| Horse | 30.0 | - | - | - | - | - | - | - | - | |
| Pig | 1.9 | - | - | - | - | - | - | - | - | |
| Beef | 0.5 | - | - | - | 19/22 (86%) | - | - | - | 19/22 (86%) | |
| Chicken | 0.1 | - | - | 22/22 (100%) | 22/22 (100%) | - | - | 22/22 (100%) | 22/22 (100%) | |
| 7 | Beef | 50.0 | - | - | - | - | - | - | - | - |
| Pig | 40.0 | - | - | - | - | - | - | - | - | |
| Chicken | 5.0 | - | - | - | - | - | - | - | - | |
| Turkey | 5.0 | - | - | - | - | - | - | - | - | |
| (A) | ||||||||||||||||||||
| Species | Laboratory | |||||||||||||||||||
| 01 | 02 | 03 | 04 | 06 | 07 | 08 | 14 | 15 | 20 | |||||||||||
| A | B | A | B | A | B | A | B | A | B | A | B | A | B | A | B | A | B | A | B | |
| Chicken | - | - | 13 | 28 | - | - | 42 | 30 | 4 | 98 | - | - | 2 | - | 10 | 177 | 2 | 10 | 8 | 5 |
| Horse | - | - | 7 | 6 | - | 2 | 57 | 51 | - | 2 | - | - | - | - | - | 1 | - | - | 7 | 5 |
| Turkey | - | - | 5 | 11 | - | 6 | 51 | 52 | 3 | 7 | 1 | - | - | 3 | 232 | 6 | 6 | 15 | 13 | 9 |
| Beef | 10 | 9 | 25 | 22 | 2 | 171 | 17 | 65 | 101 | 97 | 222 | - | 43 | 51 | 185 | 148 | 57 | 99 | 110 | 55 |
| Pig | - | 1 | 1 | 3 | 23 | 87 | 11 | 3 | 216 | 114 | 563 | - | 21 | 21 | 91 | 56 | 38 | 54 | 50 | 26 |
| Sheep | 5 | 14 | 51 | 79 | 2 | 2 | 82 | 74 | 3 | 9 | 19 | - | 3 | 1 | 11 | 3 | - | - | 9 | 10 |
| Goat | 1 | 1 | - | 1 | - | - | 1 | 1 | 1 | 1 | 2 | - | - | - | - | 1 | - | - | - | 1 |
| Bison bonasus | - | - | - | - | - | - | - | - | - | - | - | - | - | 1 | - | 2 | - | - | - | - |
| Total reads | 16 | 25 | 102 | 150 | 27 | 268 | 261 | 276 | 328 | 328 | 807 | - | 69 | 77 | 529 | 394 | 103 | 178 | 197 | 111 |
| (B) | ||||||||||||||||||||
| Species | Laboratory | |||||||||||||||||||
| 01 | 02 | 03 | 04 | 06 | 07 | 08 | 14 | 15 | 20 | |||||||||||
| A | B | A | B | A | B | A | B | A | B | A | B | A | B | A | B | A | B | A | B | |
| Chicken | - | - | 13 | 28 | - | - | 42 | 30 | 4 | 98 | - | - | 2 | - | 10 | 177 | 2 | 10 | 8 | 5 |
| Horse | - | - | 7 | 6 | - | 2 | 57 | 51 | - | 2 | - | - | - | - | - | 1 | - | - | 7 | 5 |
| Turkey | - | - | 5 | 11 | - | 6 | 51 | 50 | 3 | 7 | 1 | - | - | 3 | 231 | 6 | 6 | 15 | 13 | 9 |
| Beef | 10 | 9 | 25 | 22 | 2 | 171 | 17 | 65 | 101 | 97 | 222 | - | 43 | 52 | 187 | 149 | 57 | 99 | 111 | 55 |
| Pig | 1 | 1 | 3 | 23 | 99 | 11 | 3 | 226 | 114 | 564 | - | 21 | 21 | 91 | 57 | 38 | 54 | 50 | 27 | |
| Sheep | 6 | 14 | 50 | 76 | 2 | 2 | 80 | 74 | 3 | 9 | 19 | - | 3 | 1 | 7 | 3 | - | - | 9 | 10 |
| Goat | 1 | 1 | - | 1 | - | - | 1 | 1 | 1 | 1 | 2 | - | - | - | - | 1 | - | - | - | 1 |
| Bison bonasus | - | - | - | - | - | - | - | - | - | - | - | - | - | - | - | 1 | - | - | - | - |
| Bos mutus | - | - | - | - | - | - | - | - | - | 1 | - | - | - | 1 | - | - | 1 | - | - | - |
| Brachypodium sylvaticum | - | - | - | - | - | - | - | - | 1 | - | - | - | - | - | - | - | - | - | - | - |
| Coregonus migratorius | - | - | - | - | - | - | - | - | 2 | - | - | - | - | - | - | - | - | - | - | - |
| Equus zebra | - | - | - | - | - | - | - | - | - | - | - | - | - | - | - | - | - | - | - | - |
| Eukaryotic synthetic | - | - | - | 15 | - | - | - | - | - | - | - | - | - | - | - | - | - | - | - | - |
| Homo sapiens | - | - | 58 | 46 | 30 | 188 | 82 | 215 | 302 | 784 | 1086 | - | 5 | 124 | 687 | 451 | - | 15 | - | 49 |
| Meleagris ocellata | - | - | - | - | - | - | - | 2 | - | - | - | - | - | - | 1 | - | - | - | - | - |
| Oncorhynchus environmental | - | - | - | - | - | - | - | - | 1 | 1 | - | - | - | - | - | - | - | - | - | - |
| Oncorhynchus mykiss | - | - | - | - | - | - | - | - | 37 | 91 | - | - | - | - | - | - | - | - | - | - |
| Ovis ammon | - | 1 | 1 | 5 | - | - | 2 | 1 | 1 | - | - | - | - | - | 4 | - | - | - | - | - |
| Ovis vignei | - | - | - | - | - | - | 1 | 1 | - | - | - | - | - | - | - | - | - | - | - | - |
| Phascolosoma esculenta | - | - | - | - | - | 1 | - | - | - | - | - | - | - | - | - | - | - | - | - | - |
| Synthetic construct | - | - | - | - | - | - | - | - | 20 | - | - | - | - | - | - | - | - | - | - | - |
| Zea mays | - | - | - | 2 | - | - | - | 3 | 851 | 3 | - | - | - | - | - | - | - | - | 2 | - |
| total reads | 17 | 26 | 160 | 215 | 57 | 469 | 344 | 496 | 1553 | 1208 | 1894 | - | 74 | 202 | 1218 | 846 | 104 | 193 | 200 | 161 |
Publisher’s Note: MDPI stays neutral with regard to jurisdictional claims in published maps and institutional affiliations. |
© 2022 by the authors. Licensee MDPI, Basel, Switzerland. This article is an open access article distributed under the terms and conditions of the Creative Commons Attribution (CC BY) license (https://creativecommons.org/licenses/by/4.0/).
Share and Cite
Dobrovolny, S.; Uhlig, S.; Frost, K.; Schlierf, A.; Nichani, K.; Simon, K.; Cichna-Markl, M.; Hochegger, R. Interlaboratory Validation of a DNA Metabarcoding Assay for Mammalian and Poultry Species to Detect Food Adulteration. Foods 2022, 11, 1108. https://doi.org/10.3390/foods11081108
Dobrovolny S, Uhlig S, Frost K, Schlierf A, Nichani K, Simon K, Cichna-Markl M, Hochegger R. Interlaboratory Validation of a DNA Metabarcoding Assay for Mammalian and Poultry Species to Detect Food Adulteration. Foods. 2022; 11(8):1108. https://doi.org/10.3390/foods11081108
Chicago/Turabian StyleDobrovolny, Stefanie, Steffen Uhlig, Kirstin Frost, Anja Schlierf, Kapil Nichani, Kirsten Simon, Margit Cichna-Markl, and Rupert Hochegger. 2022. "Interlaboratory Validation of a DNA Metabarcoding Assay for Mammalian and Poultry Species to Detect Food Adulteration" Foods 11, no. 8: 1108. https://doi.org/10.3390/foods11081108