
Effect of Load Spatial Configuration on the Heating of Chicken Meat Assisted by Radio Frequency at 40.68 MHz

 , , and
Abstract
:1. Introduction
2. Materials and Methods
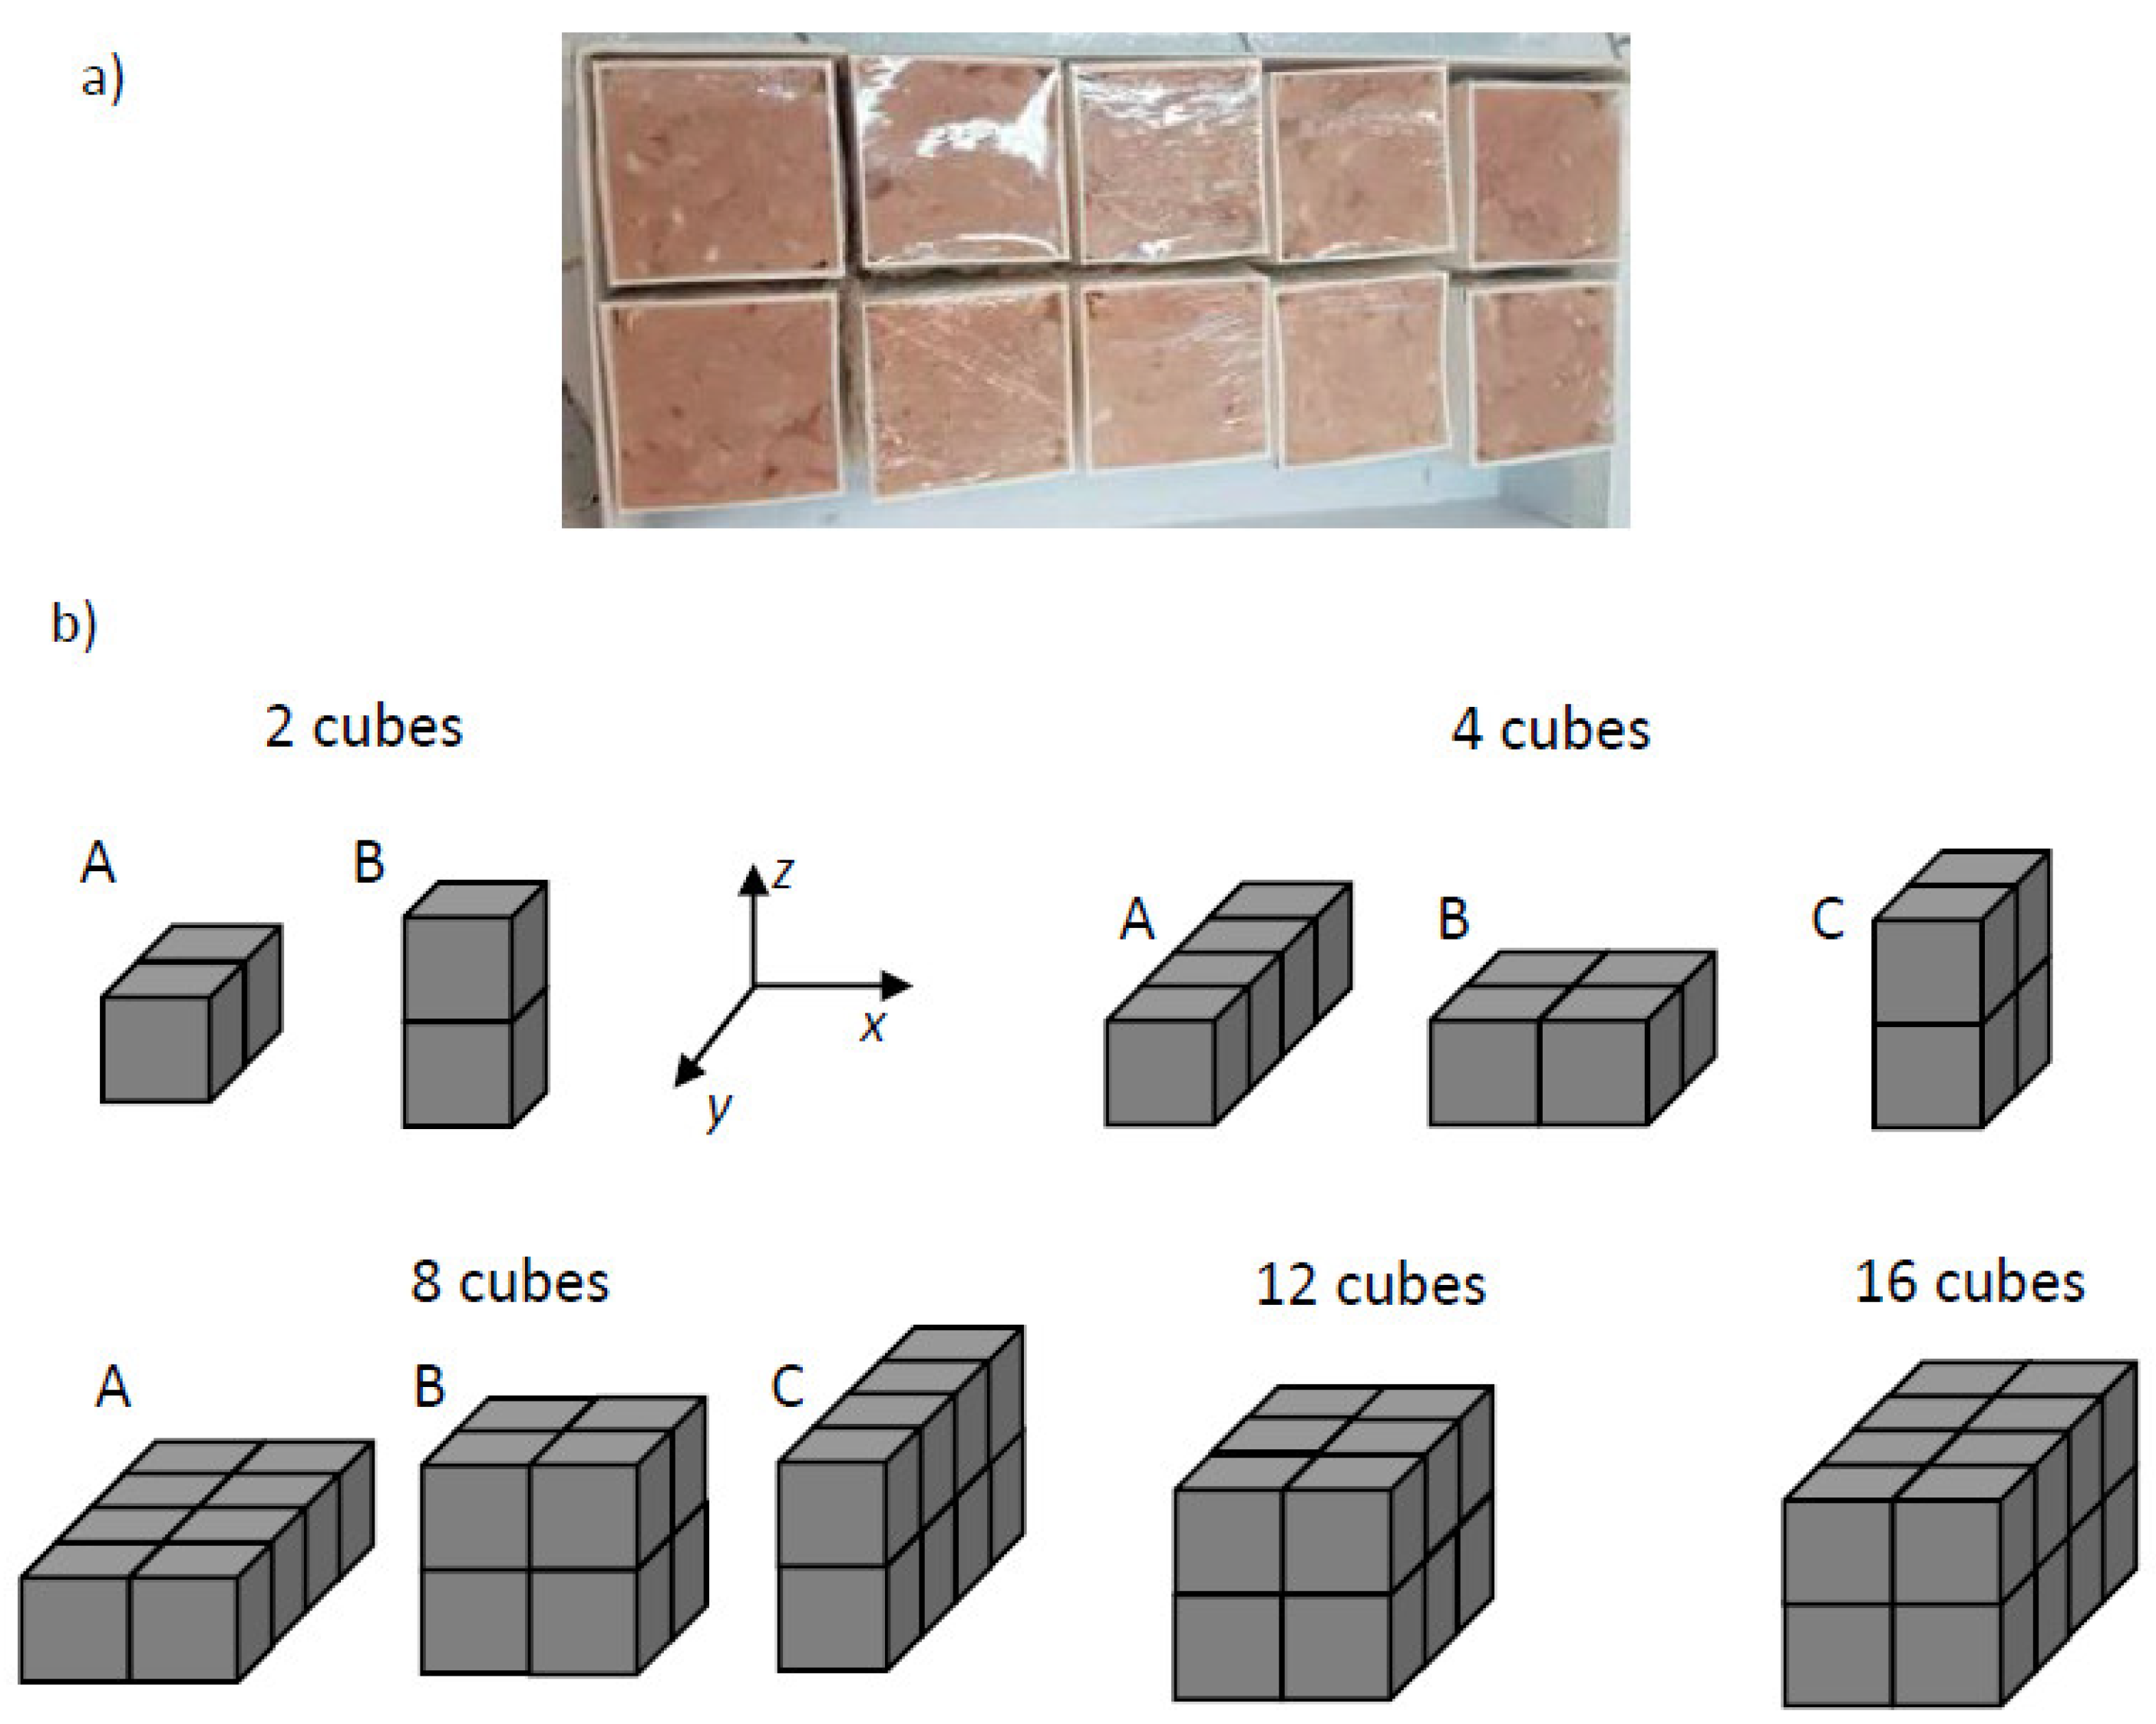
2.1. Food Samples
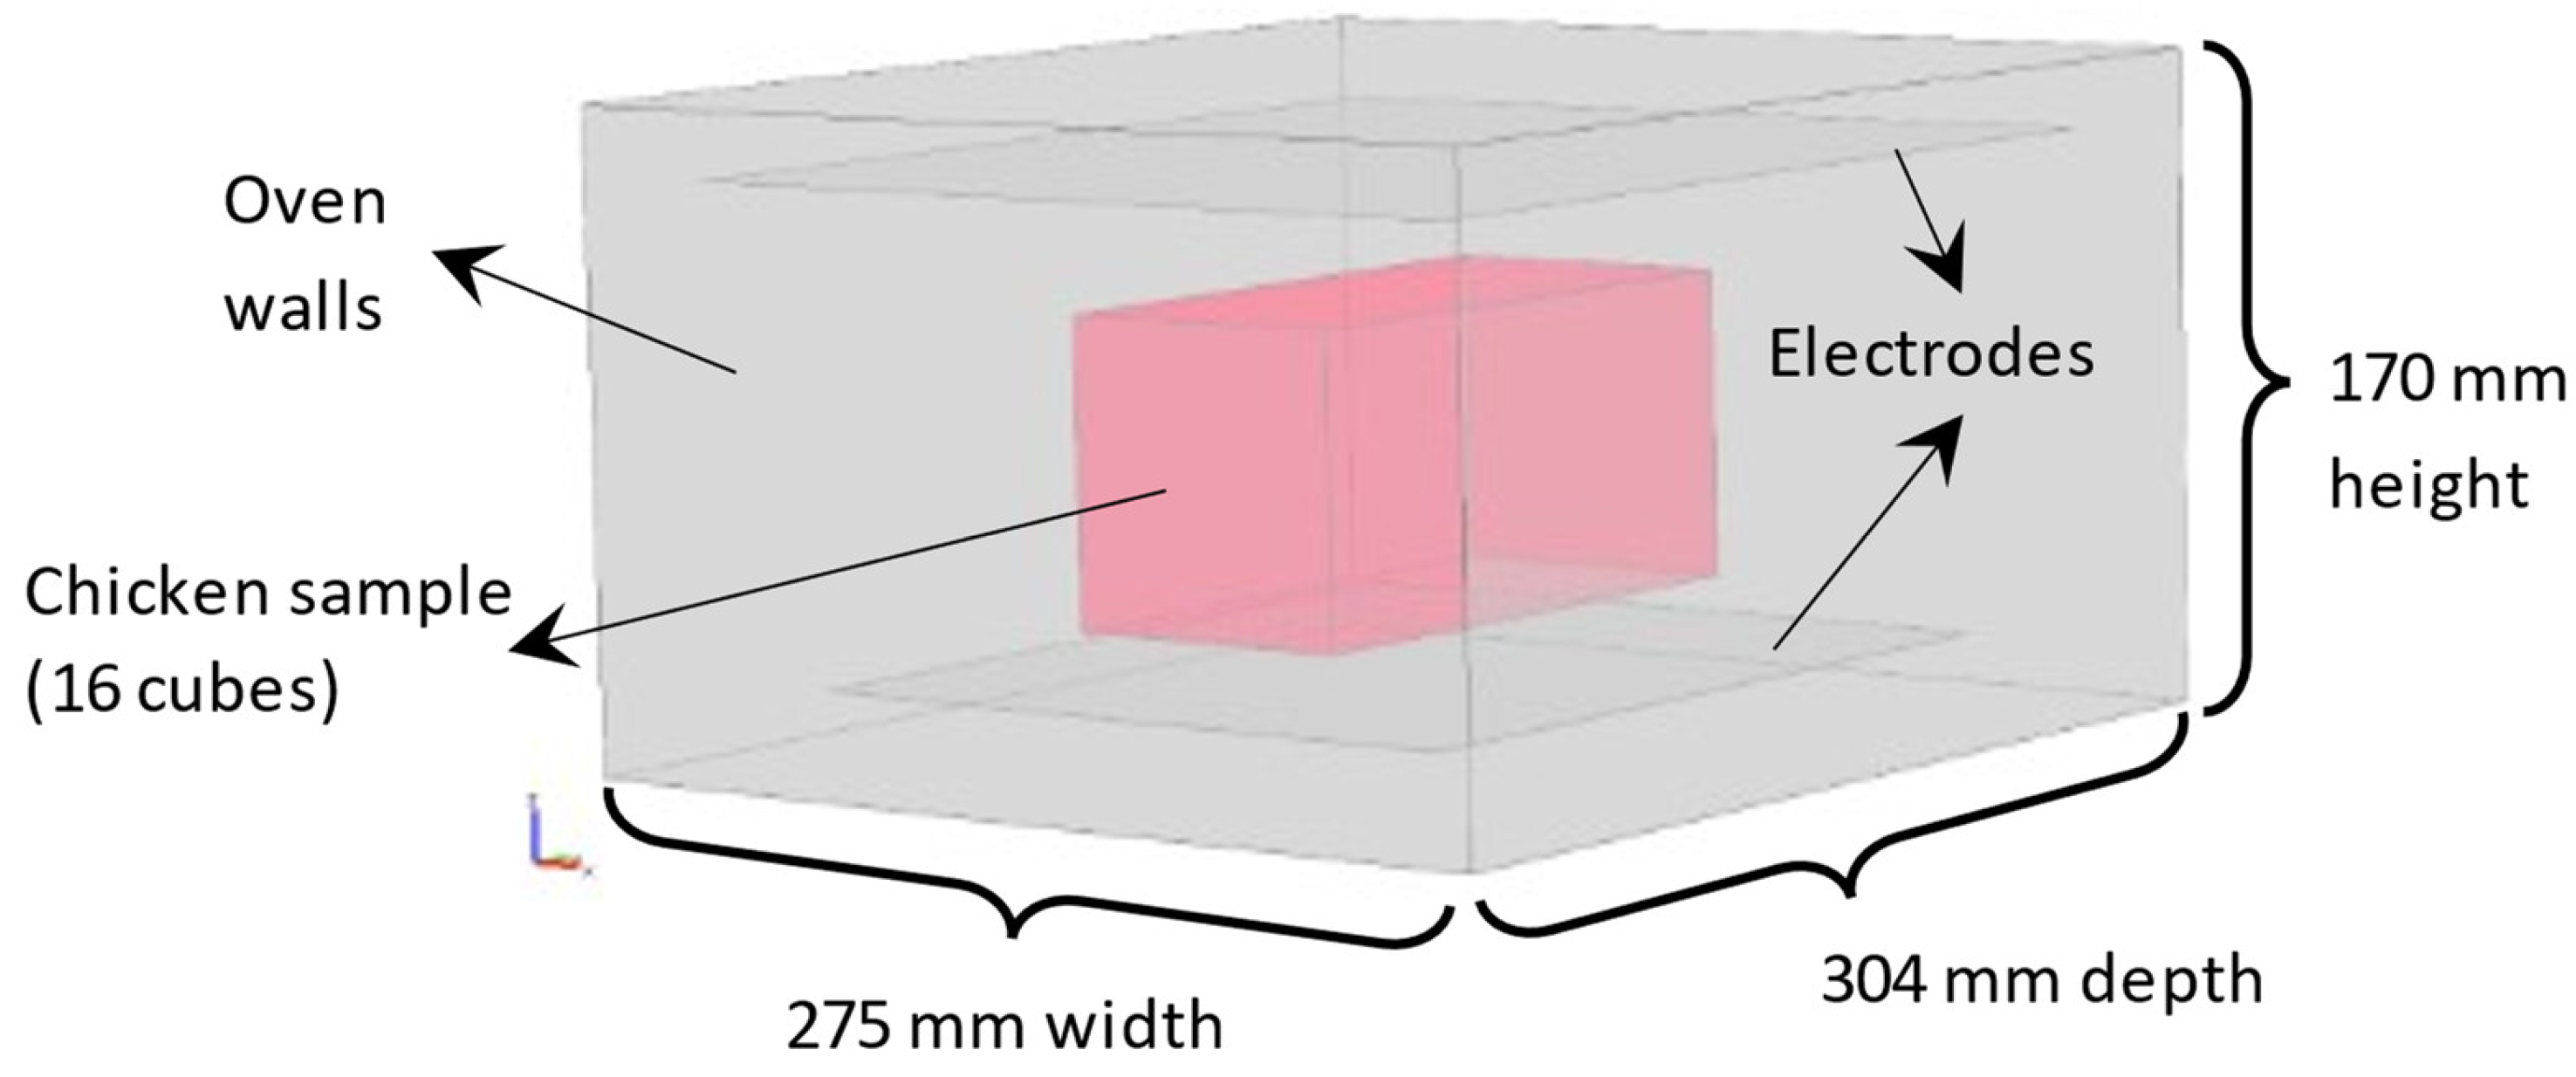
2.2. RF Oven
2.3. Heating Tests
2.4. RF Heating Model
2.4.1. Governing Equations
- -
- Bottom electrode was maintained at the ground condition (V = 0);
- -
- Top electrode was maintained at a constant potential V0 according with the applied output power (300 or 225 W) with a frequency of 40.68 MHz;
- -
- Oven walls were electrically insulated, .
2.4.2. Numerical Solution
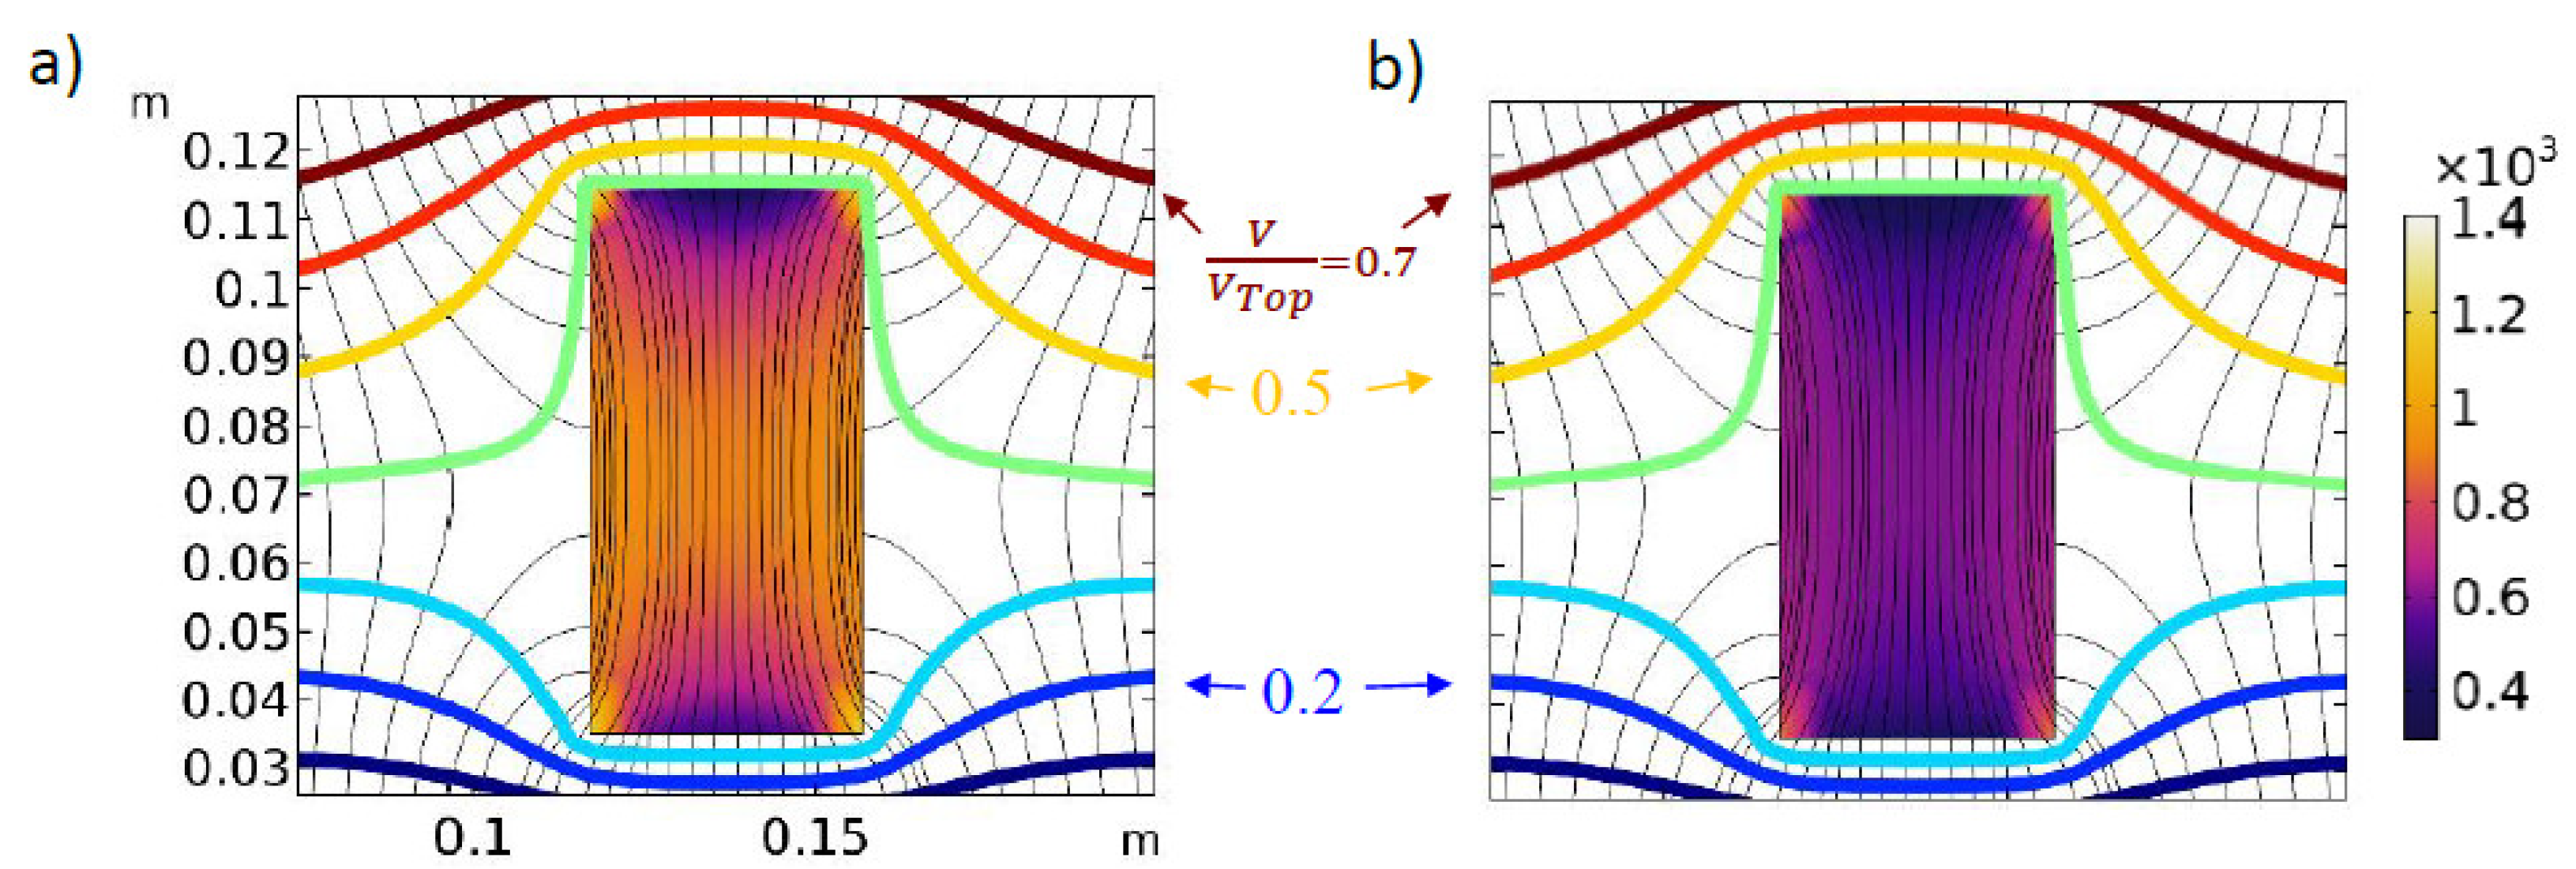
Simulated Variables
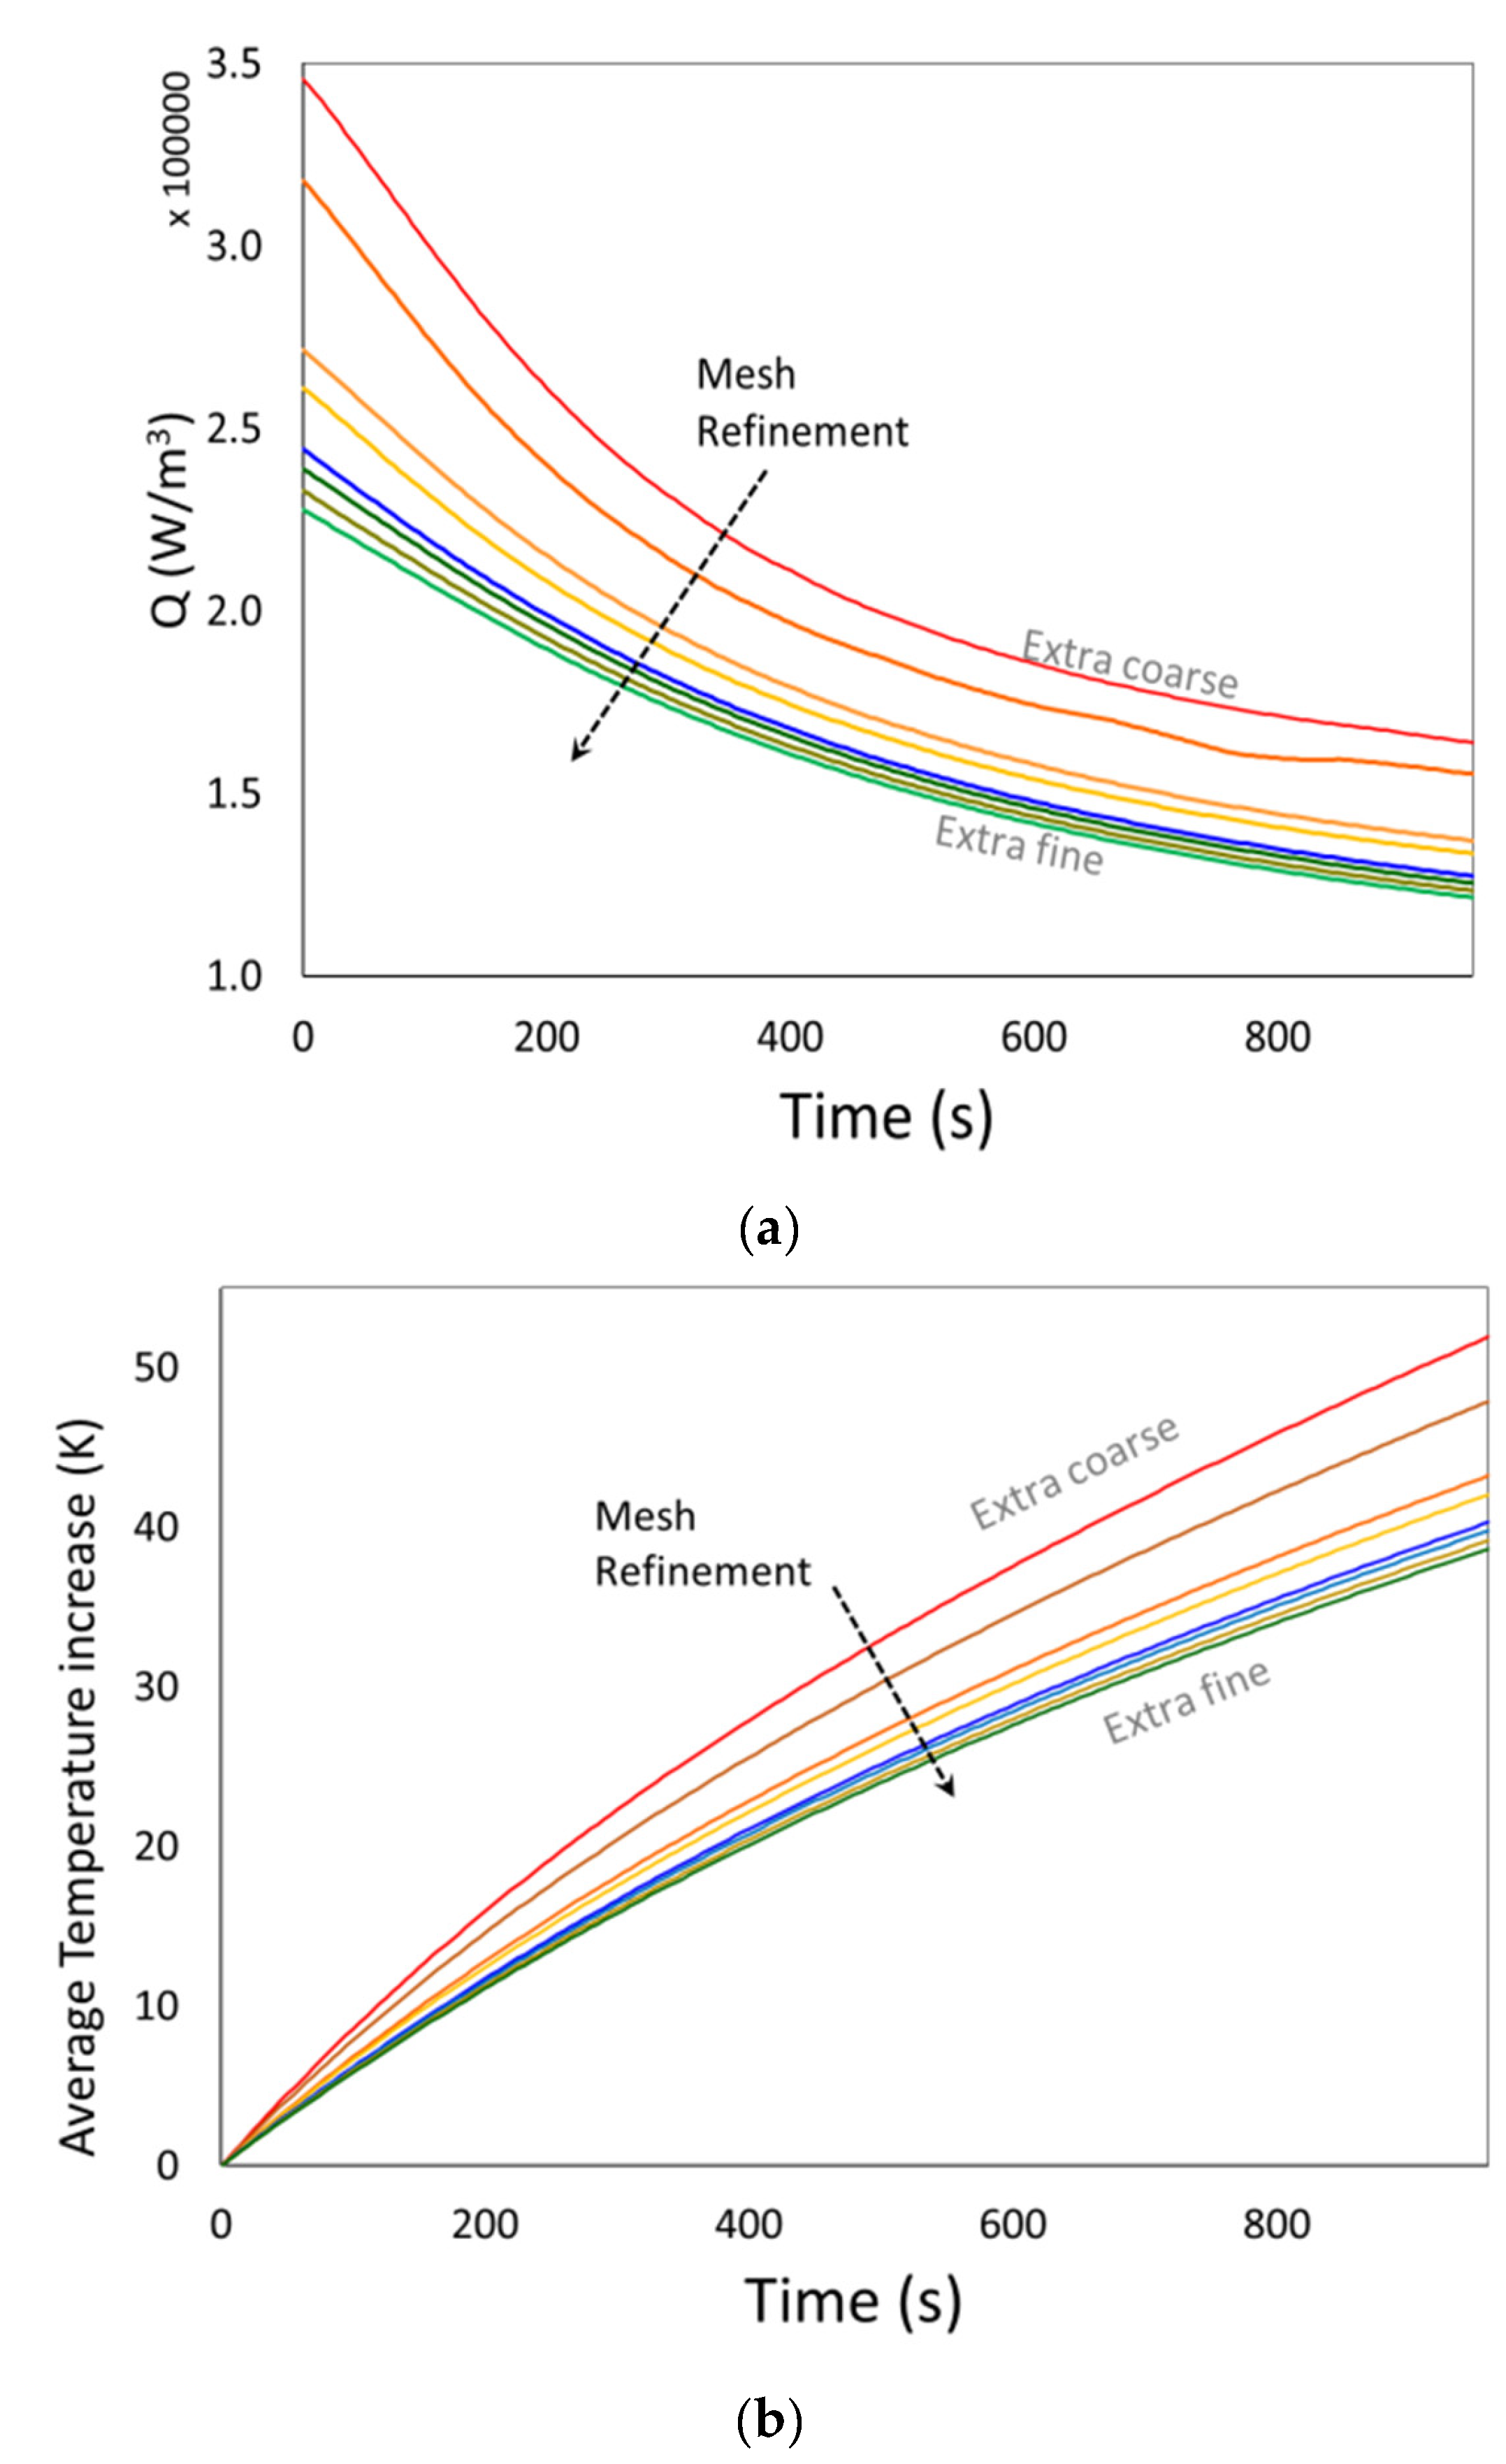
Mesh Independence Analysis
3. Results and Discussion
3.1. Heating Rate. Effect of Sample Mass and Spatial Configuration
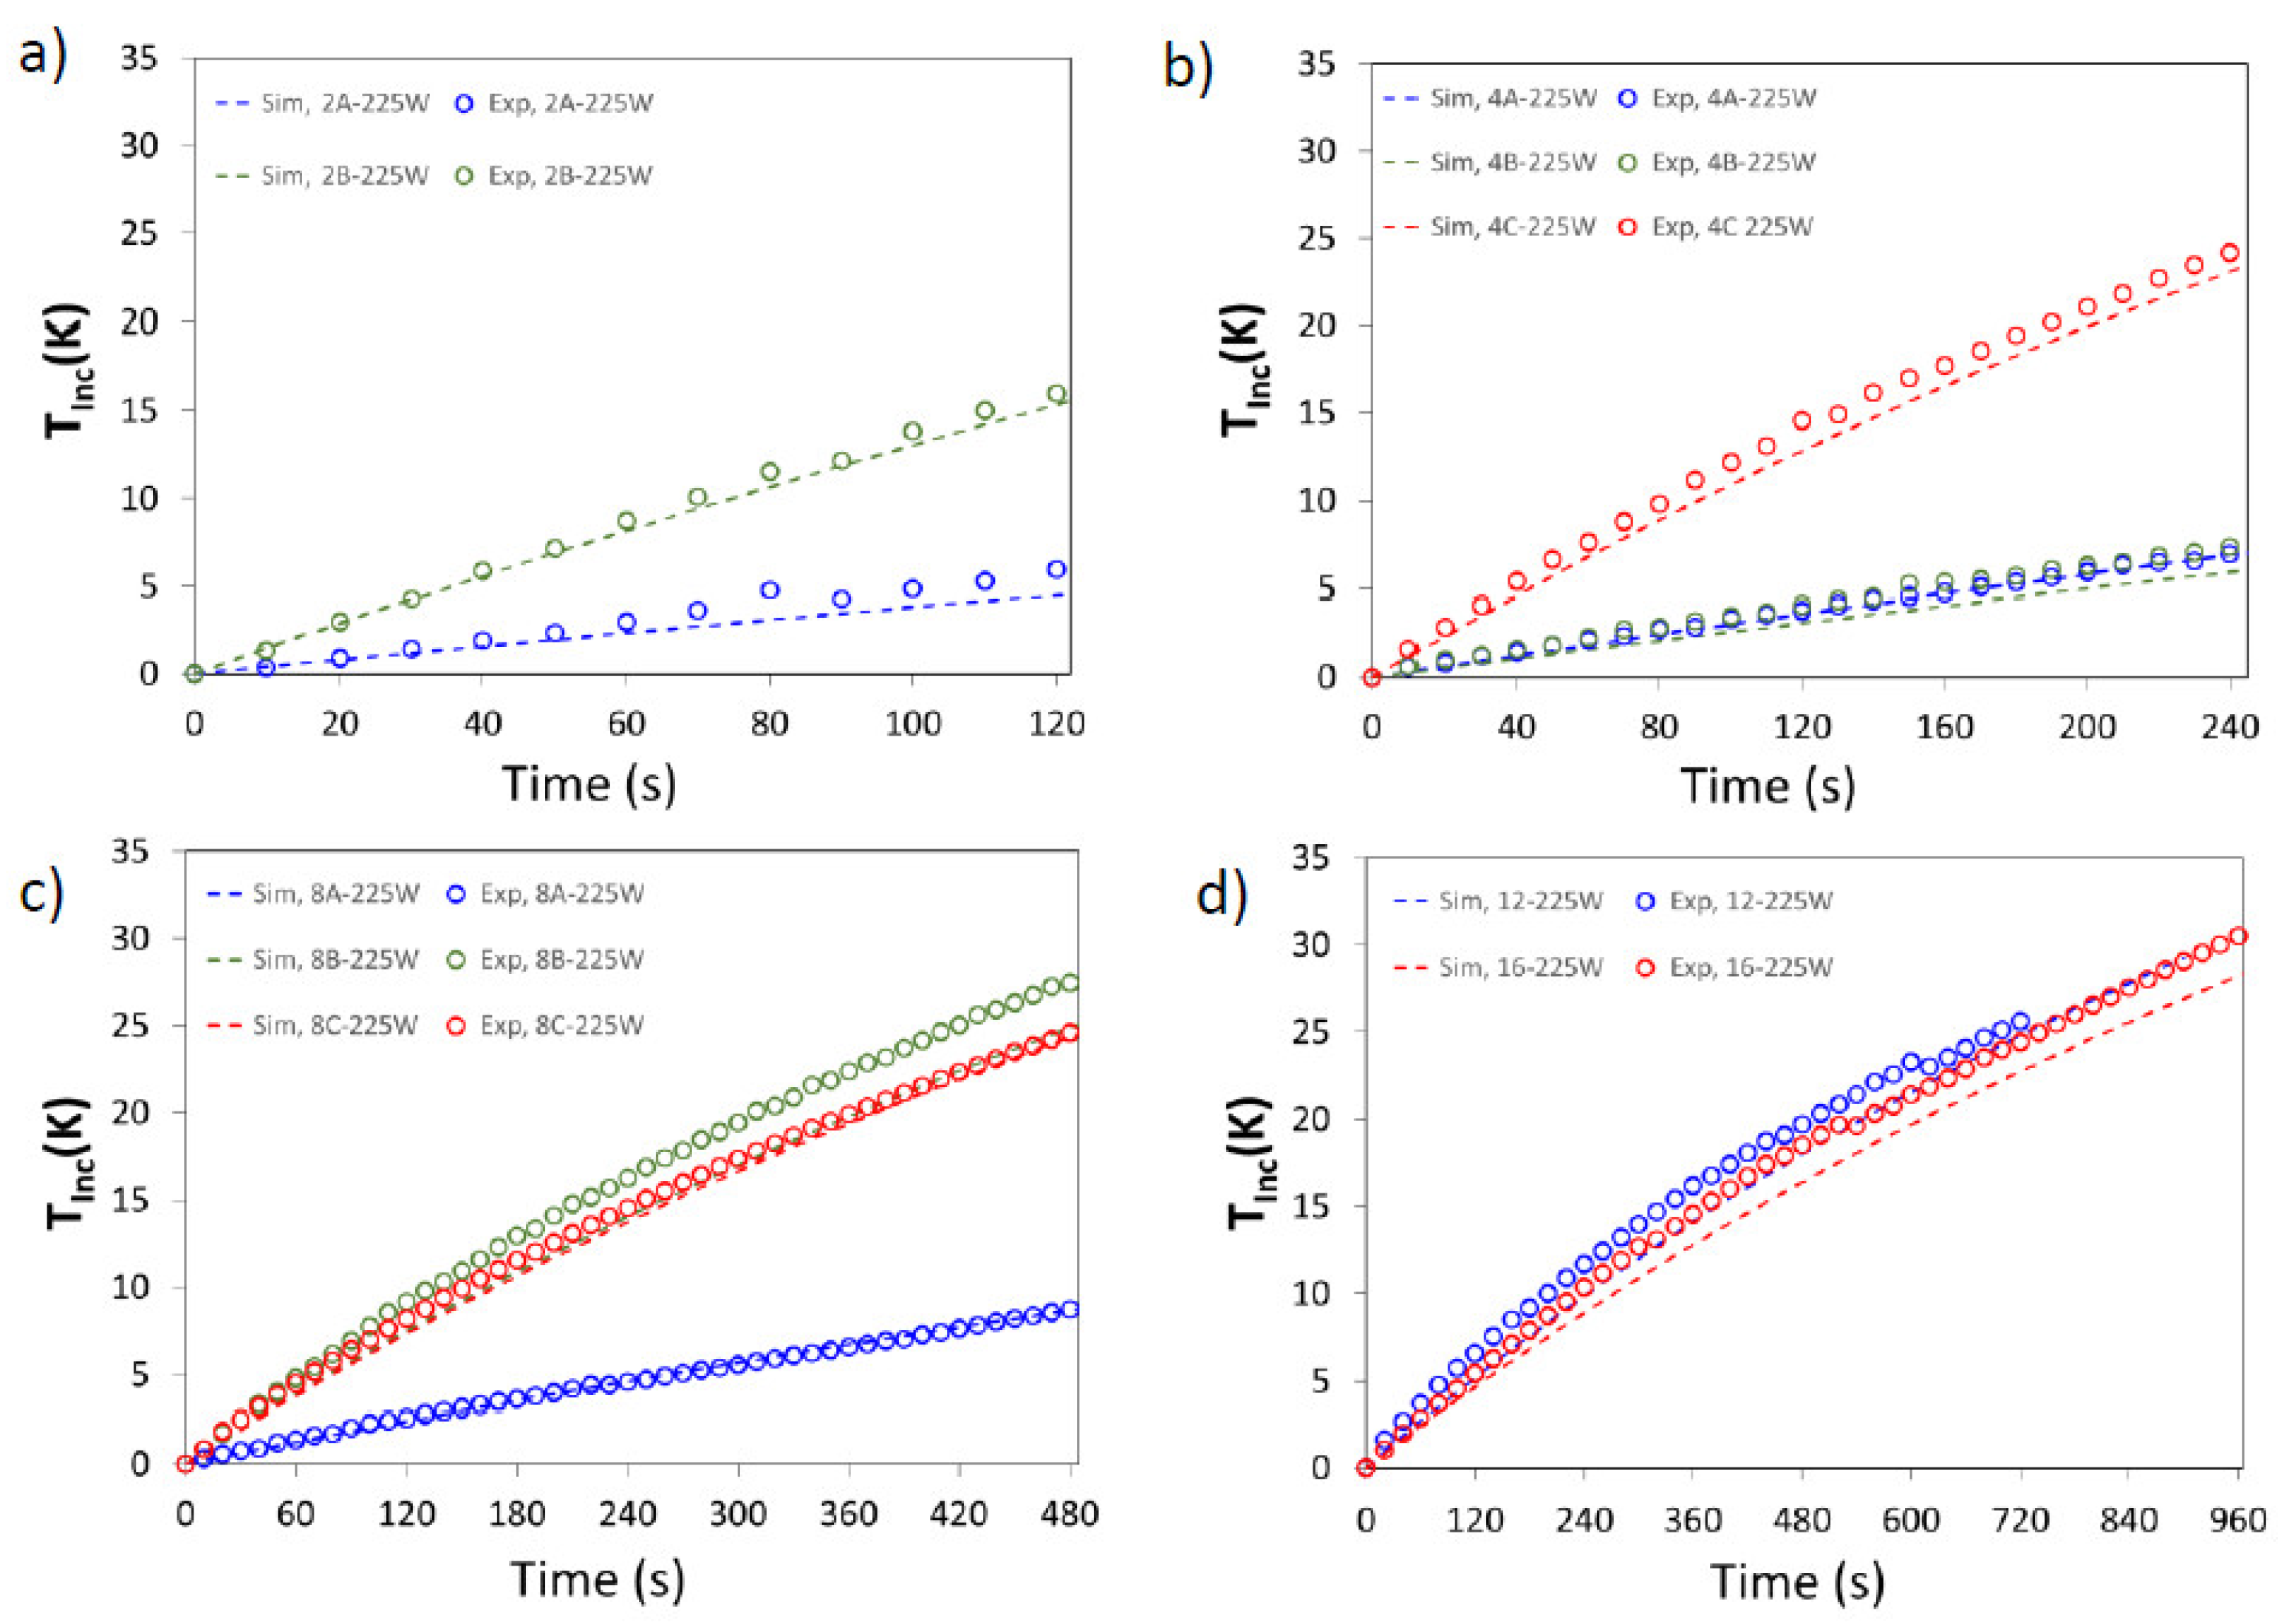
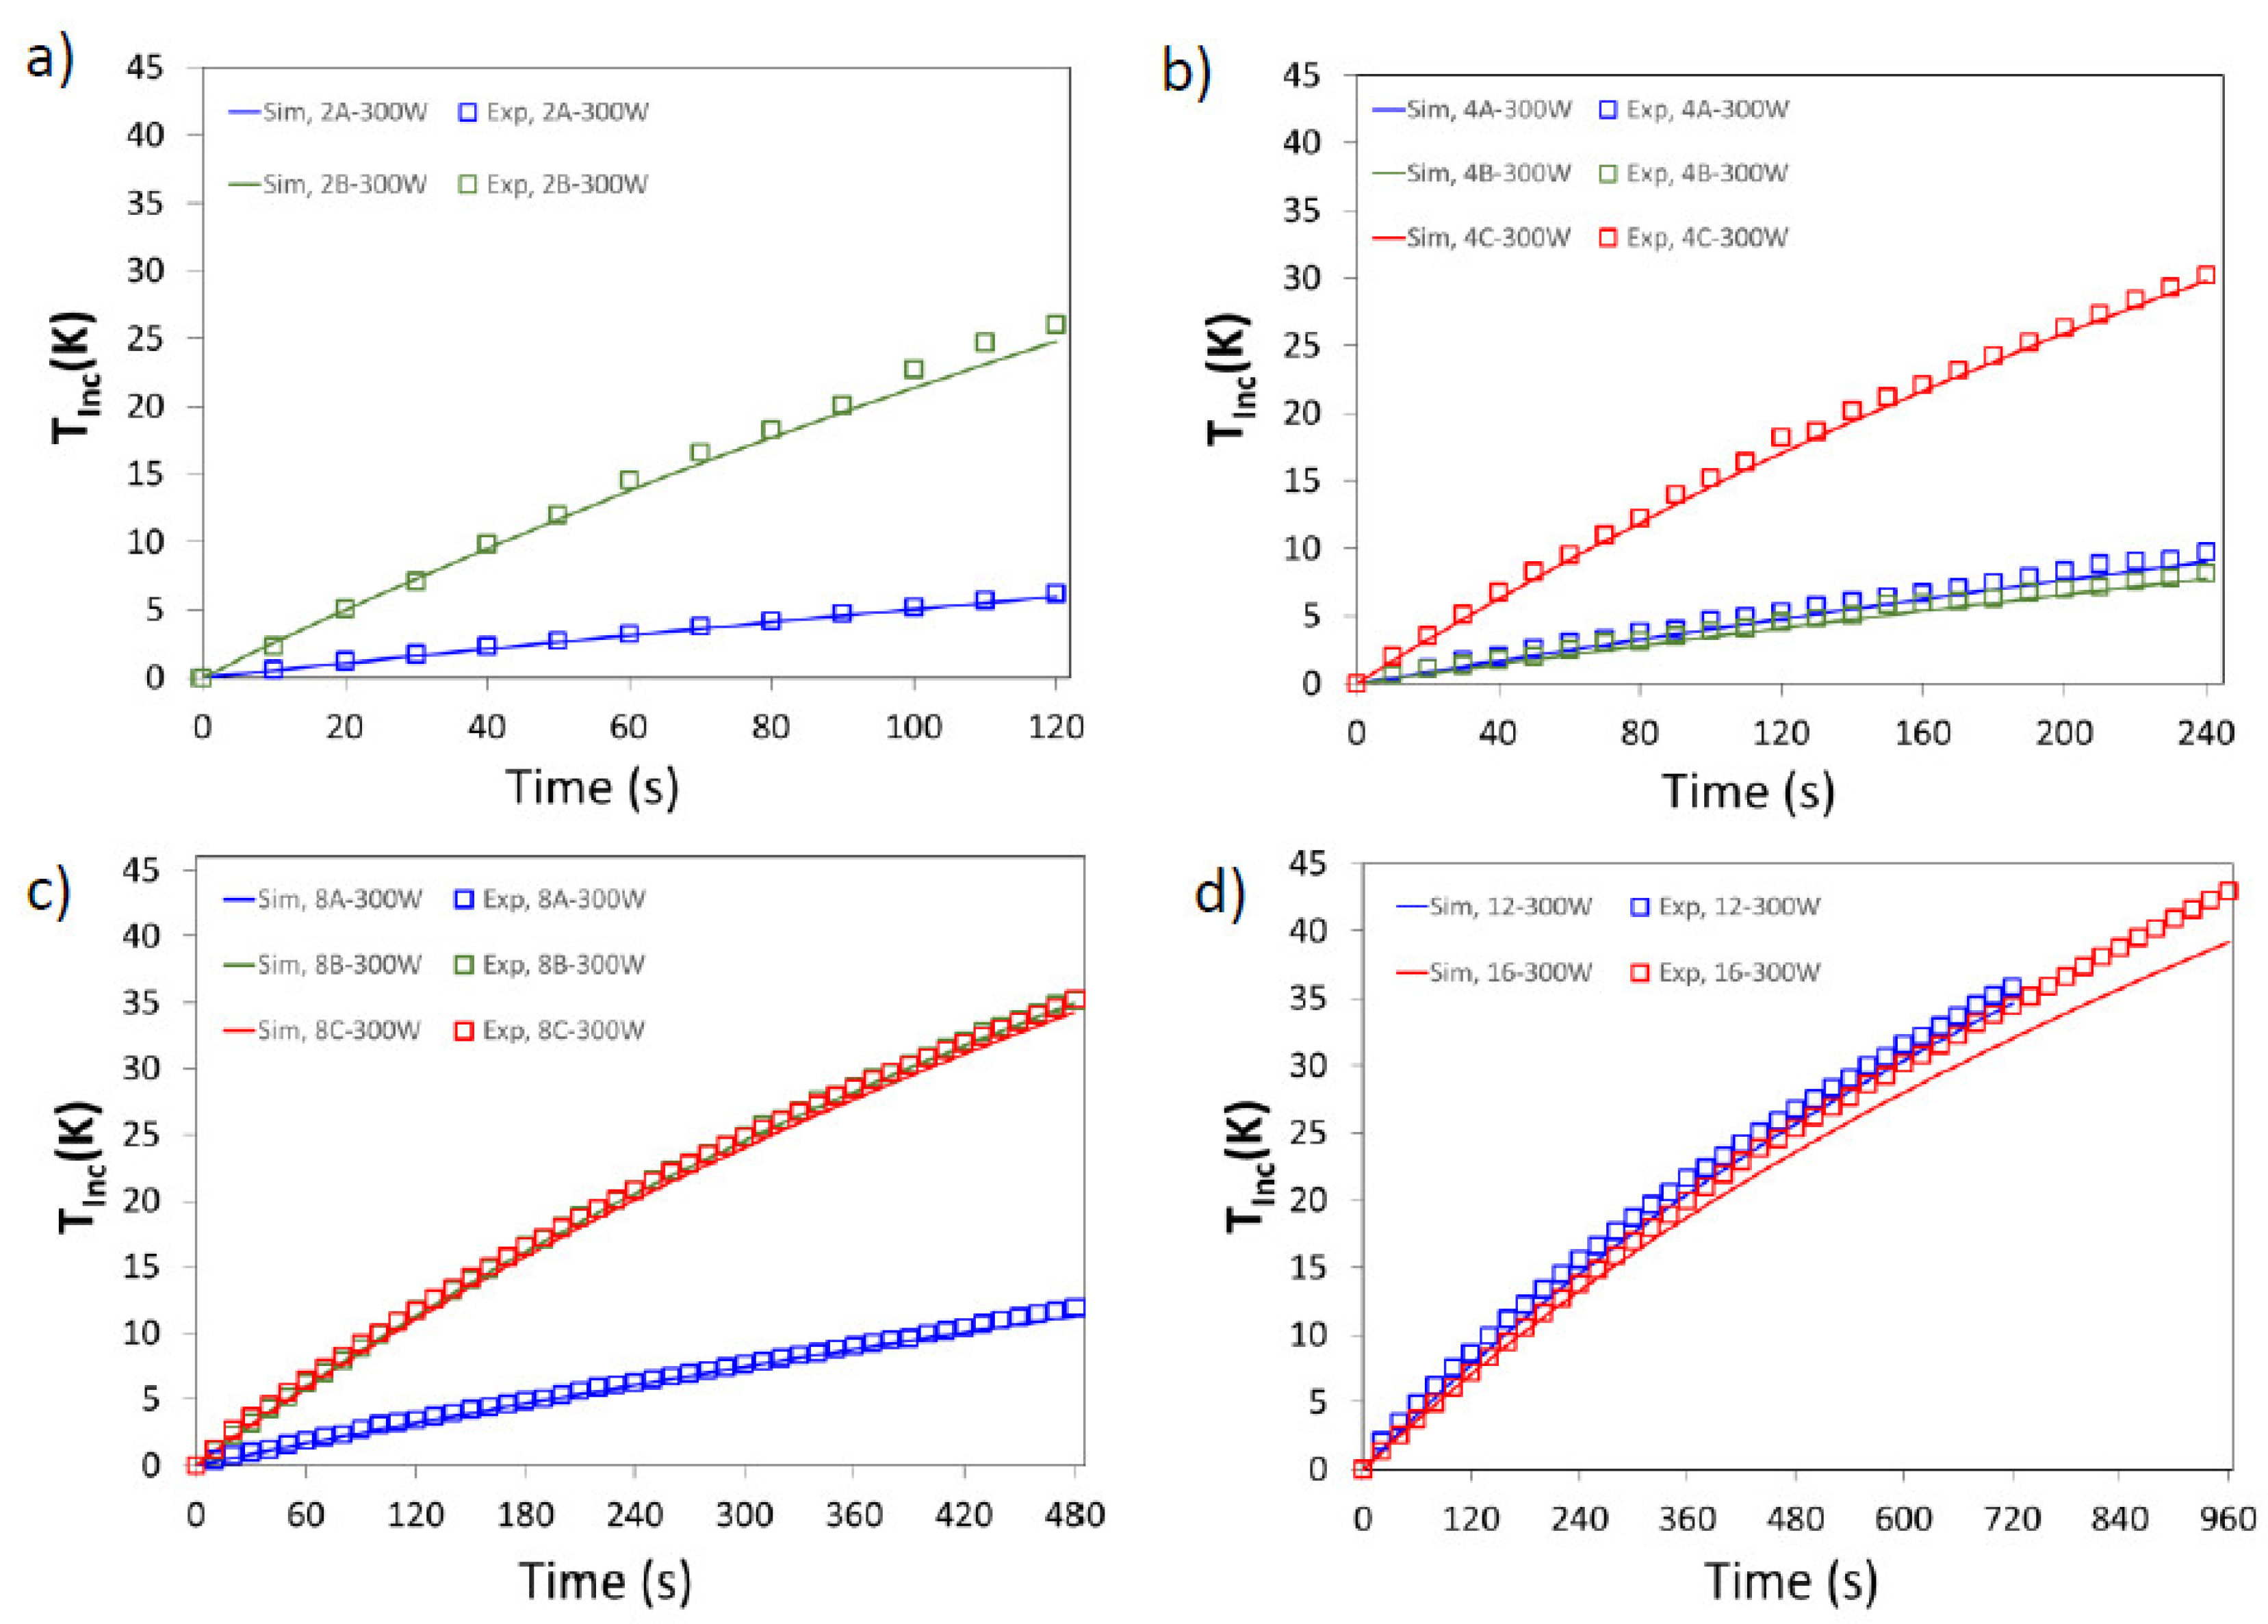
3.2. Model Validation
3.3. Energy Efficiency
4. Conclusions
Author Contributions
Funding
Data Availability Statement
Acknowledgments
Conflicts of Interest
References
- Marra, F.; Zhang, L.; Lyng, J. Radio frequency treatment of foods: Review of recent advances. J. Food Eng. 2009, 91, 497–508. [Google Scholar] [CrossRef]
- Guo, C.; Mujumdar, A.; Zhang, M. New development in radio frequency heating for fresh food processing: A review. Food Eng. Rev. 2019, 11, 29–43. [Google Scholar] [CrossRef]
- Uyar, R.; Erdogdu, F.; Marra, F. Effect of load volume on power absorption and temperature evolution during radio-frequency heating of meat cubes: A computational study. Food Bioprod. Process. 2014, 92, 243–251. [Google Scholar] [CrossRef]
- Uyar, R.; Erdogdu, F.; Sarghini, F.; Marra, F. Computer simulation of radio-frequency heating applied to block-shaped foods: Analysis on the role of geometrical parameters. Food Bioprod. Process. 2016, 98, 310–319. [Google Scholar] [CrossRef]
- Hou, L.; Johnson, J.A.; Wang, S. Radio frequency heating for postharvest control of pests in agricultural products: A review. Postharvest Biol. Technol. 2016, 113, 106–118. [Google Scholar] [CrossRef]
- Huang, Z.; Marra, F.; Wang, S. A novel strategy for improving radio frequency heating uniformity of dry food products using computational modeling. Innov. Food Sci. Emerg. Technol. 2016, 34, 100–111. [Google Scholar] [CrossRef]
- Xu, J.; Zhang, M.; Bhandari, B.; Kachele, R. ZnO nanoparticles combined radio frequency heating: A novel method to control microorganism and improve product quality of prepared carrots. Innov. Food Sci. Emerg. Technol. 2017, 44, 46–53. [Google Scholar] [CrossRef] [Green Version]
- Zhu, J.; Zhang, D.; Zhou, X.; Cui, Y.; Jiao, S.; Shi, X. Development of a pasteurization method based on radiofrequency heating to ensure microbiological safety of liquid egg. Food Control. 2019, 123, 107035. [Google Scholar] [CrossRef]
- Zhou, X.; Wang, S. Recent developments in radio frequency drying of food and agricultural products: A review. Dry. Technol. 2019, 37, 271–286. [Google Scholar] [CrossRef]
- Palazoğlu, T.K.; Miran, W. Experimental investigation of the effect of conveyor movement and sample’s vertical position on radio frequency tempering of frozen beef. J. Food Eng. 2018, 219, 71–80. [Google Scholar] [CrossRef]
- Bedane, T.F.; Chen, L.; Marra, F.; Wang, S. Experimental study of radio frequency (RF) thawing of foods with movement on conveyor belt. J. Food Eng. 2017, 201, 17–25. [Google Scholar] [CrossRef]
- Bedane, T.F.; Altin, O.; Erol, B.; Marra, F.; Erdogdu, F. Thawing of frozen food products in a staggered through-field electrode radio frequency system: A case study for frozen chicken breast meat with effects on drip loss and texture. Innov. Food Sci. Emerg. Technol. 2018, 50, 139–147. [Google Scholar] [CrossRef]
- Llave, Y.; Liu, S.; Fukuoka, M.; Sakai, N. Computer simulation of radiofrequency defrosting of frozen foods. J. Food Eng. 2015, 152, 32–42. [Google Scholar] [CrossRef]
- Laycock, L.; Piyasena, P.; Mittal, G.S. Radio frequency cooking of ground, comminuted and muscle meat products. Meat Sci. 2003, 65, 959–965. [Google Scholar] [CrossRef]
- Kirmaci, B.; Singh, R.K. Quality of chicken breast meat cooked in a pilot-scale radio frequency oven. Innov. Food Sci. Emerg. Technol. 2012, 14, 77–84. [Google Scholar] [CrossRef]
- Muñoz, I.; Serra, X.; Guàrdia, M.D.; Fartdinov, D.; Arnau, J.; Picouet, P.A.; Gou, P. Radio frequency cooking of pork hams followed with conventional steam cooking. LWT 2020, 123, 109104. [Google Scholar] [CrossRef]
- Wang, X.; Wang, L.; Yang, K.; Wu, D.; Ma, J.; Wang, S.; Zhang, Y.; Sun, W. Radio frequency heating improves water retention of pork myofibrillar protein gel: An analysis from water distribution and structure. Food Chem. 2021, 350, 129265. [Google Scholar] [CrossRef]
- Huang, Z.; Marra, F.; Subbiah, J.; Wang, S. Computer simulation for improving radio frequency (RF) heating uniformity of food products: A review. Crit. Rev. Food Sci. Nutr. 2018, 58, 1033–1057. [Google Scholar] [CrossRef]
- Marra, F.; Lyng, J.; Romano, V.; McKenna, B. Radio-frequency heating of foodstuff: Solution and validation of a mathematical model. J. Food Eng. 2007, 79, 998–1006. [Google Scholar] [CrossRef]
- Tiwari, G.; Wang, S.; Tang, J.; Birla, S.L. Analysis of radio frequency (RF) power distribution in dry food materials. J. Food Eng. 2011, 104, 548–556. [Google Scholar] [CrossRef]
- Romano, V.; Marra, F. A numerical analysis of radio frequency heating of regular shaped foodstuff. J. Food Eng. 2008, 84, 449–457. [Google Scholar] [CrossRef]
- Li, F.; Zhu, Y.L.; Li, S.; Wang, P.Z.; Zhang, R.Y.; Tang, J.M.; Koral, T.; Jiao, Y. A strategy for improving the uniformity of radio frequency tempering for frozen beef with cuboid and step shapes. Food Contr. 2021, 123, 107719. [Google Scholar] [CrossRef]
- Bedane, T.F.; Erdogdu, F.; Lyng, J.G.; Marra, F. Effects of geometry and orientation of food products on heating uniformity during radio frequency heating. Food Bioprod. Processing 2021, 125, 149–160. [Google Scholar] [CrossRef]
- Tiwari, G.; Wang, S.; Tang, J.; Birla, S.L. Computer simulation model development and validation for radio frequency (RF) heating of dry food materials. J. Food Eng. 2011, 105, 48–55. [Google Scholar] [CrossRef]
- Fahmy, T. Dielectric Relaxation Spectroscopy of Poly (Vinyl Chloride-co-Vinyl Acetate-co-2-Hydroxypropyl Acrylate)/Poly (Acrylonitrile-Butadiene-Styrene) Polymer Blend. Polym.-Plast. Technol. Eng. 2007, 46, 7–18. [Google Scholar] [CrossRef]
- Della Valle, M. Analysis of Chicken Meat Heating: Product Characterization and RF Assisted Processing. Master’s Thesis, University of Salerno, Fisciano, Italy, 2018. [Google Scholar]
- COMSOL Multiphysics®. COMSOL AB: Stockholm, Sweden. 2021. Available online: www.comsol.com (accessed on 1 November 2021).
- Chen, L.; Wang, K.; Li, W.; Wang, S. A strategy to simulate radio frequency heating under mixing conditions. Comput. Electron. Agr. 2015, 118, 100–110. [Google Scholar] [CrossRef]
- Choi, Y.; Okos, M.R. Effects of temperature and composition on the thermal properties of foods. In Food Engineering and Process Applications; Elsevier Applied Science Publishers: London, UK, 1986; Volume 1, pp. 93–101. [Google Scholar]
- Chmiel, M.; Roszko, M.; Adamczak, L.; Florowski, T.; Pietrzak, D. Influence of storage and packaging method on chicken breast meat chemical composition and fat oxidation. Poult. Sci. 2019, 98, 2679–2690. [Google Scholar] [CrossRef]
- Zhuang, H.; Nelson, S.O.; Trabelsi, S.; Savage, E.M. Dielectric properties of uncooked chicken breast muscles from ten to one thousand eight hundred Megahertz. Poult. Sci. 2007, 86, 2433–2440. [Google Scholar] [CrossRef]
- Chen, J.; Lau, S.K.; Chen, L.; Wang, K.; Li, W.; Wang, S.; Subbiah, J. Modeling radio frequency heating of food moving on a conveyor belt. Food Bioprod. Process. 2017, 102, 307–319. [Google Scholar] [CrossRef] [Green Version]
- Goñi, S.M.; Salvadori, V.O. Energy consumption estimation during oven cooking of food. In Energy Consumption: Impacts of Human Activity, Current and Future Challenges, Environmental and Ecological Effects; Reiter, S., Ed.; Nova Publishers: New York, NY, USA, 2014; pp. 99–116. [Google Scholar]
- Paton, J.; Khatir, Z.; Thompson, H.; Kapur, N.; Toropov, V. Thermal energy management in the bread baking industry using a system modelling approach. Appl. Therm. Eng. 2013, 53, 340–347. [Google Scholar] [CrossRef]
- Ureta, M.M.; Goñi, S.M.; Salvadori, V.O.; Olivera, D.F. Energy requirements during sponge cake baking: Experimental and simulated approach. Appl. Therm. Eng. 2017, 115, 637–643. [Google Scholar] [CrossRef]


| Sample Code | Spatial Configuration (N Cubes per Width) × (N of Cubes per Length) × (N of Cubes along the Height) | Sample Size (Width × Length × Height) (cm) | Projected Area (cm2) | Mass (kg) | Heating Time th (min) |
|---|---|---|---|---|---|
| 2A | 1 × 2 × 1 | 4 × 8 × 4 | 32 | 0.12 | 2 |
| 2B | 1 × 1 × 2 | 4 × 4 × 8 | 16 | 0.12 | 2 |
| 4A | 1 × 4 × 1 | 4 × 16 × 4 | 64 | 0.24 | 4 |
| 4B | 2 × 2 × 1 | 8 × 8 × 4 | 64 | 0.24 | 4 |
| 4C | 1 × 2 × 2 | 4 × 8 × 8 | 32 | 0.24 | 4 |
| 8A | 2 × 4 × 1 | 8 × 16 × 4 | 128 | 0.48 | 8 |
| 8B | 2 × 2 × 2 | 8 × 8 × 8 | 64 | 0.48 | 8 |
| 8C | 1 × 4 × 2 | 4 × 16 × 8 | 64 | 0.48 | 8 |
| 12 | 2 × 3 × 2 | 8 × 12 × 8 | 96 | 0.72 | 12 |
| 16 | 2 × 4 × 2 | 8 × 16 × 8 | 128 | 0.96 | 16 |
| Mesh Refinement | N° of Elements | Final Average Values | Simulation Time (s) | |
|---|---|---|---|---|
| Extremely coarse | 240 | 51.9 | 163,930 | 23 |
| Extra coarse | 597 | 47.9 | 155,420 | 24 |
| Coarser | 1442 | 43.2 | 137,150 | 33 |
| Coarse | 2521 | 42.1 | 133,630 | 43 |
| Normal | 7912 | 40.3 | 127,470 | 108 |
| Fine | 14258 | 39.8 | 125,470 | 179 |
| Finer | 48326 | 39.2 | 123,390 | 593 |
| Extra fine | 187631 | 38.7 | 121,560 | 2735 |
| Sample Code | Heating Rate HR (K s−1) | |
|---|---|---|
| 225 W | 300 W | |
| 2A | 0.045 | 0.052 |
| 2B | 0.133 | 0.217 |
| 4A | 0.029 | 0.041 |
| 4B | 0.031 | 0.034 |
| 4C | 0.101 | 0.126 |
| 8A | 0.018 | 0.025 |
| 8B | 0.057 | 0.073 |
| 8C | 0.051 | 0.073 |
| 12 | 0.036 | 0.050 |
| 16 | 0.032 | 0.049 |
| Sample Code | 225 W Power | 300 W Power | ||
|---|---|---|---|---|
| AARD (%) | AAD (K) | AARD (%) | AAD (K) | |
| 2A | 0.25 | 0.70 | 0.05 | 0.15 |
| 2B | 0.14 | 0.41 | 0.21 | 0.63 |
| 4A | 0.06 | 0.18 | 0.19 | 0.53 |
| 4B | 0.33 | 0.94 | 0.14 | 0.40 |
| 4C | 0.35 | 1.03 | 0.17 | 0.51 |
| 8A | 0.04 | 0.11 | 0.09 | 0.27 |
| 8B | 0.67 | 1.98 | 0.11 | 0.33 |
| 8C | 0.23 | 0.66 | 0.25 | 0.74 |
| 12 | 0.51 | 1.50 | 0.34 | 1.03 |
| 16 | 0.53 | 1.58 | 0.54 | 1.66 |
| Average | 0.31 | 0.91 | 0.21 | 0.63 |
| Sample Code | TInc,exp (K) 225 W | TInc,sim (K) 225 W | TInc,exp (K) 300 W | TInc,sim (K) 300 W |
|---|---|---|---|---|
| 2A | 5.99 | 4.49 | 6.22 | 5.96 |
| 2B | 16.01 | 15.35 | 26.02 | 24.78 |
| 4A | 6.96 | 6.86 | 9.75 | 9.02 |
| 4B | 7.36 | 5.91 | 8.18 | 7.76 |
| 4C | 24.17 | 23.10 | 30.21 | 29.78 |
| 8A | 8.72 | 8.68 | 11.95 | 11.28 |
| 8B | 27.46 | 24.87 | 35.16 | 34.95 |
| 8C | 24.58 | 24.37 | 35.11 | 34.24 |
| 12 | 25.60 | 24.80 | 35.81 | 34.63 |
| 16 | 30.52 | 28.23 | 42.99 | 39.16 |
| Sample Code | TU,exp (K) 225 W | TU,sim (K) 225 W | TU,exp (K) 300 W | TU,sim (K) 300W |
|---|---|---|---|---|
| 2A | 1.5 | 1.9 | 2.0 | 2.1 |
| 2B | 3.7 | 3.5 | 5.7 | 4.9 |
| 4A | 3.5 | 2.5 | 3.5 | 2.8 |
| 4B | 3.4 | 2.7 | 3.9 | 3.0 |
| 4C | 5.5 | 5.4 | 6.3 | 6.2 |
| 8A | 4.1 | 3.6 | 4.5 | 4.0 |
| 8B | 6.4 | 5.8 | 7.6 | 7.5 |
| 8C | 6.2 | 5.9 | 7.3 | 7.3 |
| 12 | 6.6 | 6.0 | 7.9 | 7.6 |
| 16 | 6.9 | 6.6 | 7.9 | 8.3 |
| Sample Code | Nominal Supplied Energy, th × NP (kJ) | Absorbed Energy (kJ) | Efficiency (%) | ||
|---|---|---|---|---|---|
| QExp | QSim | ηExp | ηSim | ||
| 225 W power | |||||
| 2A | 27 | 2.8 | 2.2 | 10.3% | 8.1% |
| 2B | 27 | 7.5 | 7.5 | 27.6% | 27.6% |
| 4A | 54 | 6.5 | 6.7 | 12.0% | 12.4% |
| 4B | 54 | 6.9 | 5.7 | 12.7% | 10.6% |
| 4C | 54 | 22.5 | 22.4 | 41.7% | 41.5% |
| 8A | 108 | 16.3 | 16.9 | 15.1% | 15.6% |
| 8B | 108 | 51.2 | 48.3 | 47.4% | 44.7% |
| 8C | 108 | 45.8 | 47.3 | 42.4% | 43.8% |
| 12 | 162 | 71.6 | 72.2 | 44.2% | 44.6% |
| 16 | 216 | 113.8 | 109.6 | 52.7% | 50.7% |
| 300 W power | |||||
| 2A | 36 | 2.9 | 2.9 | 8.1% | 8.1% |
| 2B | 36 | 12.1 | 12 | 33.7% | 33.3% |
| 4A | 72 | 9.1 | 8.8 | 12.6% | 12.2% |
| 4B | 72 | 7.6 | 7.5 | 10.6% | 10.4% |
| 4C | 72 | 28.2 | 28.9 | 39.1% | 40.1% |
| 8A | 144 | 22.3 | 21.9 | 15.5% | 15.2% |
| 8B | 144 | 65.6 | 67.8 | 45.5% | 47.1% |
| 8C | 144 | 65.5 | 66.4 | 45.5% | 46.1% |
| 12 | 216 | 100.2 | 100.8 | 46.4% | 46.7% |
| 16 | 288 | 160.3 | 151.9 | 55.7% | 52.7% |
Publisher’s Note: MDPI stays neutral with regard to jurisdictional claims in published maps and institutional affiliations. |
© 2022 by the authors. Licensee MDPI, Basel, Switzerland. This article is an open access article distributed under the terms and conditions of the Creative Commons Attribution (CC BY) license (https://creativecommons.org/licenses/by/4.0/).
Share and Cite
Goñi, S.M.; d’Amore, M.; Della Valle, M.; Olivera, D.F.; Salvadori, V.O.; Marra, F. Effect of Load Spatial Configuration on the Heating of Chicken Meat Assisted by Radio Frequency at 40.68 MHz. Foods 2022, 11, 1096. https://doi.org/10.3390/foods11081096
Goñi SM, d’Amore M, Della Valle M, Olivera DF, Salvadori VO, Marra F. Effect of Load Spatial Configuration on the Heating of Chicken Meat Assisted by Radio Frequency at 40.68 MHz. Foods. 2022; 11(8):1096. https://doi.org/10.3390/foods11081096
Chicago/Turabian StyleGoñi, Sandro M., Matteo d’Amore, Marta Della Valle, Daniela F. Olivera, Viviana O. Salvadori, and Francesco Marra. 2022. "Effect of Load Spatial Configuration on the Heating of Chicken Meat Assisted by Radio Frequency at 40.68 MHz" Foods 11, no. 8: 1096. https://doi.org/10.3390/foods11081096