
Refractometric Detection of Adulterated Milk Based on Multimode Interference Effects

 , and
, and 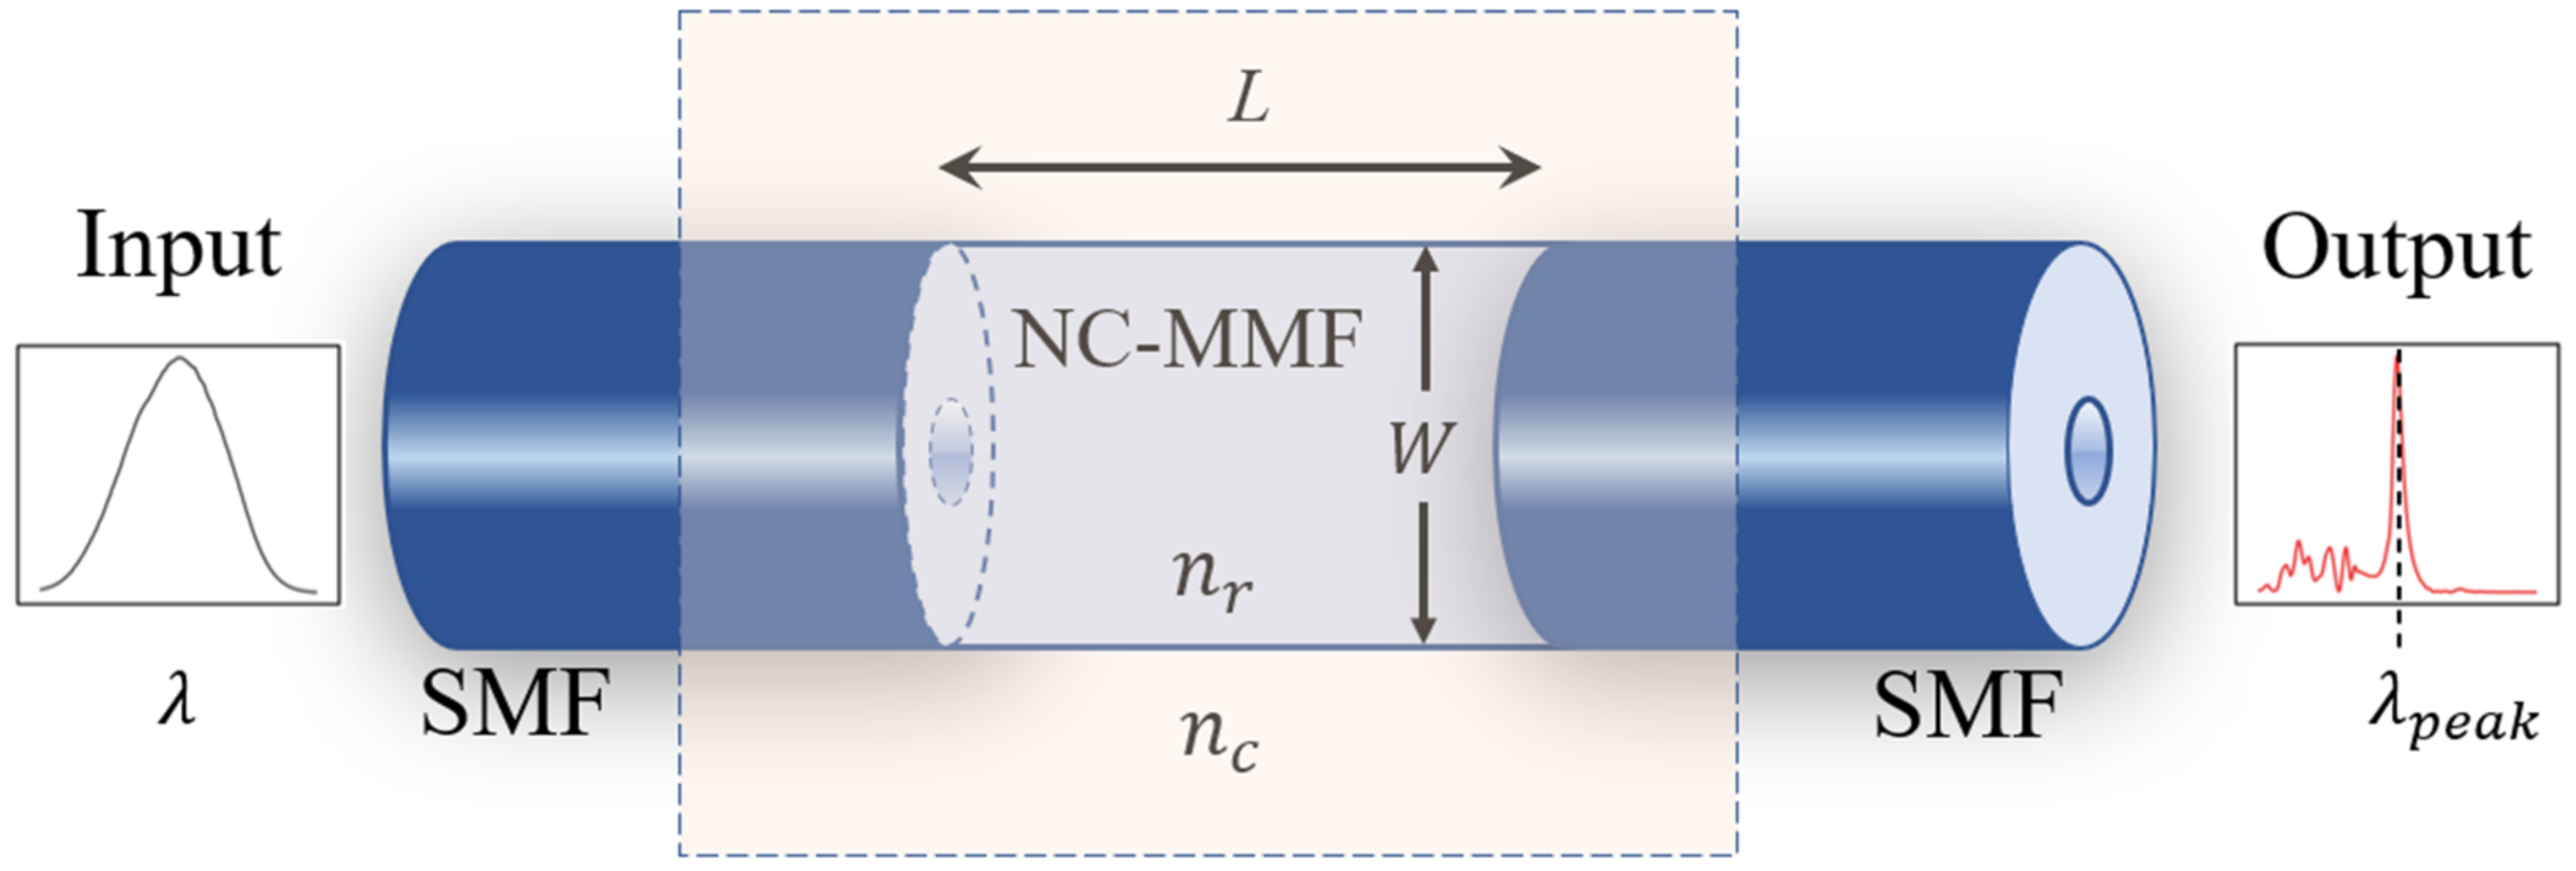
Abstract
:1. Introduction
2. Principle of Operation
3. Materials and Methods
3.1. Sample Preparation
3.2. Sensor Fabrication and Engineering Considerations
3.3. Experimental Set-Up
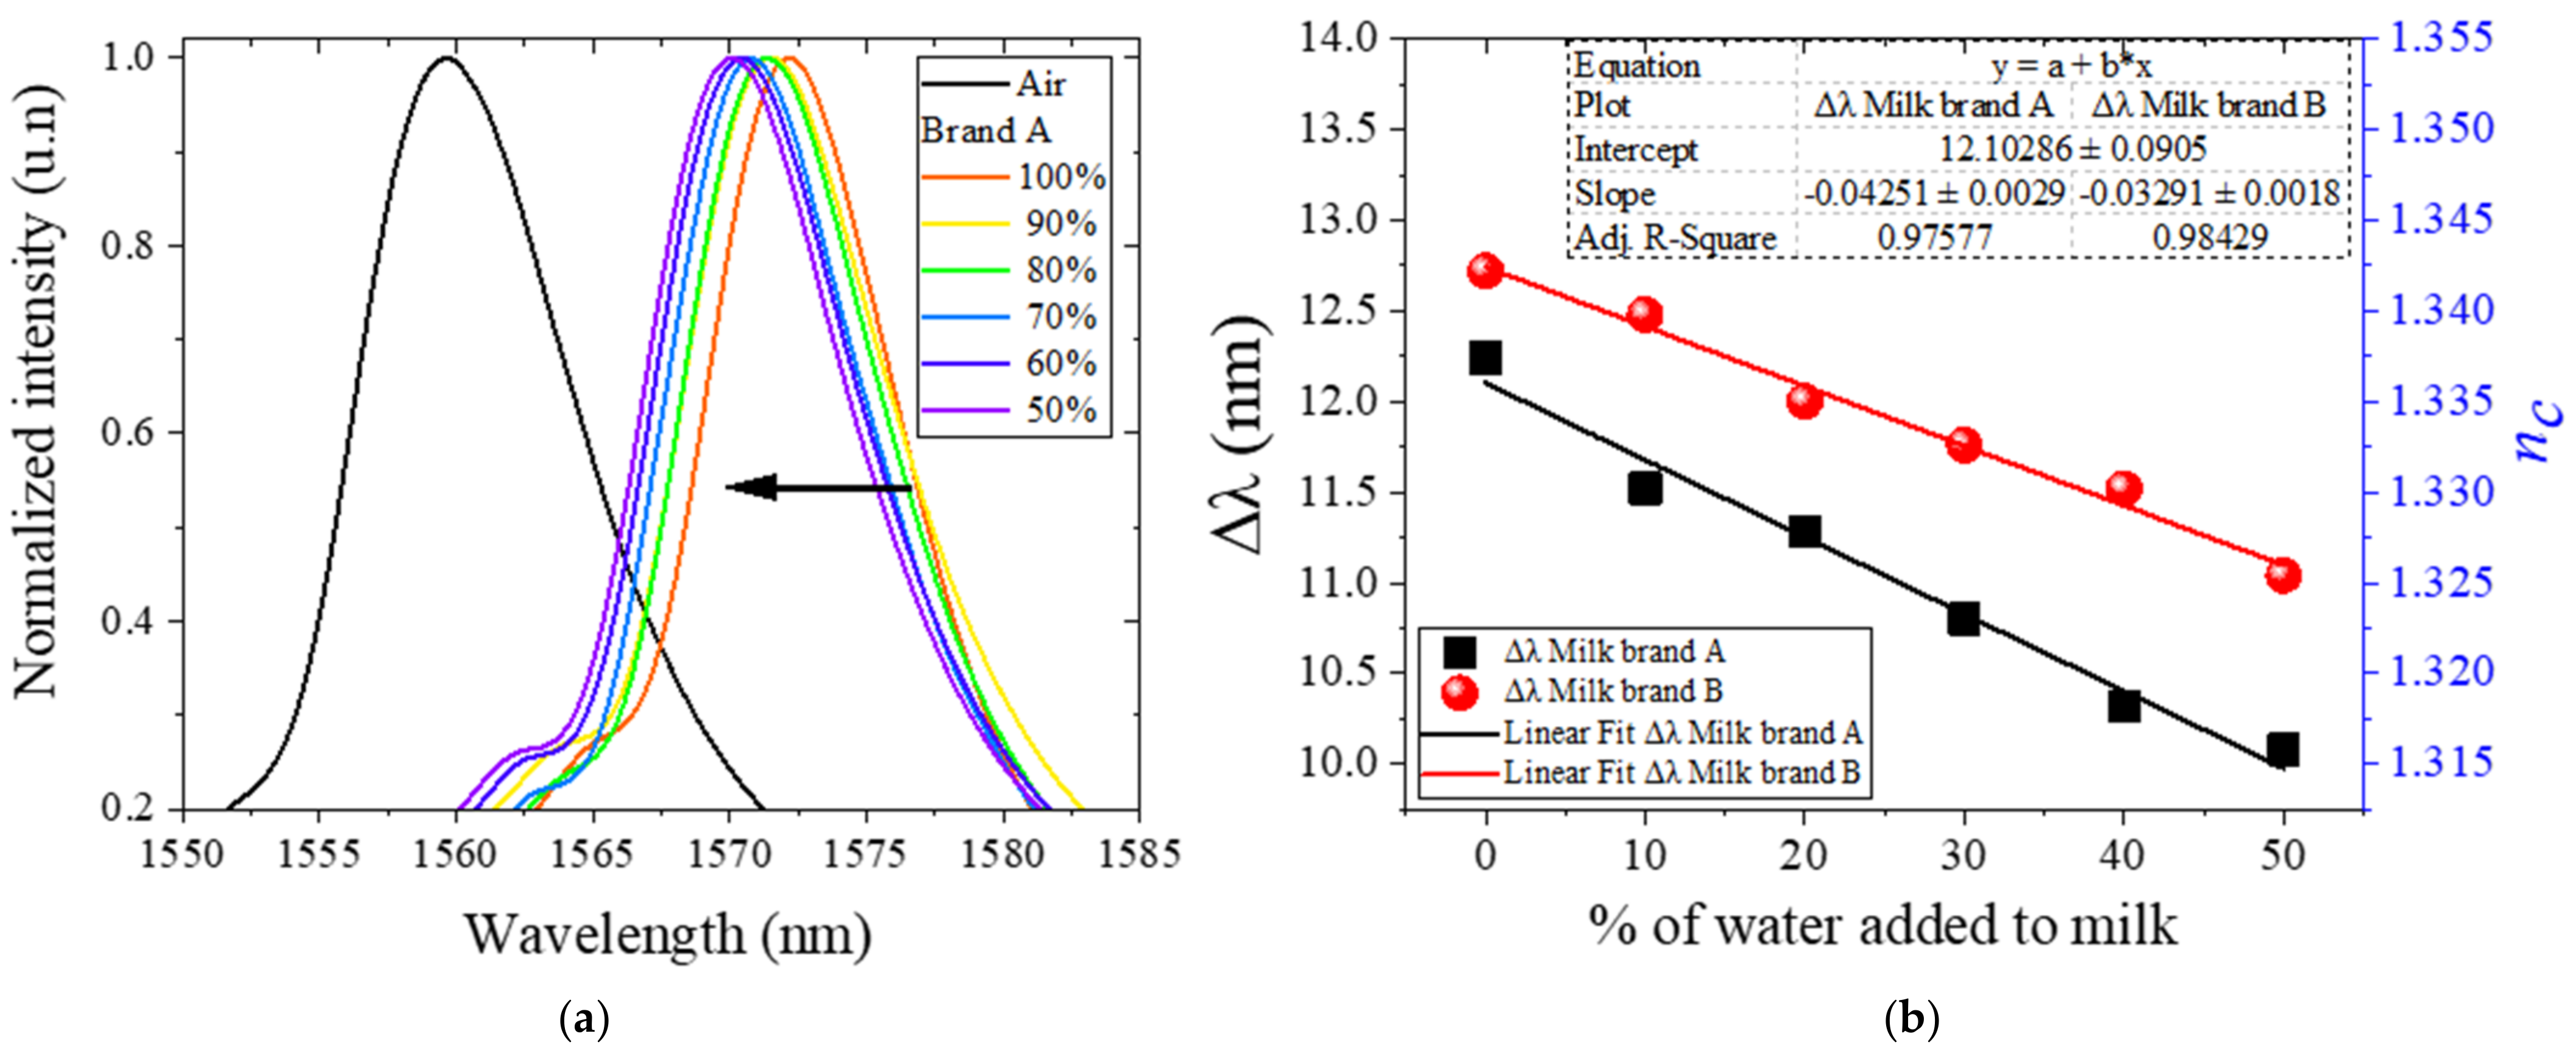
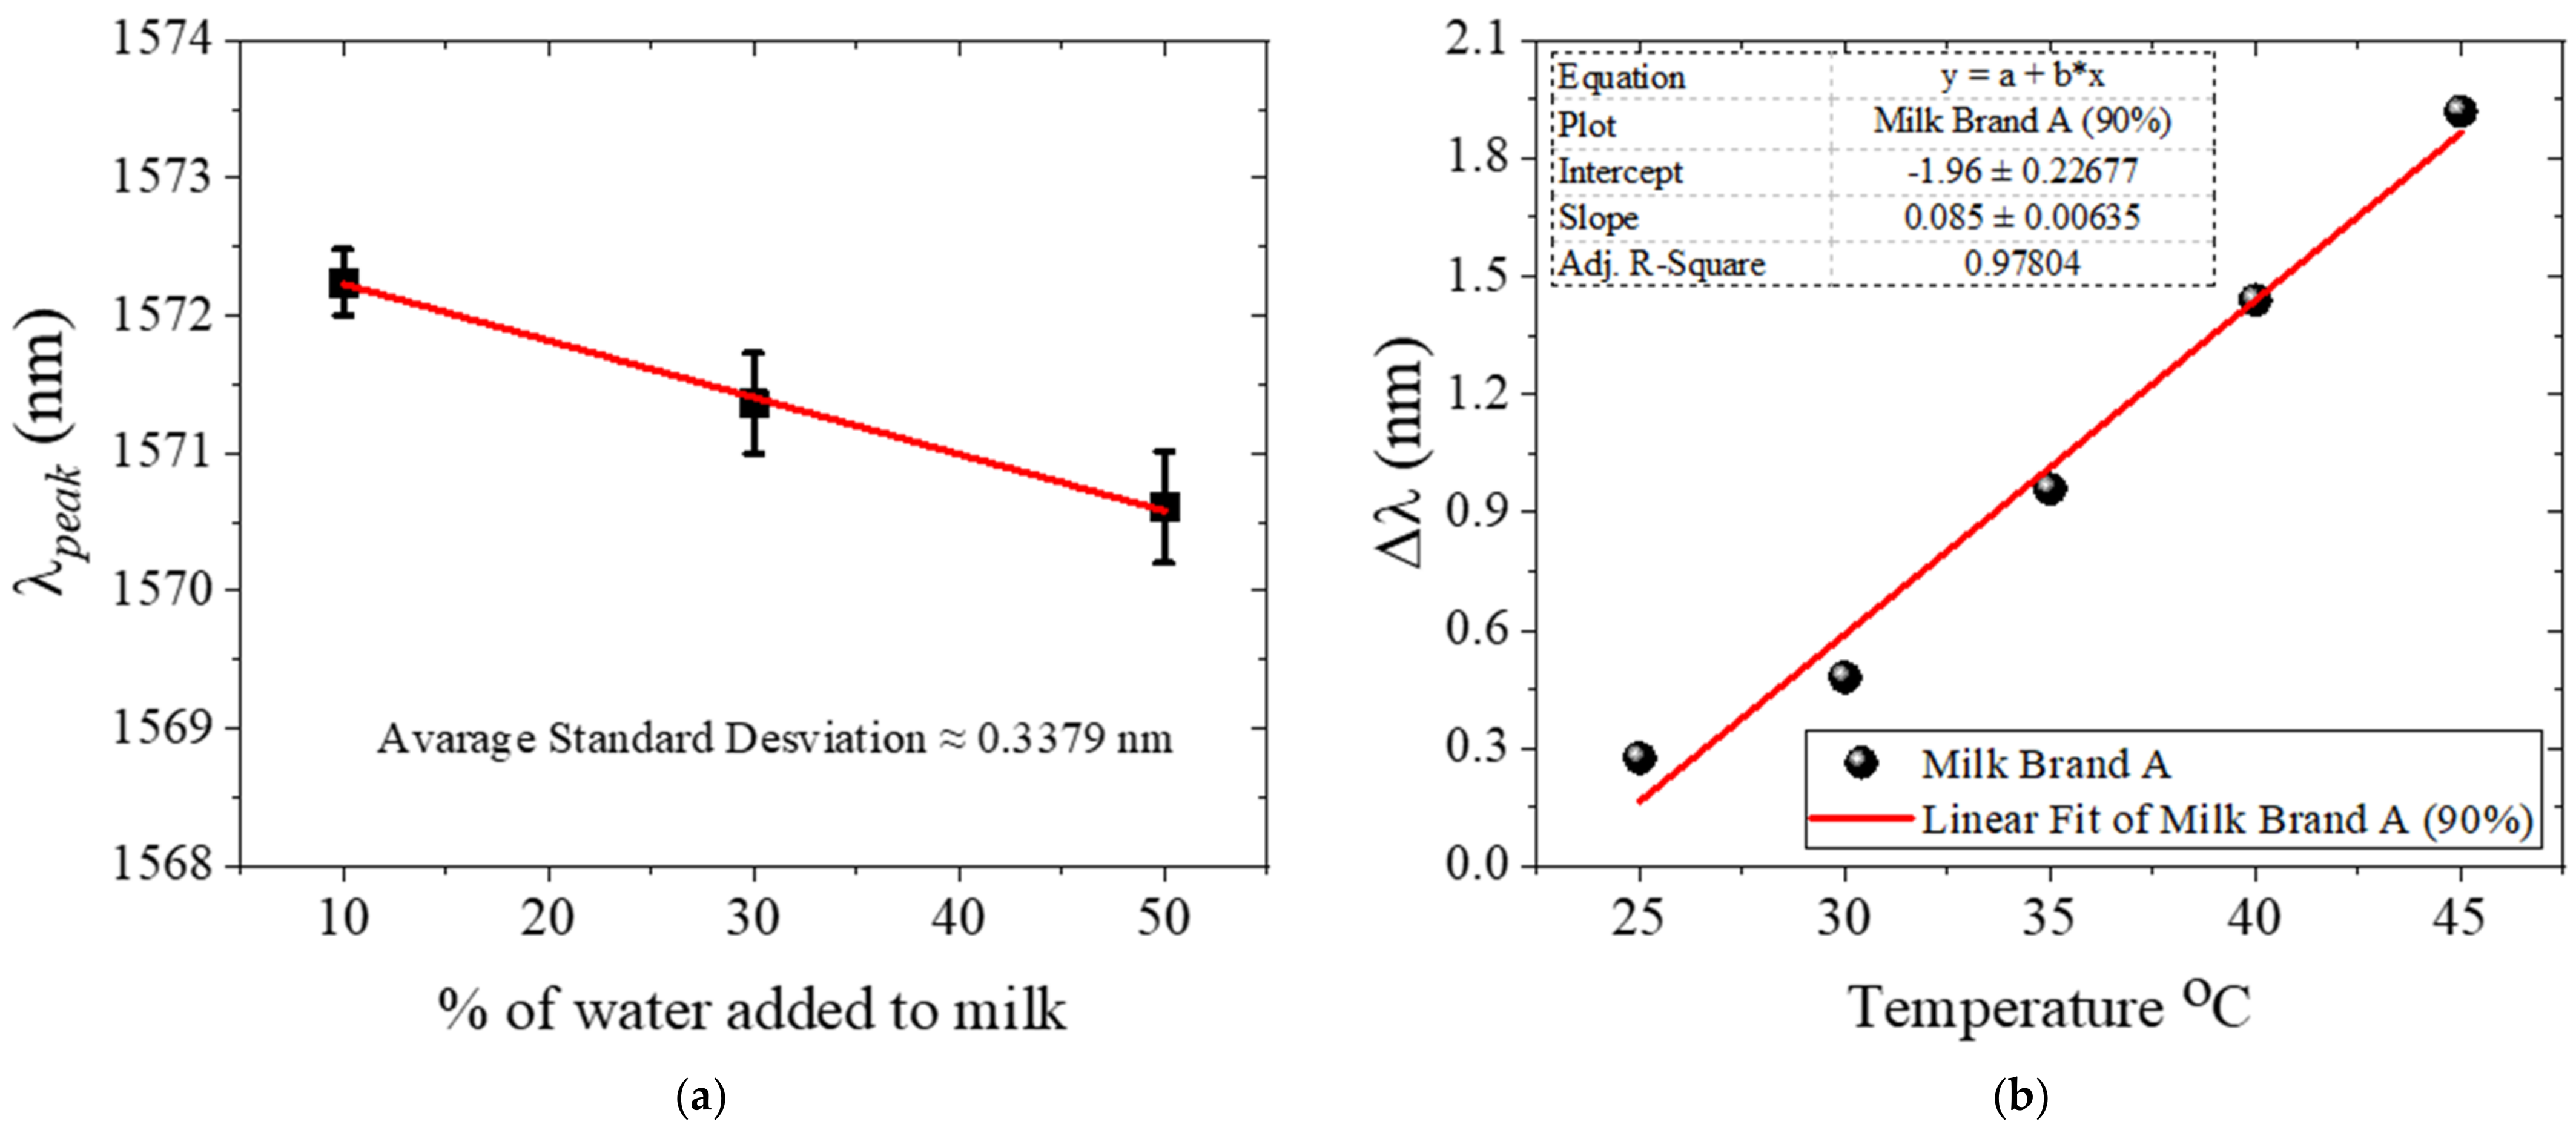
4. Results and Discussion
5. Conclusions
Author Contributions
Funding
Institutional Review Board Statement
Informed Consent Statement
Data Availability Statement
Acknowledgments
Conflicts of Interest
Appendix A
| Reference | Year | RI | Notes |
| [37] | 1947 | 1.3449–1.4480 1.3461–1.3500 | More than 200 samples of cow and buffalo raw milk were tested over a period of 8 months, with an Abbe refractometer, at 40 °C. The RI limits reported in this table are for cow milk (mode is 1.3463) and buffalo milk (mode is 1.3480), respectively. |
| [38] | 1999 | The RI of milk diluted with distilled water was measured with both a reflectometer and an Abbe refractometer. It is not specified if milk is commercial or raw. The expression in this table was estimated from fitting the RI reported as a function of milk concentration to a straight line (C is in %, it takes values from 0 to 100; R2 > 0.99). | |
| [39] | 2001 |  | The RI of commercial milk samples was measured with a reflectometer. The samples consisted of untreated milk with fat volume concentrations of 0.004%, 1.53%, and 3.55%. Three different methods were used: A: reflectometry; B: reflectometry at a critical angle; C: surface plasmon resonance. For each method, the RI values are given for the different fat concentrations. |
| [40] | 2010 |  | The RI and attenuation coefficient were measured simultaneously from reflectance measurements. The samples consisted of commercial milk (with fat volume concentrations ≤3.3%), and milk–cream mixtures, without any dilutions of these samples. In this table, only the real part of the complex RI is reported; the first column corresponds to measurements performed with a commercial Abbe refractometer. |
| [41] | 2015 | 1.3440–1.3485 | RI range given for cow milk at 20 °C and 589 nm, measured with an Abbe refractometer. It is not specified if the milk is commercial or raw. It is also reported that the RI of milk fat is usually in the range of 1.4537 to 1.4552 at 40 °C. |
| [42] | 2019 | 1.3425–1.3570 | Commercial milk was used (toned, standardized, and full cream with 3%, 4.5% and 6% of fat, respectively) as well as fresh unpasteurized cow and buffalo milk. All experiments were carried out at room temperature using a commercial refractometer. The RI range reported is from 50% dilution with DI water to undiluted milk; it is not specified on which samples the measurements were performed. |
| [43] | 2020 | 1.3445–1.3487 | The RI of 240 raw milk samples was measured throughout one year (average value of 1.3461). The average RI is also given per season: spring (1.3465), summer (1.3455), autumn (1.3458), and winter (1.3468). It is not stated how the RI measurements were performed. |
References
- Mohanty, B.P.; Mahanty, A.; Ganguly, S.; Mitra, T.; Karunakaran, D.; Anandan, R. Nutritional composition of food fishes and their importance in providing food and nutritional security. Food Chem. 2019, 293, 561–570. [Google Scholar] [CrossRef] [PubMed]
- Church, S.M. The importance of food composition data in recipe analysis. Nutr. Bull. 2015, 40, 40–44. [Google Scholar] [CrossRef]
- Elmadfa, I.; Meyer, A.L. Importance of food composition data to nutrition and public health. Eur J. Clin. Nutr. 2010, 64 (Suppl. 3), S4–S7. [Google Scholar] [CrossRef] [PubMed] [Green Version]
- Mishra, G.K.; Barfidokht, A.; Tehrani, F.; Mishra, R.K. Food Safety Analysis Using Electrochemical Biosensors. Foods 2018, 7, 141. [Google Scholar] [CrossRef] [Green Version]
- Mustafa, F.; Andreescu, S. Chemical and Biological Sensors for Food-Quality Monitoring and Smart Packaging. Foods 2018, 7, 168. [Google Scholar] [CrossRef] [Green Version]
- Adley, C.C. Past, Present and Future of Sensors in Food Production. Foods 2014, 3, 491–510. [Google Scholar] [CrossRef] [Green Version]
- Dincer, C.; Bruch, R.; Costa-Rama, E.; Fernandez-Abedul, M.T.; Merkoci, A.; Manz, A.; Urban, G.A.; Guder, F. Disposable Sensors in Diagnostics, Food, and Environmental Monitoring. Adv. Mater. 2019, 31, e1806739. [Google Scholar] [CrossRef]
- Meulebroeck, W.; Thienpont, H.; Ottevaere, H. Photonics enhanced sensors for food monitoring: Part 1. IEEE Instrum. Meas. Mag. 2016, 19, 35–45. [Google Scholar] [CrossRef]
- Meulebroeck, W.; Thienpont, H.; Ottevaere, H. Photonics enhanced sensors for food monitoring: Part 2. IEEE Instrum. Meas. Mag. 2017, 20, 31–37. [Google Scholar] [CrossRef]
- Meulebroeck, W.; Thienpont, H.; Ottevaere, H. Photonics enhanced sensors for food monitoring: Part 3. IEEE Instrum. Meas. Mag. 2017, 20, 46–55. [Google Scholar] [CrossRef]
- Hui, Y.H.; Chandan, R.C.; Clark, S.; Cross, N.A.; Dobbs, J.C.; Hurst, W.J.; Nollet, L.M.L.; Shimoni, E.; Sinha, N.K.; Smith, E.B. Handbook of Food Products Manufacturing: Health, Meat, Milk, Poultry, Seafood and Vegetables; Wiley: Hoboken, NJ, USA, 2007; Volume 2, p. 1248. [Google Scholar]
- Muehlhoff, E.; Bennett, A.; McMahon, D. Milk and Dairy Products in Human Nutrition; Food and Agriculture Organization of the United Nations (FAO): Rome, Italy, 2013. [Google Scholar]
- Handford, C.E.; Campbell, K.; Elliott, C.T. Impacts of Milk Fraud on Food Safety and Nutrition with Special Emphasis on Developing Countries. Compr. Rev. Food Sci. Food Saf. 2016, 15, 130–142. [Google Scholar] [CrossRef] [Green Version]
- Nascimento, C.F.; Santos, P.M.; Pereira-Filho, E.R.; Rocha, F.R.P. Recent advances on determination of milk adulterants. Food Chem. 2017, 221, 1232–1244. [Google Scholar] [CrossRef]
- Buttel, B.; Fuchs, M.; Holz, B. Freezing point osmometry of milk to determine the additional water content—An issue in general quality control and German food regulation. Chem. Cent. J. 2008, 2, 6. [Google Scholar] [CrossRef] [Green Version]
- Macedo dos Santos, P.; Pereira-Filho, E.R. Digital image analysis—An alternative tool for monitoring milk authenticity. Anal. Methods 2013, 5, 3669–3674. [Google Scholar] [CrossRef]
- Botelho, B.G.; Reis, N.; Oliveira, L.S.; Sena, M.M. Development and analytical validation of a screening method for simultaneous detection of five adulterants in raw milk using mid-infrared spectroscopy and PLS-DA. Food Chem. 2015, 181, 31–37. [Google Scholar] [CrossRef]
- Qi, W.; Tian, Y.; Lu, D.; Chen, B. Research Progress of Applying Infrared Spectroscopy Technology for Detection of Toxic and Harmful Substances in Food. Foods 2022, 11, 930. [Google Scholar] [CrossRef]
- Zhang, L.G.; Zhang, X.; Ni, L.J.; Xue, Z.B.; Gu, X.; Huang, S.X. Rapid identification of adulterated cow milk by non-linear pattern recognition methods based on near infrared spectroscopy. Food Chem. 2014, 145, 342–348. [Google Scholar] [CrossRef]
- Agranovich, D.; Renhart, I.; Ben Ishai, P.; Katz, G.; Bezman, D.; Feldman, Y. A microwave sensor for the characterization of bovine milk. Food Control. 2016, 63, 195–200. [Google Scholar] [CrossRef]
- Udd, E.; Spillman, W.B., Jr. Fiber Optic Sensors: An introduction for Engineers and Scientists; John Wiley & Sons: Hoboken, NJ, USA, 2011. [Google Scholar]
- Yin, S.; Ruffin, P.B.; Francis, T. Fiber Optic Sensors; CRC Press: Boca Raton, FL, USA, 2017. [Google Scholar]
- Verissimo, M.I.S.; Gamelas, J.A.F.; Fernandes, A.J.S.; Evtuguin, D.V.; Gomes, M. A new formaldehyde optical sensor: Detecting milk adulteration. Food Chem. 2020, 318, 126461. [Google Scholar] [CrossRef]
- Wu, Q.; Qu, Y.; Liu, J.; Yuan, J.; Wan, S.-P.; Wu, T.; He, X.-D.; Liu, B.; Liu, D.; Ma, Y.; et al. Singlemode-Multimode-Singlemode Fiber Structures for Sensing Applications—A Review. IEEE Sens. J. 2021, 21, 12734–12751. [Google Scholar] [CrossRef]
- Wang, K.; Dong, X.; Köhler, M.H.; Kienle, P.; Bian, Q.; Jakobi, M.; Koch, A.W.J.I.S.J. Advances in optical fiber sensors based on multimode interference (MMI): A review. IEEE Sens. J. 2020, 21, 132–142. [Google Scholar] [CrossRef]
- Guzman-Sepulveda, J.R.; Guzman-Cabrera, R.; Castillo-Guzman, A.A. Optical Sensing Using Fiber-Optic Multimode Interference Devices: A Review of Nonconventional Sensing Schemes. Sensors 2021, 21, 1862. [Google Scholar] [CrossRef] [PubMed]
- Zhao, Y.; Zhao, J.; Zhao, Q. Review of no-core optical fiber sensor and applications. Sens. Actuators A Phys. 2020, 313, 112160. [Google Scholar] [CrossRef]
- Soldano, L.B.; Pennings, E.C.M. Optical multi-mode interference devices based on self-imaging: Principles and applications. J. Lightwave Technol. 1995, 13, 615–627. [Google Scholar] [CrossRef] [Green Version]
- Okamoto, K. Fundamentals of Optical Waveguides; Elsevier: Amsterdam, The Netherlands, 2021. [Google Scholar]
- Wang, Q.; Farrell, G.; Yan, W. Investigation on Single-Mode–Multimode– Single-Mode Fiber Structure. J. Lightwave Technol. 2008, 26, 512–519. [Google Scholar] [CrossRef]
- Malitson, I.H. Interspecimen Comparison of the Refractive Index of Fused Silica. J. Opt. Soc. Am. 1965, 55, 1205–1209. [Google Scholar] [CrossRef]
- Tan, C.Z. Determination of refractive index of silica glass for infrared wavelengths by IR spectroscopy. J. Non Cryst. Solids 1998, 223, 158–163. [Google Scholar] [CrossRef]
- Ucko, D.A. Basics for Chemistry; Elsevier: Amsterdam, The Netherlands, 2013. [Google Scholar]
- Ruiz-Perez, V.I.; May-Arrioja, D.A.; Guzman-Sepulveda, J.R. Passive athermalization of multimode interference devices for wavelength-locking applications. Opt. Express 2017, 25, 4800–4809. [Google Scholar] [CrossRef]
- Ruiz-Perez, V.I.; Velasco-Bolom, P.M.; May-Arrioja, D.A.; Sepulveda, J.R.G. Measuring the Thermo-Optic Coefficient of Liquids with Athermal Multimode Interference Devices. IEEE Sens. J. 2021, 21, 3004–3012. [Google Scholar] [CrossRef]
- Ruiz-Perez, V.I.; May-Arrioja, D.A.; Guzman-Sepulveda, J.R. An All-Solid Athermal Multimode-Interference Cascaded Device for Wavelength-Locking. IEEE Photonics Technol. Lett. 2018, 30, 669–672. [Google Scholar] [CrossRef]
- Rangappa, K. Studies on the refractive index of milk. Proc. Indian Acad. Sci. Sect. B 1947, 26, 125–135. [Google Scholar] [CrossRef]
- Räty, J.A.; Peiponen, K.-E.J.A.s. Reflectance study of milk in the UV-visible range. Appl. Spectrosc. 1999, 53, 1123–1127. [Google Scholar] [CrossRef]
- Jääskeläinen, A.; Peiponen, K.-E.; Räty, J. On reflectometric measurement of a refractive index of milk. J. Dairy Sci. 2001, 84, 38–43. [Google Scholar] [CrossRef]
- Calhoun, W.R.; Maeta, H.; Roy, S.; Bali, L.M.; Bali, S. Sensitive real-time measurement of the refractive index and attenuation coefficient of milk and milk-cream mixtures. J. Dairy Sci. 2010, 93, 3497–3504. [Google Scholar] [CrossRef]
- Fox, P.; Uniacke-Lowe, T.; McSweeney, P.; O’Mahony, J. Physical properties of milk. In Dairy Chemistry and Biochemistry; Springer: Berlin/Heidelberg, Germany, 2015; pp. 321–343. [Google Scholar]
- Gowri, A.; Rajamani, A.S.; Ramakrishna, B.; Sai, V.V.R. U-bent plastic optical fiber probes as refractive index based fat sensor for milk quality monitoring. Opt. Fiber Technol. 2019, 47, 15–20. [Google Scholar] [CrossRef]
- Özdemir, D.; Tahmas Kahyaoglu, D. Identification of microbiological, physical, and chemical quality of milk from milk collection centers in Kastamonu Province. Turk. J. Vet. Anim. Sci. 2020, 44, 118–130. [Google Scholar] [CrossRef]


Publisher’s Note: MDPI stays neutral with regard to jurisdictional claims in published maps and institutional affiliations. |
© 2022 by the authors. Licensee MDPI, Basel, Switzerland. This article is an open access article distributed under the terms and conditions of the Creative Commons Attribution (CC BY) license (https://creativecommons.org/licenses/by/4.0/).
Share and Cite
Fuentes-Rubio, Y.A.; Zúñiga-Ávalos, Y.A.; Guzmán-Sepúlveda, J.R.; Domínguez-Cruz, R.F. Refractometric Detection of Adulterated Milk Based on Multimode Interference Effects. Foods 2022, 11, 1075. https://doi.org/10.3390/foods11081075
Fuentes-Rubio YA, Zúñiga-Ávalos YA, Guzmán-Sepúlveda JR, Domínguez-Cruz RF. Refractometric Detection of Adulterated Milk Based on Multimode Interference Effects. Foods. 2022; 11(8):1075. https://doi.org/10.3390/foods11081075
Chicago/Turabian StyleFuentes-Rubio, Yadira Aracely, Yamil Alejandro Zúñiga-Ávalos, José Rafael Guzmán-Sepúlveda, and René Fernando Domínguez-Cruz. 2022. "Refractometric Detection of Adulterated Milk Based on Multimode Interference Effects" Foods 11, no. 8: 1075. https://doi.org/10.3390/foods11081075