
Effect of an Ultrasound Pre-Treatment on the Characteristics and Quality of Far-Infrared Vacuum Drying with Cistanche Slices


Abstract
:1. Introduction
2. Materials and Methods
2.1. Chemicals
2.2. Plant Material and Processing
2.3. Preparation of the Test and Reference Solutions
2.3.1. Preparation of the Reference Solutions for Phenylethanoid Glycosides and Iridoids
2.3.2. Preparation of Control Solutions for Phenylethanol Glycoside and Iridoid Components
2.3.3. Preparation of Polysaccharide, Total Phenol, Total Flavonoid and Antioxidant Test Solutions
2.4. Calculation of Drying Parameters
2.4.1. Calculation of the Dry Base Moisture Content
2.4.2. Calculation of the Moisture Ratio
2.4.3. Calculation of the Drying Rate
2.5. Calculation of the Effective Moisture Diffusivity (Deff)
2.6. Determination of the Quality of Dry Products
2.6.1. Determination of Phenylethanoid Glycosides and Iridoid
2.6.2. Determination of the Polysaccharide, Total Phenol, Total Flavonoid and Antioxidant Capacity of the Dry Products
- Determination of the polysaccharide content
- Determination of total phenolic content
- Determination of antioxidant capacity
- Determination of the total flavonoid content
2.6.3. Determination of Colour Differences
2.6.4. Calculation of the Rehydration Rate
2.6.5. Microstructure
2.7. Statistical Analysis
3. Results and Discussion
3.1. Effect of US Pre-Treatment on the Process of Drying Cistanche Slices by Far-Infrared Vacuum Drying
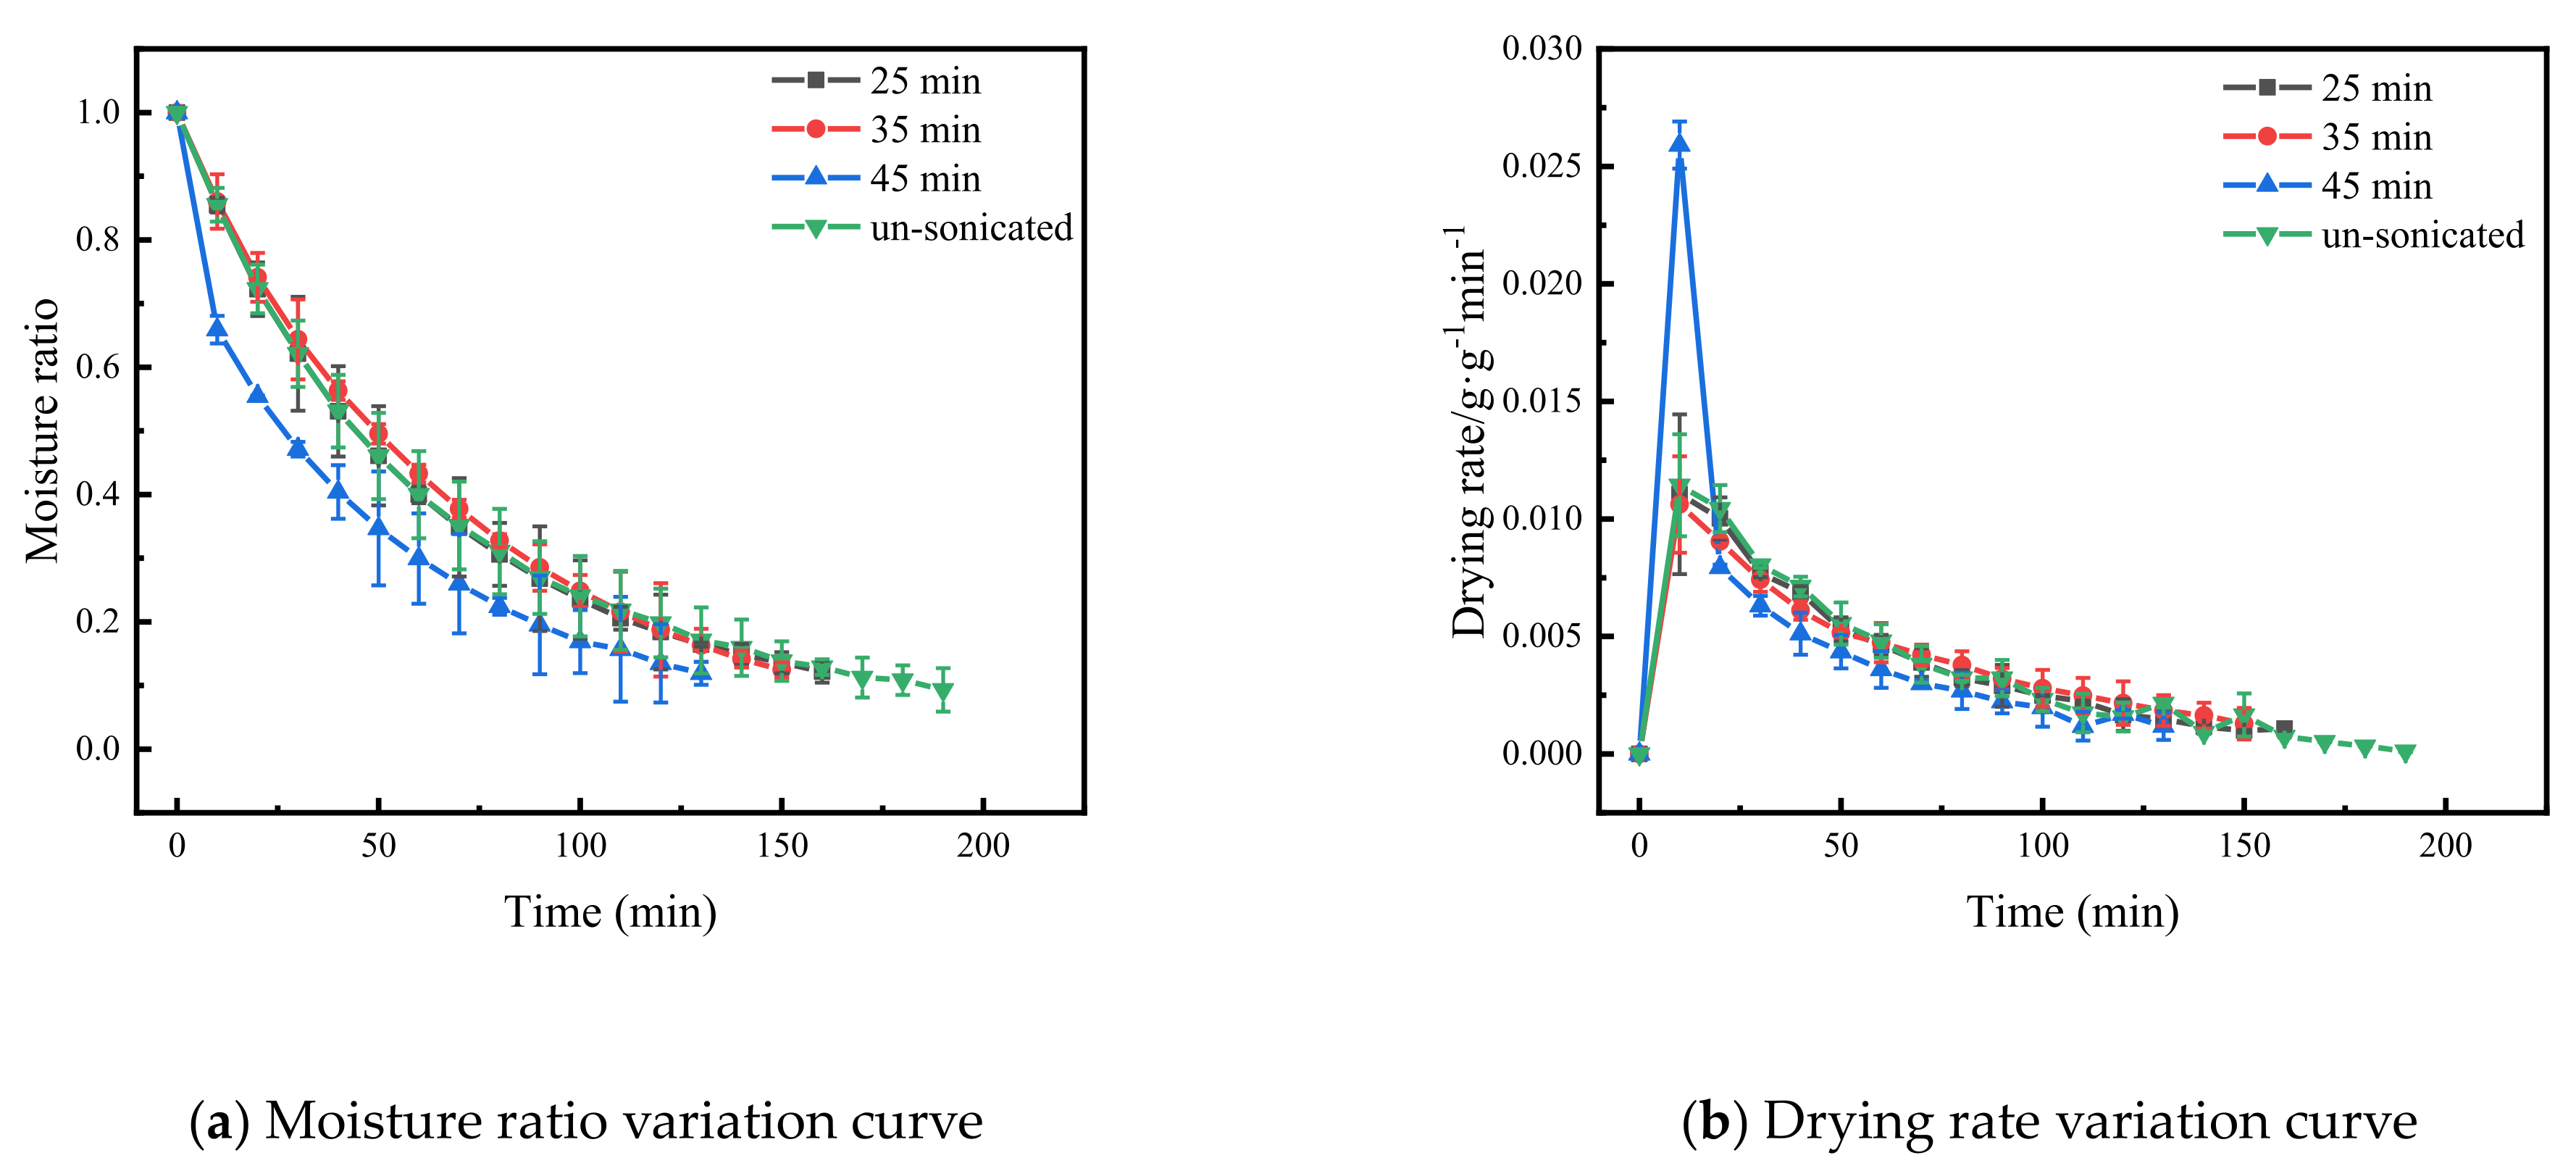
3.1.1. US Treatment Time
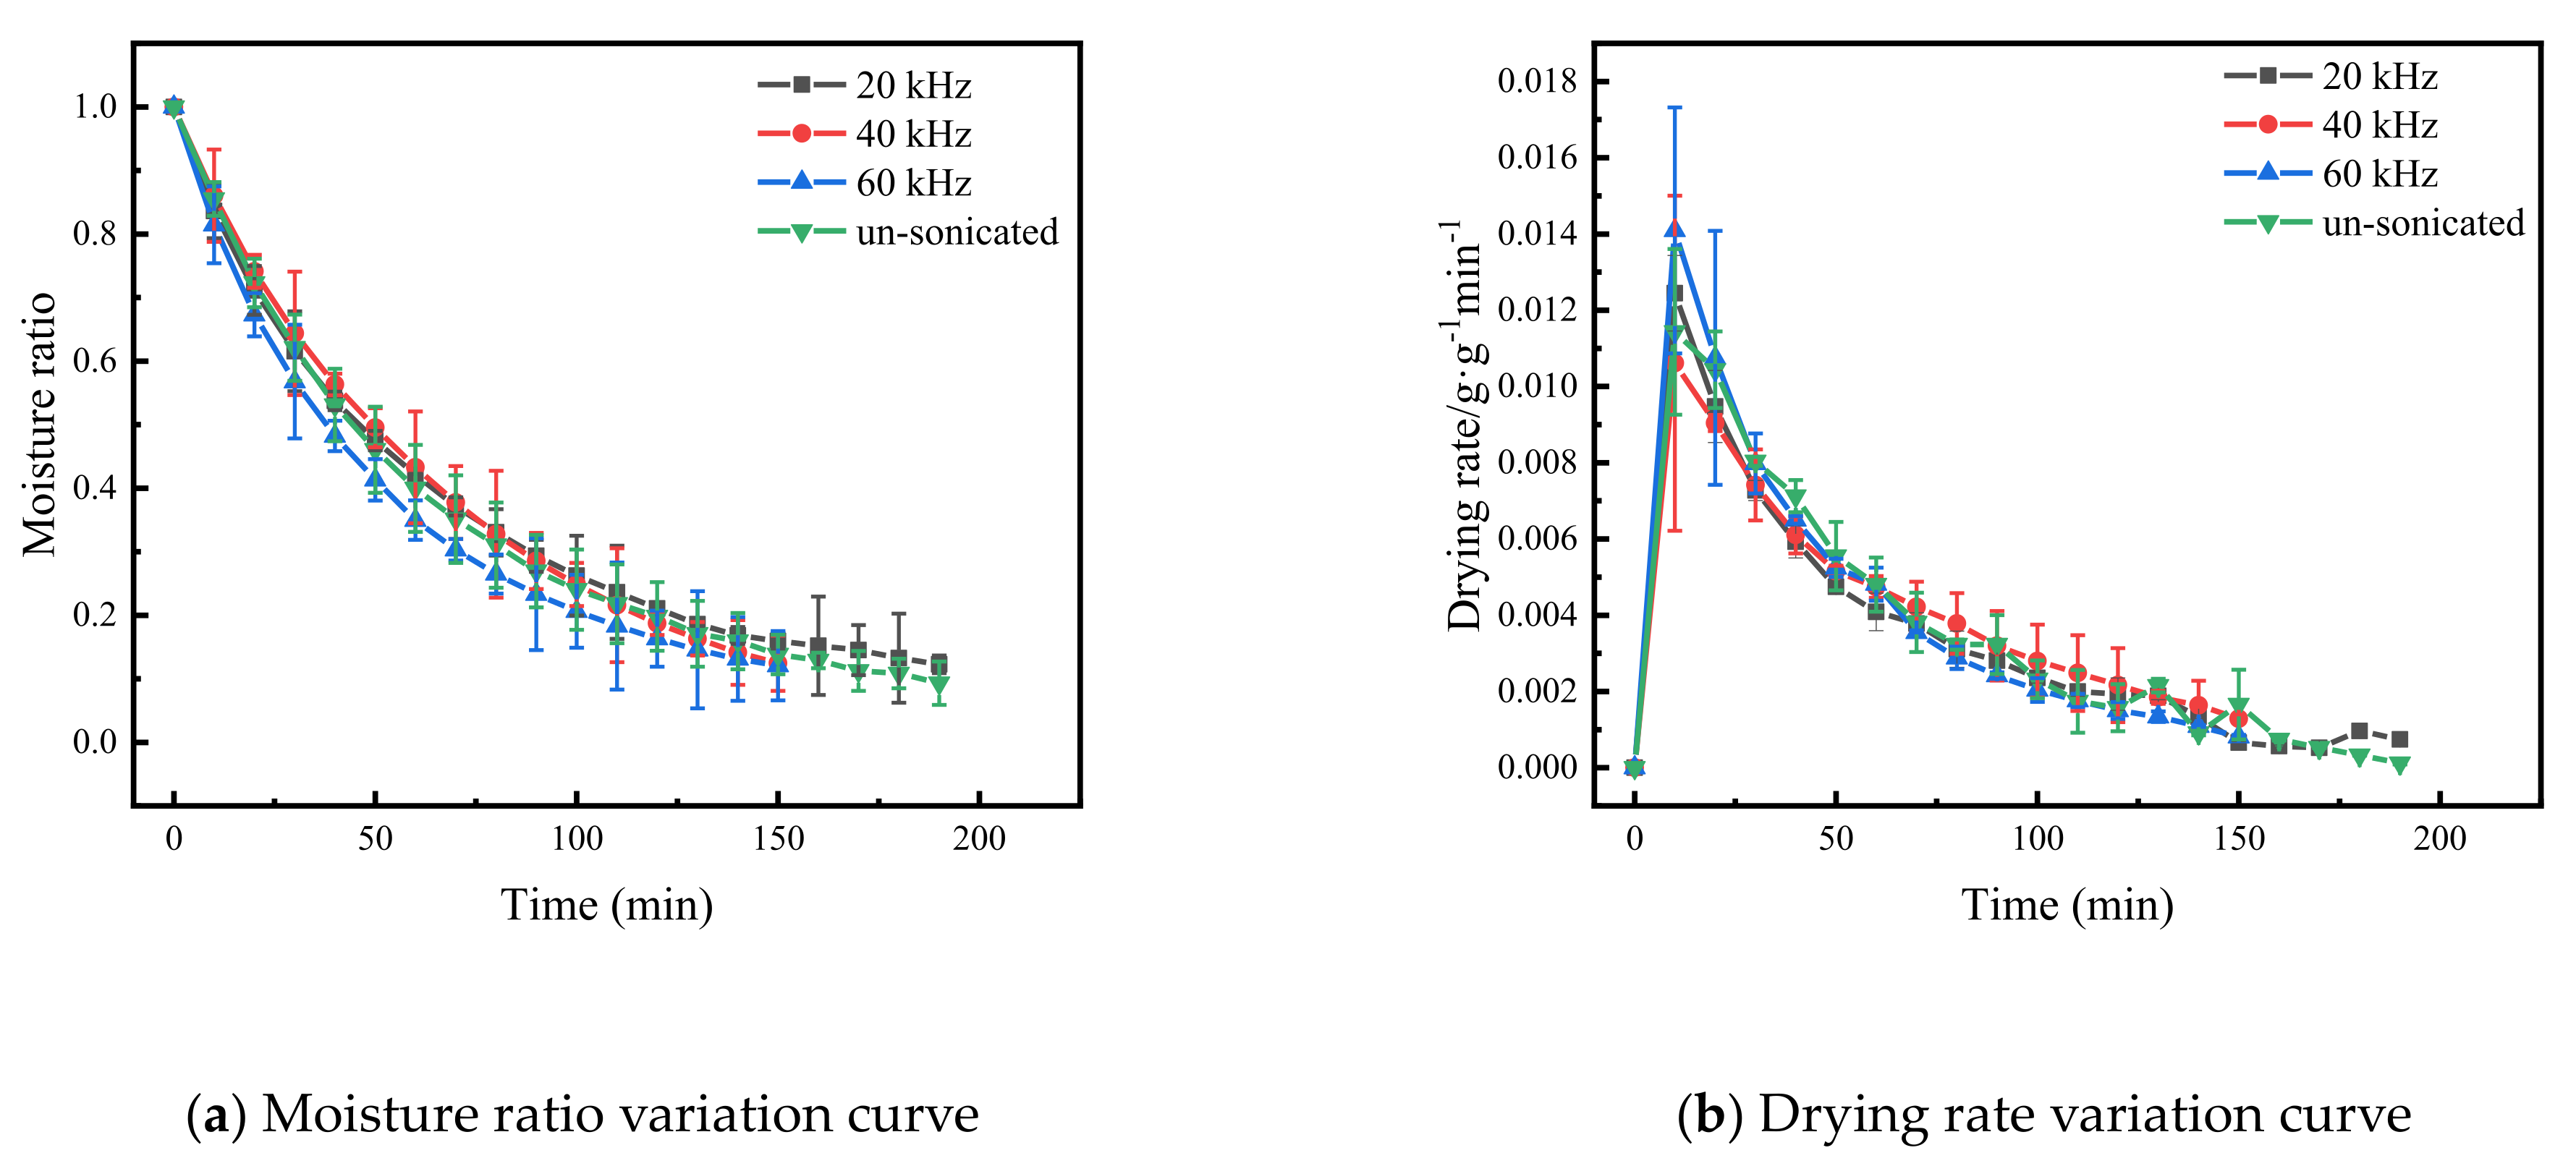
3.1.2. US Frequency
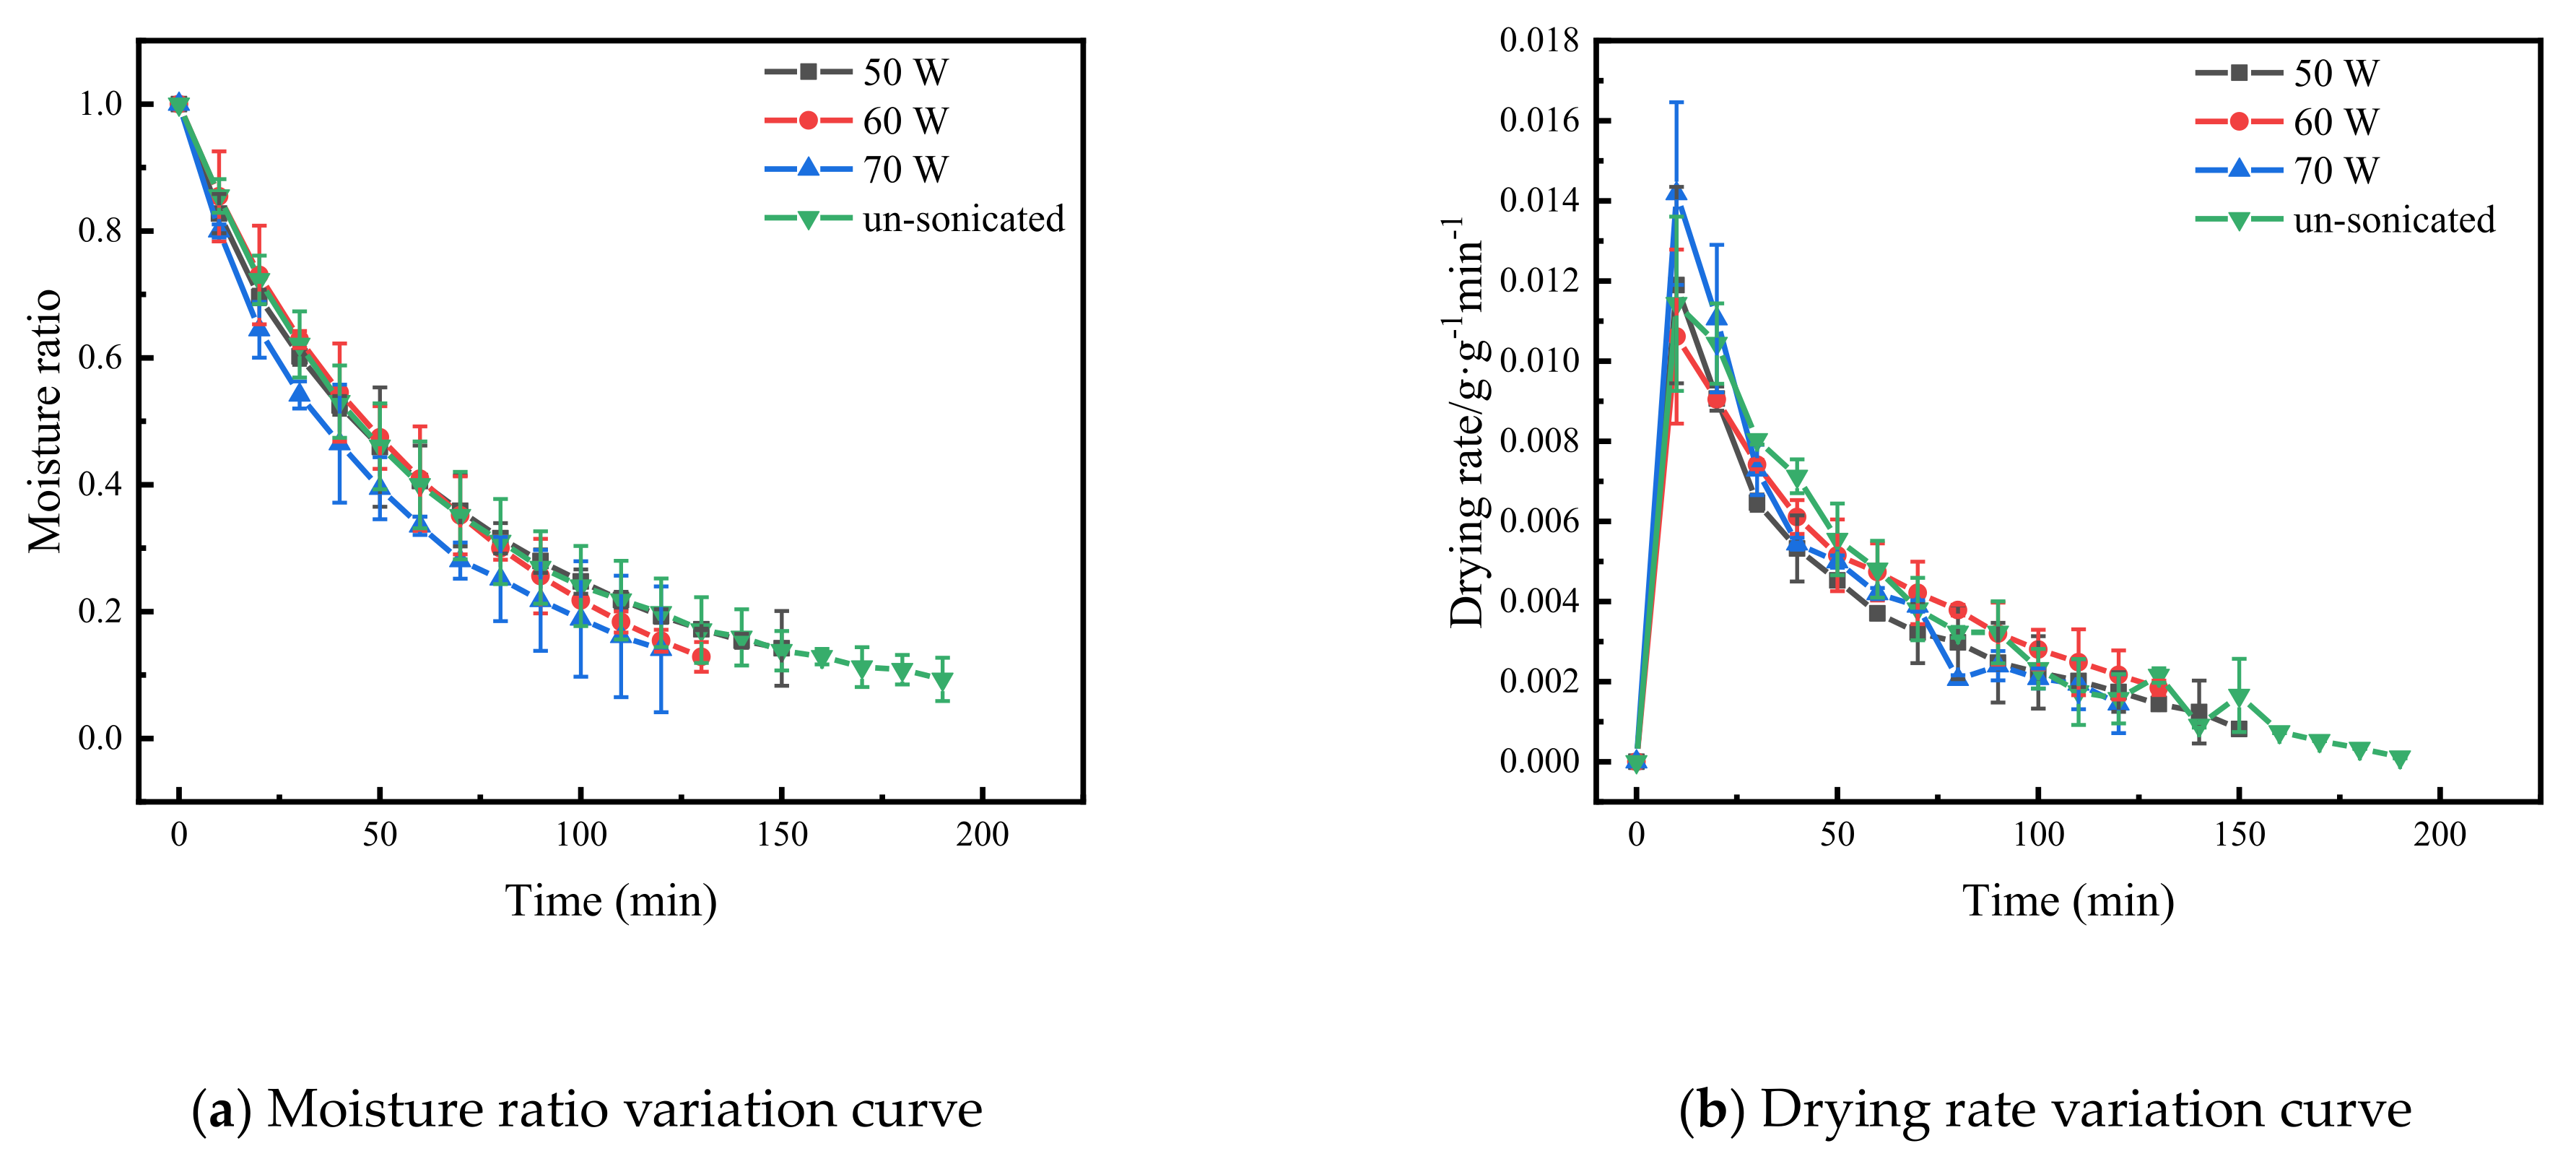
3.1.3. US Power
3.2. Effective Moisture Diffusivity
3.3. Effect of US Pre-Treatment on the Drying Quality of Cistanche
3.3.1. Phenylethanol Glycosides and Iridoids
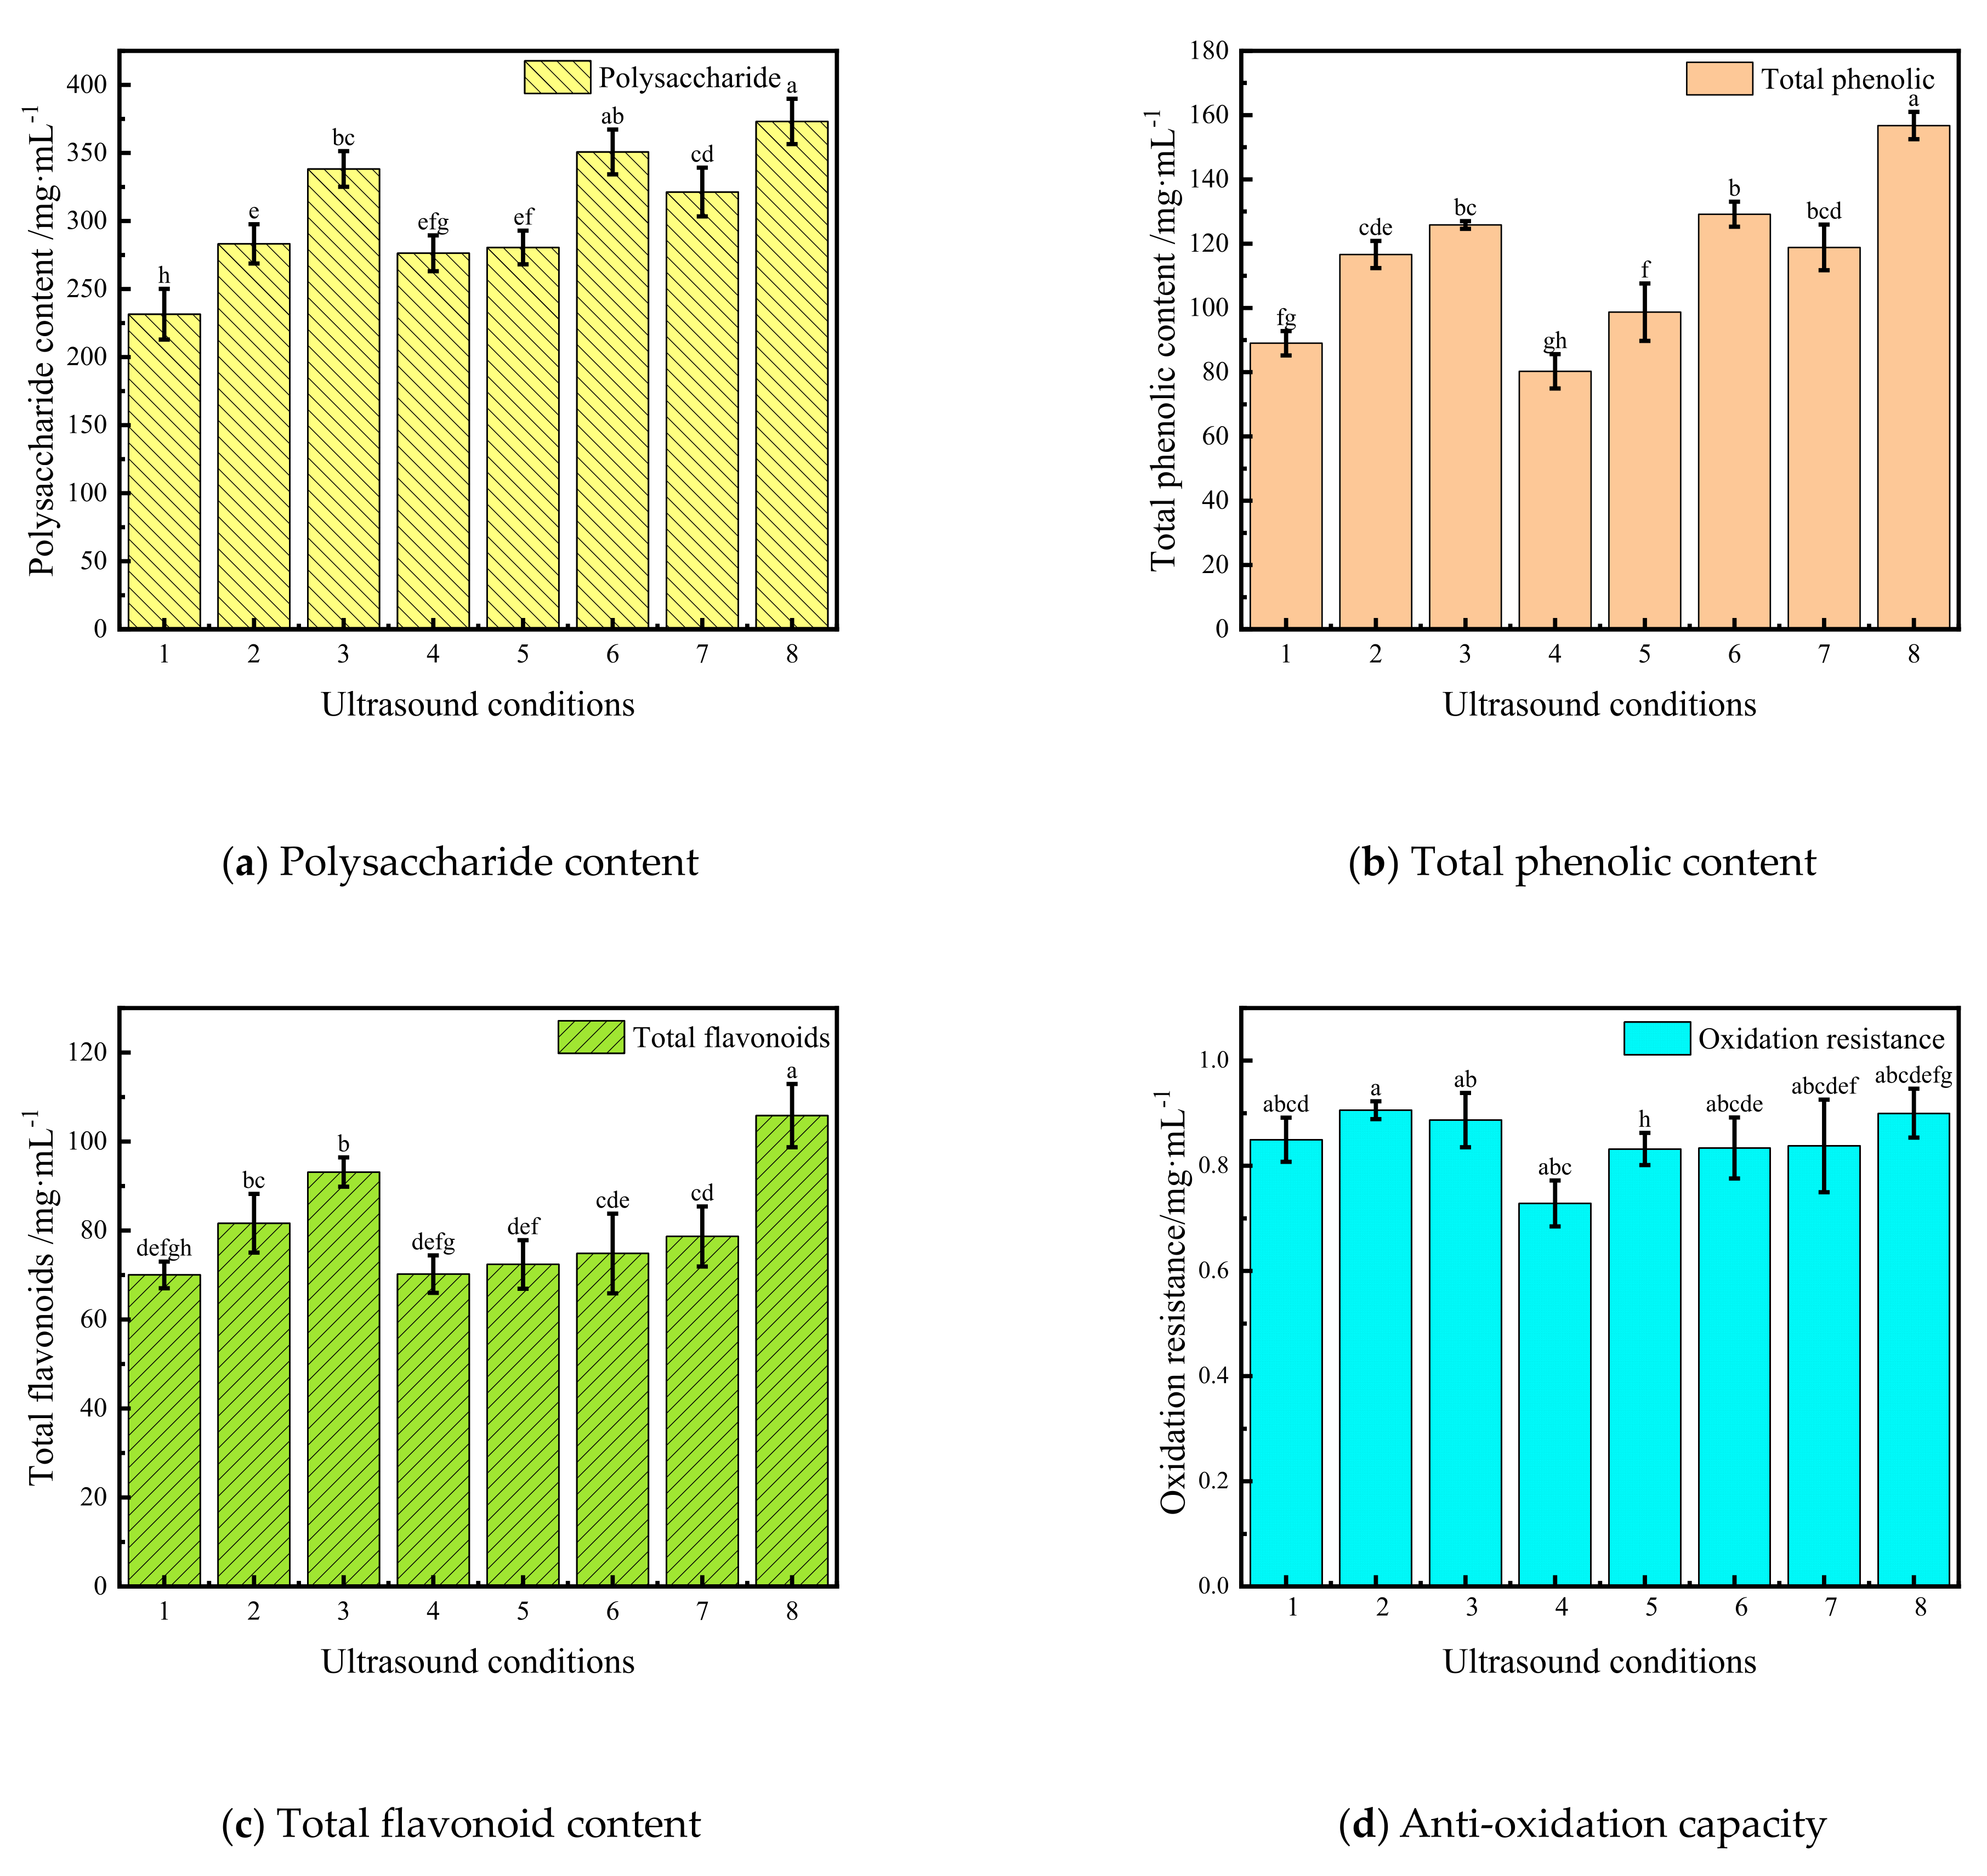
3.3.2. Polysaccharides
3.3.3. Total Phenolic Content
3.3.4. Total Flavonoids
3.3.5. Anti-Oxidation Capacity
3.4. Colour
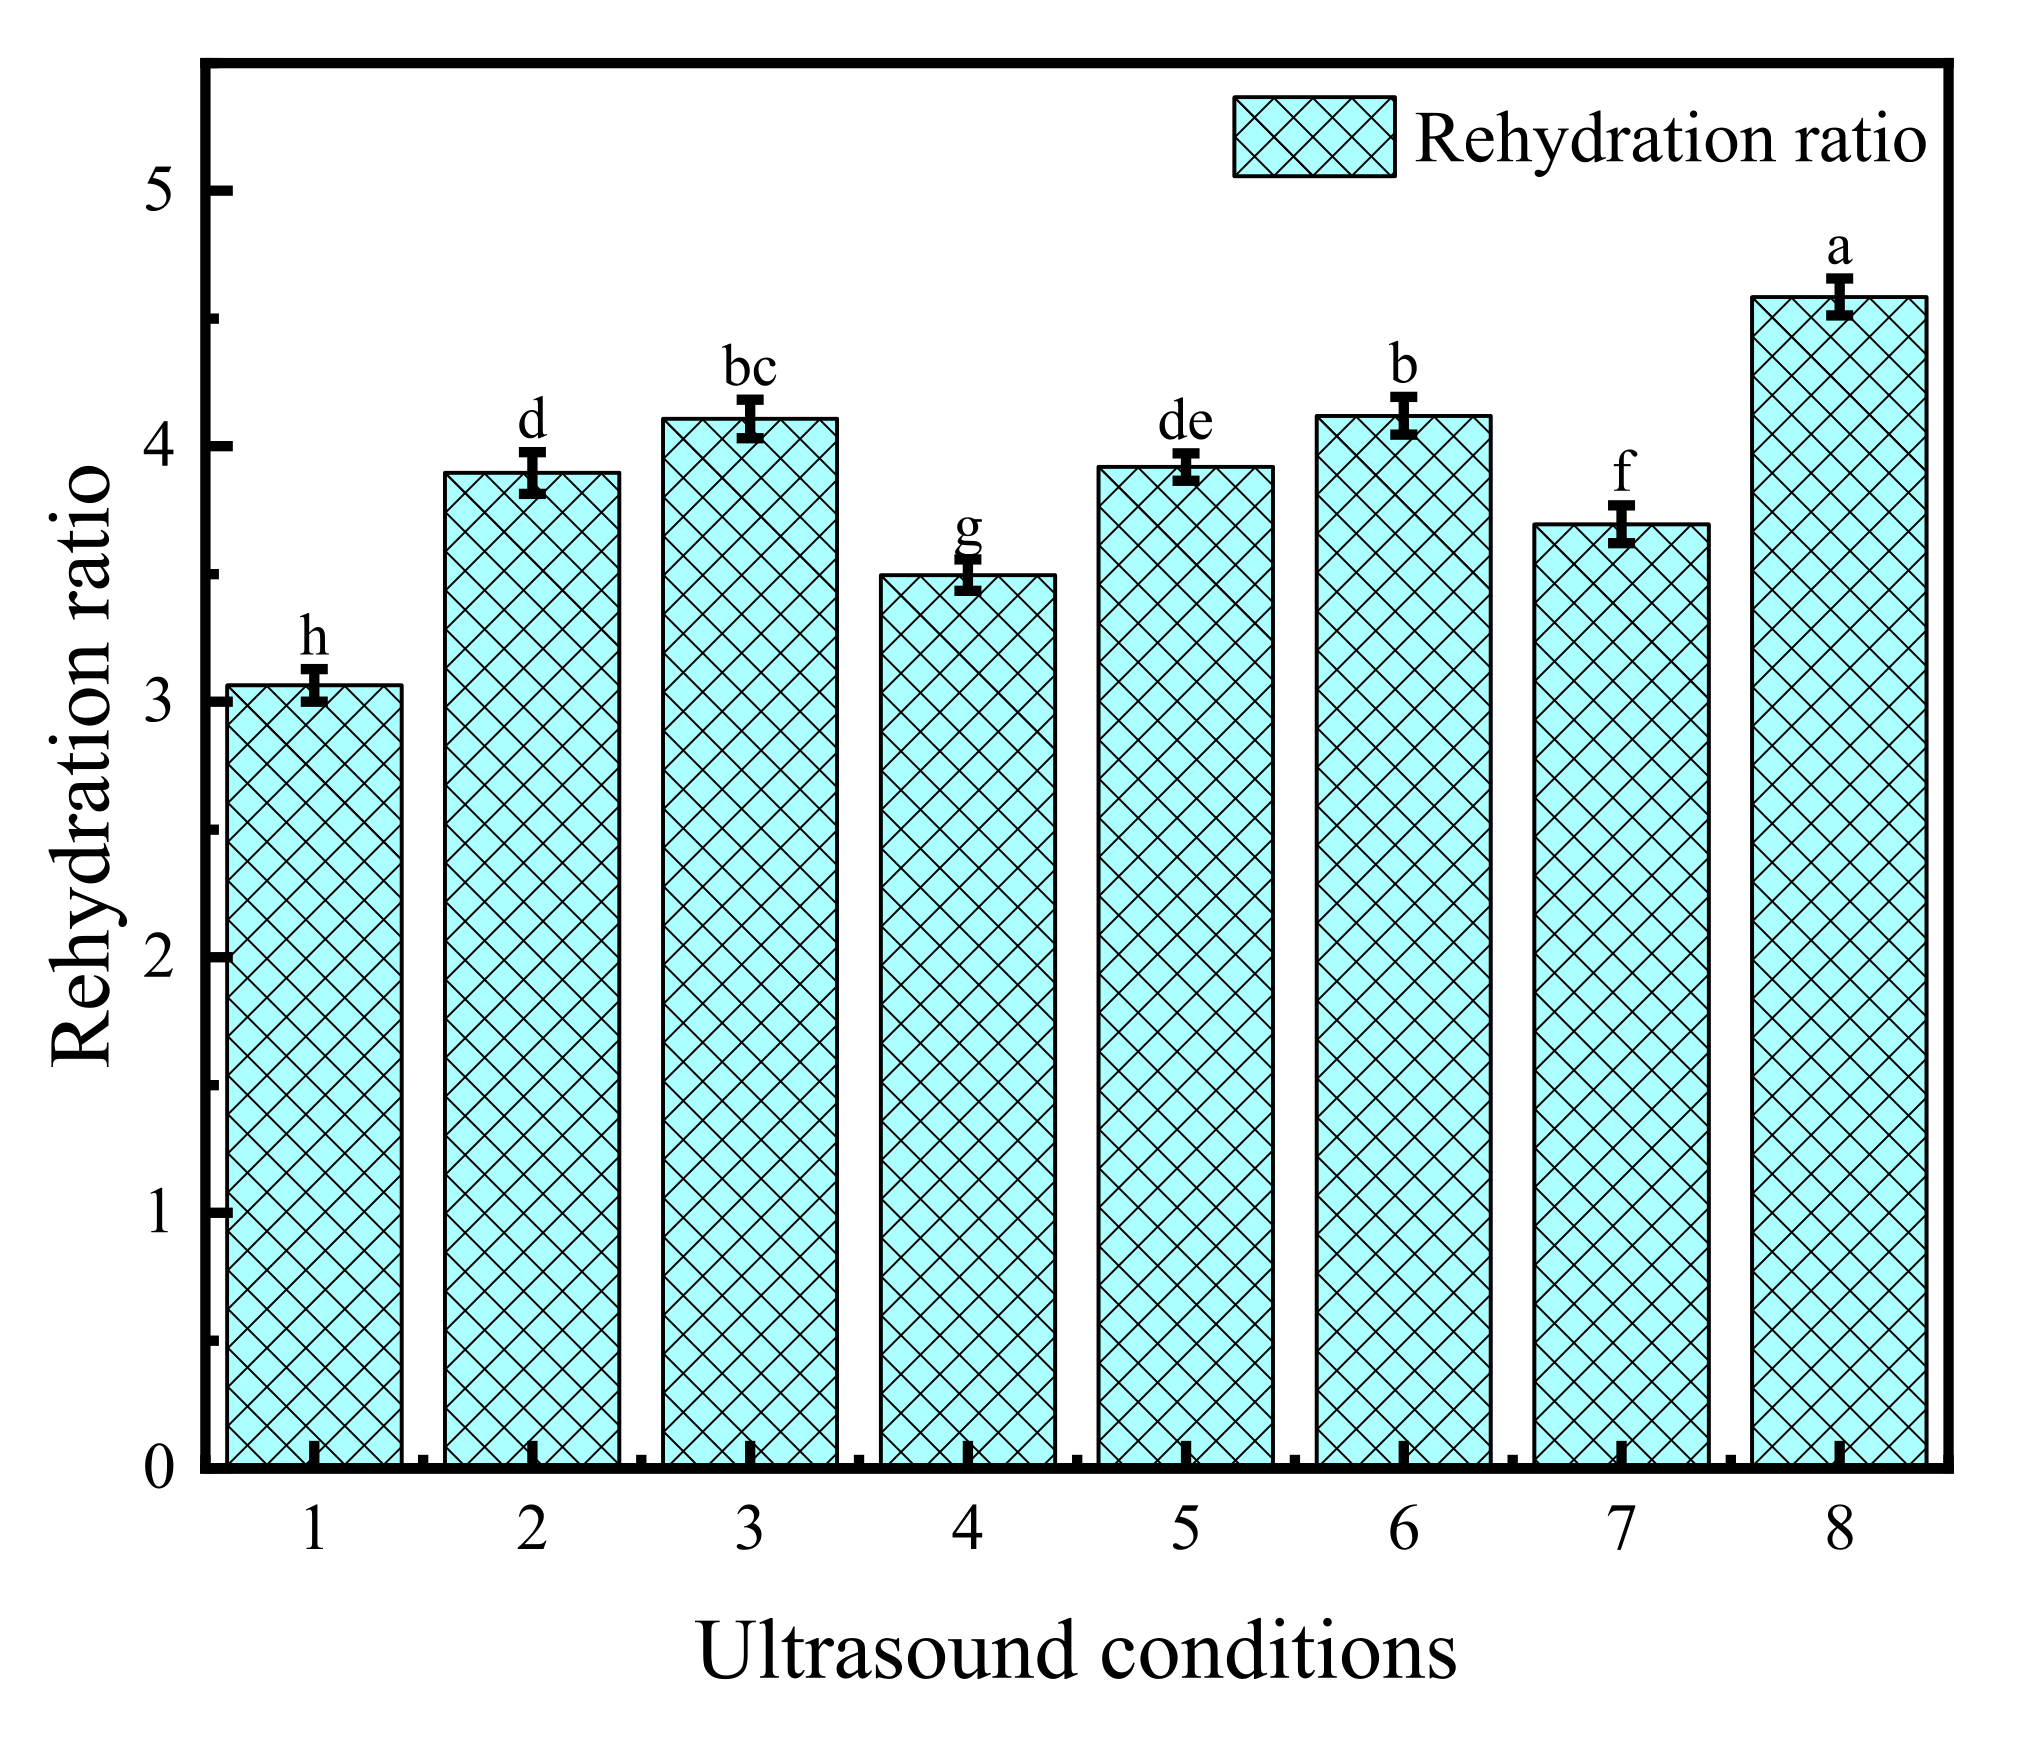
3.5. Rehydration Rate
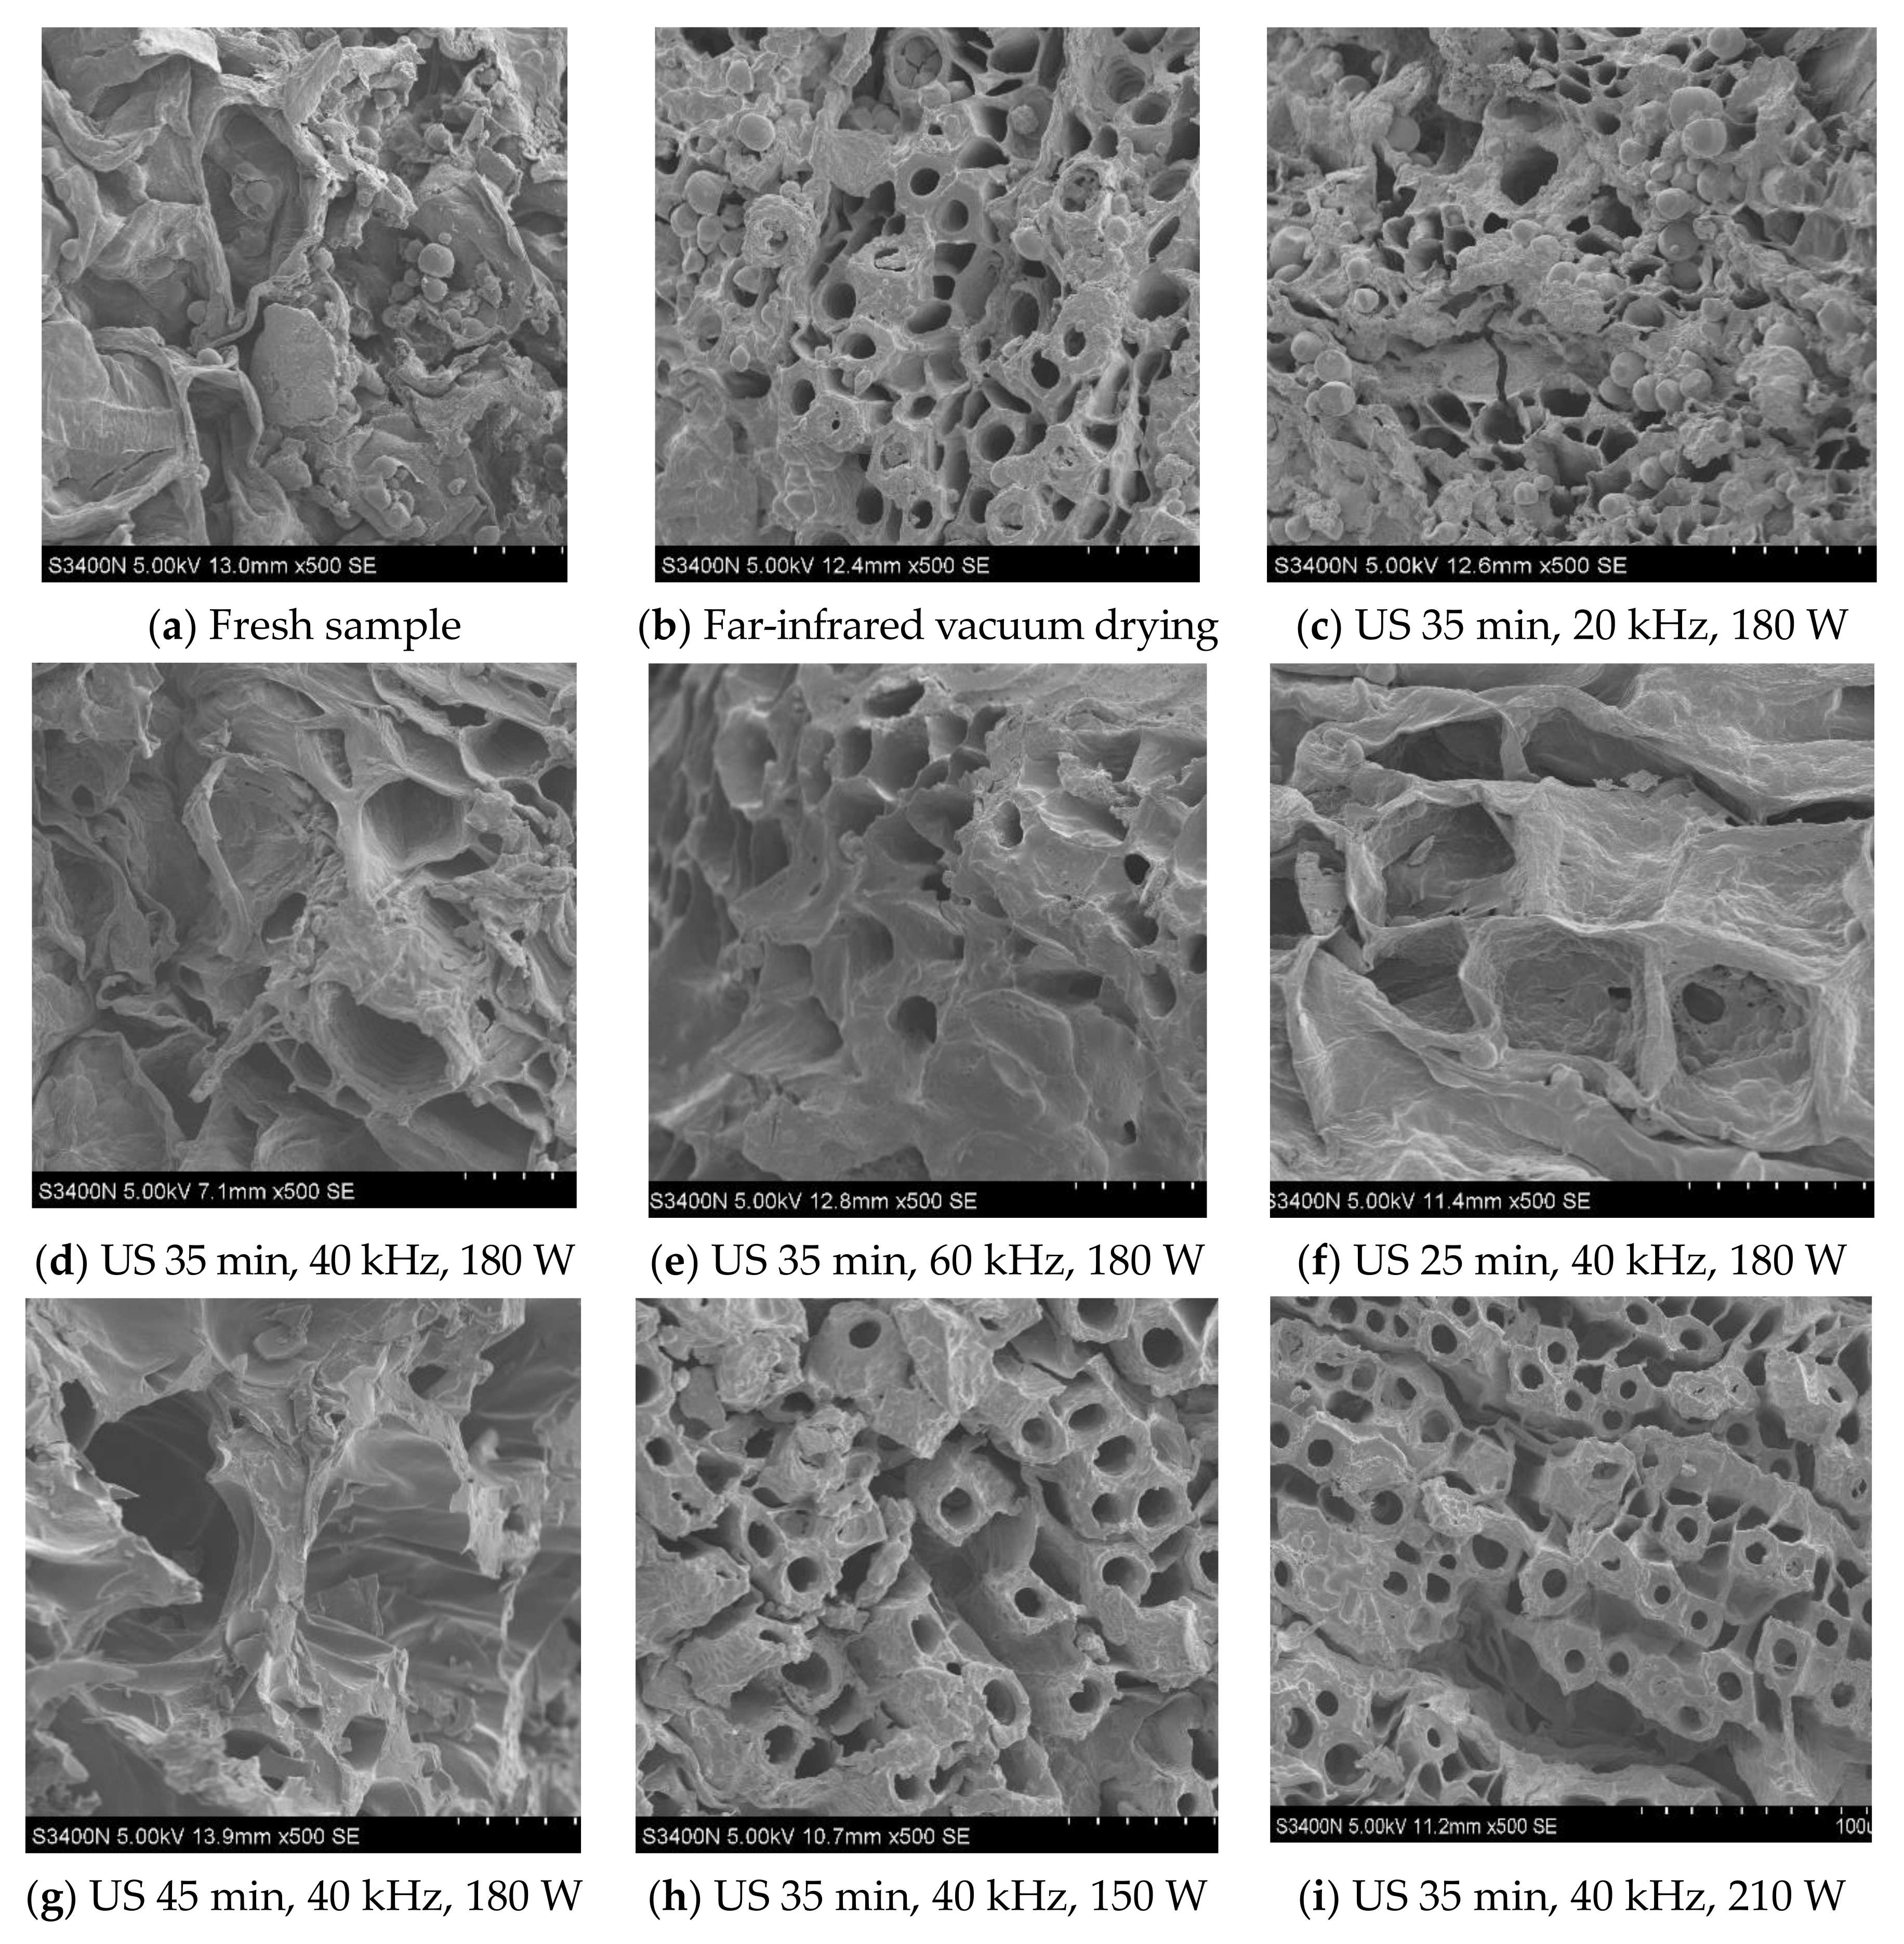
3.6. Microstructure
4. Entropy
5. Conclusions
Author Contributions
Funding
Institutional Review Board Statement
Informed Consent Statement
Data Availability Statement
Acknowledgments
Conflicts of Interest
References
- Piwowarczyk, R.; Carlon, L.; Kasińska, J.; Tofil, S.; Furmańczyk, P. Micromorphological intraspecific differentiation of nectar guides and landing platform for pollinators in the iberian parasitic plant Cistanche phelypa (Orobanchaceae). Bot. Lett. 2015, 163, 47–55. [Google Scholar] [CrossRef]
- Wang, T.; Zhang, X.; Xie, W. Cistanche deserticola Y. C. Ma, “Desert Ginseng”: A Review. Am. J. Chin. Med. 2012, 40, 1123–1141. [Google Scholar] [CrossRef] [PubMed]
- Luo, Z.; Qing, D.; Sun, Y.; Xu, X.; Zhang, J.; Wang, Z. Development and patent analysis of Cistanche health food. Northwest Pharm. J. 2020, 35, 940–944. [Google Scholar] [CrossRef]
- Zhu, K.; Zhao, Q.; Tian, Y.; Gu, R.; Xu, Z.; Fang, H.; Liu, W.; Huang, W.; Ding, G.; Xiao, W. Hypoglycemic and hypolipidemic effects of total glycosides of Cistanche tubulosa in diet/streptozotocin-induced diabetic rats. J. Ethnopharmacol. 2021, 276, 113991. [Google Scholar] [CrossRef] [PubMed]
- Zhang, H.; Zhou, X.; Duan, X.; Jiang, J.; Xing, Y.; Zhu, C.; Song, Q.; Yu, Q. Antitumor and anti-inflammatory effects of oligosaccharides from Cistanche deserticola extract on spinal cord injury. Int. J. Biol. Macromol. 2018, 124, 360–367. [Google Scholar] [CrossRef] [PubMed]
- Fu, Z.; Han, L.; Zhang, P.; Mao, H.; Zhang, H.; Wang, Y.; Gao, X.; Liu, E. Cistanche polysaccharides enhance echinacoside absorption in vivo and affect the gut microbiota. Int. J. Biol. Macromol. 2020, 149, 732–740. [Google Scholar] [CrossRef] [PubMed]
- Pekke, M.A.; Pan, Z.L.; Atungulu, G.G.; Smith, G.; Thompson, J.F. Drying characteristics and quality of bananas under infrared radiation heating. Int. J. Agric. Biol. Eng. 2013, 6, 58–70. [Google Scholar] [CrossRef]
- Wu, X.; Zhang, M.; Bhandari, B. A novel infrared freeze drying (IRFD) technology to lower the energy consumption and keep the quality of Cordyceps militaris. Innov. Food Sci. Emerg. Technol. 2019, 54, 34–42. [Google Scholar] [CrossRef] [Green Version]
- Ghaboos, S.H.H.; Ardabili, S.M.S.; Kashaninejad, M.; Asadi, G.; Aalami, M. Combined infrared-vacuum drying of pumpkin slices. J. Food Sci. Technol. 2016, 53, 2380–2388. [Google Scholar] [CrossRef] [PubMed] [Green Version]
- Xie, L.; Mujumdar, A.S.; Zhang, Q.; Wang, J.; Liu, S.; Deng, L.; Wang, D.; Xiao, H.; Liu, Y.; Gao, Z. Pulsed vacuum drying of wolfberry: Effects of infrared radiation heating and electronic panel contact heating methods on drying kinetics, color profile, and infrared radiation heating and electronic panel contact heating methods on drying kinetics, color profile, and volatile compounds. Dry. Technol. 2017, 35, 1312–1326. [Google Scholar] [CrossRef]
- Fakhreddin, S.; Mahdi, K. Modeling of moisture loss kinetics and color changes in the surface of lemon slice during the combined infrared-vacuum drying. Inf. Process. Agric. 2018, 5, 516–523. [Google Scholar] [CrossRef]
- Souza da Silva, E.; Rupert Brandão, S.C.; Lopes da Silva, A.; Fernandes da Silva, J.H.; Duarte Coêlho, A.C.; Azoubel, P.M. Ultrasound-assisted vacuum drying of nectarine. J. Food Eng. 2019, 246, 119–124. [Google Scholar] [CrossRef]
- Xu, B.; Wang, L.; Wei, B.; Zeng, R. Low frequency ultrasound pre-treatment of carrot slices: Effect on the moisture migration and quality attributes by intermediate-wave infrared radiation drying. Ultrason. Sonochem. 2018, 40, 619–628. [Google Scholar] [CrossRef]
- Santacatalina, J.V.; Rodríguez, O.; Simal, S.; Cárcel, J.A.; Mule, A.; García-Pérez, J.V. Ultrasonically enhanced low-temperature drying of apple: Influence on drying kinetics and antioxidant potential. J. Food Eng. 2014, 138, 35–44. [Google Scholar] [CrossRef]
- Jambrak, A.R.; Mason, T.J.; Paniwnyk, L.; Lelas, V. Accelerated drying of button mushrooms, brussels sprouts and cauliflower by applying power. J. Food Eng. 2007, 81, 88–97. [Google Scholar] [CrossRef]
- Villamiel, M.; Gamboa, J.; Soria, A.C.; Riera, E.; García-Pérez, J.V.; Montilla, A. Impact of power ultrasound on the quality of fruits and vegetables during dehydration. Phys. Procedia 2015, 70, 828–832. [Google Scholar] [CrossRef] [Green Version]
- Dehsheikh, F.N.; Dinani, S.T. Coating pre-treatment of banana slices using carboxymethyl cellulose in an ultrasonic system before convective drying. Ultrason. Sonochem. 2019, 49, 401–413. [Google Scholar] [CrossRef]
- American Association of Cereal Chemists; Approved Methods Committee. Approved Methods of the American Association of Cereal Chemists, 9th ed.; AACC: Saint Paul, MN, USA, 1995. [Google Scholar]
- Carsky, M. Design of a dryer for citrus peels. J. Food Eng. 2008, 87, 40–44. [Google Scholar] [CrossRef]
- National Pharmacopoeia Commission. Chinese Pharmacopoeia, 11th ed.; China Medical Science and Technology Press: Beijing, China, 2020.
- Ge, L.; Yao, Y.; Kang, T.; Li, J.; He, H.; Yang, D.; Li, M. Antioxidant capacity, changes of main active substances and isolation and identification of volatile components in forsythia suspense flowers at different harvest stages. Cao Ye Xue Bao 2017, 26, 66–74. [Google Scholar] [CrossRef]
- Zhang, Z.; Li, L.; Li, D.; Liu, C.; Jiang, N.; Nie, M.; Wang, X. Vacuum microwave drying characteristics and kinetic model of lotus root tablets. Jiangsu Agric. Sci. 2019, 47, 201–205. [Google Scholar] [CrossRef]
- Afzal, T.M.; Abe, T. Diffusion in potato during far infrared radiation drying. J. Food Eng. 1998, 37, 353–365. [Google Scholar] [CrossRef]
- Afolabi, T.J.; Tunde-Akintunde, T.A.; Adeyanju, J.A. Mathematical modeling of drying kinetics of untreated and pretreated cocoyam slices. J. Food Sci. Technol. 2014, 52, 31–2740. [Google Scholar] [CrossRef] [PubMed]
- Crank, J. The Mathematic of Diffusion; Clarendon Press: Oxford, UK, 1975. [Google Scholar]
- Wang, Y.; Zhou, Q.; Zhang, X.; Zhang, Z.; Zheng, W. Simultaneous determination of eight components in rehmannia glutinosa and different processed products by HPLC. J. Chin. Med. Mater. 2021, 1, 64–68. [Google Scholar] [CrossRef]
- Dubois, M.; Gilles, K.A.; Hamilton, J.K.; Rebers, P.A.; Smith, F. Colorimetric method for determination of sugars and related substances. Anal. Chem. 1956, 28, 350–356. [Google Scholar] [CrossRef]
- Beato, V.M.; Orgaz, F.; Mansilla, F.; Montaño, A. Changes in phenolic compounds in garlic (Alium sativum L.) owing to the cultivar and location of growth. Plant Foods Hum. Nutr. 2011, 66, 218–223. [Google Scholar] [CrossRef] [PubMed]
- Nencini, C.; Menchiari, A.; Franchi, G.G.; Micheli, L. In vitro antioxidant activity of aged extracts of some italian allium species. Plant Foods. Hum. Nutr. 2011, 66, 11–16. [Google Scholar] [CrossRef]
- Lay, M.; Karsani, S.; Mohajer, S.; Malek, S.A. Phytochemical constituents, nutritional values, phenolics, flavonols, flavonoids, antioxidant and cytotoxicity studies on Phaleria macrocarpa (Scheff.) Boerl fruits. BMC Complement. Altern. Med. 2014, 14, 1187–1198. [Google Scholar] [CrossRef] [PubMed] [Green Version]
- Salehi, F.; Kashaninejad, M. Effect of drying methods on rheological and textural properties, and color changes of wild sage seed gum. J. Food Sci. Technol. 2015, 52, 7361–7368. [Google Scholar] [CrossRef]
- Doymaz, I. Effect of citric acid and blanching pre-treatments on drying and rehydration of amasya red apples. Food Bioprod. Process. 2010, 88, 124–132. [Google Scholar] [CrossRef]
- Nowacka, M.; Tylewicz, U.; Laghi, L.; Dalla Rosa, M.; Witrowa-Rajchertet, D. Effect of ultrasound treatment on the water state in kiwifruit during osmotic dehydration. Food Chem. 2014, 144, 18–25. [Google Scholar] [CrossRef]
- García-Pérez, J.V.; Cárcel, J.A.; Riera, E.; Mulet, A. Influence of the applied acoustic energy on the drying of carrots and lemon peel. Dry. Technol. 2009, 27, 281–287. [Google Scholar] [CrossRef]
- Luangmalawat, P.; Prachayawarakorn, S.; Nathakaranakule, A.; Soponronnarit, S. Effect of temperature on drying characteristics and quality of cooked rice. LWT Food Sci. Technol. 2008, 41, 716–723. [Google Scholar] [CrossRef]
- Azoubel, P.; do Amparo Melo Baima, M.; Amorim, M.; Oliveira, S. Effect of ultrasound on banana cv Pacovan drying kinetics. J. Food Eng. 2010, 97, 194–198. [Google Scholar] [CrossRef]
- Fuente-Blanco, S.; Sarabia, E.; Acosta-Aparicio, V.; Blanco-Blanco, A.; Gallego-Juárez, J. Food drying process by power ultrasound. Ultrasonics 2006, 44, e523–e527. [Google Scholar] [CrossRef] [PubMed]
- Liu, Y.; Sun, Y.; Yu, H.; Yin, Y.; Li, X.; Duan, X. Hot air drying of purple-fleshed sweet potato with contact ultrasound assistance. Dry. Technol. 2017, 35, 564–576. [Google Scholar] [CrossRef]
- Yao, Z.; Lemaguer, M. Mathematical modelling and simulation of mass transfer in osmotic dehydration processes. 1. Conceptual and mathematical models. Nurs. Clin. North Am. 1996, 8, 575–586. [Google Scholar] [CrossRef]
- Chemat, F.; Huma, Z.; Khan, M.K. Applications of ultrasound in food technology: Processing, preservation and extraction. Ultrason. Sonochem. 2011, 18, 813–835. [Google Scholar] [CrossRef] [PubMed]
- Altay, K.; Hayaloglu, A.A.; Dirim, S.N. Determination of the drying kinetics and energy efficiency of purple basil (Ocimum basilicum L.) leaves using different drying methods. Heat Mass Transf. 2019, 55, 2173–2184. [Google Scholar] [CrossRef]
- Darvishi, H.; Najafi, G.; Hosainpour, A.; Khodaei, J.; Aazdbakht, M. Far-infrared drying characteristics of mushroom slices. Chem. Prod. Process Model. 2013, 8, 107–117. [Google Scholar] [CrossRef]
- Shi, J.; Pan, Z.; McHugh, T.H.; Wood, D.; Hirschberg, E.; Olson, D. Drying and quality characteristics of fresh and sugar-infused blueberries dried with infrared radiation heating. LWT Food Sci. Technol. 2008, 41, 1962–1972. [Google Scholar] [CrossRef]
- Liu, M.; Li, G.; Wang, H. Determination and dynamic changes of leonurine content in rehmannia glutinosa during nine steaming and nine sunning processing. Chin. Pharm. J. 2009, 44, 658–660. [Google Scholar]
- Fu, Z.; Fan, X.; Wang, X.; Gao, X. Cistanches herba: An overview of its chemistry, pharmacology, and pharmacokinetics property. J. Ethnopharmacol. 2017, 219, 233–247. [Google Scholar] [CrossRef] [PubMed]
- Fei, P.; Chen, L.; Yang, W.; Zhao, L.; Fang, Y.; Ma, N.; Hu, Q. Comparison of osmotic dehydration and ultrasound-assisted osmotic dehydration on the state of water, texture, and nutrition of Agaricus bisporus. CyTA J. Food. 2018, 16, 181–189. [Google Scholar] [CrossRef] [Green Version]
- Boateng, I.D.; Yang, X.M.; Li, Y.Y. Optimization of infrared-drying parameters for ginkgo bilobal seed and evaluation of product quality and bioactivity. Ind. Crops Prod. 2020, 160, 108–113. [Google Scholar] [CrossRef]
- Ren, F.; Perussello, C.A.; Zhang, Z.; Kerry, J.P.; Tiwari, B.K. Impact of ultrasound and blanching on functional properties of hot-air dried and freeze dried onions. LWT Food Sci. Technol. 2018, 87, 102–111. [Google Scholar] [CrossRef] [Green Version]
- Zhao, Y.; Zhu, H.; Xu, J.; Zhuang, W.; Tian, Y. Microwave vacuum drying of lotus (Nelumbo nucifera Gaertn.) seeds: Effects of ultrasonic. LWT Food Sci. Technol. 2021, 149, 111603. [Google Scholar] [CrossRef]
- Tekin, Z.H.; Baslar, M. The effect of ultrasound-assisted vacuum drying on the drying rate and quality of red peppers. J. Therm. Anal. Calorim. 2018, 132, 1131–1143. [Google Scholar] [CrossRef]
- Kahraman, O.; Malvandi, A.; Vargas, L.; Feng, H. Drying characteristics and quality attributes of apple slices dried by a non-thermal ultrasonic contact drying method. Ultrason. Sonochem. 2021, 73, 105510. [Google Scholar] [CrossRef] [PubMed]
- Rodríguez, Ó.; Santacatalina, J.V.; Simal, S.; Garcia-Perez, J.V.; Femenia, A.; Rosselló, C. Influence of power ultrasound application on drying kinetics of apple and its antioxidant and microstructural properties. J. Food Eng. 2014, 129, 21–29. [Google Scholar] [CrossRef]
- Brand-Williams, W.; Cuvelier, M.E.; Berset, C. Use of a free radical method to evaluate antioxidant activity. Lebensm. Wiss. Technol. 1995, 28, 25–30. [Google Scholar] [CrossRef]
- Rodríguez, S. Effect of acoustically assisted treatments on vitamins, antioxidant activity, organic acids and drying kinetics of pineapple. Ultrason. Sonochem. 2017, 35, 92–102. [Google Scholar] [CrossRef] [PubMed]
- Mrad, N.; Boudhrioua, N.; Kechaou, N.; Courtois, F.; Bonazzi, C. Influence of air drying temperature on kinetics, physicochemical properties, total phenolic content and ascorbic acid of pears. Food Bioprod. Process. 2012, 90, 433–441. [Google Scholar] [CrossRef]
- Fu, M.; Qu, Q.; Yang, X.; Zhang, X. Effect of intermittent oven drying on lipid oxidation, fatty acids composition and antioxidant activities of walnut. LWT Food Sci. Technol. 2016, 65, 1126–1132. [Google Scholar] [CrossRef]
- Nahimana, H.; Zhang, M. Shrinkage and color change during microwave vacuum drying of carrot. Dry. Technol. 2011, 29, 836–847. [Google Scholar] [CrossRef]
- Song, Y.; Jin, X.; Bi, J.; Lv, J.; Li, X. Effect of ultrasonic assisted osmotic treatment on the quality of peach slices dried by hot air and vacuum freeze drying. Mod. Food Sci. Technol. 2020, 41, 177–185. [Google Scholar]
- Ahmed, J.; Shivhare, U.S.; Sandhu, K.S. Thermal degradation kinetics of carotenoids and visual color of papaya puree. J. Food Sci. 2002, 67, 2692–2695. [Google Scholar] [CrossRef]
- Chen, Y.; Li, M.; Dharmasiri, T.S.K.; Song, X.; Liu, F.; Wang, X. Novel ultrasonic-assisted vacuum drying technique for dehydrating garlic slices and predicting the quality properties by low field nuclear magnetic resonance. Food Chem. 2019, 306, 125625. [Google Scholar] [CrossRef] [PubMed]
- Mothibe, K.; Zhang, M.; Nsor-atindana, J.; Wang, Y. Use of ultrasound pre-treatment in drying of fruits: Drying rates, quality attributes and shelf life extension. Dry. Technol. 2011, 29, 1611–1621. [Google Scholar] [CrossRef]
- Mothibe, K.J.; Zhang, M.; Mujumdar, A.S.; Wang, Y.; Cheng, X. Effects of ultrasound and microwave pre-treatments of apple before spouted bed drying on rate of dehydration and physical properties. Dry. Technol. 2014, 32, 1848–1856. [Google Scholar] [CrossRef]
- Cárcel, J.; García-Pérez, J.; Riera, E. Influence of high-intensity ultrasound on drying kinetics of persimmon. Dry. Technol. 2007, 25, 185–193. [Google Scholar] [CrossRef]
- Schulze, B.; Hubbermann, E.V.; Schwarz, K. Stability of quercetin derivatives in vacuum impregnated apple slices after drying (microwave vacuum drying, air drying, and freeze drying) and storage. LWT Food Sci. Technol. 2014, 57, 426–433. [Google Scholar] [CrossRef]
- Zhang, L.; Liao, L.; Qiao, Y.; Wang, C.; Shi, D.; An, K.; Hu, J. Effects of ultrahigh pressure and ultrasound pretreatments on properties of strawberry chips prepared by vacuum-freeze drying. Food Chem. 2020, 303, 125386. [Google Scholar] [CrossRef] [PubMed]
- Nijkamp, P. Stochastic quantitative and qualitative multicriteria analysis for environmental design. Pap. Reg. Sci. Assoc. 1997, 39, 175–199. [Google Scholar] [CrossRef]


| Experimental Number | US Treatment Time (Min) | US Frequency (kHz) | US Power (W) |
|---|---|---|---|
| 1 | 0 | 0 | 0 |
| 2 | 25 | 40 | 180 |
| 3 | 35 | 40 | 180 |
| 4 | 45 | 40 | 180 |
| 5 | 35 | 20 | 180 |
| 6 | 35 | 60 | 180 |
| 7 | 35 | 40 | 150 |
| 8 | 35 | 40 | 210 |
| US Treatment Time (Min) | US Frequency (kHz) | US Power (W) | Effective Moisture Diffusivity Deff × 10−8 (m2/s) |
|---|---|---|---|
| 0 | 0 | 0 | 1.71886 |
| 25 | 40 | 180 | 1.92217 |
| 35 | 40 | 180 | 2.02512 |
| 45 | 40 | 180 | 2.39274 |
| 35 | 20 | 180 | 1.61122 |
| 35 | 60 | 180 | 2.05954 |
| 35 | 40 | 150 | 1.88246 |
| 35 | 40 | 210 | 2.36791 |
| Sample | Phenylethanol Glycoside Composition (mg) | Iridoid Composition (mg) | ||||||
|---|---|---|---|---|---|---|---|---|
| Echinacoside | Rhodioloside | Poliumoside | Verbascoside | Isoacteoside | Geniposidic Acid | Leonurusoside | Catalpol | |
| un-sonicated | 42.24 ± 4.74 gh | 3.33 ± 0.20 d | 494.64 ± 6.45 def | 46.55 ± 0.85 f | 13.43 ± 0.44 g | 242.75 ± 6.11 bc | 15.40 ± 0.77 a | 21.40 ± 0.77 h |
| US 25 min, 40 kHz, 180 W | 59.28 ± 3.88 bcd | 2.29 ± 0.23 ef | 510.88 ± 16.45 d | 48.34 ± 0.41 e | 26.18 ± 0.58 d | 231.59 ± 5.94 cde | 9.43 ± 0.85 cd | 35.51 ± 0.92 f |
| US 35 min, 40 kHz, 180 W | 64.24 ± 2.83 bc | 4.51 ± 0.28 b | 544.38 ± 14.10 bc | 57.28 ± 0.76 c | 33.32 ± 0.95 b | 220.60 ± 6.24 efg | 11.57 ± 0.35 b | 60.20 ± 0.77 b |
| US 45 min, 40 kHz, 180 W | 44.87 ± 3.74 g | 2.66 ± 0.18 e | 483.19 ± 15.02 defgh | 43.43 ± 0.38 h | 6.17 ± 0.44 h | 263.29 ± 5.63 a | 7.12 ± 0.45 g | 33.28 ± 0.90 g |
| US 35 min, 20 kHz, 180 W | 57.40 ± 5.98 cde | 2.20 ± 0.14 fg | 494.45 ± 14.55 defg | 46.12 ± 0.29 fg | 15.29 ± 0.89 f | 224.36 ± 6.91 ef | 8.55 ± 0.22 def | 46.59 ± 0.89 d |
| US 35 min, 60 kHz, 180 W | 67.54 ± 6.53 b | 0.72 ± 0.04 h | 556.78 ± 23.11 b | 60.34 ± 0.68 b | 32.08 ± 0.70 bc | 242.05 ± 9.93 ncd | 10.29 ± 0.30 c | 62.35 ± 0.92 a |
| US 35 min, 40 kHz, 150 W | 54.73 ± 2.29 def | 3.96 ± 0.39 c | 497.36 ± 13.49 de | 51.99 ± 0.29 d | 24.65 ± 0.98 e | 191.16 ± 6.49 h | 8.78 ± 0.88 de | 44.29 ± 0.94 e |
| US 35 min,40 kHz, 210 W | 79.63 ± 7.52 a | 6.48 ± 0.34 a | 629.66 ± 16.45 a | 65.34 ± 0.88 a | 44.07 ± 0.79 a | 250.38 ± 8.63 b | 7.02 ± 0.16 gh | 52.04 ± 0.97 c |
| Sample | L* | a* | b* | ∆E* |
|---|---|---|---|---|
| Fresh | 61.26 ± 2.15 a | 3.89 ± 0.46 h | 24.6 ± 0.64 h | - |
| un-sonicated | 46.47 ± 3.47 cdefgh | 10.48 ± 0.31 a | 31.07 ± 0.29 a | 17.44 ± 3.65 a |
| US 25 min, 40 kHz, 180 W | 46.97 ± 1.27 cde | 9.21 ± 0.76 b | 30.84 ± 0.35 ab | 16.48 ± 1.52 abc |
| US 35 min, 40 kHz, 180 W | 47.23 ± 1.58 cd | 8.49 ± 0.30 bcde | 29.86 ± 0.88 abcd | 15.65 ± 1.83 abcde |
| US 45 min, 40 kHz, 180 W | 52.05 ± 0.66 b | 5.5 ± 0.21 h | 27.66 ± 0.71 g | 9.84 ± 0.99 gh |
| US 35 min, 20 kHz, 180 W | 46.52 ± 1.93 cdefg | 8.54 ± 0.51 bcd | 29.17 ± 1.43 def | 16.12 ± 2.45 abcd |
| US 35 min, 60 kHz, 180 W | 46.92 ± 3.06 cdef | 8.37 ± 0.28 bcdef | 26.35 ± 0.47 h | 15.13 ± 3.10 abcdef |
| US 35 min, 40 kHz, 150 W | 46.34 ± 2.87 cdefgh | 9.17 ± 0.77 bc | 30.81 ± 0.95 abc | 16.94 ± 3.12 abcdef |
| US 35 min, 40 kHz, 210 W | 49.13 ± 2.11 bc | 8.31 ± 0.28 bcdefg | 29.28 ± 0.34 de | 13.73 ± 2.15 abcdefg |
| US Treatment Time (Min) | US Frequency (kHz) | US Power (W) | Evaluation Weight | Rank |
|---|---|---|---|---|
| 0 | 0 | 0 | 0.08 | 6 |
| 25 | 40 | 180 | 0.11 | 4 |
| 35 | 40 | 180 | 0.19 | 2 |
| 45 | 40 | 180 | 0.03 | 8 |
| 35 | 20 | 180 | 0.07 | 7 |
| 35 | 60 | 180 | 0.15 | 3 |
| 35 | 40 | 150 | 0.10 | 5 |
| 35 | 40 | 210 | 0.27 | 1 |
Publisher’s Note: MDPI stays neutral with regard to jurisdictional claims in published maps and institutional affiliations. |
© 2022 by the authors. Licensee MDPI, Basel, Switzerland. This article is an open access article distributed under the terms and conditions of the Creative Commons Attribution (CC BY) license (https://creativecommons.org/licenses/by/4.0/).
Share and Cite
Jiang, C.; Wan, F.; Zang, Z.; Zhang, Q.; Ma, G.; Huang, X. Effect of an Ultrasound Pre-Treatment on the Characteristics and Quality of Far-Infrared Vacuum Drying with Cistanche Slices. Foods 2022, 11, 866. https://doi.org/10.3390/foods11060866
Jiang C, Wan F, Zang Z, Zhang Q, Ma G, Huang X. Effect of an Ultrasound Pre-Treatment on the Characteristics and Quality of Far-Infrared Vacuum Drying with Cistanche Slices. Foods. 2022; 11(6):866. https://doi.org/10.3390/foods11060866
Chicago/Turabian StyleJiang, Chunhui, Fangxin Wan, Zepeng Zang, Qian Zhang, Guojun Ma, and Xiaopeng Huang. 2022. "Effect of an Ultrasound Pre-Treatment on the Characteristics and Quality of Far-Infrared Vacuum Drying with Cistanche Slices" Foods 11, no. 6: 866. https://doi.org/10.3390/foods11060866