Polyphasic chemical and physical analysis approaches are now more common than single-parameter descriptions (i.e., dry matter, total protein, salt content) [
36] to decipher cheese composition profiles. This is reinforced by the fact that cheese characterization, based on general chemical parameters, does not efficiently discriminate cheese geographical origin, as recently shown for water buffalo mozzarella by Salzano and colleagues [
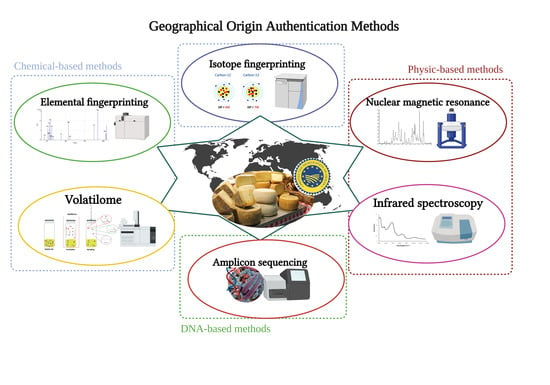
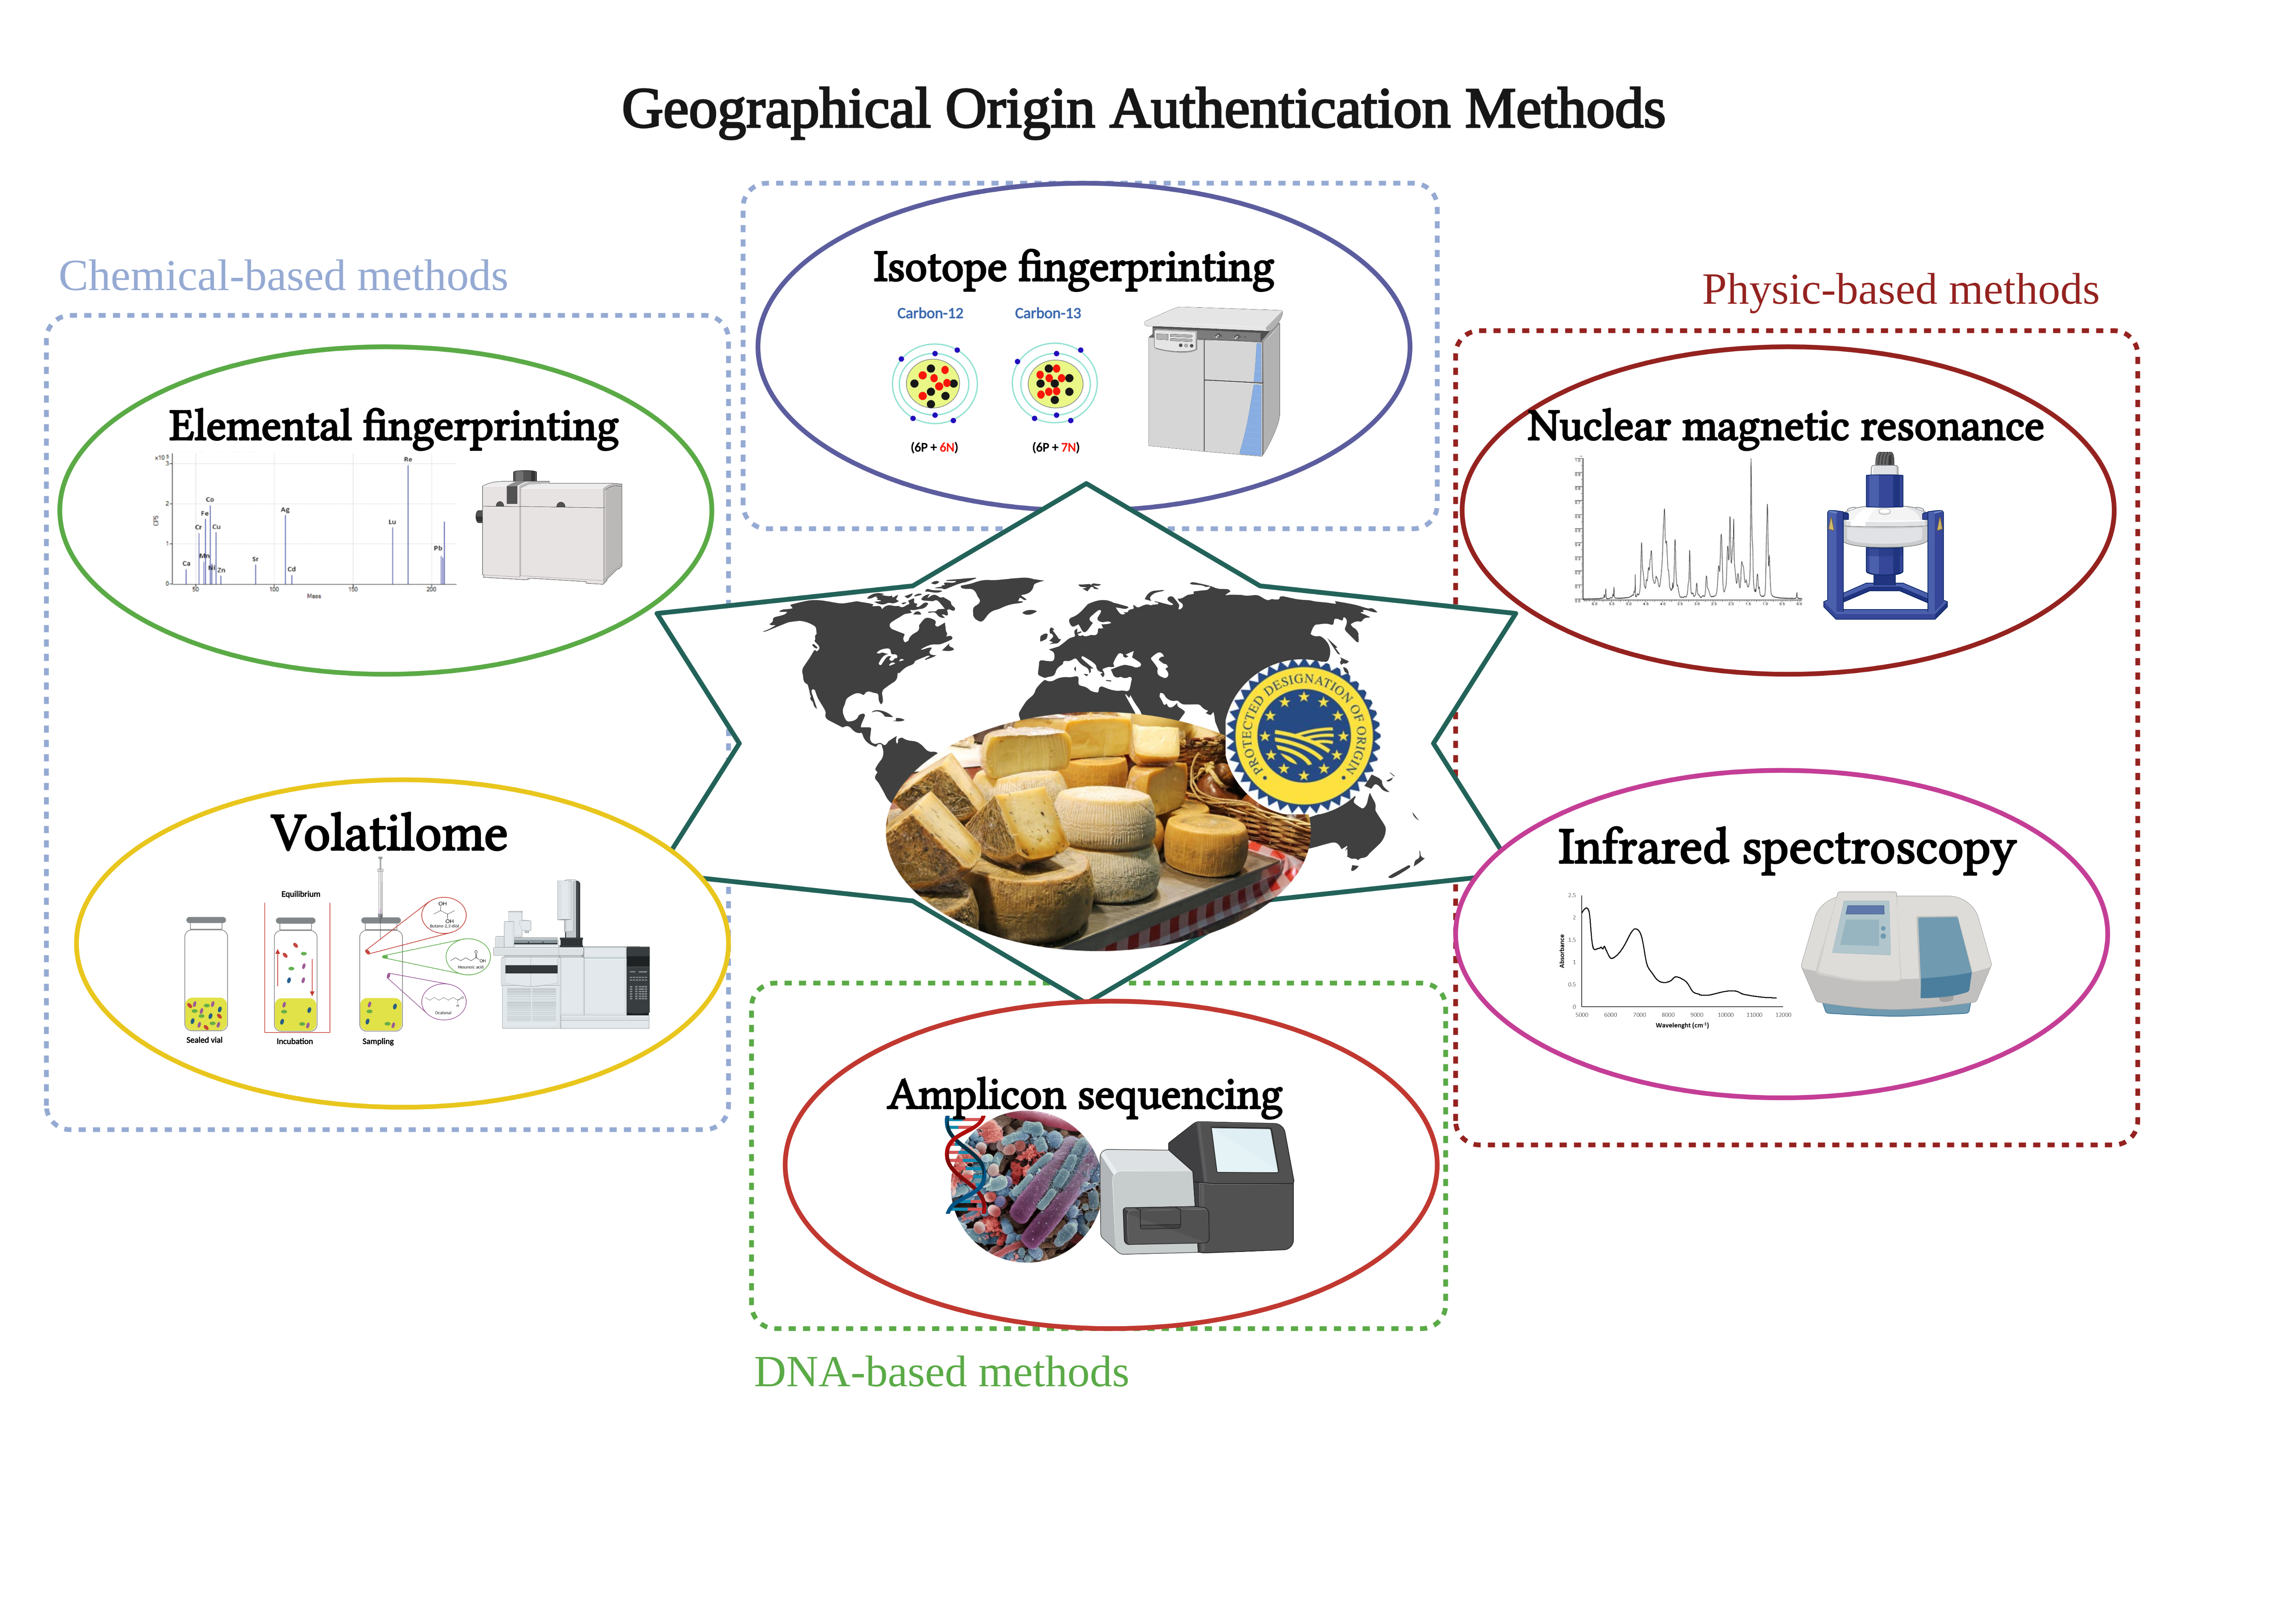
37]. That is why multiple signals are analyzed to acquire specific insight into typical cheese characteristics connected with its origin. Isotope and trace element fingerprinting methods have been considered as reference methods; however, other chemical and physical analyses can be used for geographical origin authentication.
2.1. Stable Isotope Ratio Mass Spectrometry
Stable isotope ratio mass spectrometry (IRMS) is among the most common methods for food geographical origin authentication [
3]. It detects natural isotopic abundance of light and heavy stable isotopes, which mostly depend on climatic or geographical conditions (mainly latitude and altitude). The stable isotope ratio is also affected by biological and environmental interactions, and thus geographical product origins can be differentiated even if these have a high degree of similarity. Elements are called isotopes when their atoms are made by the same number of protons but a different number of neutrons, yielding a different atomic mass than the normal element [
38]. Stable isotopes are non-radioactive isotopes and do not decay rapidly to form other elements.
Usually, stable isotope analysis is expressed as a ratio using an international standard to calculate it (Equation (1)):
where R is the ratio between heavy and light isotopes [
39]. The results of stable isotope ratios are always expressed as a percentage (‰—per mille unit) of international standard samples received from international organizations such as Vienna-Pee Dee Belemnite (V-PDB) for δ
13C, Aria (AIR) for δ
15N, Vienna—Standard Mean Ocean Water (V-SMOW) for δ
2H and δ
18O, and Vienna—Canyon DiabloTriolite (V-CDT) for δ
34S [
40].
IRMS has been widely used for cheese origin authentication [
41,
42,
43] and many stable and unstable isotope ratios have been investigated. Among them,
13C/
12C, 15N/14N,
2H/H,
18O/
16O, and
34S/
32S elements are the most commonly used, while
87Sr/
86Sr,
44Ca/
40Ca,
44Ca/
42Ca, and
206Pb/
204Pb are occasionally reported [
38,
44]. For cheese authentication, IRMS is based on predictable and reproducible responses of stable isotopes to typical factors such as geographical origin, animal origin, seasonality, and manufacturing processes [
38]. Animal feed was shown to have the highest impact on δ
13C and δ
15N, while δ
2H is heavily influenced by the animal diet, and its combination with δ
18O is mainly impacted by geographical origin and seasonality [
38,
41]. δ
34S is mostly linked to geographical origin, i.e., soil geology, and it is not correlated with other stable isotope ratios [
45]. On the contrary, further studies are still needed to gauge the effect of cheese-making on stable isotope ratios [
38] as different results on these ratios in milk and cheese have been reported. They suggested either no major difference between milk and cheese obtained after milk processing [
41,
43] or a partial impact [
34,
42]. Considering isotope abundances in different organic macromolecules, the casein fraction has been reported to be the most reliable for origin authentication [
39].
In general, possible effects of the cheese-making process on stable isotope ratios could be related to fat removal (in particular, the glycerol fraction), curd acidification, curd clotting (e.g., use of a commercial starter vs. natural milk cultures), curd washing, curd heat treatment (e.g., 50 °C), and salt washing/brining, while ripening time has not yet been reported to impact their composition [
38,
46]. For the casein stable isotope ratio of milk, the corresponding cheese did not show any significant differences for δ
13C, δ
15N, and δ
2H, but an unexplained and significant difference (
p < 0.001) was reported for δ
18O in typical pressed-cooked cheese [
41]. The authors suggested a relevant fractionation in the animal in comparison with the feed, but a lack of isotopic fractionation during cheese-making [
41]. However, Bontempo et al. [
34] obtained a different isotopic ratio comparing milk and corresponding Mozzarella di Bufala Campana PDO for δ
2H and δ
18O. Further studies on milk and corresponding cheeses obtained through different processes and technologies may provide additional insight into the eventual changes of stable isotope ratios during cheese-making.
Table 1 reports the advantages and limitations of stable isotope ratio mass spectrometry for cheese origin authentication.
From an applied point of view, IRMS was used to discriminate the origin of two typical mountain cheeses from Italy [
41]. The authors combined δ
13C, δ
15N, δ
2H, and δ
18O from the casein fraction to build a canonical discriminant model that, after cross-validation, was able to correctly classify 96% of the milk and cheese samples. In Brazil, Silva and colleagues [
42] analyzed δ
13C, δ
15N, δ
2H, and δ
18O from the water fraction of milk and cheese. After using the δ
2H and δ
18O in a linear regression model, they were able to discriminate milk and cheese samples according to their production area. In another study, Pillonel and colleagues [
48] showed that the combined measurement of δ
13C, δ
15N, δ
18O, and δ
34S/
32S of the casein fraction authenticated Swiss vs. French Raclette cheeses.
In summary, isotope fingerprinting has proven to be reliable for the geographical origin authentication of typical cheeses. It is worth noting that stable isotope ratio analyses are already used as a traceability tool for some PDO cheeses such as Grana Padano and Parmigiano Reggiano (Regulation (EU) No. 1151/2012, amendment 2017/C 358/10 and 2018/C 132/07). This method is also often combined with trace element determination using inductively coupled plasma-mass spectrometry (ICP-MS) or inductively coupled plasma-atomic emission spectroscopy (ICP-AES).
2.2. Inductively Coupled Plasma
Cheese elemental fingerprinting is also currently used for origin authentication using inductively coupled plasma methods (ICP-MS or ICP-AES). These analyses rely on electromagnetic plasma to induce atom ionization (MS) or excitation (AES), to detect the different elements. Four main steps, including sample introduction and aerosol generation, plasma ionization/excitation, signal discrimination, and detection are used in ICP-MS and ICP-AES [
44]. While MS analyzes ionized elements, AES detects light emitted by excited atoms. For cheese geographical origin authentication, ICP-MS is the preferred choice since it is a rapid, multi-element analysis able to quantify trace (ppm–ppb) or ultra-trace (ppb–ppq) elemental concentrations [
49]. As elemental composition is mainly affected by geological and pedological traits, multiple factors can affect the element content in cheese, such as animal breed, feed vegetation, drinking water, and mineral supplementation [
49,
50]. Possible effects of cheese-making on cheese elements could derive from the clotting agent, curd acidification, manufacturing equipment, curd washing, and salt washing/brining [
34,
51]. Indeed, some authors reported that exclusion of Cu
2+ and Zn
2+ in multivariate analysis was necessary since a high transfer rate of these elements from dairy equipment to cheese was expected [
52].
Table 2 reports the advantages and limitations of inductively coupled plasma for cheese origin authentication.
Elemental fingerprinting data obtained by Danezis and colleagues [
50] have provided useful insights for an understanding of multiple element variations, including rare earth and precious metals, occurring in Greek Graviera cheeses obtained from 9 different regions (
n = 105 samples). These authors analyzed 61 different elements, including rare earth (Dy, Er, Eu, Nd, Pr, Sc, Sm, Y, Yb), precious metals (Au, Pd, Re, Ru), ultra-trace elements (Nb, Ta, Tl, W, Zr), and trace elements (Ag, Al, Bi, Cd, Cu, Mo, Ni, Pb), and found significant differences according to cheese origin. They were able to correctly classify 92.1% of the tested cheeses (21 traditional and 9 commercial cheeses) using discriminant analysis [
53]. The model was built on 65 elements, but the most significant variables were Ce, Dy, Eu, Gd, Ho, La, Nd, Pr, Sm, Tb, Y, Yb, Pd, As, Ba, Co, Fe, Ga, Mo, Ni, Ti, Zr, Ca, and P. Even if the authors did not perform any cross-validation, their results showed that ICP-MS was useful for cheese origin authentication, achieving high correct classification rates. According to the same study, rare earth elements seemed to significantly increase the discriminatory power of ICP-MS.
As previously stated, a combination of IRMS and ICP-based methods can also be used. For example, IRMS (for the casein fractions) and ICP-MS achieved high performance for cheese origin classifications. This was shown for semi-cooked typical Italian alpine cheeses, namely Asiago, Fontina, Toma, Vezzena Montasio, Spressa, and Puzzone (
n = 109). The use of Ba, Ca, Cu, Ga, K, Mg, Rb, Zn, δ
13C
casein, δ
15N
casein, δ
13C
glycerol, and δ
18O
glycerol as predictive variables in canonical discriminative analysis was able to correctly classify 94% of the tested samples [
52]. Another example was for authentication of PDO Parmigiano Reggiano vs. 11 imitation cheeses from different origins [
54]. In their process, Camin et al. [
54] used variables selected by the Random Forest algorithm (δ
13C
casein, δ
2H
casein, δ
15N
casein, δ
34S
casein, and Sr, Cu, Mo, Re, Na, U, Bi, Ni, Fe, Mn, Ga, Se, and Li) to create a supervised two-class model that was able to correctly classify 98.3% of the 265 hard cheese samples. Lastly, Nečemer and colleagues [
51] discriminated different Slovenian cheese origins by combining P, S, K, Cl, Ca, Zn, and δ
13C
casein and δ
15N
casein contents, and a high correct classification rate (97%) confirmed that the dual IRMS/ICP-MS approach provided robust data to authenticate cheese geographical origins.
2.3. Infrared Spectroscopy
Spectroscopic analyses, including near-infrared (NIR) and mid-infrared (MIR), are based on the selective interaction of infrared beams with food molecules [
55]. The infrared region includes a wide energy range (800 nm–1 mm, 12,500–10 cm
−1) and spectrophotometers can only evaluate a fraction of the wavelength, such as NIR (800–2500 nm, 12,500–4000 cm
−1), MIR (2.5–25 µm, 4000–400 cm
−1), and far-infrared (25–1000 µm, 400–10 cm
−1) [
56]. Although infrared spectroscopy mainly involves vibrational energy, NIR incorporates both electronic and vibrational spectroscopy, while MIR mainly monitors molecular vibrations and far-infrared contains rotatory and vibrational movements. NIR spectroscopy mainly reflects the absorption information of overtone and combination tone of chemical bond vibrations of hydrogen-containing groups (C–H, O–H, N–H, and S–H) that reflect the anharmonic constant and the high-frequency vibration of the fundamental stretching of a XH bond (i.e., second overtone transition of C–H and O–H in the 1050–1400 nm region) [
55,
56]. Bands in the NIR region are weak or very weak, making this region markedly different from the others, but at the same time, more difficult to analyze. However, compared to the MIR region, OH and NH stretching bands of monomeric and polymeric species are better separated and differentiate free terminal functional groups from those within the molecule [
56]. On the other hand, MIR spectroscopy is a highly sensitive method in which polar functional groups such as C=O, OH, and C–S exhibit intense bands. These bands, combined with other specificities of this region, such as stronger bands from antisymmetric vs. symmetric stretching, make this analysis useful for molecular fingerprinting [
56].
In food fingerprints, spectroscopic techniques have gained popularity since these are fast, solvent-free, automatic, non-destructive, non-invasive, inexpensive, and can be used as a multiparameter analysis [
49]. In general, NIR spectroscopy (in reflectance or transmittance mode) is more often used than MIR spectroscopy for food analysis as it requires less sample preparation and can be easily used for in-field analysis [
57].
Cheese has proven to be a challenging matrix for infrared spectroscopic analysis as it is non-homogeneous (e.g., crystalline structure, holes) and numerous cheese types exist [
58]. Nevertheless, many studies on cheese characterized and correctly predicted the chemical composition, manufacturing technique, ripening time, seasonality, and feeding system of milk-producing animals [
59,
60,
61,
62]. On the other hand, only a limited number of studies have focused on cheese origin authentication, possibly connected to the initial inability to differentiate milk geographical origin using infrared spectroscopic techniques [
63] and sample size needed to validate the analysis [
61].
Table 3 reports the advantages and limitations of infrared spectroscopy for cheese origin authentication.
According to Niermöller and Holroyd [
64], studies conducted on a reduced sample size (
n < 60) reported weak calibration for NIR spectra since, according to the multivariate model employed for the chemometrics analysis, sample size should be higher; in fact, PLS may require hundreds of samples per category. In another study, NIR spectroscopy correctly classified 96% of cheese samples from pasture-fed and conserved-forage-fed (hay or grass silage) dairy cattle [
66]. More recently, NIR was used (850 to 1048 nm wavelength region) for a cheese model obtained from different dairy systems, and 67.1% of samples were correctly classified after applying a cross-validation (LDA model) [
62]; however, the aim was not to discriminate the geographical origin of the tested samples. In a study comparing MIR and NIR spectroscopy performances, Karoui et al. [
67] correctly classified 86.6% and 85.7% of 91 Emmental PDO cheeses obtained from Switzerland, France, Finland, Germany, and Austria using factorial discriminant analysis, thus highlighting MIR and NIR performances to discriminate cheeses produced with a similar process but with different geographic origins. In another study, Karoui et al. [
68] used two MIR regions (3000–2800 and 1500–900 cm
−1) to successfully authenticate PDO Gruyère and L’Etivaz cheese, and 90.5% and 90.9% of samples were correctly classified using a factorial discriminant analysis.
In conclusion, although some studies have tested NIR and MIR spectroscopy to authenticate cheese origins, it is still difficult to conclude to what extent these techniques can be applied given the relatively low number of samples used in these studies [
61,
65]. In this context, further work on larger sample sizes for diverse cheese categories will likely improve the discriminatory power of these methods.
2.4. Nuclear Magnetic Resonance
Another spectroscopic analysis based on selective interactions between electromagnetic radiation and sample molecules is nuclear magnetic resonance (NMR). Generally, NMR uses radio frequency pulses to induce magnetic resonance nuclei-oriented transitions in an external magnetic field. When electromagnetic radiation hits nuclei, oriented nuclei move from lower to higher energy status or resonant nuclei. Subsequently, nuclei emit energy to return to the lower energy status, producing free induction decay [
69]. The detected energy produces an absorbance signal, expressed in ppm, obtained from the ratio of standard molecules (e.g., 3-(trimethylsilyl)-propionate-d4). NMR, based on nuclei magnetic angular momentum—spin—is characterized by the azimuthal quantum number (I). Only nuclei with an even number of neutrons and an odd number of protons can be detected by their magnetic angular momentum (e.g.,
12C and
16O have I = 0, while
1H and
13C have I > 1). Different NMR methods have already been employed in food authentication. However, considering cheese geographical origin authentication,
1H high-resolution magic angle spinning (HRMAS) NMR is the most commonly used technique [
70,
71]. For example, Shintu and Caldarelli [
71] applied a discriminant analysis using unsaturated fatty acid, aspartic acid, serine, and olefinic proton signals to classify the geographical origin of 20 Emmental cheeses from Austria, Finland, France, Germany, and Switzerland. They correctly classified 89.5% of samples after cross-validation. Mazzei and Piccolo [
70] successfully identified Mozzarella di Bufala Campana PDO cheese origin. The studied cheeses were obtained in the same region but from two different provinces, namely Salerno and Caserta. These authors applied a discriminant analysis model based on four metabolites linked to milk processing (β-galactose, β-lactose, acetic acid, and glycerol) and, after cross-validation, 100% of samples were correctly classified. Similarly, Consonni and Cagliani [
72] correctly differentiated 93.5% of Italian Parmigiano Reggiano PDO cheeses from foreign eastern European “Grana type” cheeses by applying a PLS-DA model on leucine, isoleucine, lactate, butanoate, and acetate. The same authors also discriminated Parmigiano Reggiano PDO cheeses based on their ripening times. However, no cross-validation was performed to test the developed model.
The simultaneous analysis of proteins, lipids, and other metabolite fractions by
1H HRMAS NMR offers great opportunities for cheese geographical origin authentications [
73]. Moreover, NMR offers multiple advantages, such as simple sample preparation, multiple metabolite quantifications, high experimental reproducibility, and it is also non-destructive. Nevertheless, some limits should be considered, such as high cost for acquisition and maintenance, and higher limits of detection (typically, 10 to 100 times) when compared to gas chromatography-mass spectrometry [
73,
74].
Table 4 reports the advantages and limitations of nuclear magnetic resonance for cheese origin authentication.
2.5. Gas Chromatography-Based Fatty Acid Analysis
Recently, fatty acid analysis has been investigated for cheese origin authentication purposes. Fatty acids are lipid components formed by carboxylic acids with saturated or unsaturated aliphatic carbon chains [
75]. Generally, fatty acid analysis is based on four sequential steps: extraction, derivatization, chromatographic separation, and detection [
75]. The analytical reference method for fatty acid analysis is gas chromatography (GC), which is usually combined with flame ionization detectors [
76]. For GC, analytes are vaporized in a heated chamber and transported by high-pressure inert gas (e.g., N
2, He) through the stationary phase (i.e., column material), where selective interaction leads to compound separation [
77]. Subsequently, based on their retention index, compounds are eluted into the hydrogen flame of the detector, creating an electrical signal [
78].
Fatty acid analysis to authenticate milk origin has already been reported [
79]. These authors were able to efficiently authenticate the geographical origin of milk as the combination of different feeding strategies, herd and farm management practices (leading to distinct feed fatty acid profiles), grazing, breeding, animals’ genetics, animals’ rumen microbiota, and difference in lactation days varied considerably according to geographic locations. In traditional cheese, milk fatty acid profiles are also impacted by manufacturing practices (e.g., use of
Cynara cardunculus L. as a coagulating agent), cheese microbiota (see the section on DNA-based methods for cheese origin authentication), and ripening times [
80,
81]. For example, fatty acid profiles were used and correctly authenticated the producer origins of Serra da Estrela PDO cheeses from Portugal, even within a limited production area [
76]. These authors used 12 fatty acids, namely caproic, caprylic, undecanoic, lauric, pentadecanoic, palmitic, palmitoleic, heptadecanoic, oleic, linoleic trans-isomer, heneicosanoic, and arachidonic acids, in a linear discriminant model to achieve an 88% correct classification rate after cross-validation. Higher classification rates (95% after cross-validation) were also reported by Margalho et al. [
82] using 13 fatty acids for 11 artisanal cheeses produced in 5 major geographical regions in Brazil (sample size
n = 402). Similarly, high classification percentages were also achieved by Danezis et al. [
83], who analyzed 101 PDO and 11 non-PDO cheeses from Greece. These authors used pH, moisture, fat, NaCl, and linoleic acid contents to correctly discriminate the PDO from non-PDO cheeses (excluding similar hard PDO cheese) and achieved 100% correct classifications. Although high correct classification rates were obtained by Margalho et al. [
82] and Danezis et al. [
83] for cheese origin authentication, the analyzed cheeses greatly differed in terms of physical aspect (i.e., spread, soft, semi-hard, and hard), fat content, and ripening time. In recent studies dealing with origin authentication of similar traditional cheeses, the correct classification rates reported by Reis Lima et al. [
76], Gatzias et al. [
84], and Vatavali et al. [
85] were, respectively, 88%, 88.2%, and 91.1%.
2.6. Gas Chromatography-Based Volatilome Analysis
Among the different strategies to authenticate cheese origin, volatile organic compound (VOC) analysis has gained attention as volatile compounds, which result from cheese microbiota metabolic activities, are an important component of cheese typicity. Indeed, through glycolysis, proteolysis, and lipolysis, cheese microbiota produce a wide range of VOCs. These include aldehydes, ketones, alcohols, esters, lactones, hydrocarbons, free fatty acids (
n < 10 carbon atoms), sulfur compounds, and amines that provide the typical cheese aroma [
86,
87,
88]. In this context, GC-MS is most commonly used to analyze cheese volatilomes (see Medina et al. [
89] for technical details on cheese VOC analysis using GC-MS).
Using volatile fingerprinting, Pillonel et al. [
90] discriminated country of origin for both PDO and non-PDO Emmental cheeses based on butan-2-one, 3-hydroxybutanone, butan-2-ol, and octene concentrations by principal component analysis (PCA). The concentrations of 21 other volatile compounds also showed at least one significant difference connected with their origin. Cheese origin discrimination relied on the fact that volatile profiles varied both qualitatively and quantitatively according to their country or region of origin [
90]. For example, PDO Emmental from Switzerland was differentiated from Polish and French Emmental cheeses based on free-fatty acid qualitative composition (2-methyl butanoic acid for PDO Emmental cheese compared with 3-methylbutanoic acid in French and Polish Emmental ones) and relative abundance (such as nonanoic acid), alcohol presence/absence (3 methylbut-2-en-1-ol presence only in Swiss Emmental), as well as other aliphatic hydrocarbons, ketones, aldehydes, and esters. More recently, Pluta-Kubica et al. [
91] also differentiated Emmental cheese origin based on their VOC profiles.
Similarly, Salzano et al. [
37] used GC-MS to authenticate water buffalo mozzarella PDO cheese from the non-PDO versions. Both milk and cheese samples were analyzed, and differences were highlighted for both matrices using partial least squares discriminant analysis (PLS-DA). Variable importance in projection (VIP) analysis selected the 15 highest scored variables. Among them, talopyranose, 2,3-dihydroxypropyl icosanoate, sorbose, 4-phenyl glutamic acid, oxalic acid, and galactose were the most prevalent in typical PDO mozzarella, while tagatose, lactic acid dimer, ribitol, dodecyl thioglycolate, n-acetyl glucosamine, valine, and diethylene glycol were more abundant in non-PDO mozzarella. These authors concluded that the combination of multiple practices, such as forage from the same region, natural milk starters with both LAB and yeast instead of citric acid, and different packaging, all impacted the volatilome of the final product. These differences could thus explain what distinguished the water buffalo mozzarella produced according to PDO rules vs. those not following such guidelines (i.e., non-PDO mozzarella).
Another study authenticated Pecorino cheese origins, namely Pecorino Romano PDO, Pecorino Sardo PDO, and Pecorino di Farindola (certified by the Slow Food Foundation) [
92]. The authors compared VOC fingerprints by a linear discriminant analysis (LDA) and PLS-DA model. The most influential variables in the LDA model were 2-methyl butyl isovalerate, butan-2-one, butyl butanoate, ethyl acetate, nonan-2-one, and propan-2-one, while in the PLS-DA model, VIP analysis identified 14 relevant compounds, namely, butan-2-one, pentan-2-ol, ethyl acetate, dicaprylyl ether, propanoic acid, 3-methylbutan-1-ol, propan-2-ol, ethyl decanoate, heptan-2-ol, butan-2-ol, butyl butanoate, pentan-2-one, ethanol, and 2-methylpropanoic acid. Only six compounds were common to the two tested models. Considering that both models yielded similar classification performances (total classification rate of 87.5% after cross-validation), differences in the most influential variables linked to origin authentication were related to the index score value applied in the VIP analysis. Indeed, while the authors used an index score of 1, a previous study by Salzano et al. [
37] used a higher value (i.e., 1.5) to select variables of interest and obtain a high correct classification rate for water buffalo mozzarella. Noteworthy, Vatavali et al. [
85] only classified 47.5% of Graviera cheese origins, and thus the discriminative power of VOC profiles for cheese authentication could vary considerably according to the considered cheese type.
GC-MS fingerprints can also be exploited to identify biomarkers connected with specific attributes of traditional products, such as animal feed requirements. Indeed, Caligiani et al. [
93] validated a method to quantify cyclopropane fatty acids (e.g., dihydrosterculic acid) as biomarkers for cows fed with corn silage. PDO cheeses such as Parmigiano Reggiano, Fontina, Comté, and Gruyère do not permit silage to be used in cow feed, and thus the absence of cyclopropane fatty acids in such cheeses may confirm correct feeding management.
Another feed-associated fraction of cheese VOCs are terpenoids. Terpenoids are a highly diversified class of naturally occurring organic compounds or phytochemicals, also called isoprenoids. These are derived from isoprene units and produced by dicotyledon plants [
88]. In Slovenian cheeses, VOC analysis discriminated cheeses into 4 clusters (average silhouette 0.764) according to their geographical origin and based on 9 monoterpenes, namely, α-pinene, camphene, α-phellandrene, β-pinene, 3-carene, 2-carene, limonene, tricyclene, and γ-terpinene [
94]. In a similar way, Turri et al. [
88] identified significant differences in 10 terpenes between pasture-producer of Historic Rebel cheese, and the results suggested that allo-ocimene, α-terpinolene, α-pinene, and δ-3-carene could be possible biomarkers to differentiate cheese origin. Overall, these studies highlighted that volatilome analysis can be an interesting tool for cheese origin authentication, although classification rate performances can vary among cheese varieties.
Another approach to directly analyze volatile compounds is the electronic nose (e-nose). This analytical technology, designed to mimic the human olfactory system [
95], has gained interest in food authentication as it is highly correlated with consumer perception [
96]. A typical e-nose comprises the sampling system, a set of non-selective sensors or mass spectrometer (MS), and a pattern-recognition system [
97,
98]. Nowadays, different sensors are used, such as metal-oxide semiconductors, conducting polymers, and piezoelectric crystal sensors [
99]. In the case of cheese origin authentication, only a limited number of studies reported an e-nose strategy. For example, Pillonel et al. [
90] obtained similar classification rates using a PCA model to evaluate Emmental cheese origins (90%). In the case of Pecorino cheeses, an e-nose and artificial neural network approach correctly classified 96.5% of Pecorino di Fossa PDO cheeses (
n = 18) and Pecorino cheeses of other origins (
n = 48) [
100]. In conclusion, while different authors have reported e-noses to authenticate foods subjected to different frauds, including geographical origin [
98,
101,
102], only a limited number of studies concerned cheese origin authentication.
Table 5 reports the advantages and limitations of VOC analysis for cheese origin authentication.
Some important attributes that may impact the efficiency of this approach to discriminate cheese origin are provided. One important attribute to differentiate cheese is ripening time [
106]. Typical cheeses are sold according to a minimum ripening time. However, according to the initial extent of ripening, significant changes may occur during shelf-life. Contamination during portioning, inadequate temperature usage during transport, light exposure, and storage conditions may impact VOC profiles. In this context, specific VOC fractions, such as terpenoids, combined with VOC and microbiota correlations, may overcome possible changes in VOC profiles at the retailing stage. However, to our best knowledge, no studies have evaluated the effect of retail on cheese origin authentication.


 ,
, 

