Article

Performance of Exergetic, Energetic and Techno-Economic Analyses on a Gas-Type Industrial Drying System of Black Tea

1
College of Engineering, South China Agricultural University, Guangzhou 510642, China
2
School of Intelligent Manufacturing Engineering, Chongqing University of Arts and Sciences, Chongqing 404100, China
*
Author to whom correspondence should be addressed.
Foods 2022, 11(20), 3281; https://doi.org/10.3390/foods11203281
Submission received: 27 September 2022 / Revised: 13 October 2022 / Accepted: 18 October 2022 / Published: 20 October 2022

Abstract

:
The purpose of this research work is to perform detailed exergetic, energetic and techno-economic analysis of the black tea drying process in the gas-type industrial dryer. Exergy–energy and techno-economic methodology was applied to investigate the heat loss, exergetic and energetic performance, exergy efficiency, improvement potential rate, sustainability index and techno-economic performance of a drying system. The results showed that the heat loss of exhaust air in the late drying process played a main contributing role in the heat loss and exergy loss of the whole drying system. Therefore, the exergy efficiency of the initial drying period and the redrying period varied from 38.08% to 65.09% and 24.76% to 26.97%, respectively. In addition, the improvement potential rate and sustainability index of the whole system varied from 6.93 kW to 12.94 kW and 1.33 to 2.86, respectively. The improvement potential obtained in the present work indicated that the drying operation is greatly in need of exergy performance improvement. Finally, the net present value and payback period obtained from techno-economic analysis were 179,442.03 USD and 5.3 years, the result is useful for investors or contractors to refer to and make investment decisions.

1. Introduction

Drying is a traditional method which is widely used to extend the preservation of agricultural or marine products such as grains, bananas, cassava and rough rice [1,2,3,4]. Traditionally, drying is a high-energy-consumption operation that removes water from material with high moisture content by externally supplying energy [5]. The original drying method is natural drying, and the current large-scale industrial production drying involves burning a large amount of fossil fuels, as found from the literature reporting that the energy consumed by the drying industry accounts for about 15% of the country’s total energy consumption, and the drying cost in particular is close to 60–70% of the total cost [6,7]. Considering the global energy shortage and sustainable development strategies, it is necessary to reveal the overall energy matching structure and the transfer mechanism of the drying system, and clarify the evaluation indicators, such as energy efficiency and sustainability of the drying system. Therefore, it is of great significance to improve the overall efficiency of the drying system and develop the drying theory for the energy conservation and sustainability of the drying industry.
The drying process of material is a dewatering process based on the supply of heat. From the perspective of thermodynamics, the drying of materials is due to the heat transfer which increases the activation energy of water molecules to form a temperature field and a humidity field, which promotes the evaporation and dehydration of the moisture inside the material [8,9]. As mentioned above, the drying processes is a highly energy-intensive operation and the kinetic process of mass transfer and heat transfer. Application of the first and second laws of thermodynamics to reveal the energy structure and transfer mechanism of the agricultural product drying system or industrial production drying system is a method commonly used by researchers in recent decades [10,11,12]. For example, Silva et al. designed and tested a solar dryer of corn grains and evaluated the performance of energy and exergy of the dryer based on the first and second laws of the thermodynamics, identified that the average thermal efficiency was 21% and the exergy efficiency ranged between 10–66% [13]. Not only that, there are many such research studies on the evaluation and analysis of agricultural product drying system by the exergy analysis method, such as bananas [14] and medicinal plants [15]. The drying systems mentioned above are laboratory-scale drying systems, and there are also a few studies in the literature which reported industrial-scale drying systems [16,17,18]. Sarker et al. and Li et al. employ the method of energy–exergy to estimate the energetic and exergetic performance of a novel industrial multi-field synergistic dryer, and carried out the influence of the crackle ratio, generation potential, and generation rate for the quality of the dried paddy [16]. Moreover, energy is a quantitative indicator which is defined as the amount of external work applied by a system. Different to energy, exergy is a qualitative indicator which is defined as the maximum useful work supplied by a system externally [19,20,21]. The method of energy–exergy analysis not only enables the energy efficiency of the drying system to be evaluated in terms of energy quantity, but also the exergy of different components of the system can be evaluated in terms of energy quality to help make informed design decisions [22]. Therefore, obtaining energy (exergy) efficiency based on the energy–exergy analysis method can not only evaluate the sustainability of the drying system, but also facilitate the guidance of the design of efficient dryers [23].
For a drying system, the evaluation of energy and efficiency is essential. Similarly, the overall economics of drying production are also a considerable indicator that should be fully considered for producers or farmers. The economic estimation of the drying system consists of the investment cost and the production cost of the drying system. However, the production cost may be controversial, as the comprehensive availability of local raw materials, the cost of local manufacturing, and the cost of power sources deviate between places [24]. Currently, economics evaluation is the primary and most common method for drying systems, while the techno-economic method is among the most common and popular economic analysis methods for studying thermodynamic systems, such as the traditional energy system [25,26] and emerging energy system [27,28]. The main advantages of the techno-economic method are that the cost flow and the energy flow of the system can be combined to identify the energy–exergy destruction rate of each component, indicate the improvement direction, and obtain the unit cost of the final product of the system [29]. The evaluation factor which is carried out based on the thermodynamic–economic considerations mentioned above cannot fully meet the requirements of economic evaluation of a drying system which undertakes the large task of high-production drying quantities every year. For investors or contractors, the economic rationality of the equipment and operating costs required for the drying system should receive more attention. Therefore, a few relevant studies in the literature [10,30,31,32] have reported a method which applied a techno-economics indicator, such as capital cost (Cc), payback period (PP), and net present value (NPV), etc., to evaluate the performance of the techno-economics of a drying system. For instance, Yahya et al. applied the techno-economic analysis method to obtain the payback period and net present value of the solar heat pump fluidized bed dryer with the value of 1.6 years and 8563.82 dollars, respectively [33]. Nadiya et al. have reported detailed economic analysis through the annualized cost, life cycle saving and payback period method [34]. Moreover, economic estimation used the macroeconomics indicator mentioned above to provide a simple method for investors or contractors to deal with simple economic issues and make the correct choice for the selection and use of drying systems [35,36]. Therefore, investors or contractors can determine the overall rate of return and payback period of the drying system and evaluate various technical options to meet the system based on the overall capital cost, the whole revenue and profit of the drying system obtained by economic analysis.
To summarize, in the last few decades, evaluation of the exergy–energy and techno-economic indicators was widely applied to evaluating the performance of the drying system. In the present work, we pay attention to a gas-type industrial drying system of black tea, which is currently the most widely used tea dryer [37], whereas relevant research studies have carried out research on the thin-layer drying model of tea, the prediction of drying time, and the heat and mass transfer model for the tea dryer [38,39,40,41], knowledge of performance analysis on exergy–energy and the techno-economics of the gas-type industrial drying system of black tea seems to be scarce in the existing scientific research literature. Therefore, the objective of the present study is not only concerning performance analysis of exergetic and energetic factors for a gas-type industrial drying system of black tea based on the first and second law of thermodynamics, which to reveal the energy loss in the drying system and to guide to design more efficient thermal systems, but also evaluating indicators such as net present value (NPV) and payback period (PP) to assess the economic performance of the drying system from the techno-economic perspective. This will generate insight into the drying system performance, benefitting the whole revenue stream by increasing energy utilization and commercialization of the drying system for an investor or contractor.

2. Materials and Methods
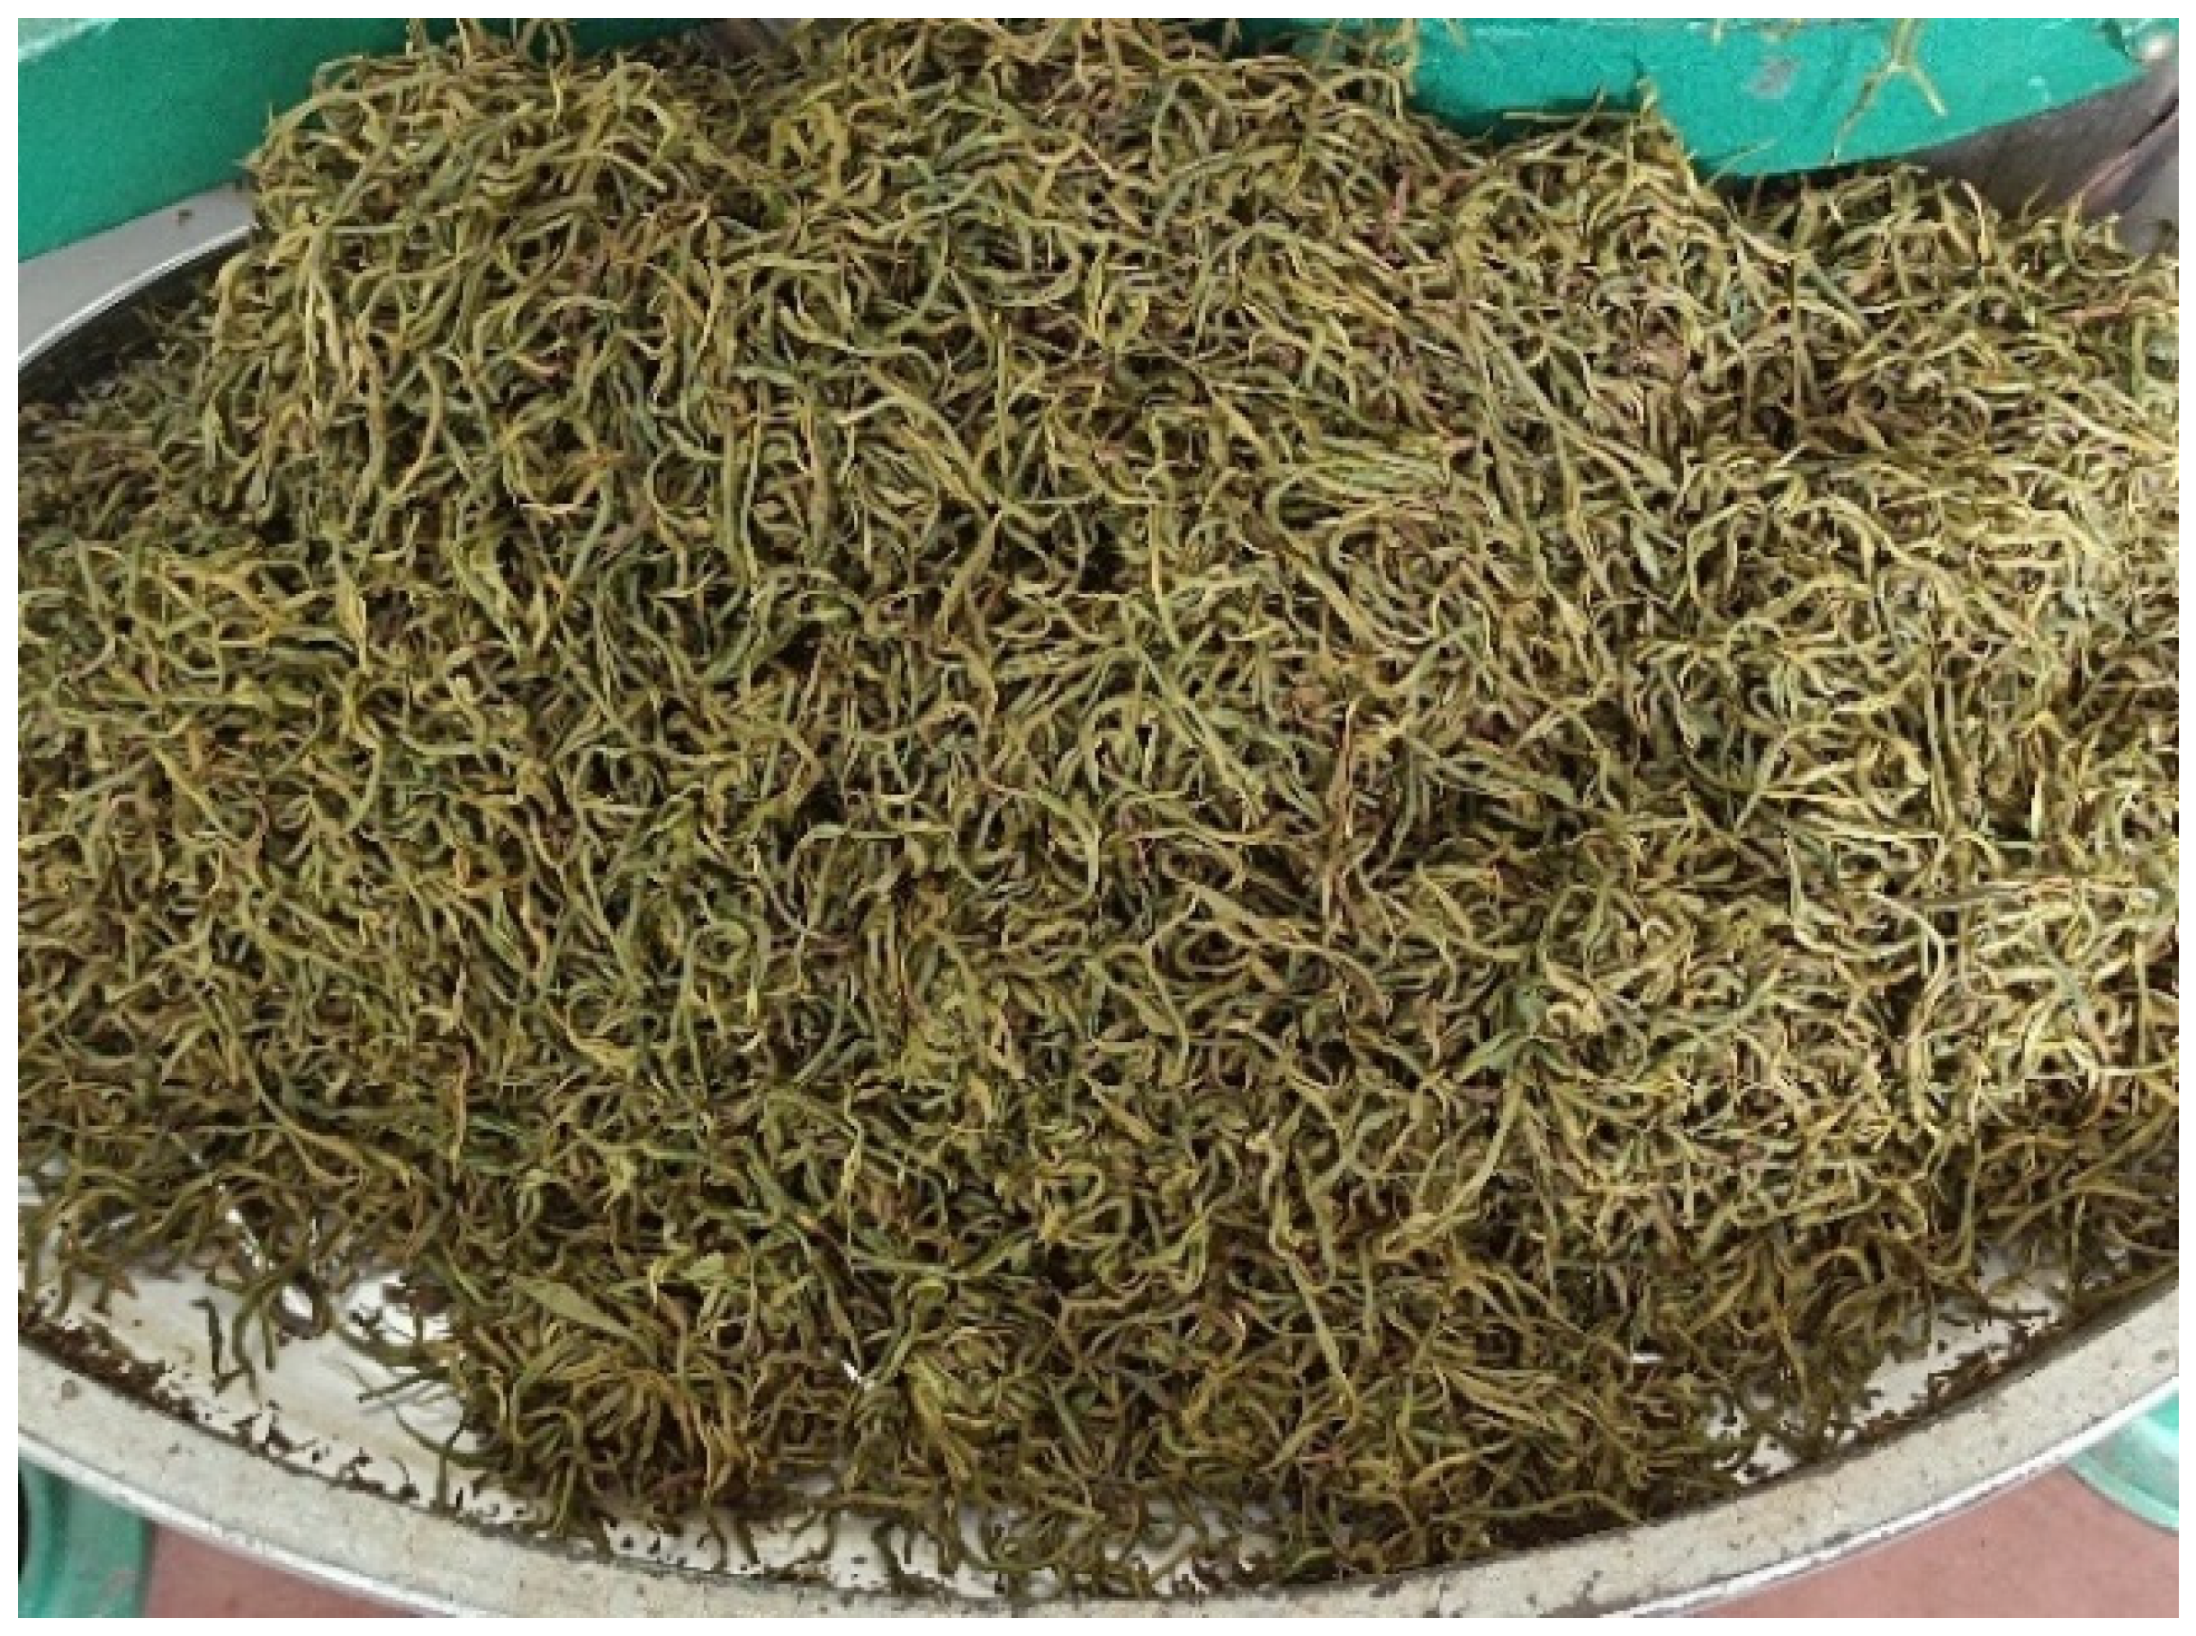
2.1. Materials

The experimental material shown in Figure 1 was freshly tea leaves (variety: Yinghong NO. 9) with an average initial moisture content 58.33% (w.b.), harvest from a local farm at Yangshan County, Guangdong Province.

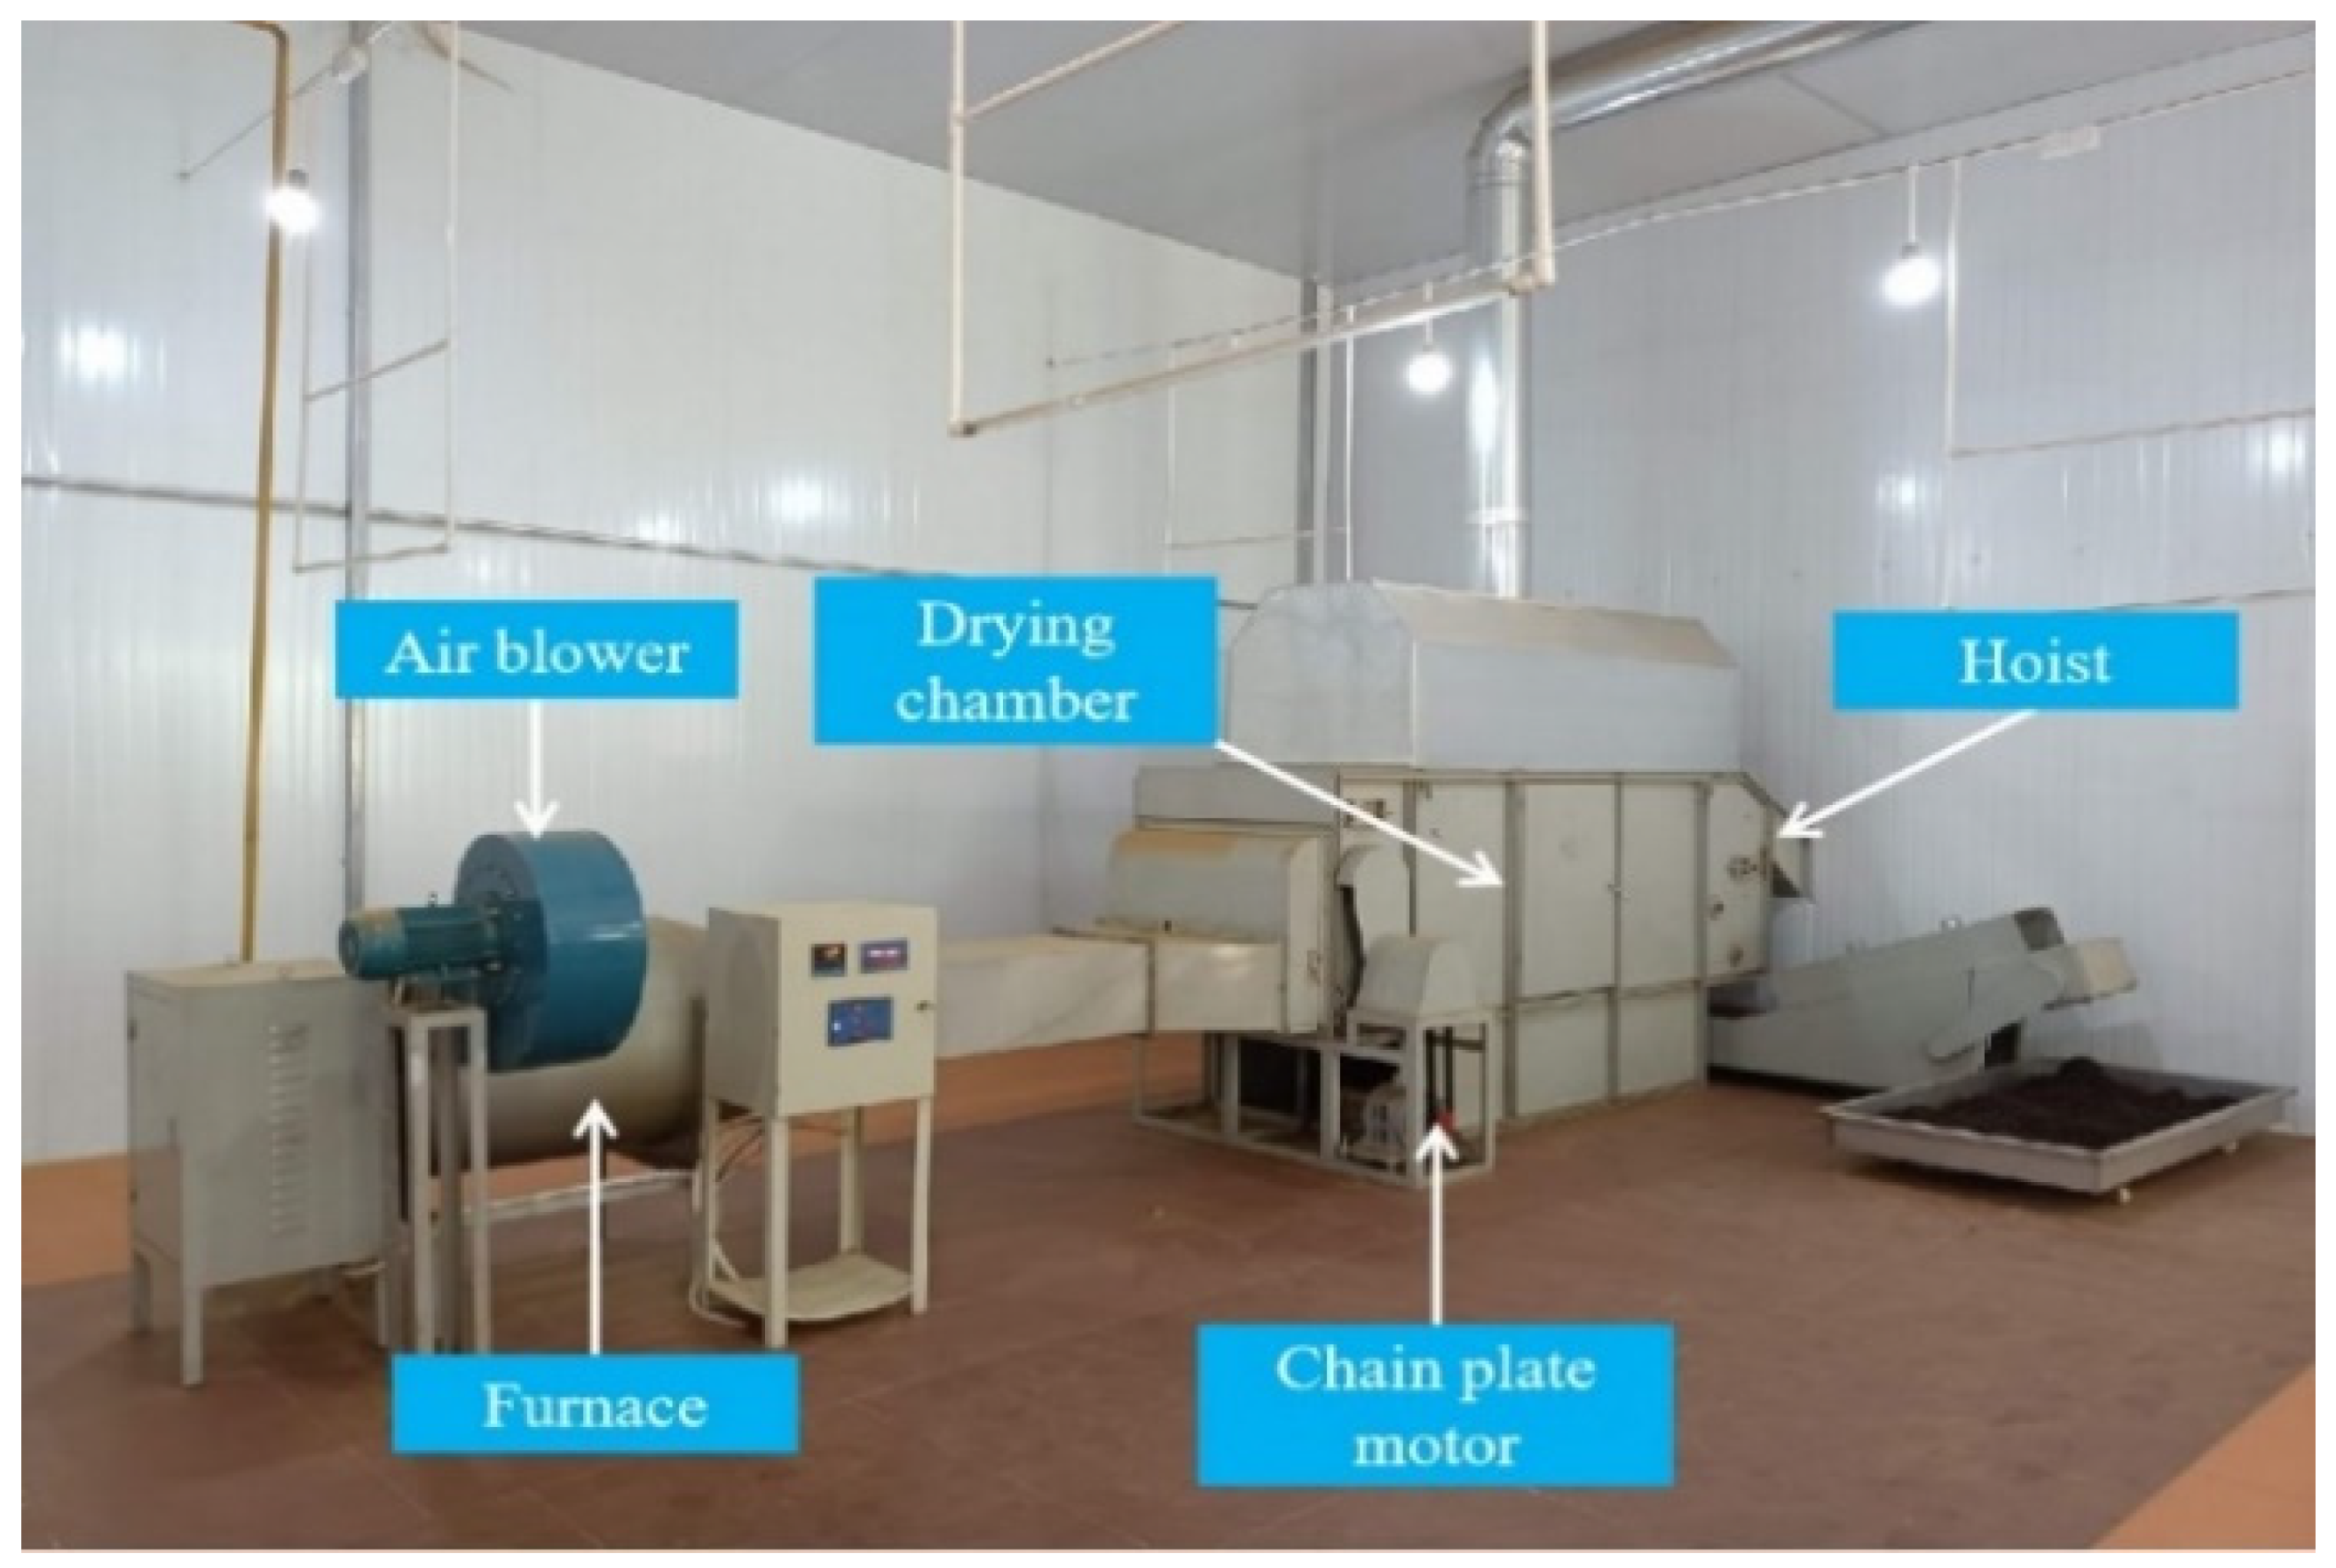
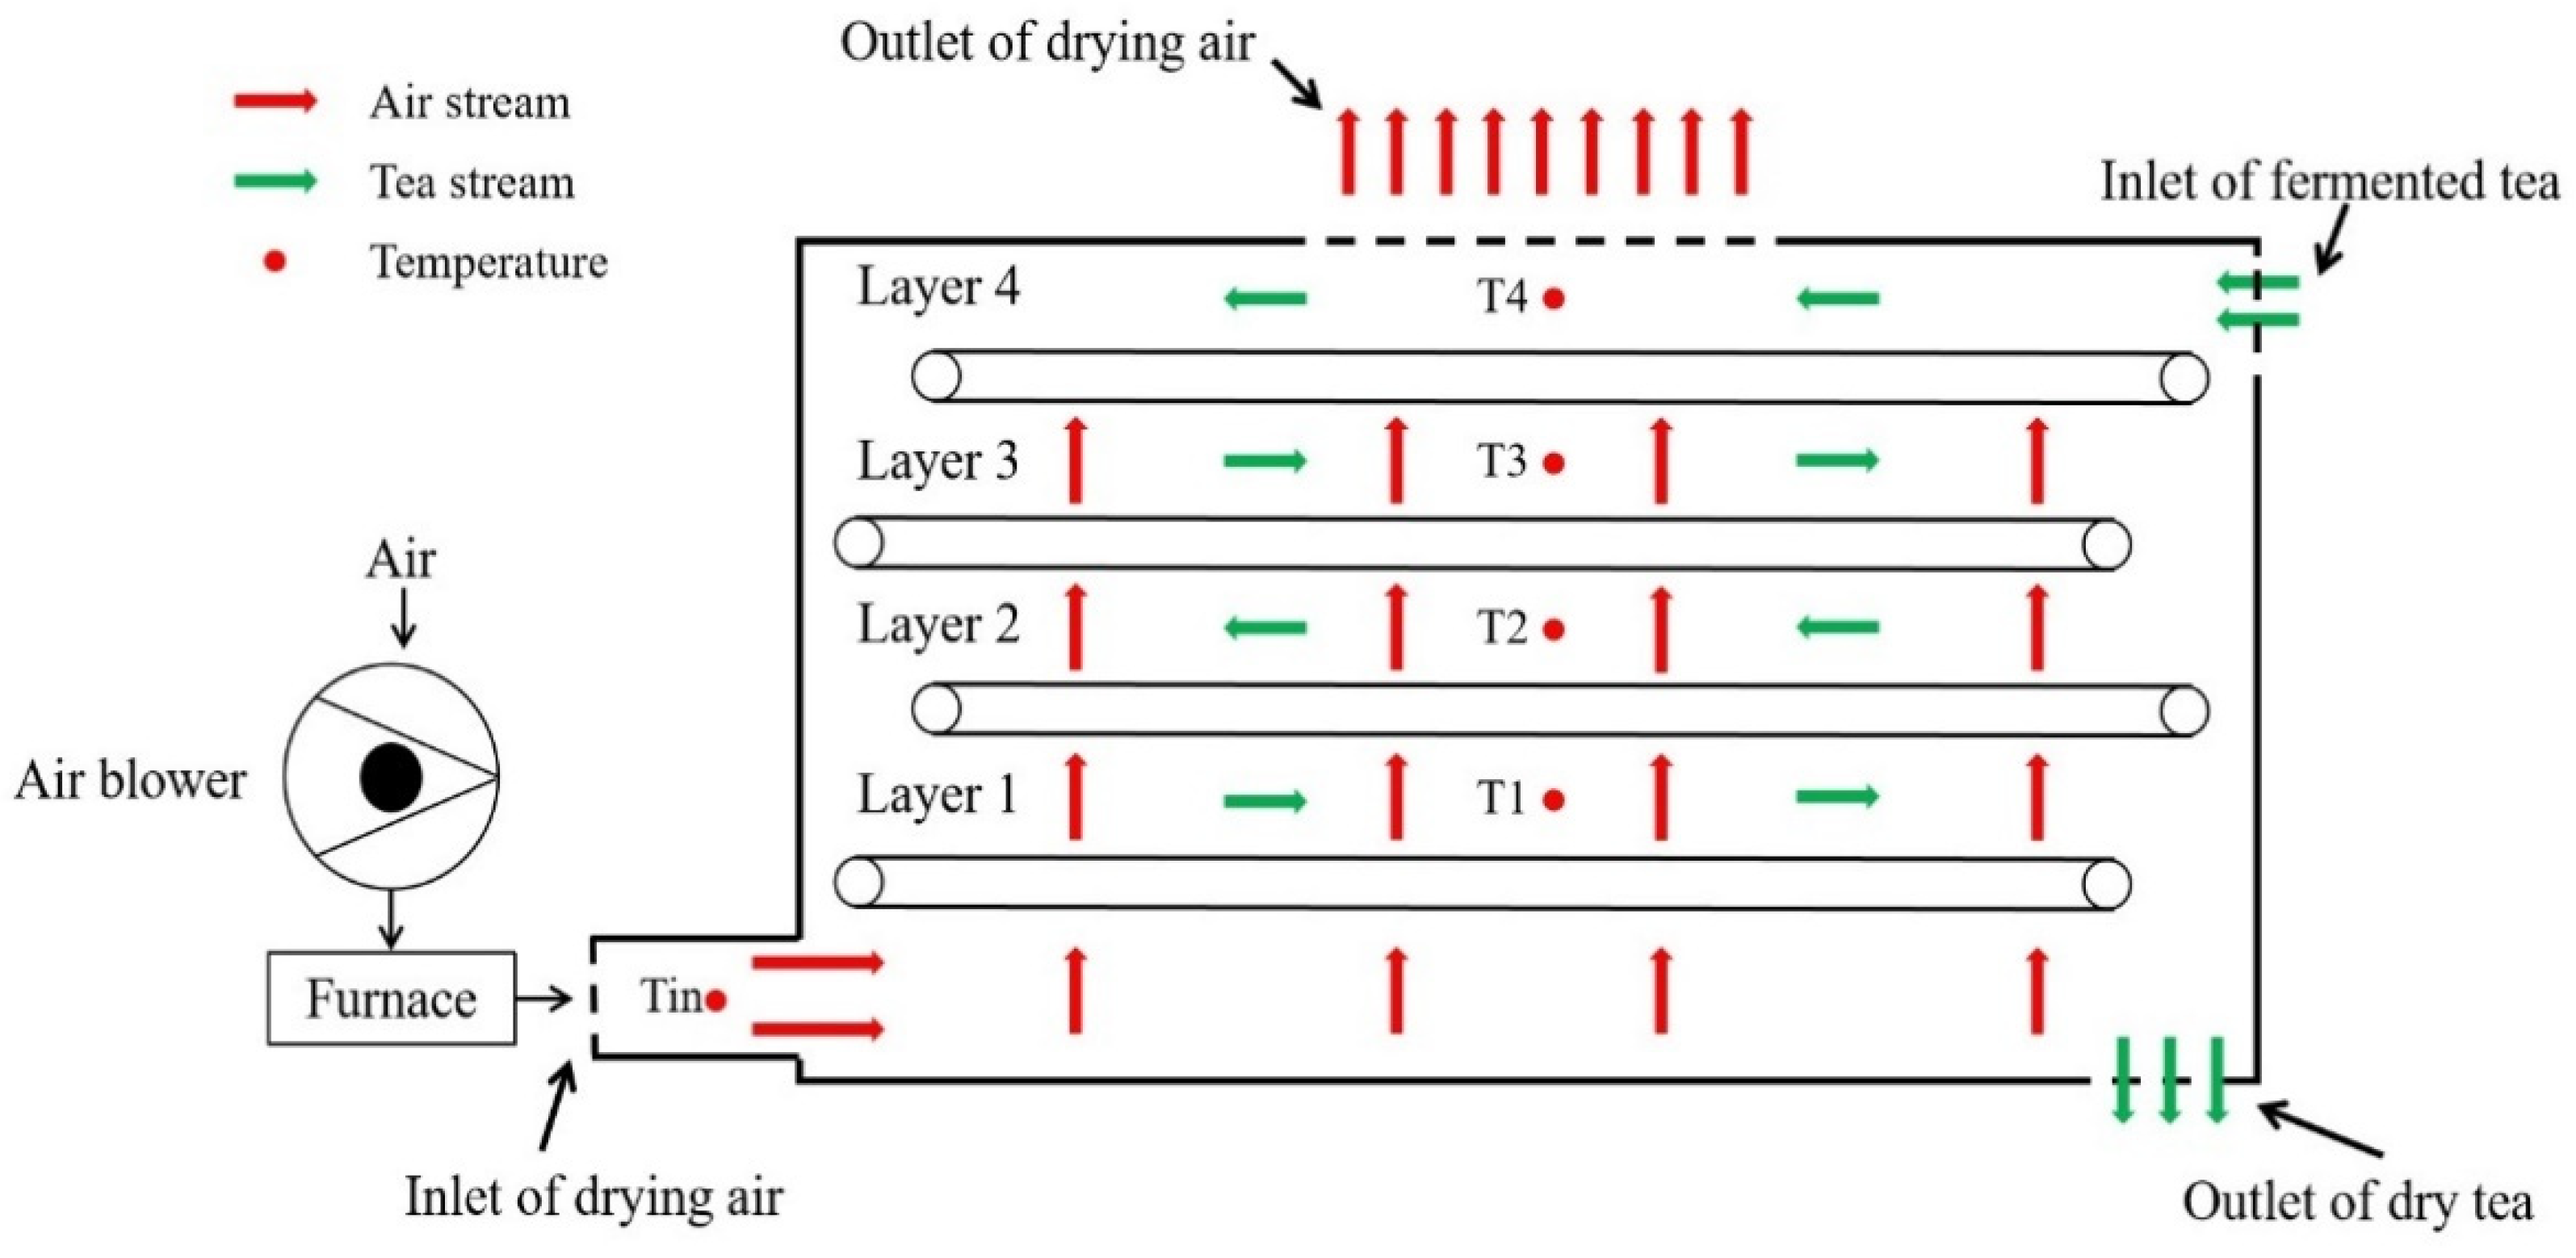
2.2. Operation Principle of Experimental

A gas-type industrial drying system of black tea was installed in a tea enterprise in Yangshan County, Guangdong Province. The photograph of a gas-type industrial drying system of black tea was shown in Figure 2, which consisted of five principal components, including an air blower, furnace, drying chamber, hoist and chain plate motor.
Experiments were carried out in a tea enterprise in Yangshan County, Guangdong Province. The schematic diagram of a gas-type industrial drying system of black tea is shown in Figure 3. Tea farmers freshly harvested tea in tea garden, and turned it into approximately 180 kg of fermented tea leaves, which were placed into the drying chamber for the drying process. The working principle of the gas-type industrial drying system of black tea is that the air blower sends the air into the furnace for heating and then sends the heated air into the drying chamber from the bottom of the left side of the drying chamber to dry the fermented tea leaves which enter the conveyor chain network from the top feed port. The drying leaf reciprocates with the chain mesh layer to send the material to the discharge port. The hot-air-dried the fermented tea leaves are discharged from the exhaust pipe at the top of the drying chamber. Generally, the operation of drying was divided into two periods, the initial drying period and the redrying period. The detailed operation process is shown in Table 1.
The temperature of the hot air at the inlet of the drying chamber is measured by a temperature sensor inserted into the hot air inlet and displayed in the control cabinet of the combustion chamber. Air temperature in the drying chamber was measured by using a PT100 thermal resistance. During the overall drying operation, the temperatures of the four layers of the drying chamber (Ti, i = 1, 2, 3 and 4, acquiescence T4 = Toutlet especially) were measured by thermal resistance sensors inserted into the corresponding components. The air velocity and pressure were measured by using a wind speed and air volume measuring instrument. The details of the relevant measuring instruments are listed in Table 2.
Measurement equipment error, data collection operation error and data accuracy will all have a certain impact on the accuracy of the overall work [42]. Therefore, the ascertainment of uncertainty analysis is necessary, and the calculation formula is as follows:
W = [ ( y x 1 w 1 ) 2 + ( y x 2 w 2 ) 2 + + ( y x n w n ) 2 ] 1 / 2
where W is total uncertainty in result measurement, w1, w2, … wn are uncertainties in independent variables and x1, x2, … xn are independent variables.

2.3. Energy–Exergy Analysis

In this work, the mass and energy balance equation were applied to analyze the performance of the energy and exergy in a gas-type industrial drying system of black tea which were defaulted to be a steady state and steady flow drying system, the relevant calculation formula is as follows [43]:
m i n h i n = m o u t h o u t  
The energy conversation of the whole system can be expressed as the following calculation [40]:
Q + m i n h i n = W + P + m o u t h o u t
In the present work, the total heat (Qgas) supplied by natural gas to the drying system, the heat (Qa) used for heating the natural air, the useful energy (Exgas) to heat the air, the power for the air blower (Pblower), the chain plate motor (Pmotor), the hoist (Phoist), the specific energy consumption (SEC), the specific thermal energy consumption (STEC), the exergy efficiency for the drying chamber (ηex), the improvement potential (IP) and the sustainability index (SI) of the drying system can be calculated using Formulas (4)–(19) tabulated in Table 3 [44,45,46].

2.4. Economic Analysis

In the present work, in addition to the performance of exergetic and energetic indicators, the economics of the black tea drying system, consisting of the whole capital cost (Cc) and the product cost (Cp), must be considered. The investment cost of the dryer in the system mainly includes the air blower, furnace, drying chamber, chain plate motor, hoist, cost for manual installation and infrastructure cost. Additionally, the production cost consists of the electricity, gas, labor, maintenance and depreciation. In addition, the profit (PR), return of capital (ROR), payback period (PP), net present value (NPV) and present value (S) of the drying system can be calculated using Equations (20)–(25) shown in Table 4 [29,47].
Where in the table, Cel, Cgas, Cla, Cm and Cdp are the cost of electricity, gas, labor, maintenance and depreciation; Pn is the discounted present value (S) of the investment to be invested in the next n years.

3. Results and Discussion

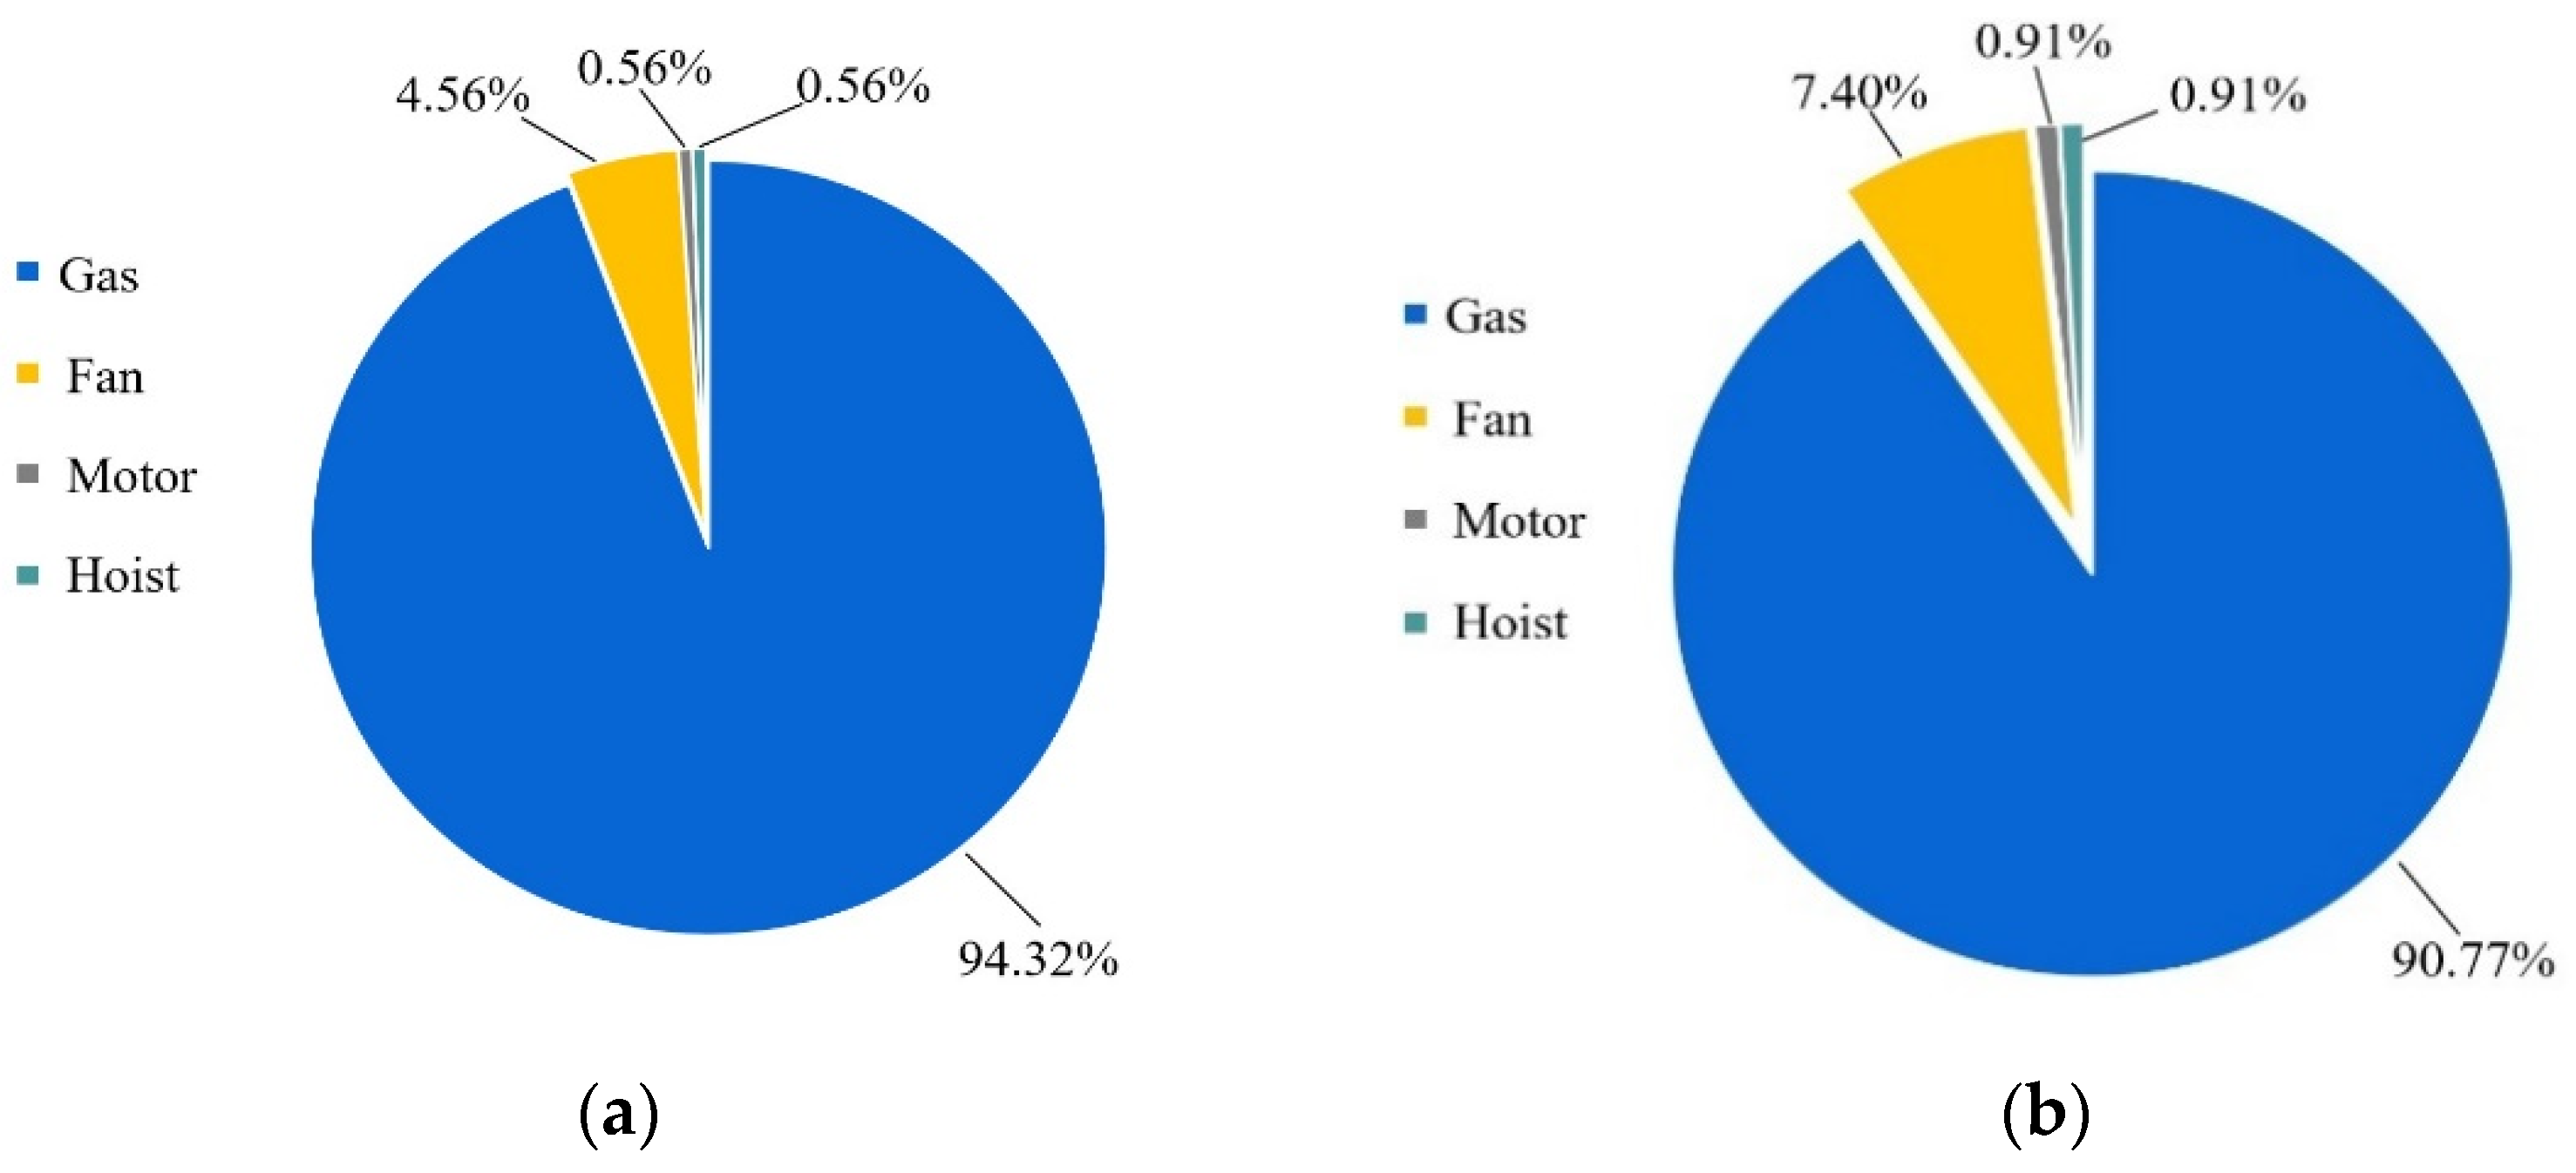
3.1. Energy Matching Structure of the Drying System

The uncertainty analysis of the parameters in the drying process are shown in Table 5. Compared with the previous studies [48,49], uncertainties regarding the experimental data were within a reasonable range, indicated that the dependability of the data used for calculating the indicators adopted in the present work.
In the present work, drying operation consumption mainly include the energy of electricity and natural gas. The heat required to dry the material of the drying system supplied by the natural gas, the whole drying machine is provided by electricity. Detailed parameters of the related equipment applied in the present study are listed in Table 6. Furthermore, Figure 4 describes the proportion of the initial drying period, the redrying period energy, as well as the whole energy consumption of the drying system and energy consumption, including gas, induced fan and hoist. In the initial drying period, energy consumption by gas, fan, motor and hoist account for 94.32%, 4.56%, 0.56% and 0.56% in the initial drying system, in the redrying system account for 90.77%, 7.40%, 0.91% and 0.91%, respectively.

3.2. Heat Loss Characteristics of the Drying System

Heat loss is an important indicator to give reasons for the high energy consumption of drying systems. To clear energy consumption and energy efficiency of the system, the heat loss characteristics of the drying system were investigated. In the present study, the heat loss of the drying system mainly considers the heat loss caused by the exhaust air outlet (Qloss,air) and the heat loss of wall heat transfer (Qloss,wall), the relevant calculation results shown in Table 7. As can be seen from Table 7, whatever in the initial drying period or redrying period, the heat loss of the exhaust air outlet played a main contributing role in the heat loss of the drying system. The value of the variation of the heat loss of exhaust air is 14.89–52.42 kW in the initial drying period and 49.55–51.27 kW in the redrying period; the value of the heat loss of wall heat transfer is 0.946–1.421 kW in the initial drying period and 1.227–1.240 kW in the redrying period. In addition, the variation interval of the whole heat loss is 15.84–53.84 kW in the initial drying period and 50.78–52.51 kW in the redrying period. The change trend of heat loss during the drying period of the whole drying system is that the heat loss of the exhaust gas and wall heat transfer in the initial drying period increases with the increase in drying time, and then tends to be stable until the redrying period and the end of drying. In the beginning of the drying process, the evaporation of the water of the fresh tea required the consumption of a lot of heat, and instability of the drying chamber temperature leads to the lower heat loss. As the drying process progresses, the variation curve of heat loss tends to be constant, which may be the result of the drying chamber temperature tending towards stability and the outlet temperature being higher than the temperature of the tea. The situation of the heat loss of the whole drying system tending to be steady in the latter period of the drying has been reported in relevant literature [50,51,52]. Thus, efforts should be made to recover and reuse the heat of the exhaust gas to improve the energy efficiency of the whole drying system.

3.3. Analysis the Exergy Flow of the Drying System

The corresponding change trend curve of exergy flow is shown in Figure 5. Figure 5 describes the trend of the curve of the exergy inflow and exergy outflow increasing with the increase in time, and then tending to stability until to end of the drying. In the initial drying period, the value of the exergy inflow, exergy outflow and exergy of the drying chamber varied between 36.94–44.18 kW, 3.23–24.24 kW and 19.72–33.70 kW, respectively; and in the redrying period varied between 31.99–32.67 kW, 22.50–22.76 kW and 9.21–10.03 kW, respectively. Comparing with Table 7, we can see that the trend of the exergy flow is similar to the trend of the heat loss flow. In the beginning of the drying process, the temperature of the tea entering the drying chamber is lower, which results in huge amounts of exergy consumed to increase the temperature of the tea and remove moisture. Furthermore, the increase in the average temperature of the whole drying chamber results in the increase in the exergy outflow. A similar investigation has been made by Beigi for rice in a deep-bed convective dryer [53]. In general, exergy loss of the outflow played a contributing role in the exergy loss of the whole drying system, hence, a few studies in the literature have indicated that the exergy loss from the exergy outflow to the surroundings is one of the thermodynamic inefficiencies of drying systems [54,55]. Therefore, the focus of effort is not only on the heat recovery of exhaust air, but also on the exergy loss of the exergy outflow to further optimize the structure of the drying system.

3.4. Exergetic Performance of the Drying System

In the present study, evaluation of the indicators, including exergy efficiency (ηex), improvement potential (IP), sustainability index (SI), specific energy consumption (SEC) and specific thermal energy consumption (STEC), was carried out to investigate the exergetic performance of the drying system. The variations in the evaluation indicators mentioned above are shown in Table 8 during the whole drying period.
As shown in Table 8, ηex and SI decrease with the increase in the drying time; conversely, IP increased with the increase in the drying time. In the present work, exergy efficiency values varied from 37.85% to 65.09% in the initial drying period and 24.76% to 26.97% in the redrying period. According to the previous analysis of the change trend of heat loss and exergy flow, the exergy efficiency increased with the decrease in the heat loss and exergy outflow. It can be clearly seen from Table 8 that the improvement potential (IP) values change from 11.77 kW to 12.94 kW in the initial drying period, and from 6.93–7.33 kW in the redrying period. Additionally, corresponding to the initial and redrying period, the value of the sustainability index of the present study varied from 1.61 to 2.96 and from 1.33 to 1.37. Previous studies have indicated that the higher exergy efficiency resulted the higher sustainability index and the lower effect on the environment [56]. Accordingly, efforts should be made to ameliorate the exergy efficiency of the present drying system to reduce the effective on the environment. Furthermore, as can be clearly seen from Table 8, the value of SEC and STEC varied from 18.09 kJ/g to 21.31 kJ/g and 16.43 kJ/g to 21.21 kJ/g in the initial drying period; but in the redrying period, the value of SEC and STEC varied from 127.13 kJ/g to 129.58 kJ/g and 113.82 kJ/g to 116.27 kJ/g, respectively. The phenomenon that SEC and STEC increases rapidly in the redrying period due to the existence of the binding energy, and a similar conclusion was found by Xiong et al. [57] and Yildirim et al. [58].

3.5. Techno-Economic Analysis of the Drying System

In this section, the techno-economic analysis mainly includes the capital cost of the drying system, the net present value, the net cash flow and the payback period; the following Table 9, Table 10, Table 11, Table 12 and Table 13 record the economic analysis results of the whole drying system of the present work. The discount factor, maintenance costs, depreciation rate and expected life of the dryer were performed with an assumed value of 10%, 2%, 9.5% and 10 years, respectively. As can been seen from Table 9, the cost of infrastructure and tea garden construction and management constitute the main component of the whole capital cost. Based on the capital costs mentioned above and the parameters shown in Table 10, the product costs include the cost of fresh tea (30,731.04 USD/Year), labor (21,865.89 USD/Year), electricity (139.97 USD/year), natural gas (8388.06 USD/year), maintenance (3147.01 USD/year) and depreciation (14,948.32 USD/year). Table 11 has tabulated annual operation cost, annual revenue and the net cash flow were 64,271.97 USD/year, 94,413.60 USD/year and 30,141.63 USD/year, respectively. As can be shown in Table 12 and Table 13, the economic analysis of the drying system in the present work calculated and demonstrated that the net present value and the payback period had values of 179,442.03 USD and 5.3 Years, respectively.

4. Conclusions

In the present work, black tea was dried through the use of a gas-type industrial dryer. In the aspect of energy efficiency evaluation of the drying system, the exergetic and energetic performance of the dryer were investigated; in the aspect of economic analysis of the whole system, the net present value and payback period of the system were considered in the investigation. The main conclusion to be drawn are as follows:
  • In approximately the first 50 min of the whole drying process, both the heat loss and exergy outflow increase with the increase in drying time, and then become stable as a result of the influence of the binding energy between the dry matter and water molecules until to end of drying process.
  • The heat loss of the exhaust air makes an important contribution to the heat loss and exergy loss of the whole drying system, especially in the redrying period. Therefore, it is recommended that a device be designed to recover heat from the exhaust air so as to improve the energy efficiency and reduce the exergy loss rate of the whole drying system.
  • In the drying process, the improvement potential rate varied from 6.93 kW to 12.94 kW and the value of the sustainability index ranged from 1.33 to 2.86 of the drying system, indicating that the exergy efficiency should be improved so as to improve the environmental sustainability.
  • According to the techno-economic method’s calculations, the net present value and payback period are 179,442.03 USD and 5.3 years, respectively.
Finally, further studies are advised to investigate the influence of factors such as ventilation temperature and speed on the drying efficiency, optimize the drying process parameters, and further improve the sustainability and efficiency of the drying system.

Author Contributions

Conceptualization, Z.Z. and B.L.; methodology, Z.Z. and B.L.; software, Z.Z., C.H. and C.D.; validation, Z.Z., C.H. and Z.H.; formal analysis, Z.Z. and T.C.; investigation, Z.H., C.G. and F.Z.; resources, C.H., T.C. and C.G.; data curation, C.H. and F.Z.; writing—original draft preparation, Z.Z. and B.L.; writing—review and editing, Z.Z. and B.L.; visualization, Z.Z. and B.L.; supervision, W.W.; project administration, W.W.; funding acquisition, W.W. All authors have read and agreed to the published version of the manuscript.

Funding

This work was supported by the development and application demonstration of transportation and spraying equipment for Jiexi alpine tea gardens (Dzxny004); Guangdong Provincial Special Fund for Modern Agriculture Industry Technology Innovation Teams (2022KJ120); Guangdong Agricultural Scientific and Technology research project (2020-440000-02100200-8418); Guangdong Province Special fund for scientific and technological innovation strategy (“Climbing Plan” Special fund: pdjh2022a0072).

Data Availability Statement

Not applicable.

Acknowledgments

The authors would like to thank to the editors and reviewers for their valuable and constructive comments.

Conflicts of Interest

The authors declare that we have no known competing financial interests or personal relationships that could have appeared to influence the work reported in this paper.

Nomenclature

mMass flow rate (kg s−1)
ExExergy rate (kW)
hSpecific enthalpy (kJ kg−1)
QgasHeat of gas (J)
VgasUnit volume of natural gas (m3)
QaHeat of heating air (J)
mgMass flow of air (kg s−1)
cpSpecific heat of air (J kg−1 °C−1)
T1Temperature of inlet (°C)
T4Temperature of outlet (°C)
T0Temperature of ambient (°C)
TwallTemperature of wall (°C)
Qloss,airHeat loss of exhaust air (kW)
Qloss,wallHeat loss of the wall heat transfer (kW)
A0Heat transfer area of the drying chamber (m2)
ExgasExergy of gas (kW)
ExblowerExergy of blower (kW)
ExmotorExergy of chain plate motor (kW)
ExhoistExergy of hoist (kW)
Exdc,inTotal exergy entering the drying system (kW)
Exdc,outTotal exergy outlet the drying system (kW)
ExdcExergy of drying chamber (kW)
WblowerWork rate of blower (kW)
WmotorWork rate of chain plate motor (kW)
WhoistWork rate of hoist (kW)
PblowerPower rate of blower (kW)
PmotorPower rate of chain plate motor (kW)
PhoistPower rate of hoist (kW)
Abbreviations
DRDrying rate (gwater/gwet matter*h)
SECSpecific Energy Consumption (kJ/g)
STECSpecific Thermal Energy Consumption (kJ/g)
SISustainability index
IPImprovement potential rate (kW)
NPVNet present value
PPPayback period
Subscripts
aAir
inInlet
outOutlet
Greek symbols
ηexExergy efficiency (%)
δThickness (m)
γThermal conductivity (W m−1 °K−1)

References

  1. Li, B.; Li, C.; Li, T.; Zeng, Z.; Ou, W.; Li, C. Exergetic, Energetic, and Quality Performance Evaluation of Paddy Drying in a Novel Industrial Multi-Field Synergistic Dryer. Energies 2019, 12, 4588. [Google Scholar] [CrossRef] [Green Version]
  2. Lingayat, A.; Chandramohan, V.P.; Raju, V.R.K. Energy and Exergy Analysis on Drying of Banana Using Indirect Type Natural Convection Solar Dryer. Heat Transf. Eng. 2019, 41, 551–561. [Google Scholar] [CrossRef]
  3. Aviara, N.A.; Onuoha, L.N.; Falola, O.E.; Igbeka, J.C. Energy and exergy analyses of native cassava starch drying in a tray dryer. Energy 2014, 73, 809–817. [Google Scholar] [CrossRef]
  4. Khanali, M.; Rafiee, S. Investigation of Hydrodynamics, Kinetics, Energetic and Exergetic Aspects of Fluidized Bed Drying of Rough Rice. Int. J. Food Eng. 2014, 10, 39–50. [Google Scholar] [CrossRef]
  5. Luthra, K.; Sadaka, S. Energy and Exergy Analysis of Rough Rice Drying in a Fluidized Bed and Fixed Bed with Ambient Air Dehumidification. In Proceedings of the 2021 ASABE Annual International Virtual Meeting, Online, 12–16 July 2021. [Google Scholar]
  6. Mujumdar, A.S. Handbook of Industrial Drying, 3rd ed.; Taylor & Francis Group LLC: Abingdon, UK; CRC Press: Boca Raton, FL, USA, 2006. [Google Scholar]
  7. Kemp, I.C. Fundamentals of energy analysis of dryers. In Modern Drying Technology–Energy Savings; Tsotsas, E., Mujumdar, A.S., Eds.; Wiley-VCH Verlag GmbH: Weinheim, Germany, 2011; pp. 1–46. [Google Scholar]
  8. Soysal, Y.; Öztekin, S.; Eren, Ö. Microwave Drying of Parsley: Modelling, Kinetics, and Energy Aspects. Biosyst. Eng. 2006, 93, 403–413. [Google Scholar] [CrossRef]
  9. Vera, I.; Langlois, L. Energy indicators for sustainable development. Energy 2007, 32, 875–882. [Google Scholar] [CrossRef]
  10. Chowdhury, M.M.I.; Bala, B.K.; Haque, M.A. Energy and exergy analysis of the solar drying of jackfruit leather. Bio-Syst. Eng. 2011, 110, 222–229. [Google Scholar] [CrossRef]
  11. Dincer, I.; Cengel, Y.A. Energy, entropy and exergy concepts and their roles in thermal engineering. Entropy Int. J. 2001, 3, 116–149. [Google Scholar] [CrossRef]
  12. Midilli, A.; Kucuk, H. Mathematical modelling of thin-layer drying of pistachio by using solar energy. Energy Convers. Manag. 2003, 44, 1111–1122. [Google Scholar] [CrossRef]
  13. Da Silva, G.M.; Ferreira, A.G.; Coutinho, R.M.; Maia, C.B. Energy and exergy analysis of the drying of corn grains. Renew. Energy 2021, 163, 1942–1950. [Google Scholar] [CrossRef]
  14. Maia, C.B.; Ferreira, A.G.; Cabezas-Gómez, L.; Silva, J.D.O.C.; de Morais Hanriot, S. Thermodynamic analysis of the drying process of bananas in a small-scale solar updraft tower in Brazil. Renew. Energy 2017, 114, 1005–1012. [Google Scholar] [CrossRef]
  15. Bhardwaj, A.K.; Kumar, R.; Chauhan, R. Experimental investigation of the performance of a novel solar dryer for drying medicinal plants in Western Himalayan region. Sol. Energy 2019, 177, 395–407. [Google Scholar] [CrossRef]
  16. Sarker MS, H.; Ibrahim, M.N.; Aziz, N.A.; Punan, M.S. Energy and exergy analysis of industrial fluidized bed drying of paddy. Energy 2015, 84, 131–138. [Google Scholar] [CrossRef]
  17. Yan, J.; Wei, H.; You, Z.; Wu, H.; Xu, X.; Xie, H. Energetic and exergetic performances during drying of freshly harvested peanut with industrial mixed-flow dryer. Energy Rep. 2022, 8, 7457–7467. [Google Scholar] [CrossRef]
  18. Li, C.; Chen, Y.; Zhang, X.; Mozafari, G.; Fang, Z.; Cao, Y.; Li, C. Exergy analysis and optimisation of an industrial-scale circulation counter-flow paddy drying process. Energy 2022, 251, 123901. [Google Scholar] [CrossRef]
  19. Aghbashlo, M. A proposed mathematical model for exergy analysis of an infrared (IR) drying process. Int. J. Exergy 2015, 18, 480–500. [Google Scholar] [CrossRef]
  20. Dincer, I.; Sahin, A.Z. A new model for thermodynamic analysis of a drying process. Int. J. Heat Mass Transf. 2004, 47, 645–652. [Google Scholar] [CrossRef]
  21. Dincer, I. Exergy as a potential tool for sustainable drying systems. Sustain. Cities Soc. 2011, 1, 91–96. [Google Scholar] [CrossRef]
  22. Syahrul, S.; Hamdullahpur, F.; Dincer, I. Exergy analysis of fluidized bed drying of moist particles. Int. J. Exergy 2002, 2, 87–98. [Google Scholar] [CrossRef]
  23. Apaiah, R.K.; Linnemann, A.R.; van der Kooi, H.J. Exergy analysis: A tool to study the sustainability of food supply chain. Food Res. Int. 2006, 39, 1–11. [Google Scholar] [CrossRef]
  24. Sharma, V.K.; Colangelo, A.; Spagna, G.; Pistocchi, F. Preliminary economic appraisal of solar air heating system used for drying of agricultural products. Energy Convers. Manag. 1994, 35, 105–110. [Google Scholar] [CrossRef]
  25. Li, B.; Li, C.; Huang, J.; Li, C. Exergoeconomic Analysis of Corn Drying in a Novel Industrial Drying System. Entropy 2020, 22, 689. [Google Scholar] [CrossRef]
  26. Zhang, F.; Yan, Y.; Liao, G.; Jiaqiang, E. Energy, exergy, exergoeconomic and exergoenvironmental analysis on a novel parallel double-effect absorption power cycle driven by the geothermal resource. Energy Convers. Manag. 2022, 258, 115473. [Google Scholar] [CrossRef]
  27. Al-Hamed, K.H.; Dincer, I. Exergoeconomic analysis and optimization of a solar energy-based integrated system with oxy-combustion for combined power cycle and carbon capturing. Energy 2022, 250, 123814. [Google Scholar] [CrossRef]
  28. Meng, N.; Li, T.; Kong, X.; Gao, X. Advanced exergy and exergoeconomic analyses and a case study of a novel trans-critical CO2 cycle with pressurization process for hot dry rock. Energy Convers. Manag. 2021, 246, 114687. [Google Scholar] [CrossRef]
  29. Fudholi, A.; Sopian, K.; Gabbasa, M.; Bakhtyar, B.; Yahya, M.; Ruslan, M.H.; Mat, S. Techno-economic of solar drying systems with water based solar collectors in Malaysia: A review. Renew. Sustain. Energy Rev. 2015, 51, 809–820. [Google Scholar] [CrossRef]
  30. Fudholi, A.; Sopian, K.; Yazdi, M.H.; Ruslan, M.H.; Gabbasa, M.; Kazem, H.A. Performance analysis of solar drying system for red chili. Sol. Energy 2014, 99, 47–54. [Google Scholar] [CrossRef]
  31. Fudholi, A.; Mat, S.; Basri, D.F.; Ruslan, M.H.; Sopian, K. Performances analysis of greenhouse solar dryer with heat exchanger. Contemp. Eng. Sci. 2016, 9, 135–144. [Google Scholar] [CrossRef]
  32. Banout, J.; Ehl, P. Using a double-pass solar drier for drying of bamboo. J. Agric. Rural Dev. Tropics Subtropics 2010, 111, 119–127. [Google Scholar]
  33. Yahya, M.; Fahmi, H.; Fudholi, A.; Sopian, K. Performance and economic analyses on solar-assisted heat pump fluidised bed dryer integrated with biomass furnace for rice drying. Sol. Energy 2018, 174, 1058–1067. [Google Scholar] [CrossRef]
  34. Philip, N.; Duraipandi, S.; Sreekumar, A. Techno-economic analysis of greenhouse solar dryer for drying agricultural produce. Renew. Energy 2022, 199, 613–627. [Google Scholar] [CrossRef]
  35. McGarity, A.E. Solar Heating and Cooling, An Economic Assessment; National Science Foundation, U.S. Govt Printing Office: Washington, DC, USA, 1977.
  36. Riva, G.; Mazzetto, F. Comparative Analysis of the Results Obtained by the Country Teams Applying the Procedure on Barriers Evaluation; REUR Technical Series; FAO: Rome, Italy, 1988. [Google Scholar]
  37. Wang, W.M.; Xiao, H.R.; Song, Z.Y.; Han, Y.; Ding, W.Q. Research status and prospect of mechanization technology in the whole process of tea production. Chin. J. Agric. Mach. 2020, 41, 226–236. [Google Scholar]
  38. Dong, S.L.; Sun, C. Mathematical model of heat transfer of green tea cyanogens. Tea Sci. 1988, 2, 81–82. [Google Scholar]
  39. Panchariya, P.C.; Popovic, D.; Sharma, A.L. Thin-layer modelling of black tea drying process. J. Food Eng. 2002, 52, 349–357. [Google Scholar] [CrossRef]
  40. Temple, S.J.; van Boxtel, A.J.B. Thin Layer Drying of Black Tea. J. Agric. Eng. Res. 1999, 74, 167–176. [Google Scholar] [CrossRef]
  41. Yin, H.F. Engineering principle of tea drying time prediction. China Tea 1987, 6, 3–5. [Google Scholar]
  42. Sevik, S. Experimental investigation of a new design solar-heat pump dryer under the different climatic conditions and drying behavior of selected products. Sol. Energy 2014, 105, 190–205. [Google Scholar] [CrossRef]
  43. Defraeye, T. Advanced computational modelling for drying processes—A review. Appl. Energy 2014, 131, 323–344. [Google Scholar] [CrossRef]
  44. Akpinar, E.K.; Midilli, A.; Bicer, Y. The first and second law analyses of thermodynamic of pumpkin drying process. J. Food Eng. 2006, 72, 320–331. [Google Scholar] [CrossRef]
  45. Yahya, M.; Fudholi, A.; Hafizh, H.; Sopian, K. Comparison of solar dryer and solar-assisted heat pump dryer for cassava. Sol. Energy 2016, 136, 606–613. [Google Scholar] [CrossRef]
  46. Fudholi, A.; Sopian, K.; Bakhtyar, B.; Gabbasa, M.; Othman, M.Y.; Ruslan, M.H. Review of solar drying systems with air-based solar collectors in Malaysia. Renew. Sustain. Energy Rev. 2015, 51, 1191–1204. [Google Scholar] [CrossRef]
  47. Ibrahim, M.N.; Sarker, M.S.H.; Aziz, N.A.B.; Salleh, M. Drying performance and overall energy requisite of industrial inclined bed paddy drying in Malaysia. J. Eng. Sci. Technol. 2014, 9, 398–409. [Google Scholar]
  48. Aghbashlo, M.; Tabatabaei, M.; Jazini, H. Exergoeconomic and exergoenvironmental co-optimization of continuous fuel additives (acetins) synthesis from glycerol esterification with acetic acid using Amberlyst 36 catalyst. Energy Convers. Manag. 2018, 65, 183–194. [Google Scholar] [CrossRef]
  49. Khanlari, A.; Güler, H.Ö.; Tuncer, A.D.; Şirin, C.; Bilge, Y.C.; Yılmaz, Y.; Güngör, A. Experimental and numerical study of the effect of integrating plus-shaped perforated baffles to solar air collector in drying application. Renew. Energy 2020, 145, 1677–1692. [Google Scholar] [CrossRef]
  50. Yahya, M. Sistem Penyahlembapan Terbantu Suria Untuk Herba Perubatan. Ph.D. Thesis, Universitas Kebangsaan Malaysia, Selangor, Malaysia, 2007. [Google Scholar]
  51. Ma, X.; Fang, Z.; Li, C. Energy efficiency evaluation and experiment on grain counter-flow drying system based on exergy analysis. Trans. Chin. Soc. Agric. Eng. 2017, 33, 285–291. [Google Scholar]
  52. Shiun, L.J.; Haslenda, H.; Zainuddin, A.M.; Shariafah, R.A. Optimal design of a rice mill utility system with rice husk logistic network. Ind. Eng. Chem. 2012, 51, 362–373. [Google Scholar] [CrossRef]
  53. Beigi, M.; Tohidi, M.; Torki-Harchegani, M. Exergetic analysis of deep-bed drying of rough rice in a convective dryer. Energy 2017, 140, 374–382. [Google Scholar] [CrossRef]
  54. Kuzgunkaya, E.H.; Hepbasli, A. Exergetic evaluation of drying of laurel leaves in a vertical ground-source heat pump drying cabinet. Int. J. Energy Res. 2007, 31, 245–258. [Google Scholar] [CrossRef]
  55. Aghbashlo, M.; Mobli, H.; Madadlou, A.; Rafiee, S. Influence of spray dryer parameters on exergetic performance of microencapsulation process. Int. J. Exergy 2012, 10, 267–289. [Google Scholar] [CrossRef]
  56. Rosen, M.A.; Dincer, I. Exergy as the confluence of energy, environment and sustainable development. Int. J. Exergy 2001, 1, 3–13. [Google Scholar] [CrossRef]
  57. Xiong, S.; Sun, W.; Zhao, L.; Lu, Z.; He, X.; Mao, J.; Zhou, Q. Optimization of three-stage drying of paddy. Food Sci. 2017, 38, 274–281. [Google Scholar]
  58. Yildirim, N.; Genc, S. Energy and exergy analysis of a milk powder production system. Energy Convers. Manag. 2017, 149, 698–705. [Google Scholar] [CrossRef]
Figure 1. The freshly tea leaves for the experiment.
Foods 11 03281 g001
Figure 2. Photograph of the gas-type industrial drying system of black tea.
Foods 11 03281 g002
Figure 3. Schematic sketch of the gas-type industrial drying system of black tea.
Foods 11 03281 g003
Figure 4. Total energy consumption ratios of the whole system: (a) energy consumption ratios in initial drying period; (b) energy consumption ratios in redrying period.
Foods 11 03281 g004
Figure 5. Variation in the exergy inflow, exergy outflow and exergy of the chamber vs. drying time: (a) variation of exergy in the initial drying period; (b) variation of exergy in the redrying period.
Foods 11 03281 g005
Table 1. Detailing operation process in the present work.
MaterialsDrying Period
(Air Temperature)
Duration (min)Mian FunctionProduct
Fresh tea leaves
(Approximately 180 kg)
Initial drying (120 °C)90 minInitial drying teaDry tea
(Approximately 45 kg)
Redrying (100 °C)60 minRedrying tea
Table 2. Details of the experimental instruments.
InstrumentTypeMeasurementInstrument
Thermal resistancePT100−200–450 °C±0.1 °C
Temperature and humidity sensorsAM23010–100%/−40–80 °C±3%/±0.5 °C
Electronic scaleABJ 320-4NM 0–380 g±0.01 g
Constant-temperature drying box DGG-9070A105 °C±0.1 °C
Data acquisition systemSelf-developed--
Intelligent anemometerDP20000~100 m/s, 0~ + ∞ m3/h, 0~ ± 10 KPa±0.1 m/s, ±0.5 m3/h, ±0.5 KPa
Table 3. Energy–exergy analysis of black tea drying system.
Energy–Exergy AnalysisEquationEq. No.
Total heat applied from gas Q g a s = V g a s × q g a s (4)
Energy for heating air Q a = m g , a c p , a ( T 1 T 0 ) (5)
Heat loss of exhaust air outlet Q l o s s , a i r = m g , a c p , a ( T 4 T 0 ) (6)
Heat loss of the wall heat transfer Q l o s s , w a l l = 1.3 A 0 ( δ / γ ) i = 1 4 ( T w a l l , i T 0 ) (7)
Exergy for heating air E x g a s = m g , a c p , a [ ( T 1 T 0 ) T 0 l n ( T 1 T 0 ) ] (8)
Exergy of air blower E x b l o w e r = W b l o w e r = P b l o w e r t (9)
Exergy of chain plate motor E x m o t o r = W m o t o r = P m o t o r t (10)
Exergy of hoist E x h o i s t = W h o i s t = P h o i s t t (11)
Total exergy entering the drying system E x d c , i n = E x g a s + E x b l o w e r + E x m o t o r + E x h o i s t (12)
Total exergy outlet the drying system (13)
The specific energy consumption S E C = E x g a s + E x b l o w e r + E x m o t o r + E x h o i s t D R (14)
The specific thermal energy consumption S T E C = E x g a s D R (15)
Exergy of drying chamber E x d c = E x d c , i n E x d c , o u t (16)
Exergy efficiency for drying chamber η e x = E x d c E x d c , i n (17)
The improvement potential I P = ( 1 η e x ) E x d c (18)
The sustainability index S I = 1 ( 1 η e x ) (19)
Table 4. Economic analysis of black tea drying system.
Economic IndexEquationEq. No.
Production cost C P = C e l + C g a s + C l a + C m + C d P (20)
Profit P R = T S C C C P (21)
Return of capital R O R = P R C C (22)
Payback period P P = C C P R (23)
Net present value N P V = n 1 N P n ( 1 + i ) n C C (24)
P n = S ( 1 + i ) n (25)
Table 5. Detail parameters of the related equipment applied in this work.
ParametersUnitUncertainty Value
Moisture contentgwater/gwet mateer±0.012
Air temperature°C±0.299
Mass of the productkg±0.113
Specific energy consumptionkJ/g±4.436%
specific thermal energy consumptionkJ/g±4.391%
Time measurementmin±0.124
Table 6. Detailed parameters of the related equipment applied in this work.
EquipmentPower
Induced fan3 kw
Chain plate motor0.37 kw
Hoist0.37 kw
Table 7. Variation of the heat loss in the different drying period.
PeriodInitial Drying PeriodRedrying Period
Time (min)0102030405060708090100110120130140150160
Heat loss of exhaust air (kW)14.8923.49 33.42 41.9147.64 50.22 50.98 51.8452.4252.3251.2749.5549.8449.5549.8450.3250.22
Heat loss of wall heat transfer (kW)0.9461.127 1.214 1.315 1.375 1.378 1.398 1.415 1.420 1.421 1.240 1.227 1.231 1.227 1.230 1.230 1.229
Percentage of total heat loss to total heat (%)14.3822.3431.4439.2444.4946.8447.5548.3448.8748.7857.2055.3155.6355.3155.6356.1556.04
Table 8. Variations in the evaluation indicators of the drying system.
Drying ProcessDrying Time (min)Drying System
ηexIP (kW)SI (-)SEC (kJ/g)STEC (kJ/g)
Initial drying period065.09%11.772.8618.0916.43
1064.34%11.882.8019.5817.91
2055.23%12.802.2319.8318.17
3048.97%12.941.9620.6719.00
4043.12%12.701.7620.9619.29
5038.28%12.231.6220.6018.94
6038.69%12.281.6320.9219.26
7037.85%12.181.6120.9919.32
8038.08%12.211.6221.2119.55
9038.63%12.281.6321.3119.65
Redrying period10024.76%6.931.33129.58116.27
11026.00%7.161.35127.13113.82
12026.60%7.261.36128.60115.29
13026.56%7.261.36127.87114.56
14026.97%7.331.37129.09115.78
15025.55%7.081.34128.36115.05
16026.28%7.211.36129.09115.78
Table 9. The capital costs of the drying system.
Item CostUSD
Furnace1025.94
Blower180.47
Drying chamber6414.00
Hoist1676.38
Chain plate motor94.75
Transportation and installation costs728.86
Infrastructure cost72,886.30
Tea garden construction and management costs74,344.02
Whole capital cost157,350.72
Currency exchange rate: 6.86 CNY = 1 USD
Table 10. Parameters used in the calculation of the net present value (NPV) and payback period (PP) of the drying system.
ParameterUnitValue
Initial weight of teakg180
Final weight of teakg45
Initial moisture content of tea (wet basis)%58.33
Finial moisture content of tea (wet basis)%4.63
Drying timemin162
Price of the fresh teaUSD/kg0.67
Factory price of dried teaUSD/kg14.57
Price of natural gasUSD/kg3.12
Price of electricityUSD/kWh0.10
Tea harvest and management costsUSD/day213.41
Discount factor%10
Maintenance costs%2
Depreciation%9.5
Expected life of the dryerYear10
Net present value (NPV)USD179,442.03
Payback Period (PP)Years5.3
Currency exchange rate: 6.86 CNY = 1 USD
Table 11. Cash flow statement of the drying system.
Years012345678910
Capital costs (USD)157,350.72
Production costs (USD)
Fresh tea 21,865.89
Labor 30,731.04
Electrical 139.97
Natural gas 8388.06
Maintenance 3147.01
Depreciation 14,240.24
Total production costs (USD) 64,271.97
Revenue (USD) 94,413.60
Net cash flow (USD) 30,141.63
Currency exchange rate: 6.86 CNY = 1 USD
Table 12. NPV of the drying system (NPV = 179,442.03 USD).
YearsCapital Costs (CC)Net Cash FlowDiscount FactorPresent Value
(USD)(USD)(i = 10%)(USD)
0157,350.72 1
1 30,141.630.909127,401.76
2 30,141.630.826424,909.04
3 30,141.630.751322,645.41
4 30,141.630.683020,586.73
5 30,141.630.620918,714.94
6 30,141.630.564517,014.95
7 30,141.630.513215,468.68
8 30,141.630.466514,061.07
9 30,141.630.424112,783.07
10 30,141.630.385511,619.60
185,205.25
The final depreciation value14,948.32
The final present value5763.22
Currency exchange rate: 6.86 CNY = 1 USD
Table 13. Payback Period of drying system (PP = 5.3 years).
YearsCapital Costs (CC)Annual BenefitBenefit Cumulative
(USD)(USD)(USD)
0157,350.7200
1 30,141.6330,141.63
2 30,141.6360,283.26
3 30,141.6390,424.89
4 30,141.63120,566.52
5 30,141.63150,708.15
6 30,141.63180,849.78
Currency exchange rate: 6.86 CNY = 1 USD
Publisher’s Note: MDPI stays neutral with regard to jurisdictional claims in published maps and institutional affiliations.

