
A Rapid Prediction Method of Moisture Content for Green Tea Fixation Based on WOA-Elman
Abstract
:1. Introduction
2. Material and Methods
2.1. Sample Preparation
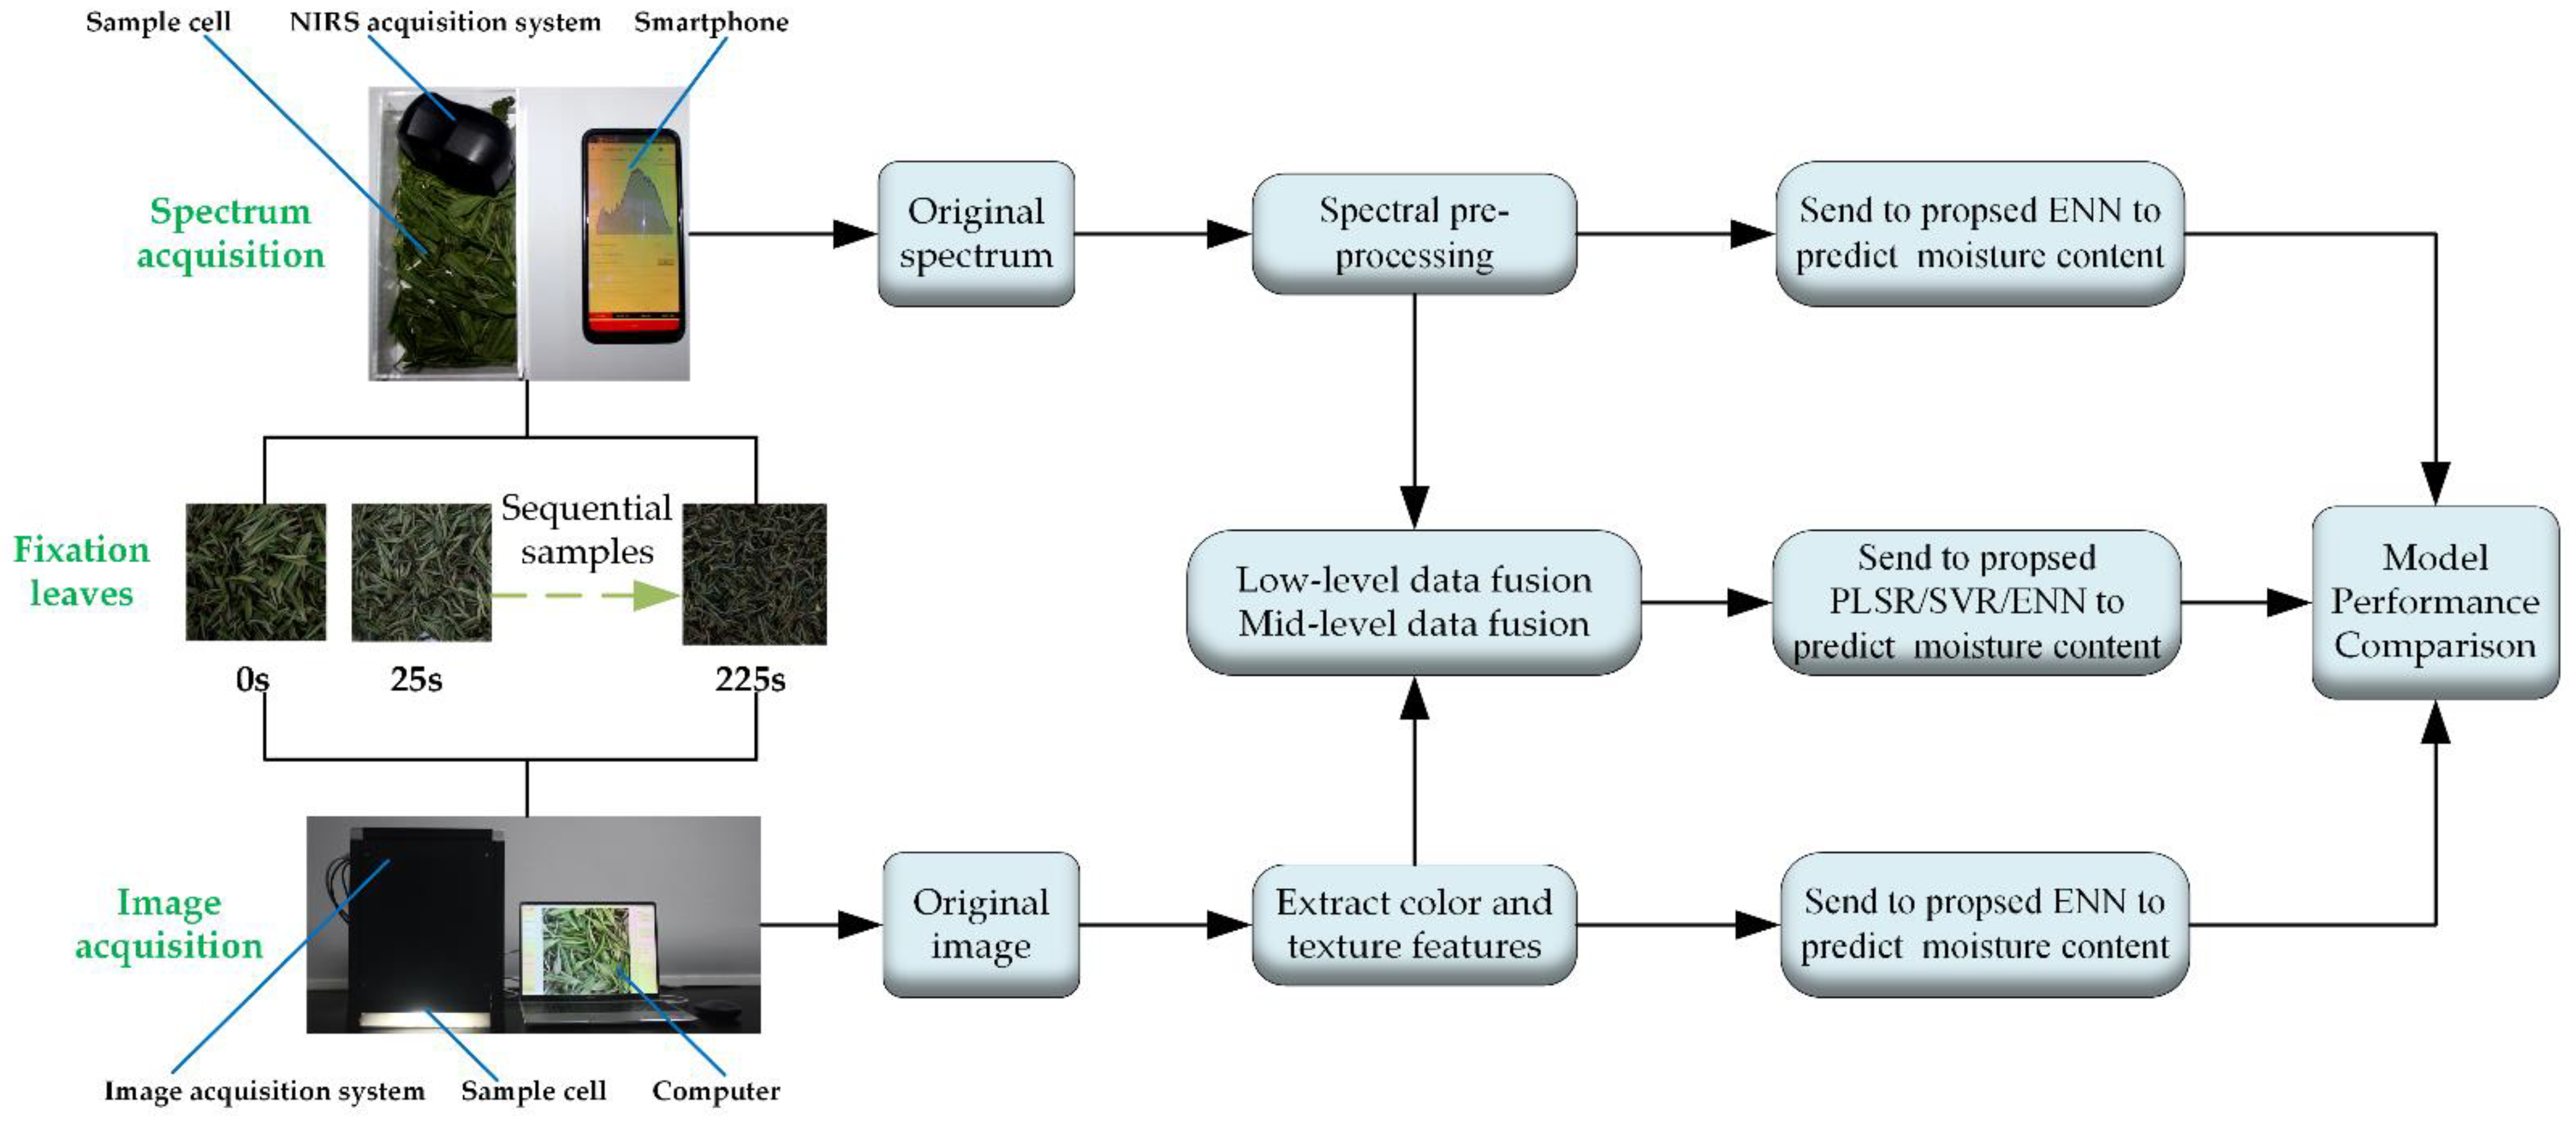
2.2. Data Acquisition
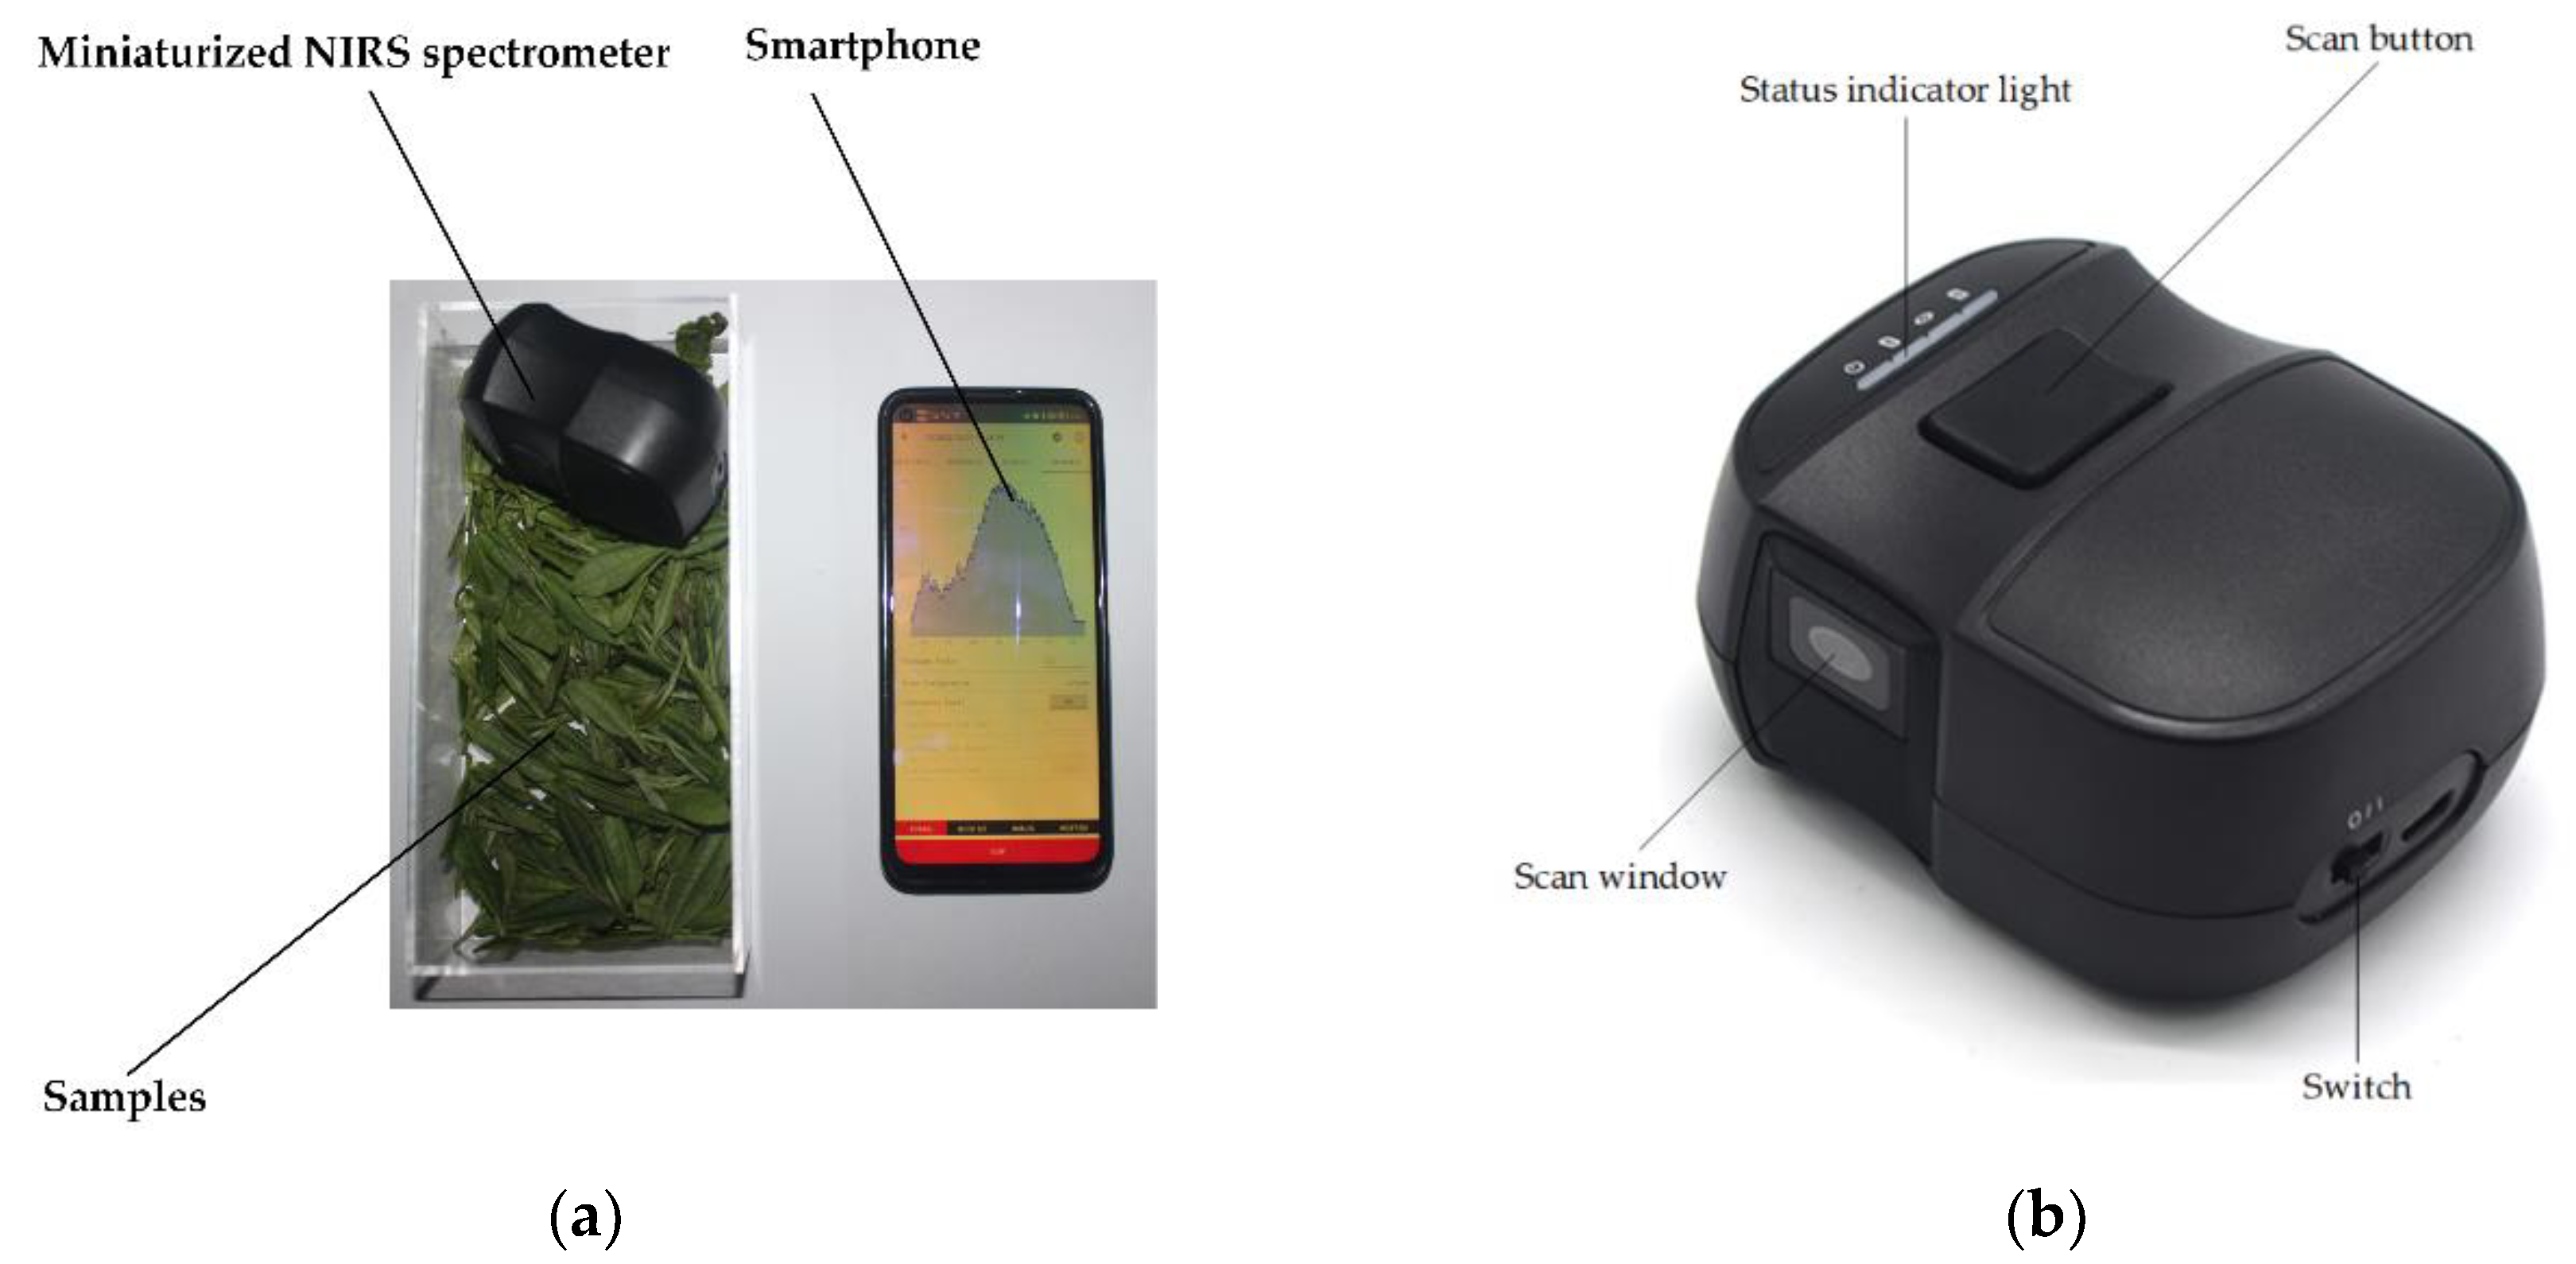
2.2.1. Spectral Data Collection
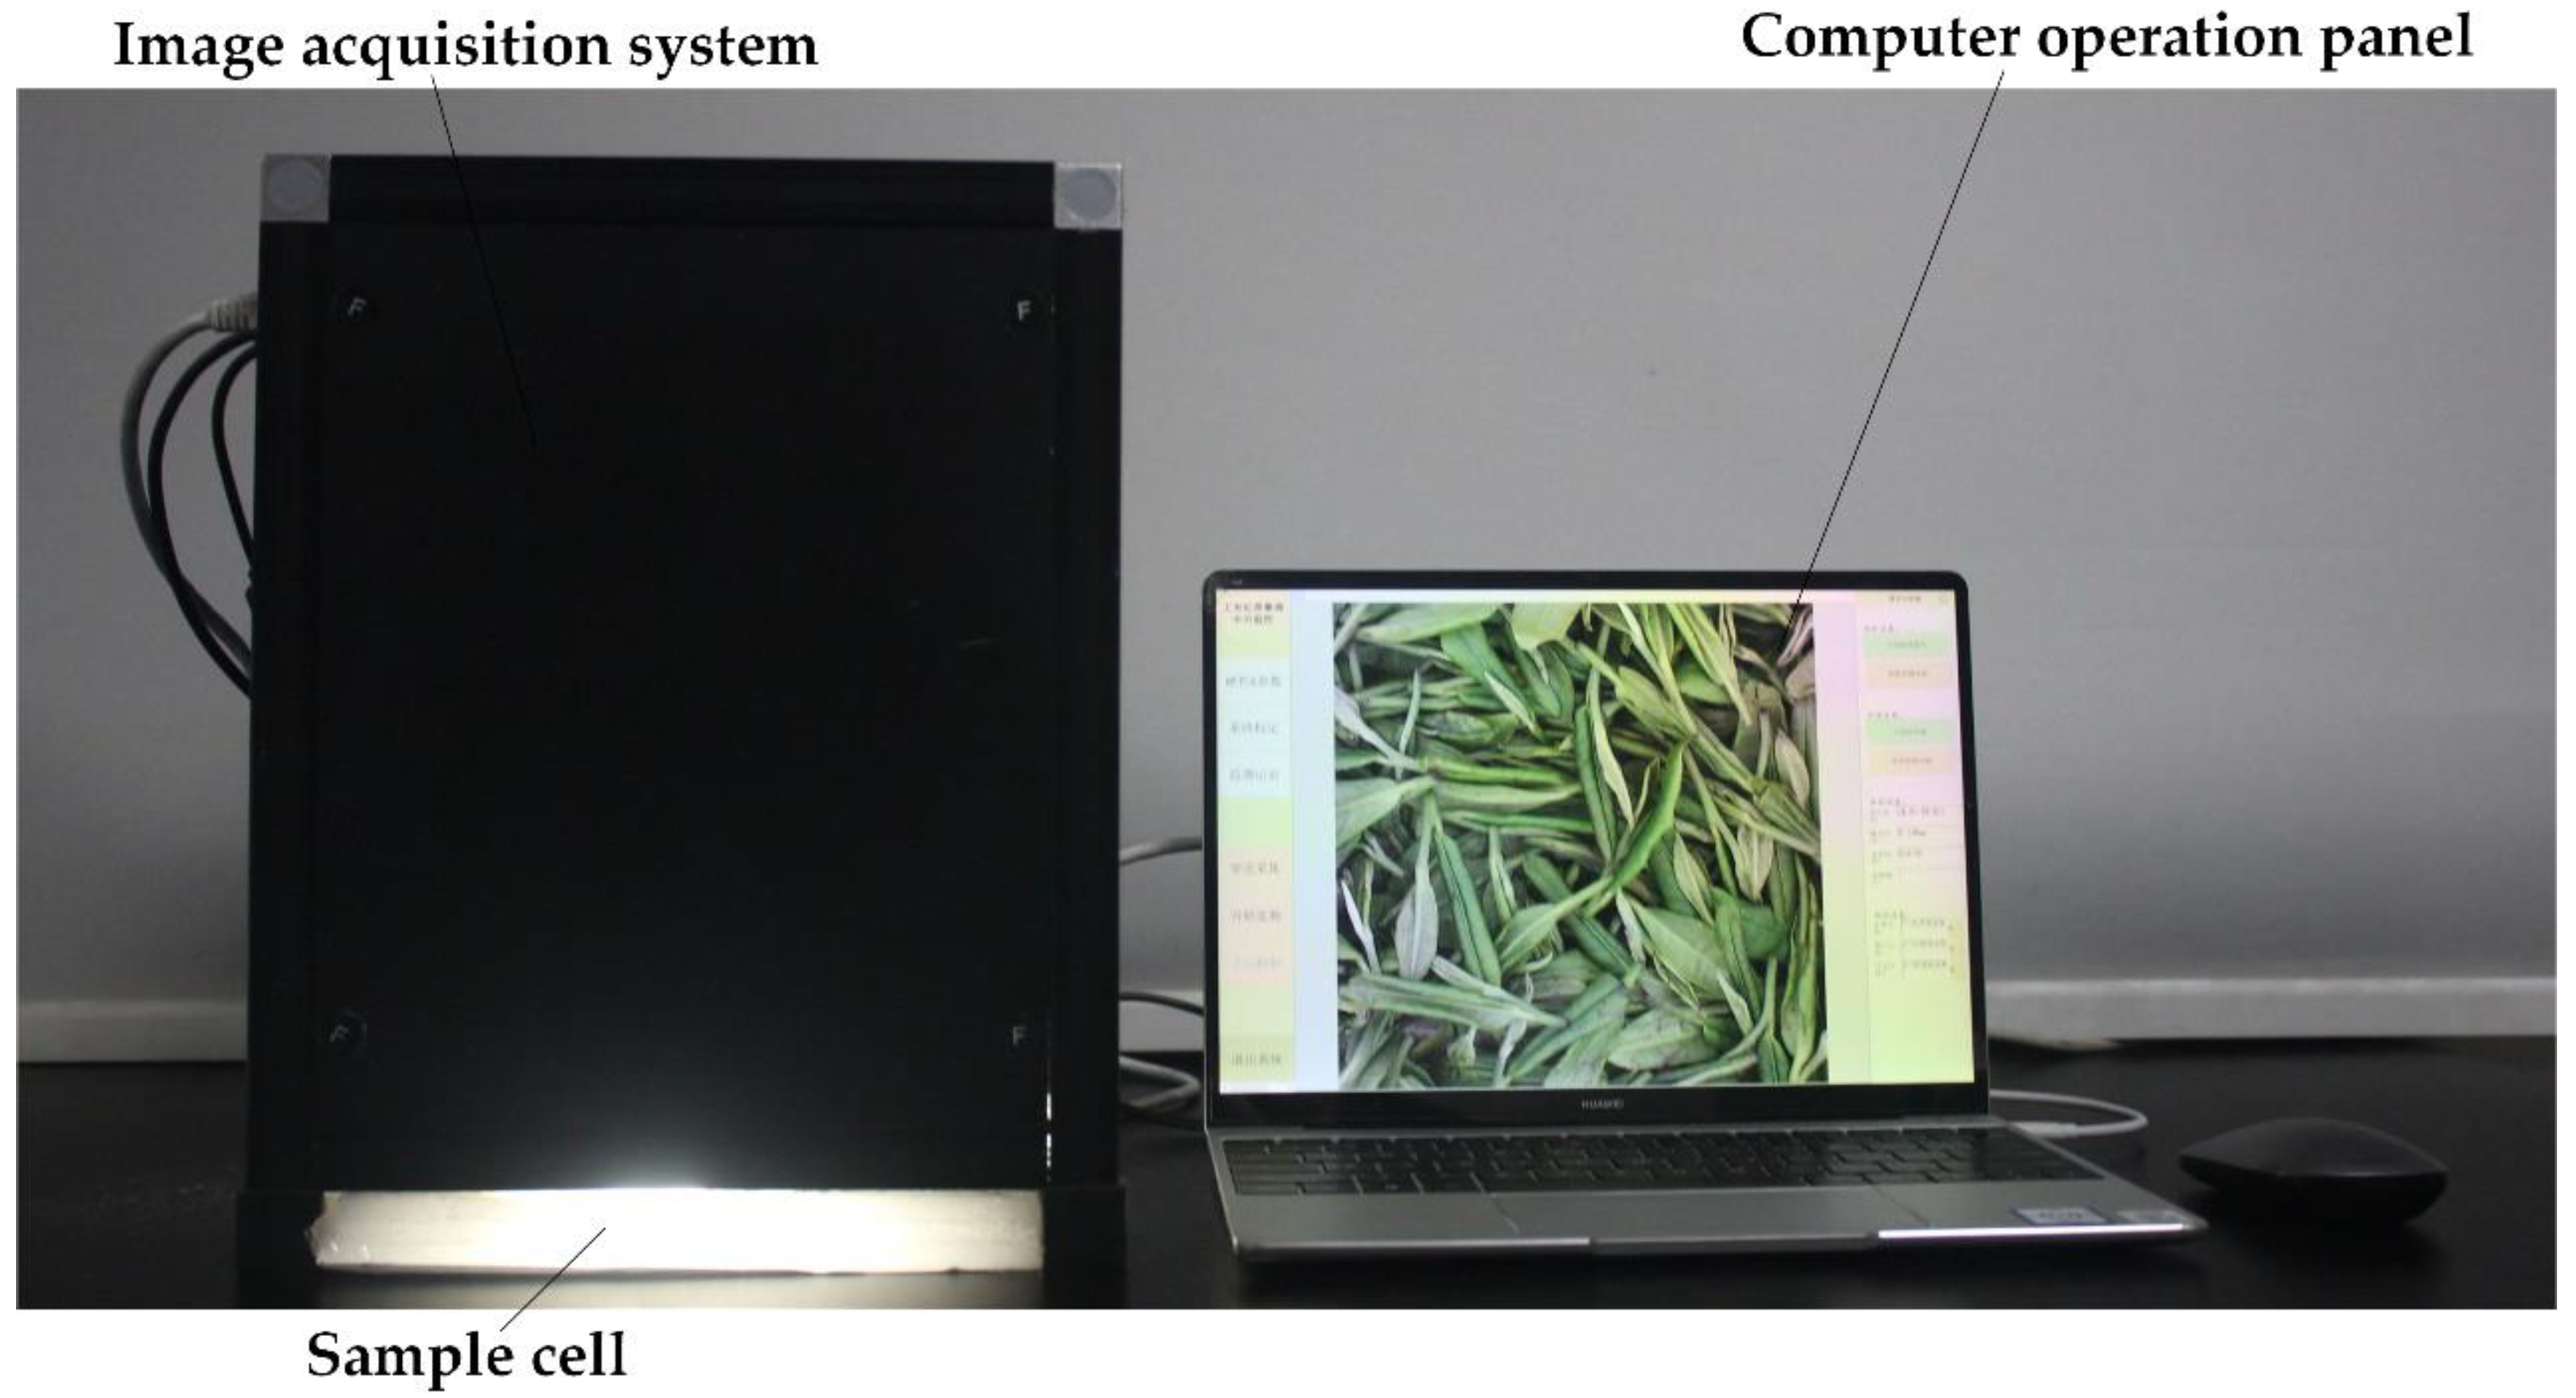
2.2.2. Image Acquisition
2.2.3. Determination of Moisture Content of Fixation Leaves
2.3. Data Processing
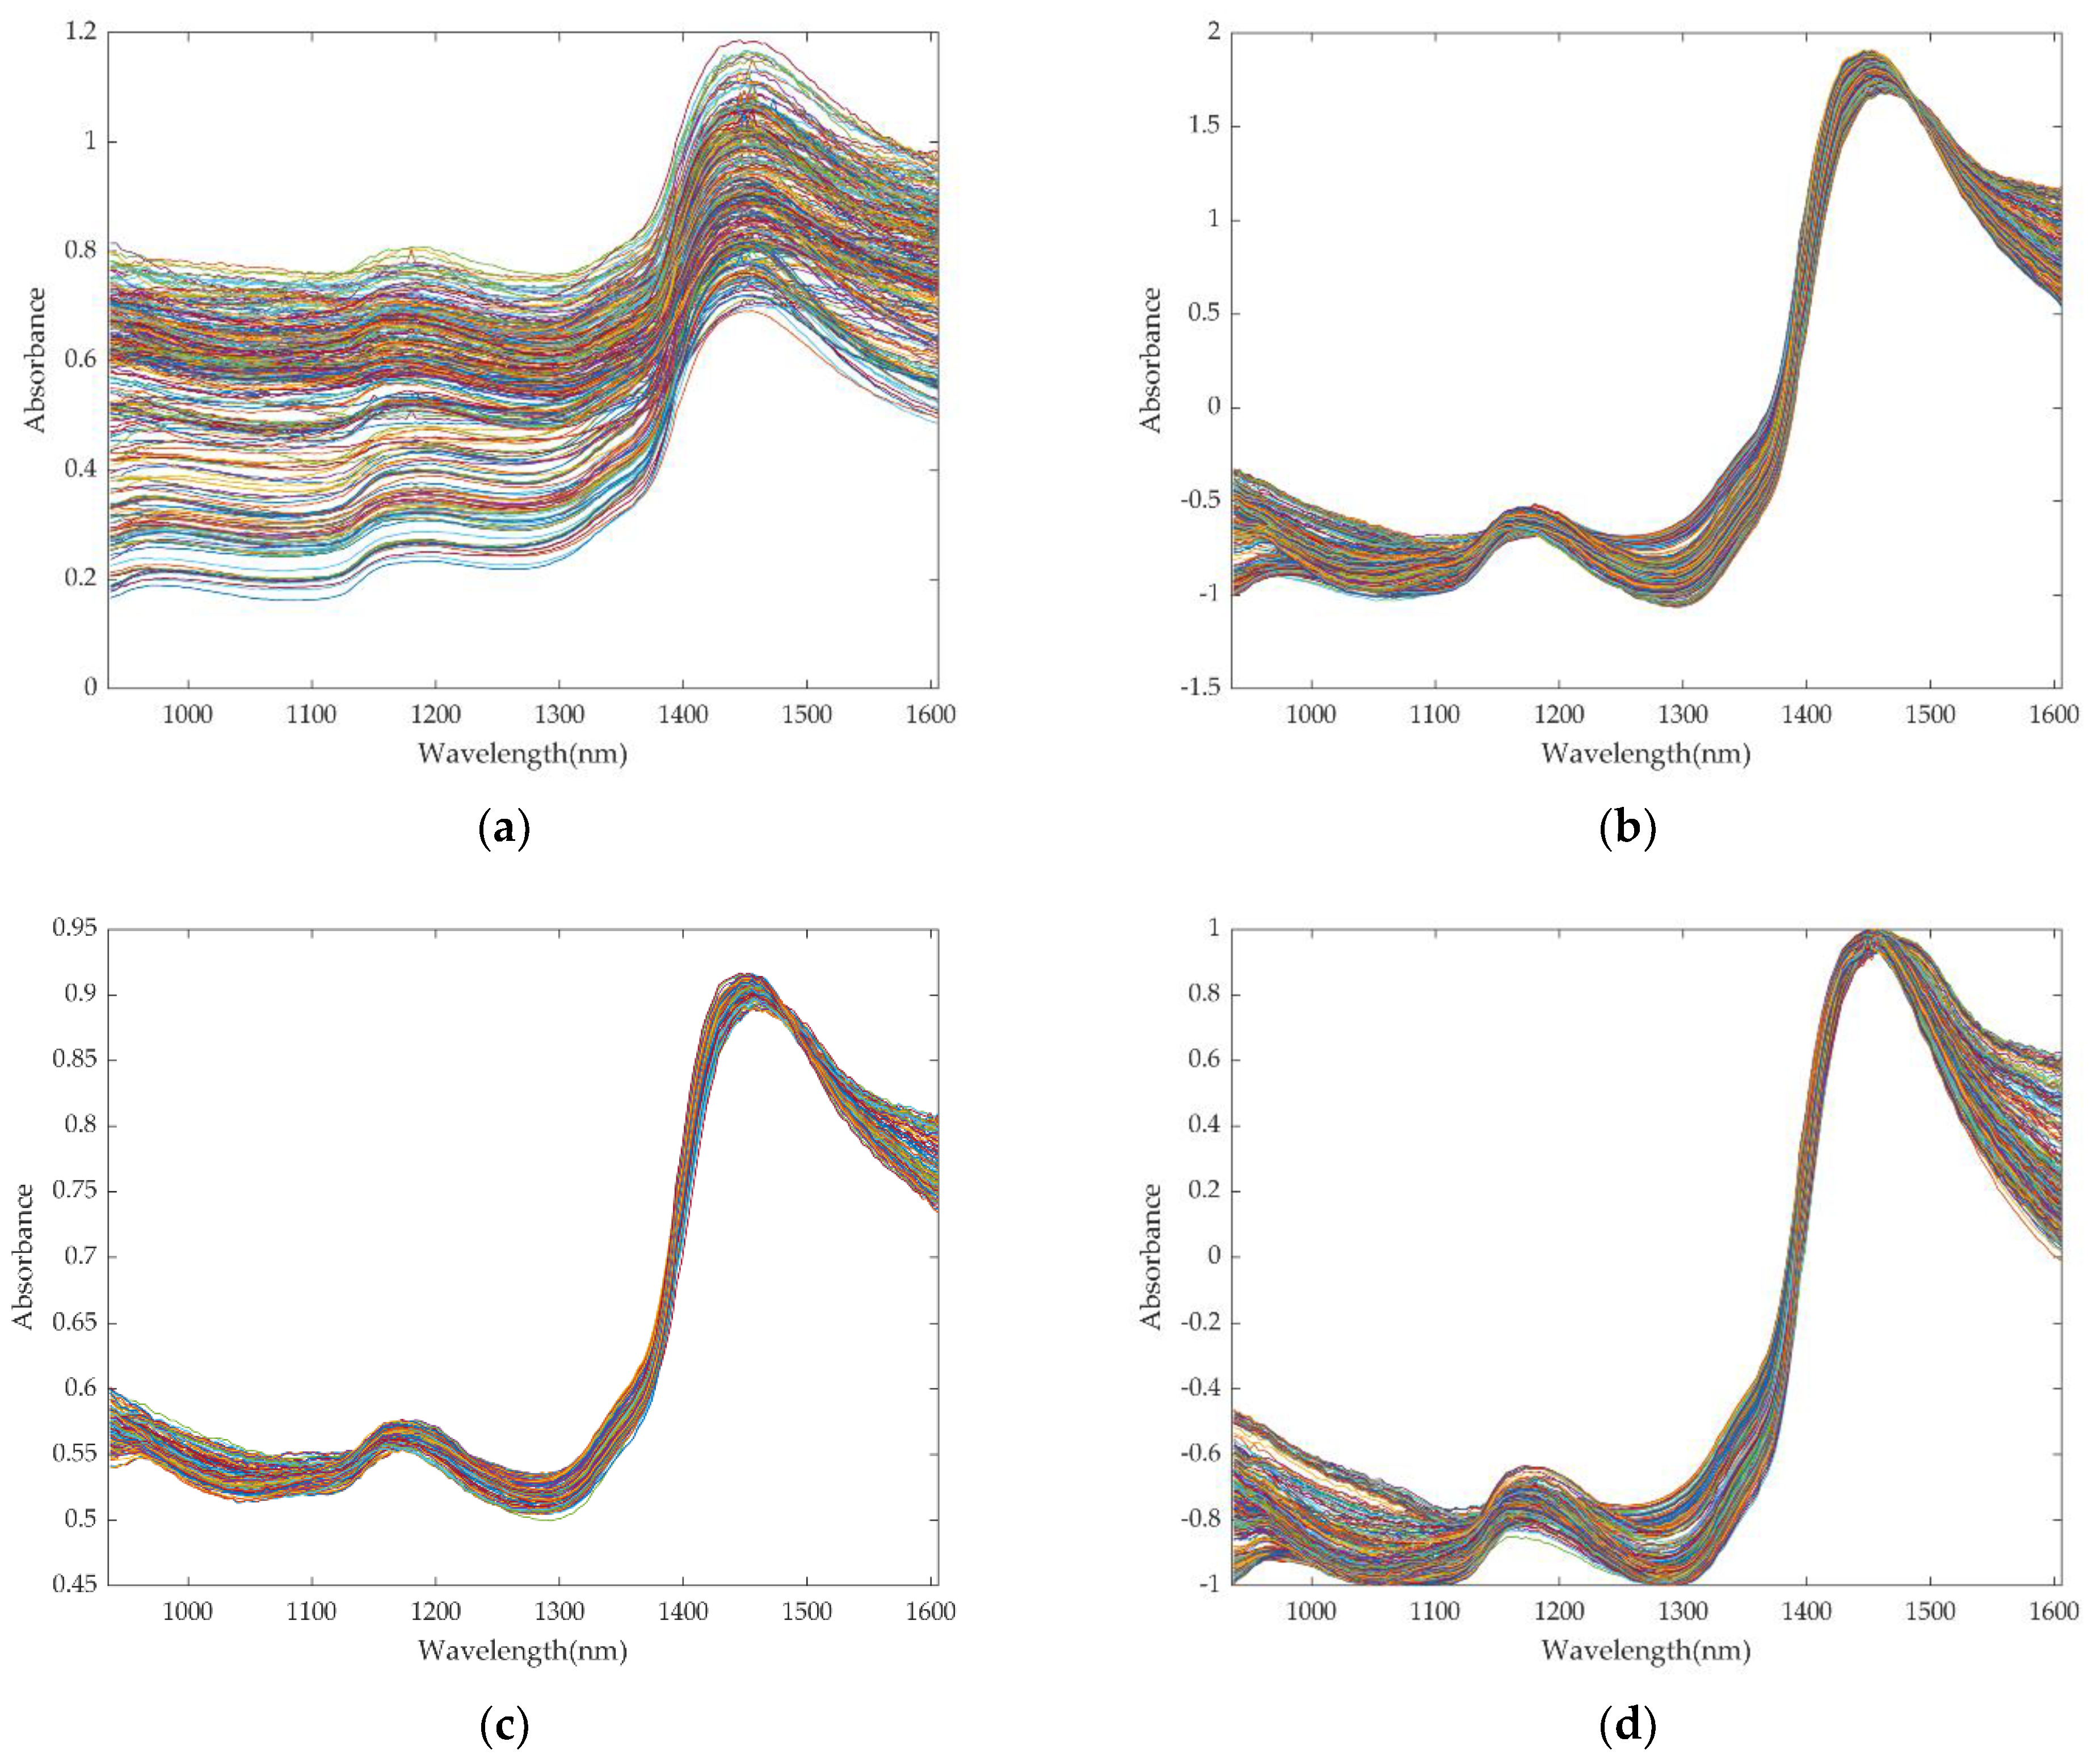
2.3.1. Spectral Preprocessing
2.3.2. Image Feature Extraction
2.3.3. Data Dimensionality Reduction and Data Fusion
2.4. Quantitative Prediction Model Establishment
2.4.1. Division of the Dataset
2.4.2. Elman Neural Network
2.4.3. Elman Neural Network Using the Whale Optimization Algorithm
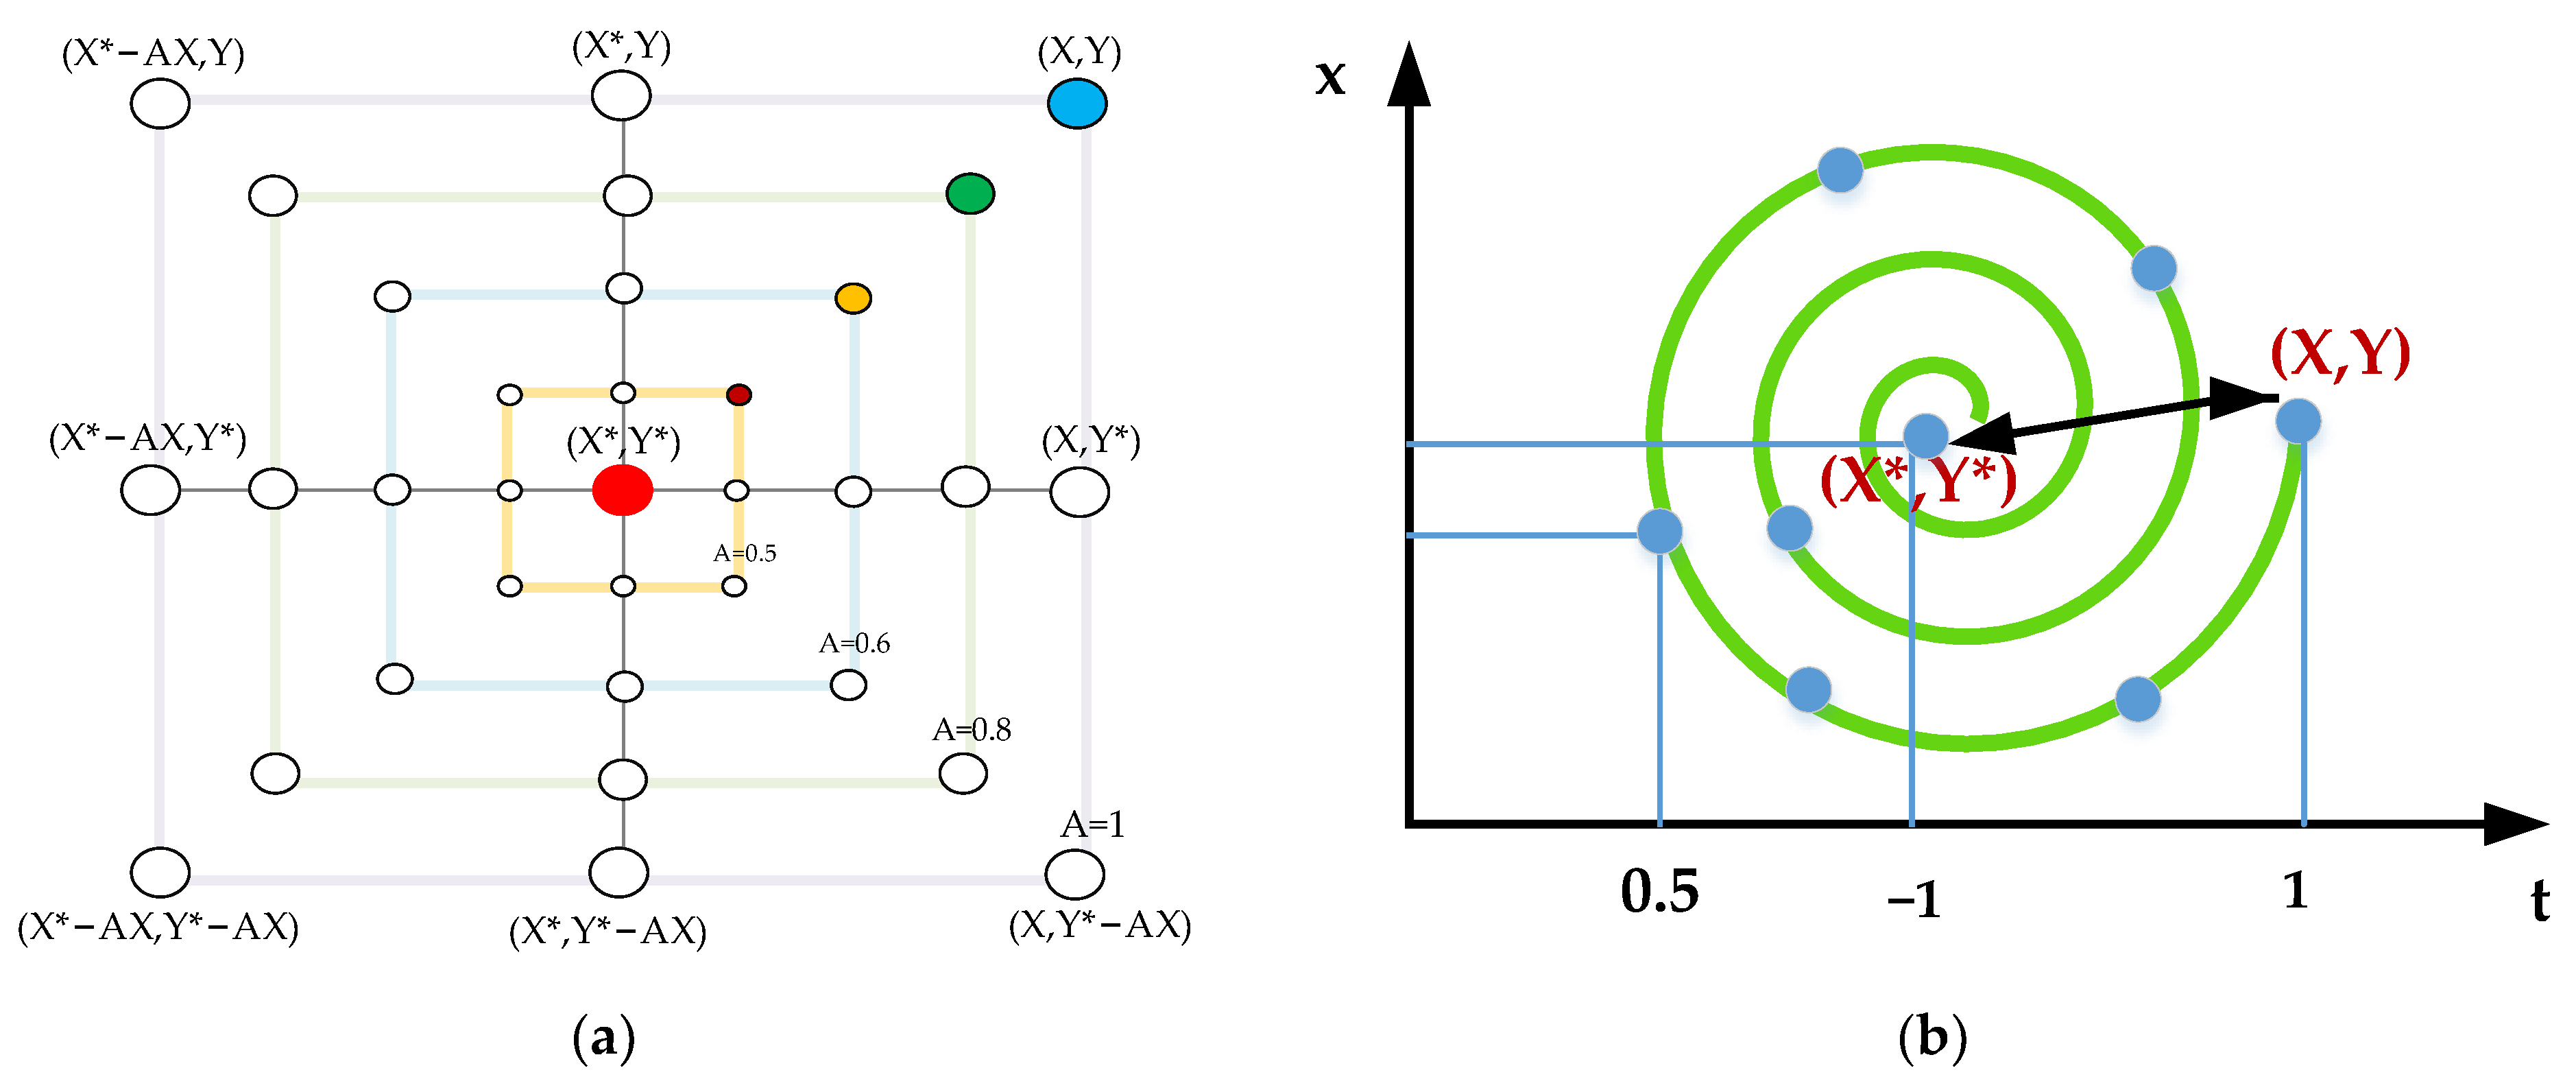
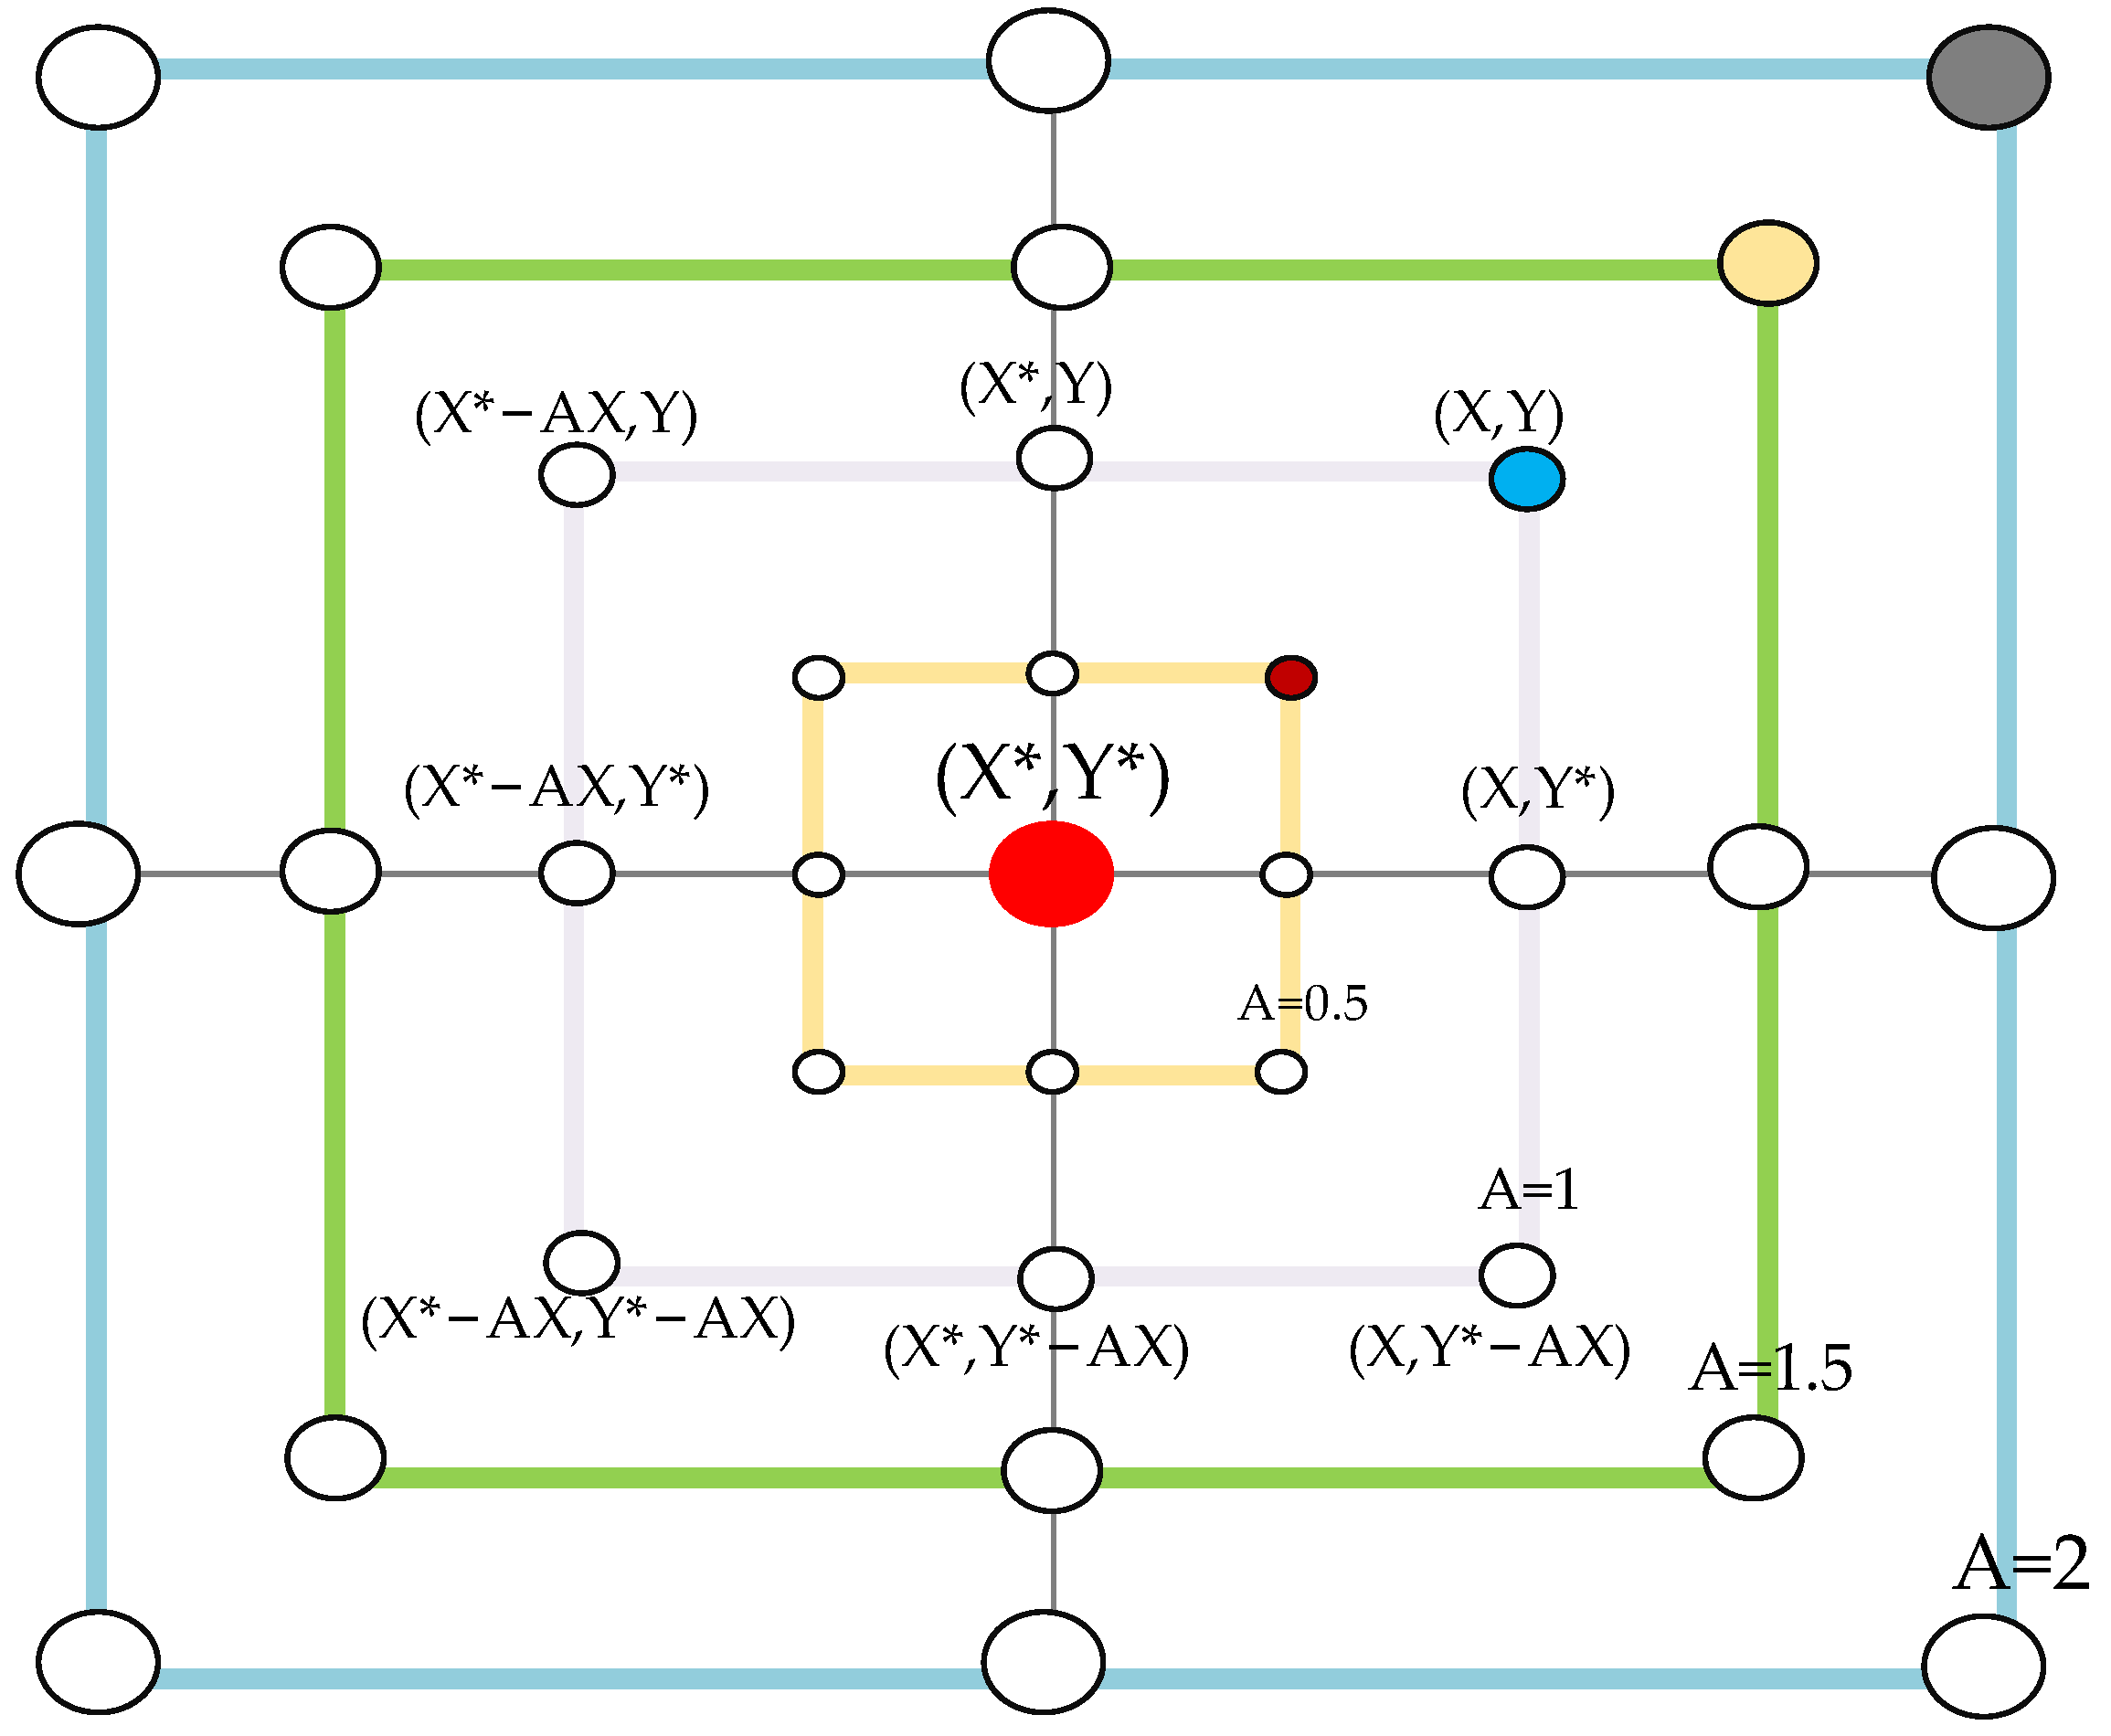
Whale Optimization Algorithm
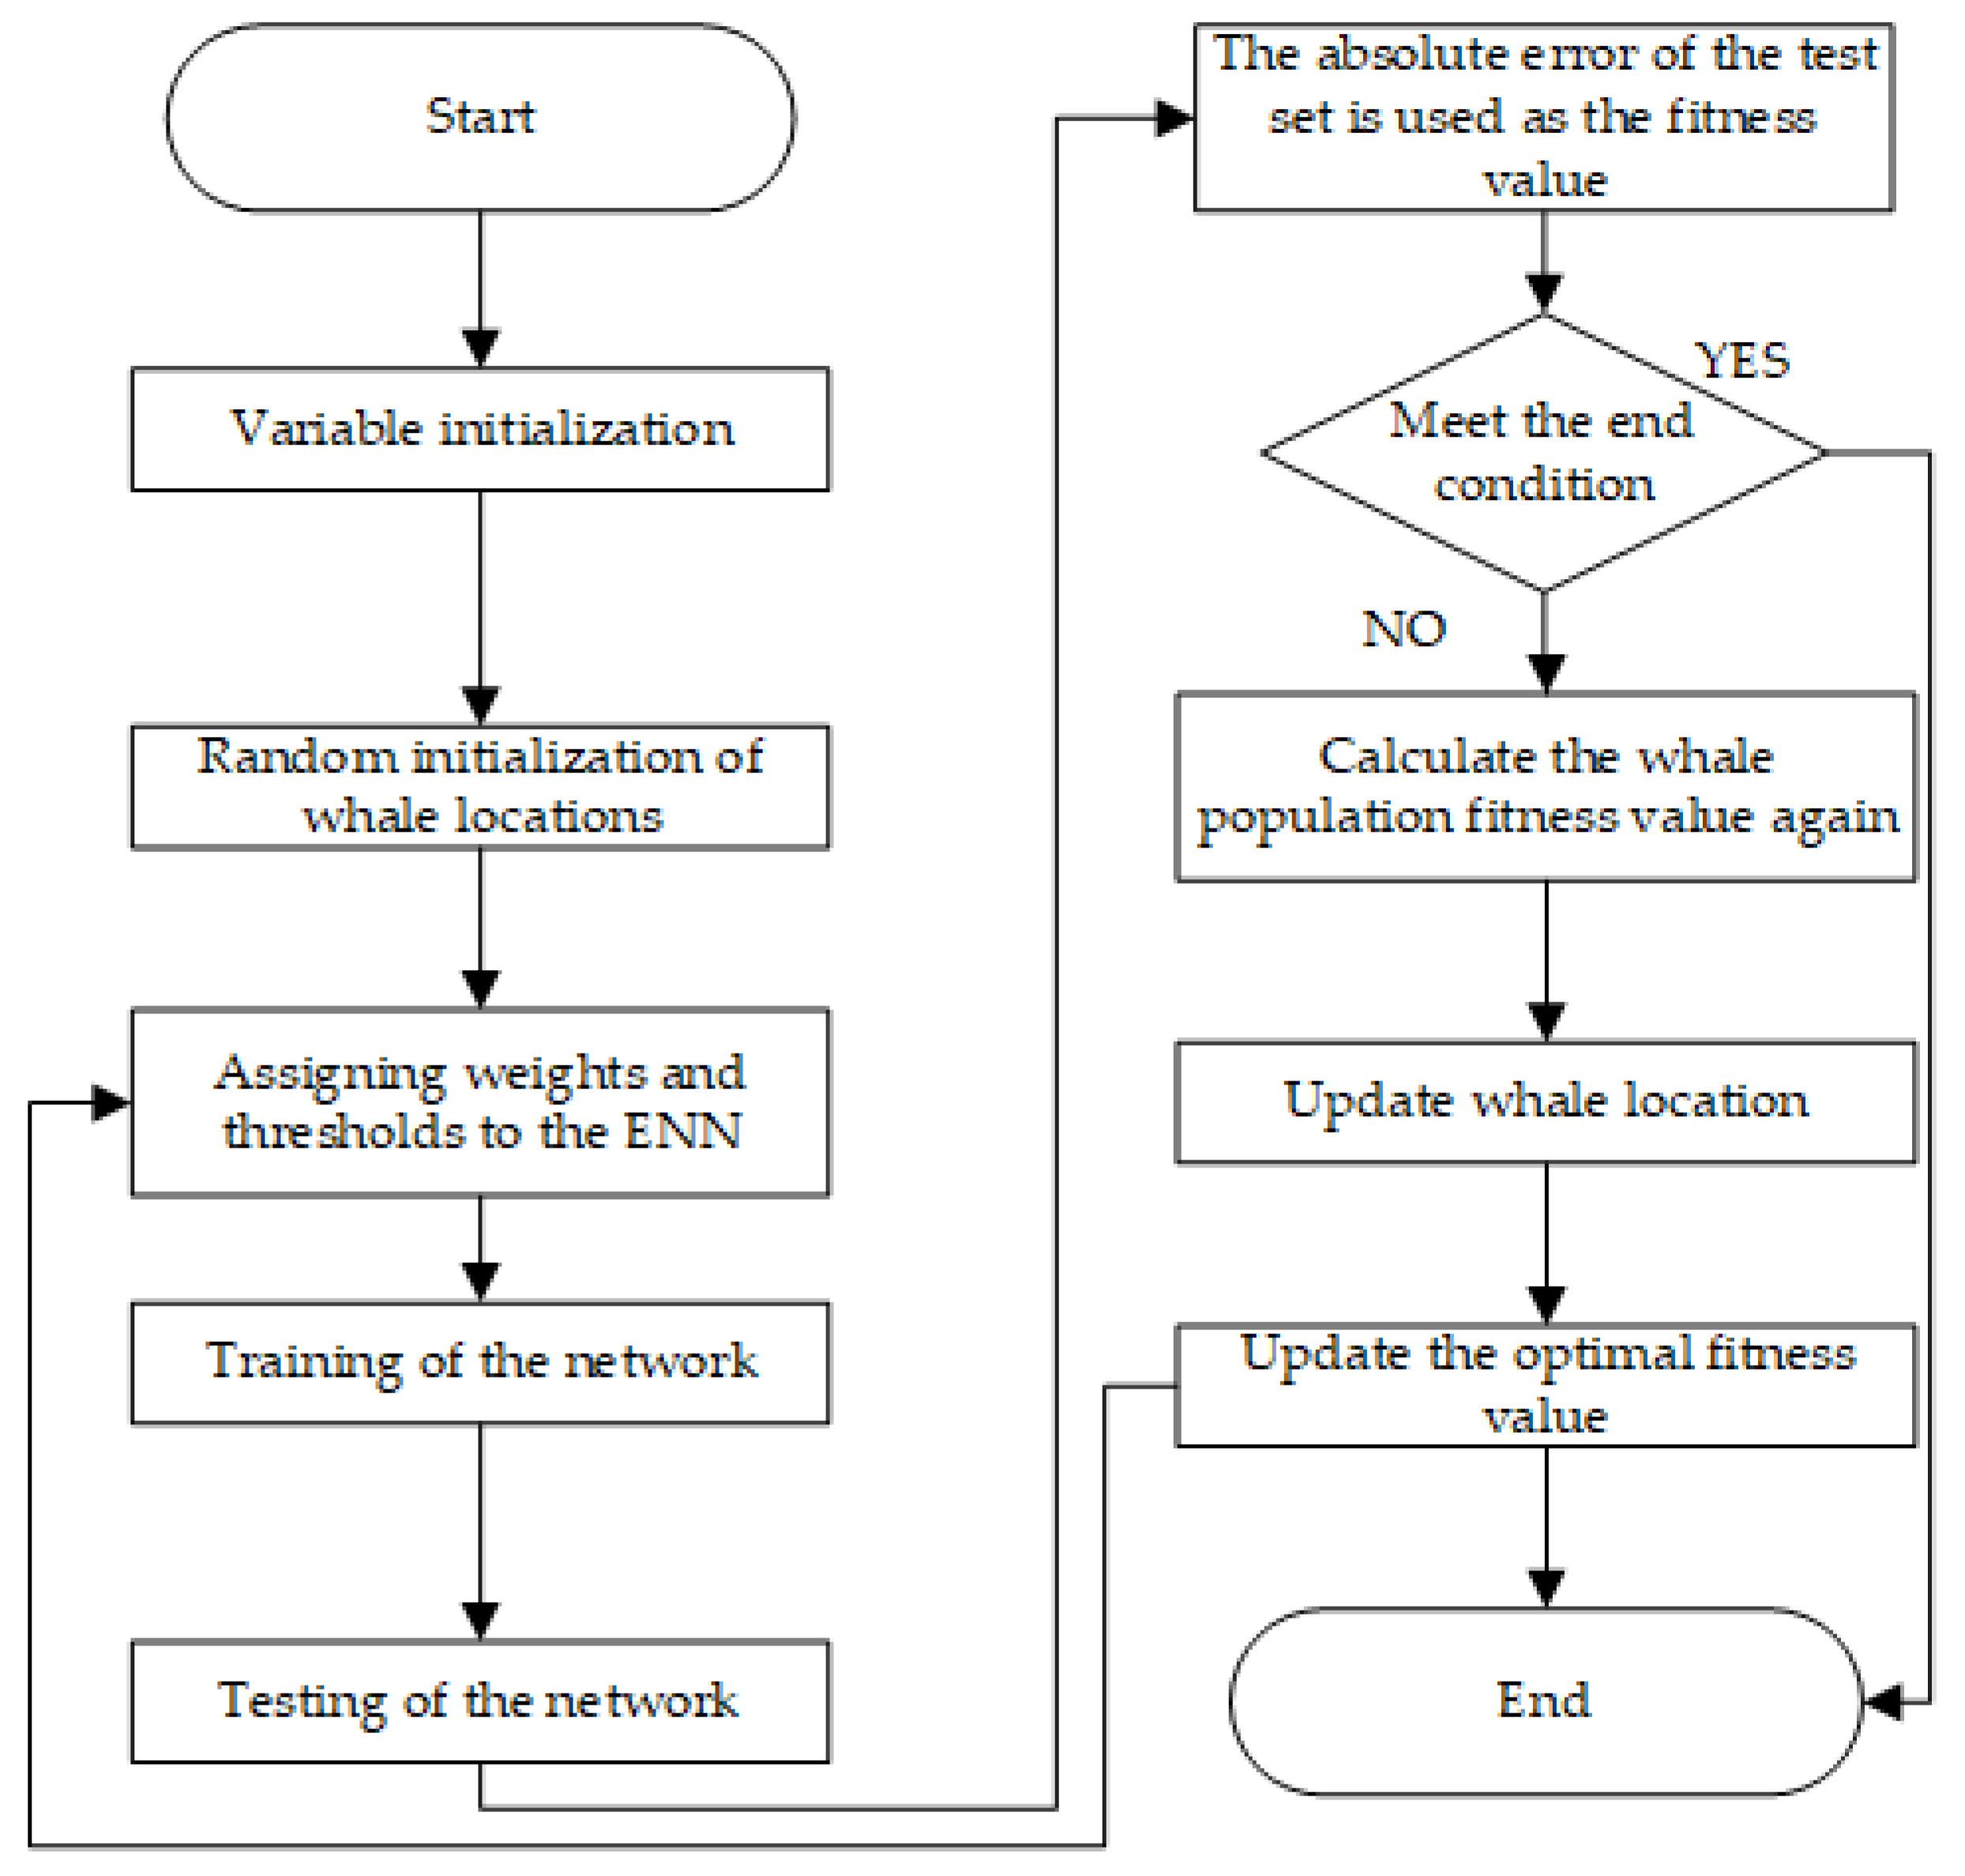
WOA-Elman Neural Network
2.4.4. Other Quantitative Prediction Models
2.4.5. Model Evaluation
2.5. Software
3. Results and Analysis
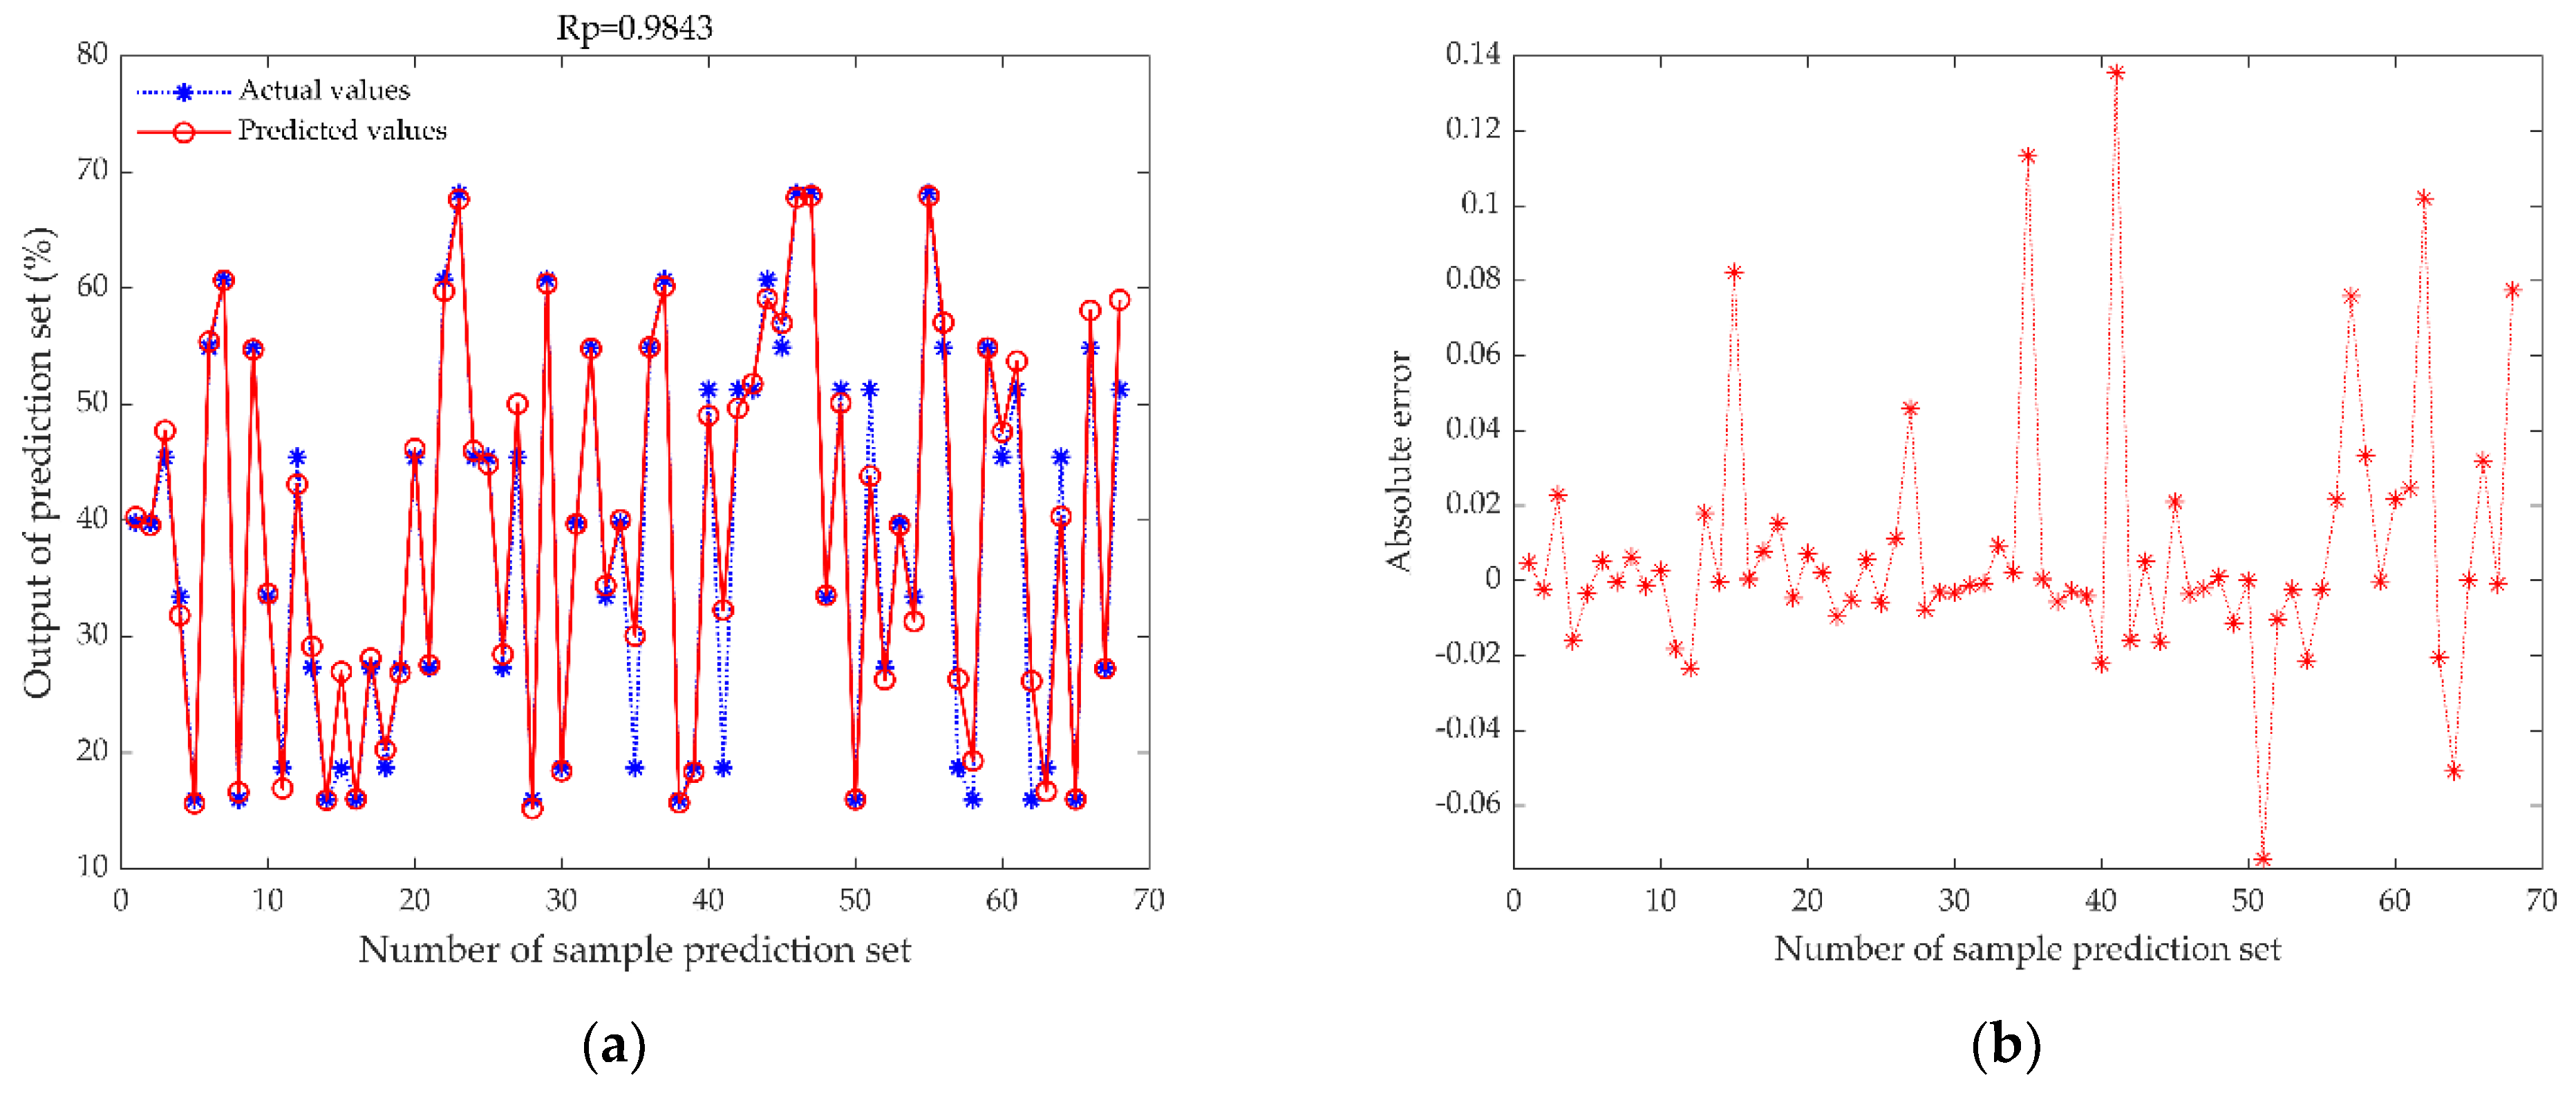
3.1. Optimization of Preprocessing Methods
3.2. Comparison between Single-Sensor Model and Data Fusion Model
3.3. Comparison of Elman Neural Network before and after Optimization
3.4. Comparison of MDF-WOA-ENN Model with Mainstream Models
4. Discussion
5. Conclusions
- (1)
- For the first time, a miniature near-infrared spectrometer was used to collect the spectral data of fixation leaves, and its applicability was verified.
- (2)
- SNV was the optimal spectral preprocessing method, and middle-level data fusion significantly improved the model prediction performance compared to single data.
- (3)
- Compared with classic models such as PLSR and SVR, the ENN model better predicted the moisture content of fixation leaves.
- (4)
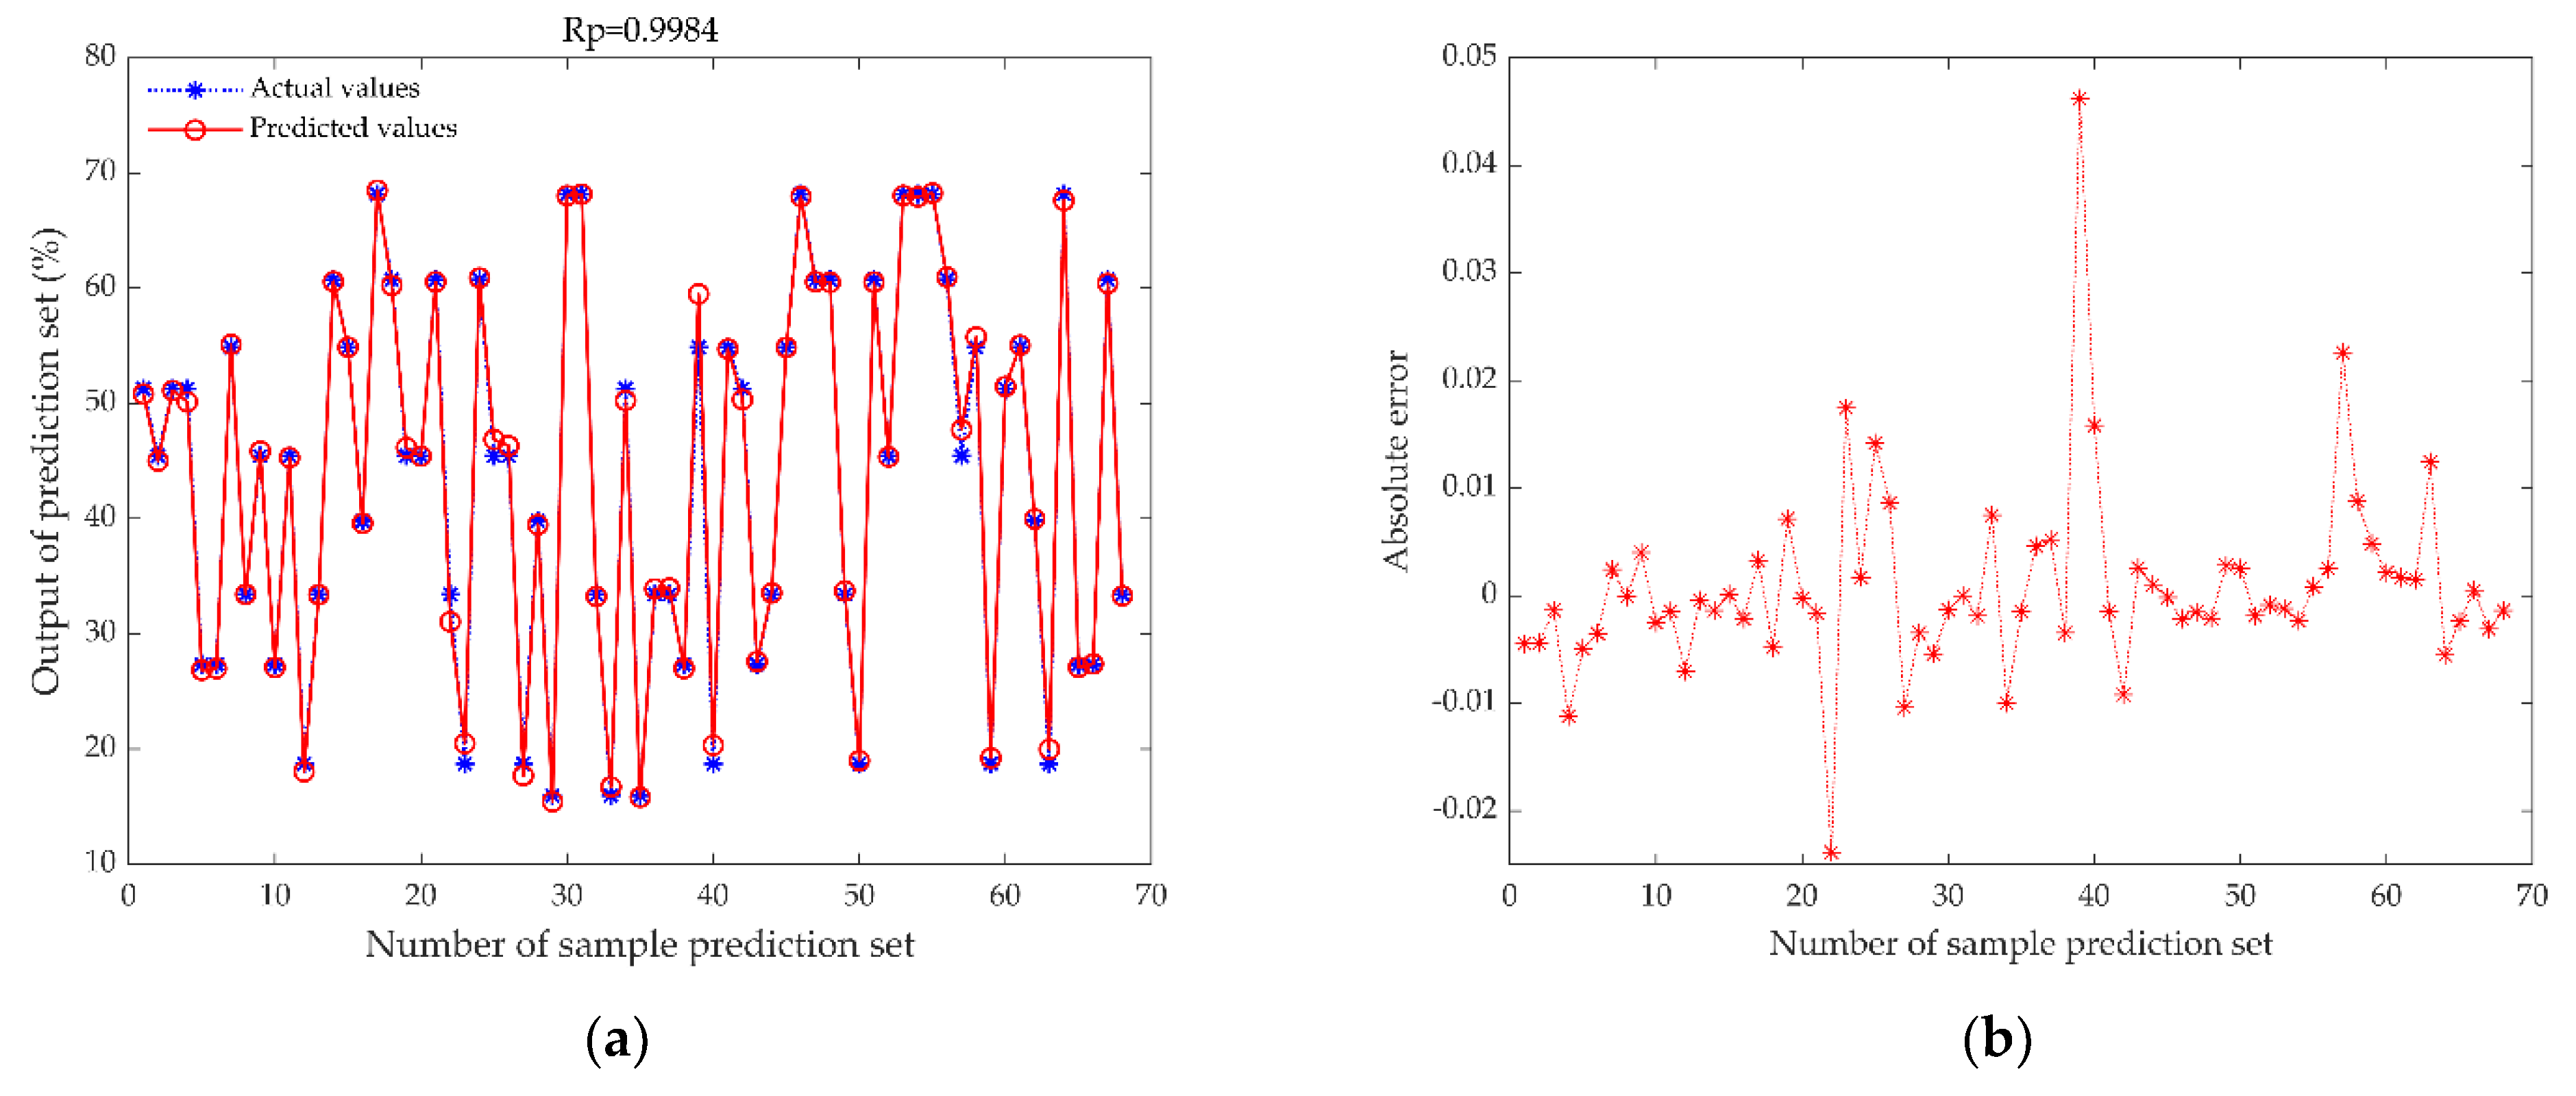
- WOA effectively prevented the ENN model from falling into a local optimum and dramatically improved the generalization and robustness of the ENN model. This model attained Rp = 0.9984, RMSEP = 0.0090, and RPD = 17.9294.
Author Contributions
Funding
Institutional Review Board Statement
Informed Consent Statement
Data Availability Statement
Conflicts of Interest
References
- Musial, C.; Kuban-Jankowska, A.; Gorska-Ponikowska, M. Beneficial Properties of Green Tea Catechins. Int. J. Mol. Sci. 2020, 21, 1744. [Google Scholar] [CrossRef]
- Bokuchava, M.A.; Skobeleva, N.I. The Biochemistry and Technology of Tea Manufacture. Crit. Rev. Food Sci. Nutr. 1980, 12, 303–370. [Google Scholar] [CrossRef]
- Li, J.; Hua, J.; Yuan, H.; Deng, Y.; Zhou, Q.; Yang, Y.; Dong, C.; Zeng, J.; Jiang, Y. Investigation on Green Tea Lipids and Their Metabolic Variations during Manufacturing by Nontargeted Lipidomics. Food Chem. 2021, 339, 128114. [Google Scholar] [CrossRef]
- Wang, H.; Hua, J.; Yu, Q.; Li, J.; Wang, J.; Deng, Y.; Yuan, H.; Jiang, Y. Widely Targeted Metabolomic Analysis Reveals Dynamic Changes in Non-Volatile and Volatile Metabolites during Green Tea Processing. Food Chem. 2021, 363, 130131. [Google Scholar] [CrossRef]
- Han, Z.-X.; Rana, M.M.; Liu, G.-F.; Gao, M.-J.; Li, D.-X.; Wu, F.-G.; Li, X.-B.; Wan, X.-C.; Wei, S. Green Tea Flavour Determinants and Their Changes over Manufacturing Processes. Food Chem. 2016, 212, 739–748. [Google Scholar] [CrossRef]
- Song, F.; Wu, J.; Liu, B.; Jiang, J.; Li, Z.; Song, C.; Li, J.; Jin, G. Intelligent Green Tea Fixation with Sensor Fusion Technology. J. Food Eng. 2022, 317, 110846. [Google Scholar] [CrossRef]
- Pasquini, C. Near Infrared Spectroscopy: A Mature Analytical Technique with New Perspectives—A Review. Anal. Chim. Acta 2018, 1026, 8–36. [Google Scholar] [CrossRef]
- Wang, Y.; Li, L.; Liu, Y.; Cui, Q.; Ning, J.; Zhang, Z. Enhanced Quality Monitoring during Black Tea Processing by the Fusion of NIRS and Computer Vision. J. Food Eng. 2021, 304, 110599. [Google Scholar] [CrossRef]
- Yang, J.; Wang, J.; Lu, G.; Fei, S.; Yan, T.; Zhang, C.; Lu, X.; Yu, Z.; Li, W.; Tang, X. TeaNet: Deep Learning on Near-Infrared Spectroscopy (NIR) Data for the Assurance of Tea Quality. Comput. Electron. Agric. 2021, 190, 106431. [Google Scholar] [CrossRef]
- Chanda, S.; De, A.; Tudu, B.; Bandyopadhyay, R.; Hazarika, A.K.; Sabhapondit, S.; Baruah, B.D.; Tamuly, P.; Bhattachryya, N. Prediction of Polyphenol Content in Tea Leaves Using NIR Spectroscopy. In Proceedings of the 2016 International Conference on Intelligent Control Power and Instrumentation (ICICPI), Kolkata, India, 21–23 October 2016; pp. 51–55. [Google Scholar]
- Lee, M.-S.; Hwang, Y.-S.; Lee, J.; Choung, M.-G. The Characterization of Caffeine and Nine Individual Catechins in the Leaves of Green Tea (Camellia sinensis L.) by near-Infrared Reflectance Spectroscopy. Food Chem. 2014, 158, 351–357. [Google Scholar] [CrossRef]
- Ur Rehman, N.; Al-Harrasi, A.; Boqué, R.; Mabood, F.; Al-Broumi, M.; Hussain, J.; Alameri, S. FT-NIRS Coupled with PLS Regression as a Complement to HPLC Routine Analysis of Caffeine in Tea Samples. Foods 2020, 9, 827. [Google Scholar] [CrossRef]
- Dong, C.; Zhu, H.; Wang, J.; Yuan, H.; Zhao, J.; Chen, Q. Prediction of Black Tea Fermentation Quality Indices Using NIRS and Nonlinear Tools. Food Sci. Biotechnol. 2017, 26, 853–860. [Google Scholar] [CrossRef]
- Liu, Z.; Yang, C.; Luo, X.; Hu, B.; Dong, C. Research on the Online Rapid Sensing Method of Moisture Content in Famous Green Tea Spreading. J. Food Process Eng. 2021, 44, e13853. [Google Scholar] [CrossRef]
- Wang, Y.; Li, M.; Li, L.; Ning, J.; Zhang, Z. Green Analytical Assay for the Quality Assessment of Tea by Using Pocket-Sized NIR Spectrometer. Food Chem. 2021, 345, 128816. [Google Scholar] [CrossRef]
- Jin, G.; Wang, Y.-J.; Li, M.; Li, T.; Huang, W.-J.; Li, L.; Deng, W.-W.; Ning, J. Rapid and Real-Time Detection of Black Tea Fermentation Quality by Using an Inexpensive Data Fusion System. Food Chem. 2021, 358, 129815. [Google Scholar] [CrossRef]
- Yang, H.; Chen, L.; Ma, Z.; Chen, M.; Zhong, Y.; Deng, F.; Li, M. Computer Vision-Based High-Quality Tea Automatic Plucking Robot Using Delta Parallel Manipulator. Comput. Electron. Agric. 2021, 181, 105946. [Google Scholar] [CrossRef]
- Chen, C.; Lu, J.; Zhou, M.; Yi, J.; Liao, M.; Gao, Z. A YOLOv3-Based Computer Vision System for Identification of Tea Buds and the Picking Point. Comput. Electron. Agric. 2022, 198, 107116. [Google Scholar] [CrossRef]
- Liu, Z.; Zhang, R.; Yang, C.; Hu, B.; Luo, X.; Li, Y.; Dong, C. Research on Moisture Content Detection Method during Green Tea Processing Based on Machine Vision and Near-Infrared Spectroscopy Technology. Spectrochim. Acta Part A Mol. Biomol. Spectrosc. 2022, 19, 120921. [Google Scholar] [CrossRef]
- Xu, M.; Wang, J.; Gu, S. Rapid Identification of Tea Quality by E-Nose and Computer Vision Combining with a Synergetic Data Fusion Strategy. J. Food Eng. 2019, 241, 10–17. [Google Scholar] [CrossRef]
- Song, Y.; Wang, X.; Xie, H.; Li, L.; Ning, J.; Zhang, Z. Quality Evaluation of Keemun Black Tea by Fusing Data Obtained from Near-Infrared Reflectance Spectroscopy and Computer Vision Sensors. Spectrochim. Acta Part A Mol. Biomol. Spectrosc. 2021, 252, 119522. [Google Scholar] [CrossRef]
- Nayak, J.; Vakula, K.; Dinesh, P.; Naik, B.; Pelusi, D. Intelligent Food Processing: Journey from Artificial Neural Network to Deep Learning. Comput. Sci. Rev. 2020, 38, 100297. [Google Scholar] [CrossRef]
- Hu, G.; Yang, X.; Zhang, Y.; Wan, M. Identification of Tea Leaf Diseases by Using an Improved Deep Convolutional Neural Network. Sustain. Comput. Inform. Syst. 2019, 24, 100353. [Google Scholar] [CrossRef]
- McKenzie, J.S.; Jurado, J.M.; de Pablos, F. Characterisation of Tea Leaves According to Their Total Mineral Content by Means of Probabilistic Neural Networks. Food Chem. 2010, 123, 859–864. [Google Scholar] [CrossRef]
- Shen, S.; Hua, J.; Zhu, H.; Yang, Y.; Deng, Y.; Li, J.; Yuan, H.; Wang, J.; Zhu, J.; Jiang, Y. Rapid and Real-Time Detection of Moisture in Black Tea during Withering Using Micro-near-Infrared Spectroscopy. LWT 2022, 155, 112970. [Google Scholar] [CrossRef]
- Cai, C.; Qian, Q.; Fu, Y. Application of BAS-Elman Neural Network in Prediction of Blasting Vibration Velocity. Procedia Comput. Sci. 2020, 166, 491–495. [Google Scholar] [CrossRef]
- Zhang, Y.; Zhao, J.; Wang, L.; Wu, H.; Zhou, R.; Yu, J. An Improved OIF Elman Neural Network Based on CSO Algorithm and Its Applications. Comput. Commun. 2021, 171, 148–156. [Google Scholar] [CrossRef]
- Ali, B.; Lashari, S.A.; Sharif, W.; Khan, A.; ullah, K.; Ramli, D.A. An Efficient Learning Weight of Elman Neural Network with Chicken Swarm Optimization Algorithm. Procedia Comput. Sci. 2021, 192, 3060–3069. [Google Scholar] [CrossRef]
- Mirjalili, S.; Lewis, A. The Whale Optimization Algorithm. Adv. Eng. Softw. 2016, 95, 51–67. [Google Scholar] [CrossRef]
- Chen, C.; Liu, B.; Song, F.; Jiang, J.; Li, Z.; Song, C.; Li, J.; Jin, G.; Wu, J. An Adaptive Fuzzy Logic Control of Green Tea Fixation Process Based on Image Processing Technology. Biosyst. Eng. 2022, 215, 1–20. [Google Scholar] [CrossRef]
- Ding, Y.; Yan, Y.; Li, J.; Chen, X.; Jiang, H. Classification of Tea Quality Levels Using Near-Infrared Spectroscopy Based on CLPSO-SVM. Foods 2022, 11, 1658. [Google Scholar] [CrossRef]
- Borràs, E.; Ferré, J.; Boqué, R.; Mestres, M.; Aceña, L.; Busto, O. Data Fusion Methodologies for Food and Beverage Authentication and Quality Assessment—A Review. Anal. Chim. Acta 2015, 891, 1–14. [Google Scholar] [CrossRef]
- Zhao, X.; Xuan, D.; Zhao, K.; Li, Z. Elman Neural Network Using Ant Colony Optimization Algorithm for Estimating of State of Charge of Lithium-Ion Battery. J. Energy Storage 2020, 32, 101789. [Google Scholar] [CrossRef]
- Vijaya Lakshmi, A.; Mohanaiah, P. WOA-TLBO: Whale Optimization Algorithm with Teaching-Learning-Based Optimization for Global Optimization and Facial Emotion Recognition. Appl. Soft Comput. 2021, 110, 107623. [Google Scholar] [CrossRef]
- Samrat, N.H.; Johnson, J.B.; White, S.; Naiker, M.; Brown, P. A Rapid Non-Destructive Hyperspectral Imaging Data Model for the Prediction of Pungent Constituents in Dried Ginger. Foods 2022, 11, 649. [Google Scholar] [CrossRef]
- Sun, J.; Lu, X.; Mao, H.; Wu, X.; Gao, H. Quantitative Determination of Rice Moisture Based on Hyperspectral Imaging Technology and BCC-LS-SVR Algorithm. J. Food Process Eng. 2017, 40, e12446. [Google Scholar] [CrossRef]
- Liu, Q.; Sun, K.; Zhao, N.; Yang, J.; Zhang, Y.; Ma, C.; Pan, L.; Tu, K. Information Fusion of Hyperspectral Imaging and Electronic Nose for Evaluation of Fungal Contamination in Strawberries during Decay. Postharvest Biol. Technol. 2019, 153, 152–160. [Google Scholar] [CrossRef]
- An, T.; Yu, H.; Yang, C.; Liang, G.; Chen, J.; Hu, Z.; Hu, B.; Dong, C. Black Tea Withering Moisture Detection Method Based on Convolution Neural Network Confidence. J. Food Process Eng. 2020, 43, e13428. [Google Scholar] [CrossRef]
- Dong, C.; An, T.; Yang, M.; Yang, C.; Liu, Z.; Li, Y.; Duan, D.; Fan, S. Quantitative Prediction and Visual Detection of the Moisture Content of Withering Leaves in Black Tea (Camellia sinensis) with Hyperspectral Image. Infrared Phys. Technol. 2022, 123, 104118. [Google Scholar] [CrossRef]
- Liang, G.; Dong, C.; Hu, B.; Zhu, H.; Yuan, H.; Jiang, Y.; Hao, G. Prediction of Moisture Content for Congou Black Tea Withering Leaves Using Image Features and Nonlinear Method. Sci. Rep. 2018, 8, 7854. [Google Scholar] [CrossRef]
- Chen, A.; Chen, H.-Y.; Chen, C. Use of Temperature and Humidity Sensors to Determine Moisture Content of Oolong Tea. Sensors 2014, 14, 15593–15609. [Google Scholar] [CrossRef] [Green Version]
- Corey, M.E.; Kerr, W.L.; Mulligan, J.H.; Lavelli, V. Phytochemical Stability in Dried Apple and Green Tea Functional Products as Related to Moisture Properties. LWT-Food Sci. Technol. 2011, 44, 67–74. [Google Scholar] [CrossRef]
- Jin, G.; Wang, Y.; Li, L.; Shen, S.; Deng, W.-W.; Zhang, Z.; Ning, J. Intelligent Evaluation of Black Tea Fermentation Degree by FT-NIR and Computer Vision Based on Data Fusion Strategy. LWT 2020, 125, 109216. [Google Scholar] [CrossRef]


| Preprocessing Methods | Rp | RMSEP | RPD |
|---|---|---|---|
| RAW | 0.8644 | 0.0823 | 1.8897 |
| SNV | 0.9843 | 0.0319 | 5.3044 |
| MSC | 0.9425 | 0.0586 | 2.9978 |
| Max–min | 0.9003 | 0.0391 | 2.0288 |
| Types of Models | Rp | RMSEP | RPD |
|---|---|---|---|
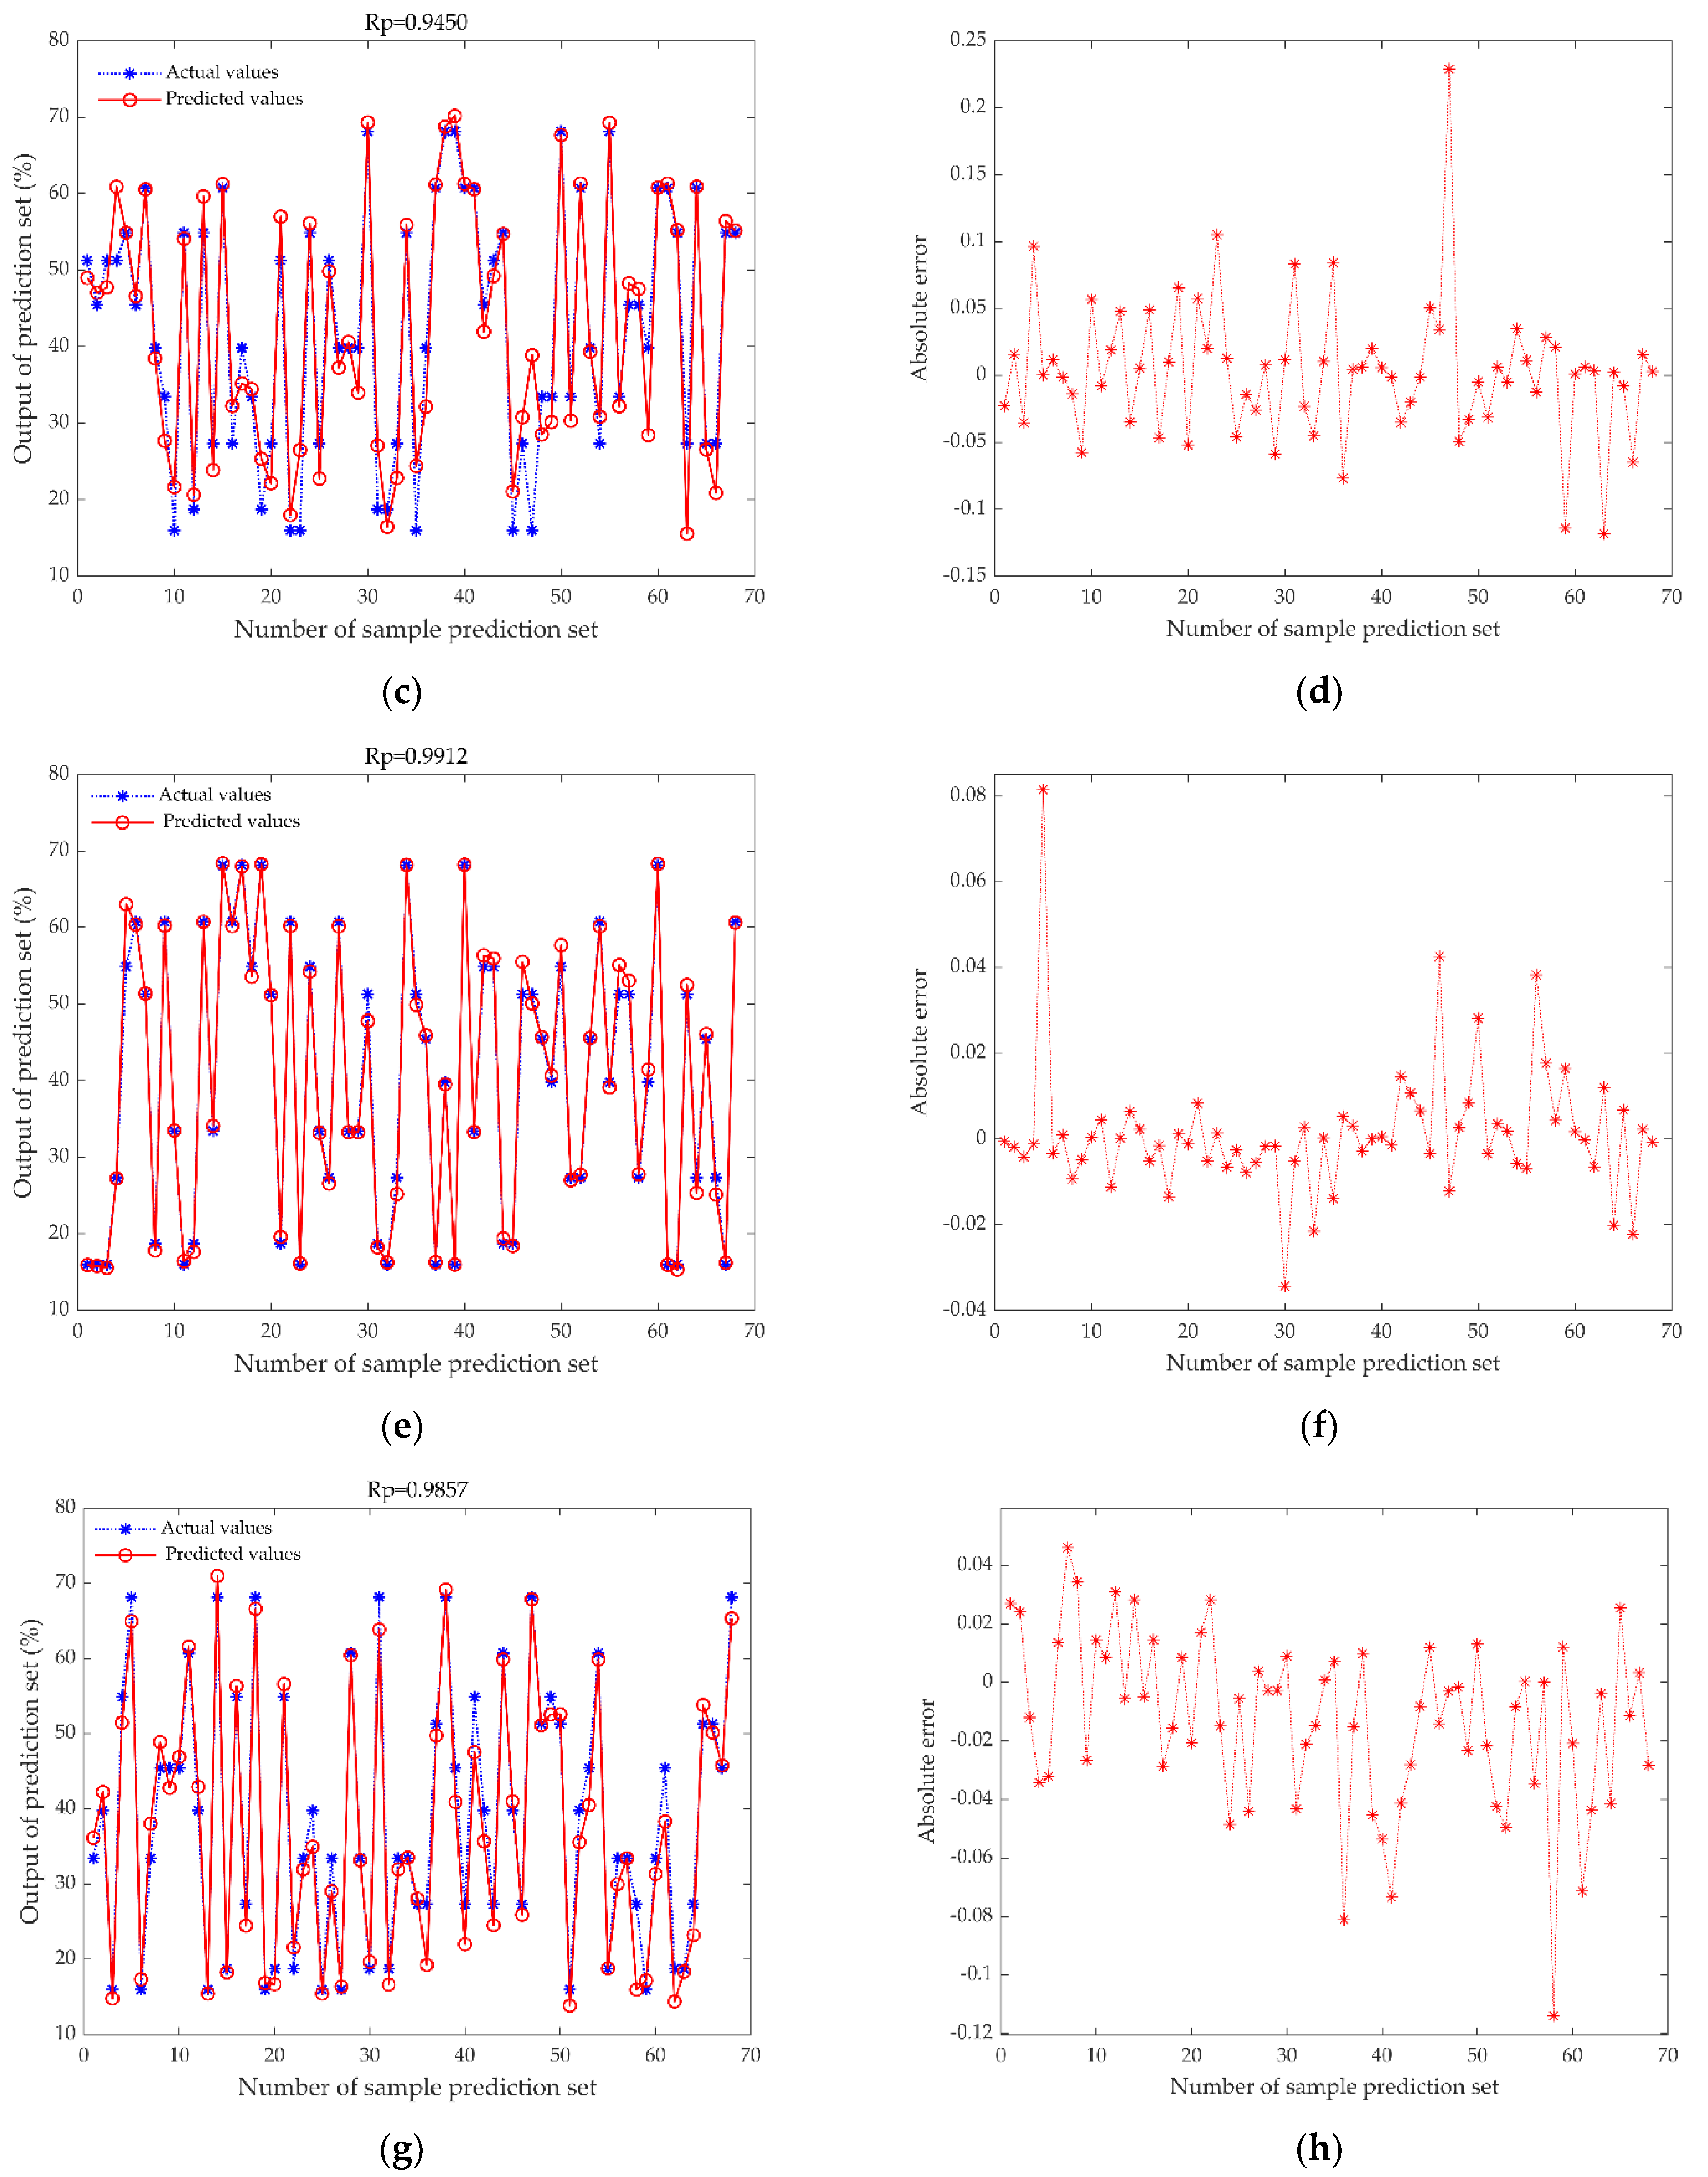
| SNV-ENN | 0.9843 | 0.0319 | 5.3044 |
| CV-ENN | 0.9450 | 0.0586 | 2.9978 |
| MDF-ENN | 0.9912 | 0.0230 | 7.5793 |
| LDF-ENN | 0.9857 | 0.0313 | 5.4247 |
| Types of Models | Rp | RMSEP | RPD |
|---|---|---|---|
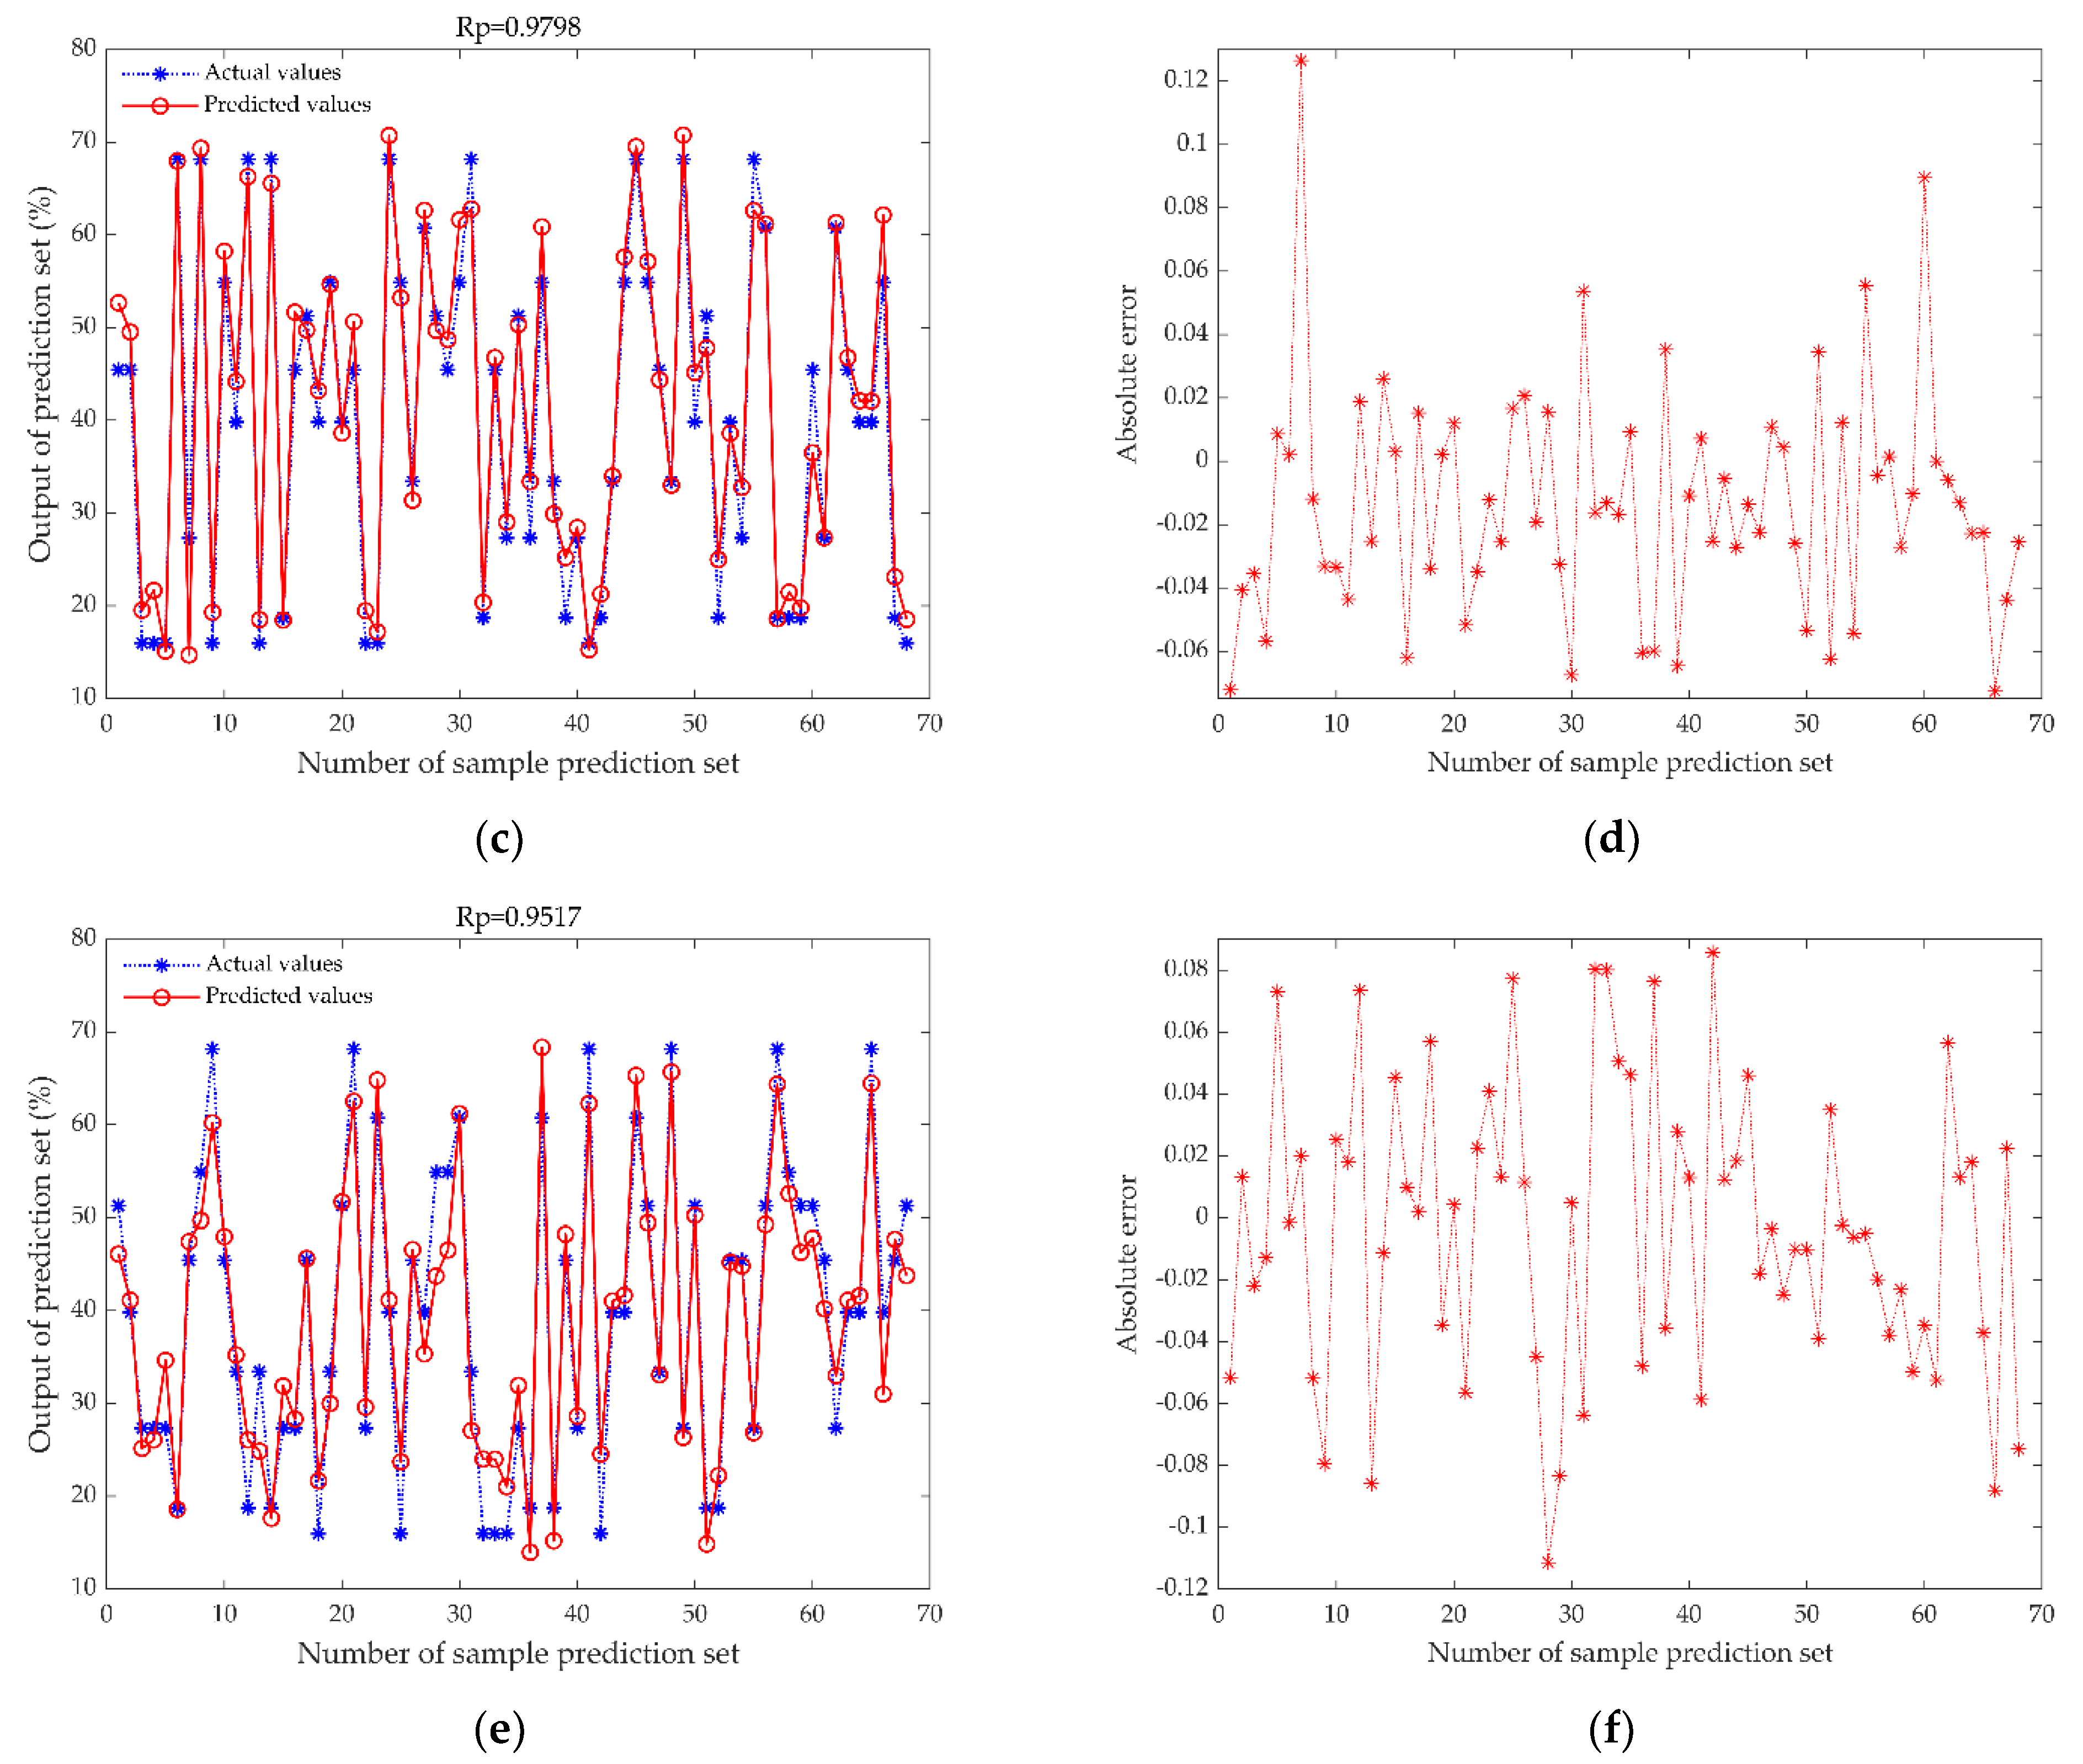
| MDF-PLSR | 0.9517 | 0.0488 | 2.9951 |
| MDF-SVR | 0.9798 | 0.0361 | 4.7736 |
| MDF-WOA-ENN | 0.9984 | 0.0090 | 17.9294 |
Publisher’s Note: MDPI stays neutral with regard to jurisdictional claims in published maps and institutional affiliations. |
© 2022 by the authors. Licensee MDPI, Basel, Switzerland. This article is an open access article distributed under the terms and conditions of the Creative Commons Attribution (CC BY) license (https://creativecommons.org/licenses/by/4.0/).
Share and Cite
Lan, T.; Shen, S.; Yuan, H.; Jiang, Y.; Tong, H.; Ye, Y. A Rapid Prediction Method of Moisture Content for Green Tea Fixation Based on WOA-Elman. Foods 2022, 11, 2928. https://doi.org/10.3390/foods11182928
Lan T, Shen S, Yuan H, Jiang Y, Tong H, Ye Y. A Rapid Prediction Method of Moisture Content for Green Tea Fixation Based on WOA-Elman. Foods. 2022; 11(18):2928. https://doi.org/10.3390/foods11182928
Chicago/Turabian StyleLan, Tianmeng, Shuai Shen, Haibo Yuan, Yongwen Jiang, Huarong Tong, and Yang Ye. 2022. "A Rapid Prediction Method of Moisture Content for Green Tea Fixation Based on WOA-Elman" Foods 11, no. 18: 2928. https://doi.org/10.3390/foods11182928