
Does the Rearing Management following by Charolais Cull Cows Influence the Qualities of Carcass and Beef Meat?

Abstract
:1. Introduction
2. Materials and Methods
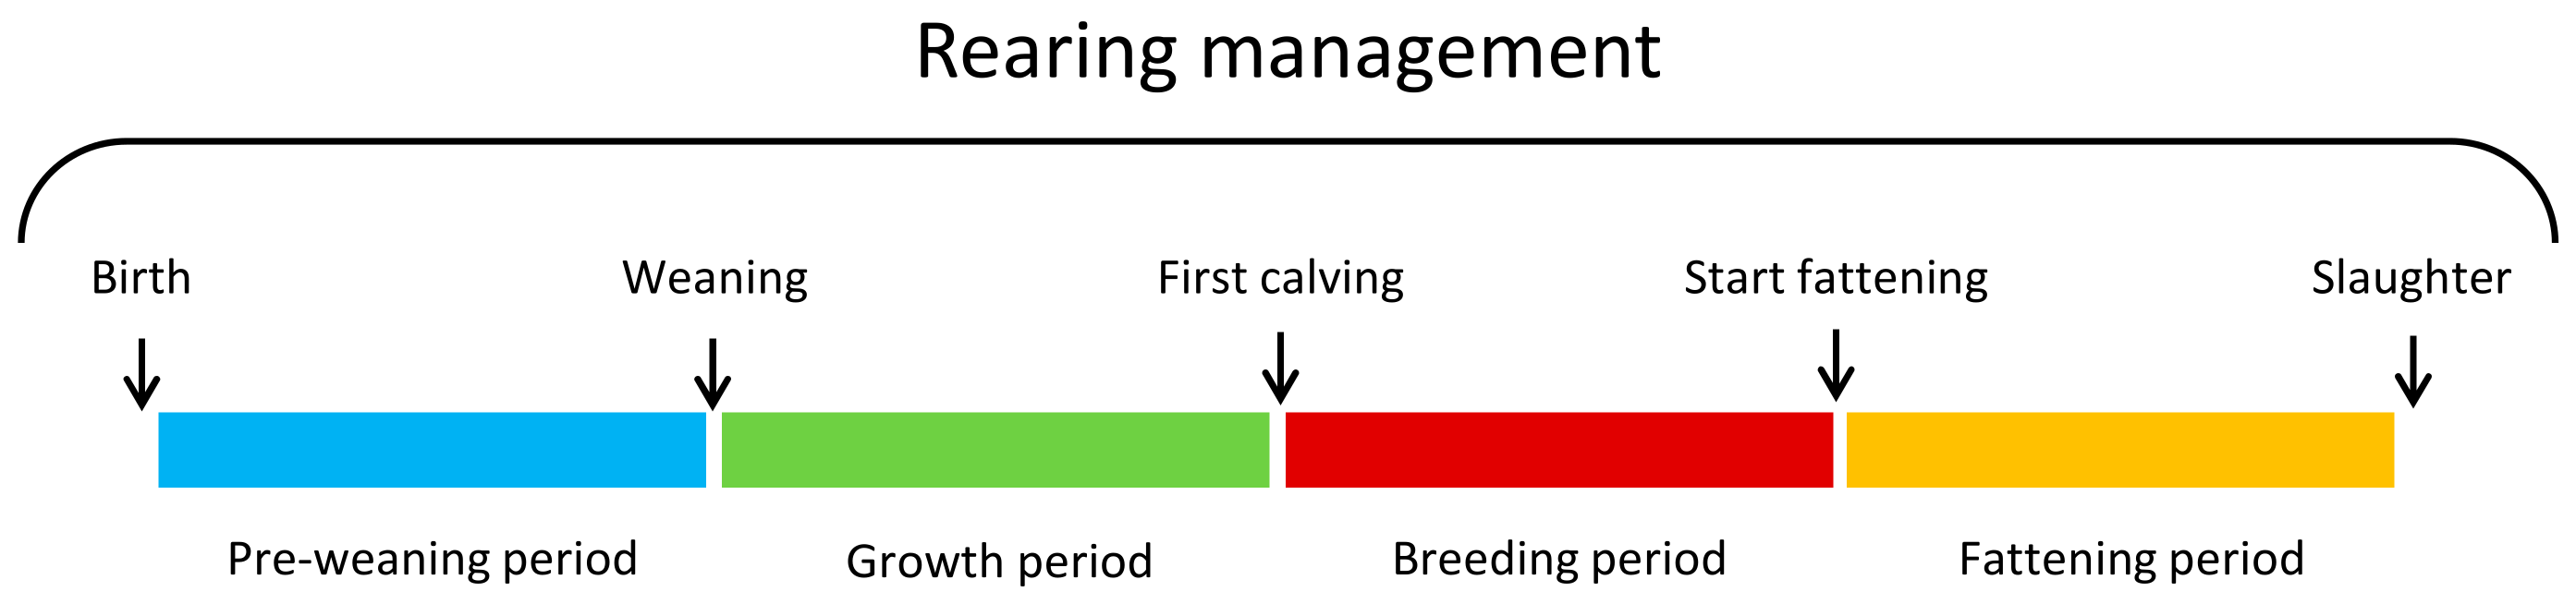
2.1. Animals and Rearing Factors
2.2. Slaughtering, Carcass Traits and Sampling
2.3. Meat Quality Evaluation
2.3.1. Color Assessment
2.3.2. Sensory Analysis
2.3.3. Texture Profile Analysis
2.3.4. Shear Force Measurement
2.4. Statistical Analyses
3. Results and Discussion
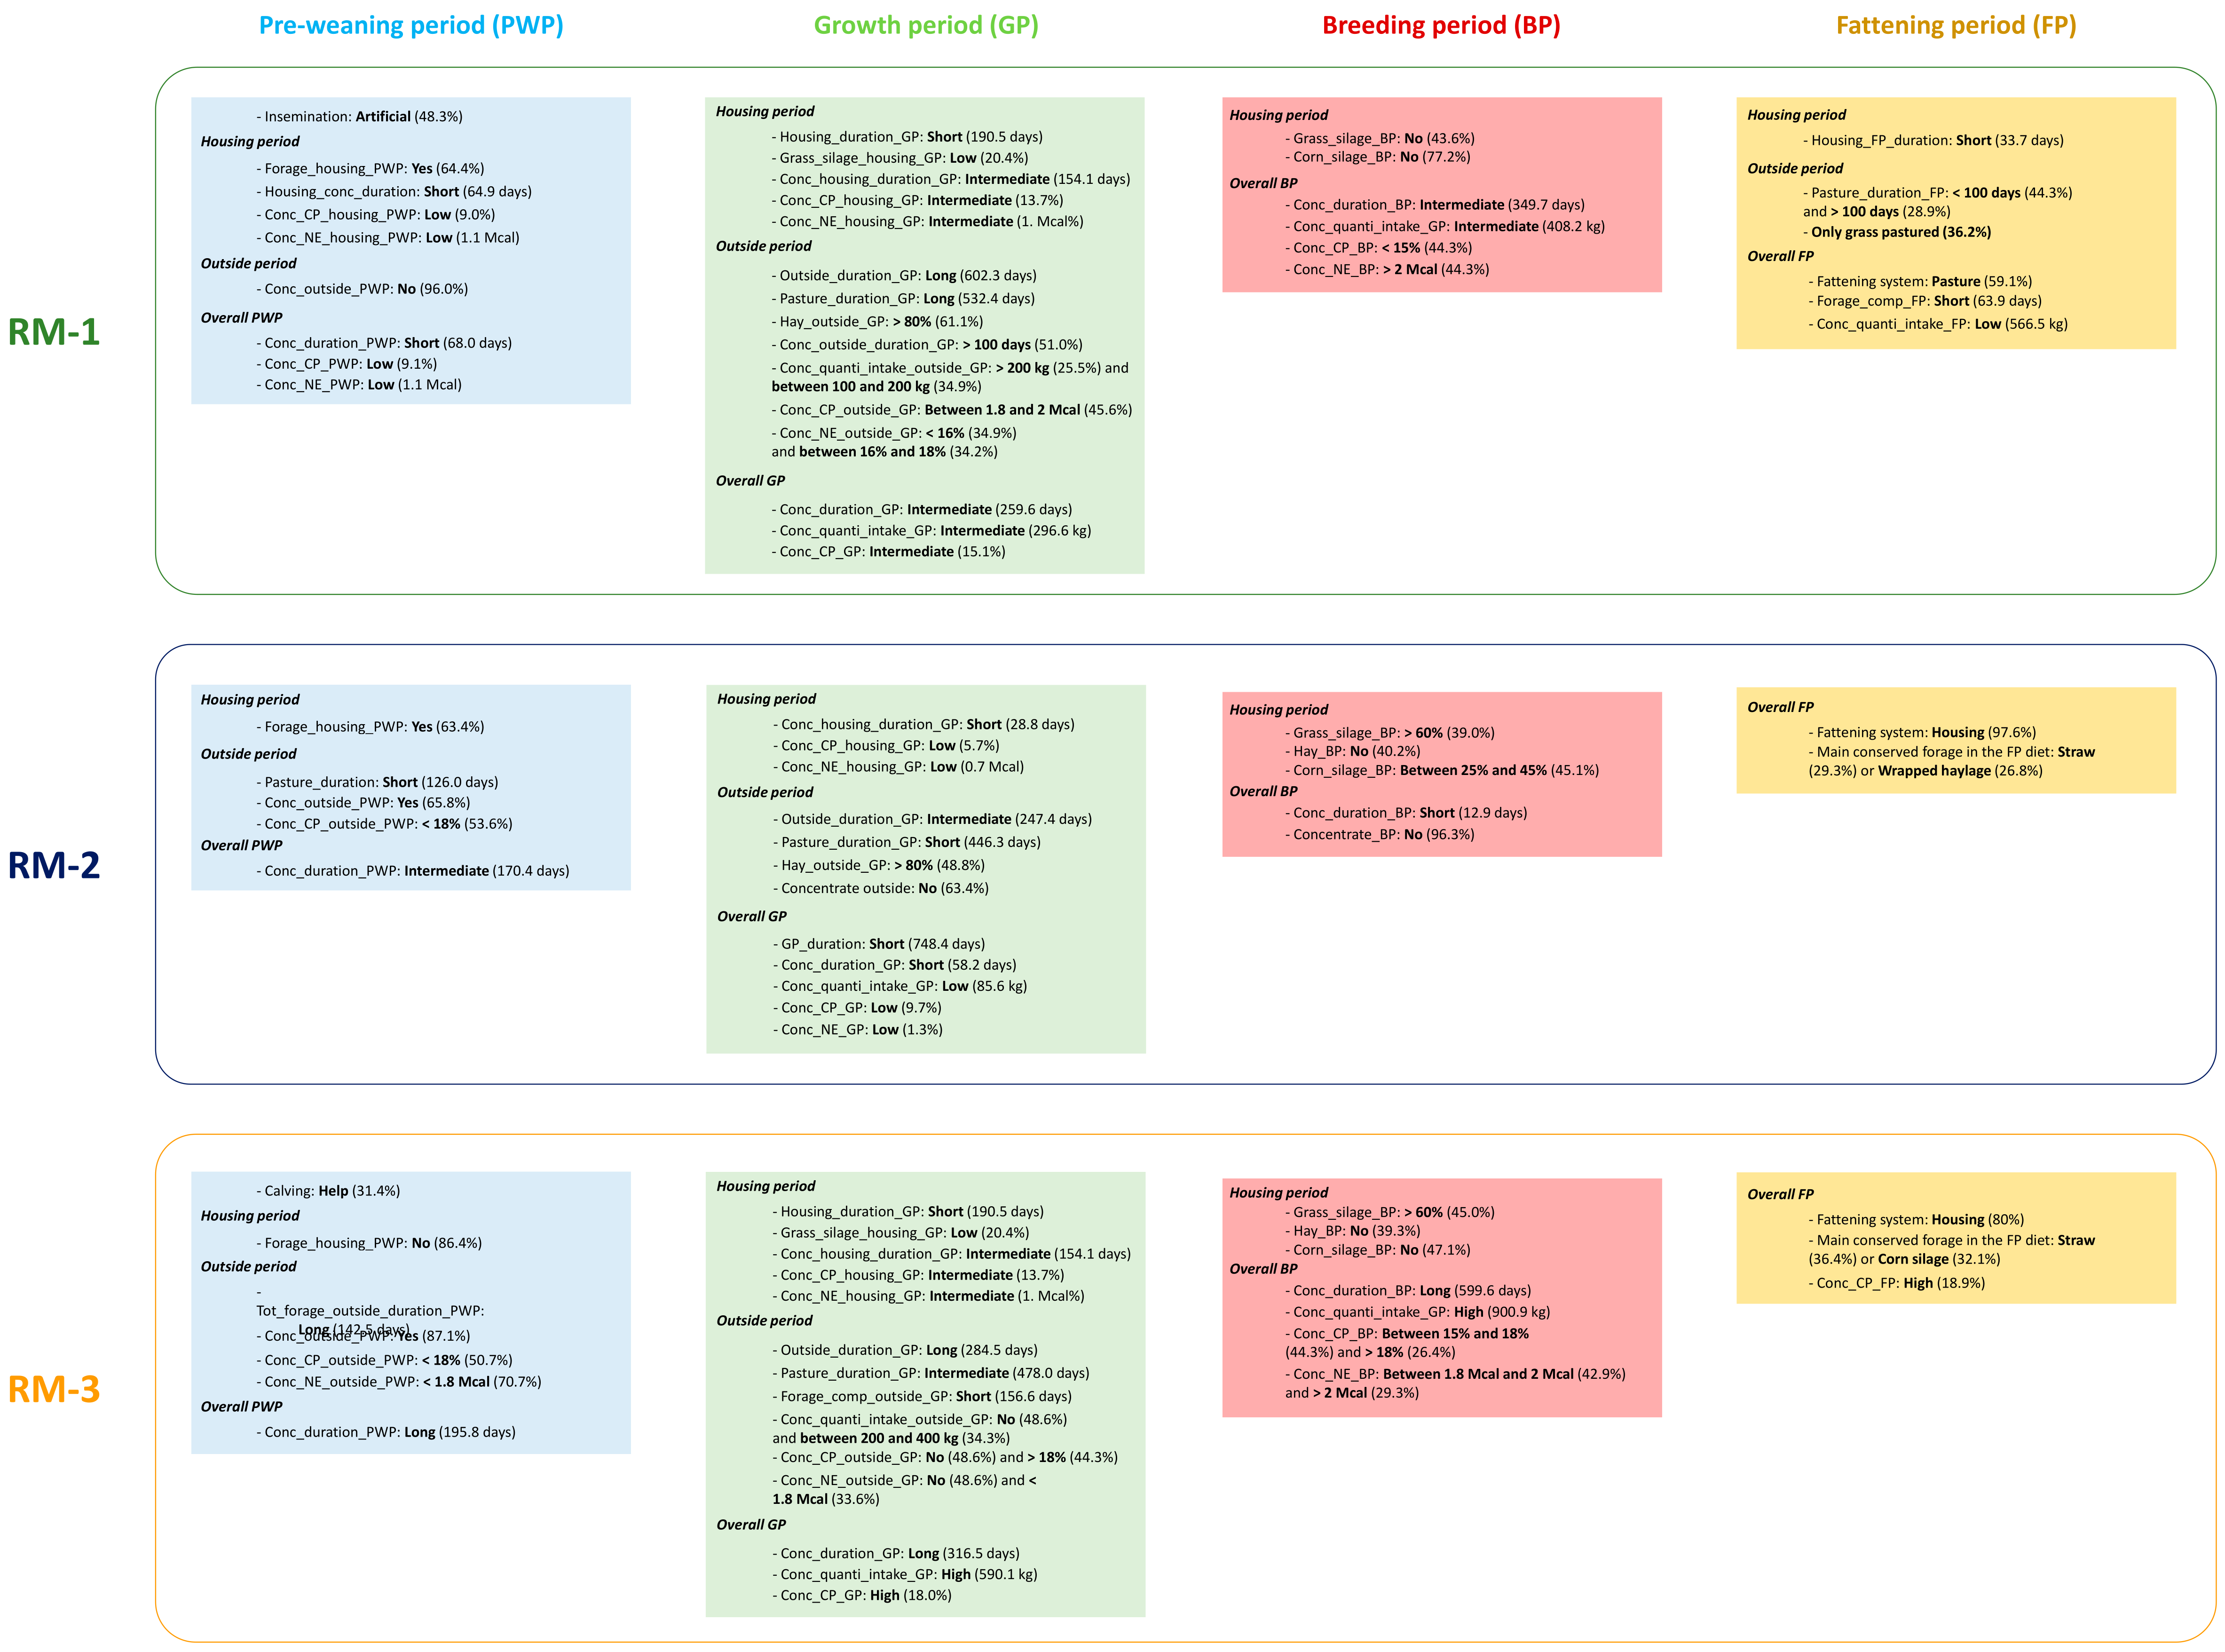
3.1. Characterisation of the Rearing Managements
3.2. Effect of the Rearing Managements on the Carcass Traits
3.3. Effect of the Rearing Managements on the Meat Traits
4. Conclusions
Author Contributions
Funding
Institutional Review Board Statement
Informed Consent Statement
Data Availability Statement
Acknowledgments
Conflicts of Interest
References
- Food and Agricultural Organization of the United Nations (FAO). FAOSTAT. Available online: https://www.fao.org/faostat/en/#data/QCL/visualize (accessed on 6 June 2022).
- Institut de l’élevage. Marché mondial Viande bovine: Année 2021 - Perspectives 2022. Dossier Economie de l’élevage. Available online: https://idele.fr/detail-article/marche-mondial-viande-bovine-annee-2021-perspectives-2022 (accessed on 6 June 2022).
- Interbev. L’essentiel de La Filière Bovine Française. 2021. Available online: https://www.interbev.fr/interbev/chiffres-cles/ (accessed on 6 June 2022).
- Institut de l’élevage. Les chiffres clés du GEB - Bovins 2021. Productions lait et viande. Available online: https://idele.fr/detail-article/les-chiffres-cles-du-geb-bovins-2021 (accessed on 6 June 2022).
- Ellies-Oury, M.-P.; Lee, A.; Jacob, H.; Hocquette, J.-F. Meat Consumption – What French Consumers Feel about the Quality of Beef? Ital. J. Anim. Sci. 2019, 18, 646–656. [Google Scholar] [CrossRef]
- Dransfield, E.; Martin, J.F.; Bauchart, D.; Abouelkaram, S.; Lepetit, J.; Culioli, J.; Jurie, C.; Picard, B. Meat Quality and Composition of Three Muscles from French Cull Cows and Young Bulls. Anim. Sci. 2003, 76, 387–399. [Google Scholar] [CrossRef]
- Franco, D.; Bispo, E.; González, L.; Vázquez, J.A.; Moreno, T. Effect of Finishing and Ageing Time on Quality Attributes of Loin from the Meat of Holstein–Fresian Cull Cows. Meat Sci. 2009, 83, 484–491. [Google Scholar] [CrossRef]
- Jurie, C.; Martin, J.-F.; Listrat, A.; Jailler, R.; Culioli, J.; Picard, B. Carcass and Muscle Characteristics of Beef Cull Cows between 4 and 9 Years of Age. Anim. Sci. 2006, 82, 415–421. [Google Scholar] [CrossRef]
- Schnell, T.D.; Belk, K.E.; Tatum, J.D.; Miller, R.K.; Smith, G.C. Performance, Carcass, and Palatability Traits for Cull Cows Fed High-Energy Concentrate Diets for 0, 14, 28, 42, or 56 Days. J. Anim. Sci. 1997, 75, 1195–1202. [Google Scholar] [CrossRef]
- Terlouw, E.M.C.; Picard, B.; Deiss, V.; Berri, C.; Hocquette, J.-F.; Lebret, B.; Lefèvre, F.; Hamill, R.; Gagaoua, M. Understanding the Determination of Meat Quality Using Biochemical Characteristics of the Muscle: Stress at Slaughter and Other Missing Keys. Foods 2021, 10, 84. [Google Scholar] [CrossRef] [PubMed]
- Couvreur, S.; Le Bec, G.; Micol, D.; Picard, B. Relationships Between Cull Beef Cow Characteristics, Finishing Practices and Meat Quality Traits of Longissimus Thoracis and Rectus Abdominis. Foods 2019, 8, 141. [Google Scholar] [CrossRef]
- Soulat, J.; Monteils, V.; Léger, S.; Picard, B. Identification of Key Rearing Factors to Manage Cattle Carcass Fatness and Conformation Scores during the Fattening Period. Ital. J. Anim. Sci. 2019, 18, 1192–1204. [Google Scholar] [CrossRef]
- Soulat, J.; Picard, B.; Léger, S.; Monteils, V. Prediction of Beef Carcass and Meat Traits from Rearing Factors in Young Bulls and Cull Cows. J. Anim. Sci. 2016, 94, 1712–1726. [Google Scholar] [CrossRef]
- Monteils, V.; Sibra, C. Rearing Practices in Each Life Period of Beef Heifers Can Be Used to Influence the Carcass Characteristics. Ital. J. Anim. Sci. 2019, 18, 734–745. [Google Scholar] [CrossRef] [Green Version]
- Soulat, J.; Monteils, V.; Picard, B. Effect of the Rearing Managements Applied during Heifers’ Whole Life on Quality Traits of Five Muscles of the Beef Rib. Foods 2019, 8, 157. [Google Scholar] [CrossRef] [PubMed]
- Soulat, J.; Picard, B.; Léger, S.; Ellies-Oury, M.-P.; Monteils, V. Preliminary Study to Determinate the Effect of the Rearing Managements Applied during Heifers’ Whole Life on Carcass and Flank Steak Quality. Foods 2018, 7, 160. [Google Scholar] [CrossRef] [PubMed]
- Ingrand, S.; Dedieu, B. Diversité des formules d’allotement en élevage bovin viande. Le cas d’exploitations du Limousin. Inra Prod. Anim. 1996, 9, 189–199. [Google Scholar] [CrossRef]
- INRA. Alimentation des bovins, ovins et caprins. Besoins des animaux-Valeurs des aliments; Quae: Versailles, France, 2010. [Google Scholar]
- Soulat, J.; Picard, B.; Léger, S.; Monteils, V. Prediction of Beef Carcass and Meat Quality Traits from Factors Characterising the Rearing Management System Applied during the Whole Life of Heifers. Meat Sci. 2018, 140, 88–100. [Google Scholar] [CrossRef]
- EU. Council Regulation (EC) No 1099/2009 of 24 September 2009 on the Protection of Animals at the Time of Killing. Off. J. Eur. Union 2009, 303, 1–30. [Google Scholar]
- EU. Council Regulation (EC) No 1183/2006 of 24 July 2006 Concerning the Community Scale for the Classification of Carcasses of Adult Bovine Animals. Off. J. Eur. Union 2006, 214, 1–6. [Google Scholar]
- Ellies-Oury, M.P.; Durand, Y.; Delamarche, F.; Jouanno, M.; Lambert, J.; Micol, D.; Dumont, R. Relationships between the Assessment of “Grain of Meat” and Meat Tenderness of Charolais Cattle. Meat Sci. 2013, 93, 397–404. [Google Scholar] [CrossRef]
- United Nations Economic Commission for Europ (UNECE) Standard Bovine Meat Carcases and Cuts; UNECE Standard; United Nations Publications: Geneva, Switzerland, 2016.
- Soulat, J.; Picard, B.; Bord, C.; Monteils, V. Characterization of Four Rearing Managements and Their Influence on Carcass and Meat Qualities in Charolais Heifers. Foods 2022, 11, 1262. [Google Scholar] [CrossRef]
- Commission International de l’Eclairage. Commission International de l’Eclairage Colorimetry, 2nd ed.; Commission International de l’Eclairage: Vienna, Austria, 1986. [Google Scholar]
- International Organization of Standardization (ISO). ISO 8586: General Guidelines for the Selection, Training and Monitoring of Selected Assessors and Expert Sensory Assessors. In Sensory Analysis; ISO: Geneva, Switzerland, 2014. [Google Scholar]
- Chinzorig, O.; Hwang, I. Mechanical Texture Profile of Hanwoo Muscles as a Function of Heating Temperatures. J. Anim. Sci. and Tech. 2018, 60, 22. [Google Scholar] [CrossRef]
- Texture technologies. Overview of Texture Profile Analysis. Available online: http://texturetechnologies.com/resources/texture-profile-analysis (accessed on 6 June 2022).
- R core Team, R. A Language and Environment for Statistical Computing; R Foundation for Statistical Computing: Vienna, Austria, 2021. [Google Scholar]
- Le, S.; Josse, J.; Husson, F. FactoMineR: An R Package for Multivariate Analysis. J. Stat. Softw. 2008, 25, 1–18. [Google Scholar] [CrossRef]
- De Mendiburu, F. Agricolae: Statistical Procedures for Agricultural Research. R package version 1.3-3. 2020. Available online: http://CRAN.R-project.org/package=agricolae (accessed on 13 December 2021).
- Graves, S.; Piepho, H.-P.; Selzer, L.; Dorai-Raj, S. MultcompView: Visualizations of Paired Comparisons. R Package Version 0.1-8. 2019. Available online: https://cran.r-project.org/web/packages/multcompView/index.html (accessed on 13 December 2021).
- Hothorn, T.; Bretz, F.; Westfall, P. Simultaneous Inference in General Parametric Models. Biom. J. 2008, 50, 346–363. [Google Scholar] [CrossRef]
- Kuznetsova, A.; Brockhoff, P.B.; Christensen, R.H.B. LmerTest Package: Tests in Linear Mixed Effects Models. J. Stat. Softw. 2017, 82, 1–26. [Google Scholar] [CrossRef] [Green Version]
- Lenth, R.V. Emmeans: Estimated Marginal Means, Aka Least-Squares Means. R package version 1.6.0. 2021. Available online: http://CRAN.R-project.org/package=emmeans (accessed on 13 December 2021).
- Soulat, J.; Picard, B.; Monteils, V. Influence of the Rearing Managements and Carcass Traits on the Sensory Properties of Two Muscles: Longissimus Thoracis and Rectus Abdominis. Meat Sci. 2020, 169, 108204. [Google Scholar] [CrossRef]
- Sugimoto, M.; Saito, W.; Ooi, M.; Oikawa, M. Effects of Days on Feed, Roughage Sources and Inclusion Levels of Grain in Concentrate on Finishing Performance and Carcass Characteristics in Cull Beef Cows. Anim. Sci. J. 2012, 83, 460–468. [Google Scholar] [CrossRef]
- Priolo, A.; Micol, D.; Agabriel, J. Effects of Grass Feeding Systems on Ruminant Meat Colour and Flavour. A Review. Anim. Res. 2001, 50, 185–200. [Google Scholar] [CrossRef]
- Dunne, P.G.; Monahan, F.J.; O’Mara, F.P.; Moloney, A.P. Colour of Bovine Subcutaneous Adipose Tissue: A Review of Contributory Factors, Associations with Carcass and Meat Quality and Its Potential Utility in Authentication of Dietary History. Meat Sci. 2009, 81, 28–45. [Google Scholar] [CrossRef]
- Holmer, S.F.; Homm, J.W.; Berger, L.L.; Brewer, M.S.; Mckeith, F.K.; Killefer, J. Realimentation of Cull Beef Cows. I. Live Performance, Carcass Traits and Muscle Characteristics. J. Muscle Foods 2009, 20, 293–306. [Google Scholar] [CrossRef]
- Hawrysh, Z.; Price, M. The Effect of Grain Feeding on the Eating Quality of Beef from Culled Cows. Can. J. Anim. Sci. 1981, 61, 581–592. [Google Scholar] [CrossRef]
- Matulis, R.J.; McKeith, F.K.; Faulkner, D.B.; Berger, L.L.; George, P. Growth and Carcass Characteristics of Cull Cows after Different Times-on-Feed. J. Anim. Sci. 1987, 65, 669–674. [Google Scholar] [CrossRef]
- Vestergaard, M.; Madsen, N.T.; Bligaard, H.B.; Bredahl, L.; Rasmussen, P.T.; Andersen, H.R. Consequences of Two or Four Months of Finishing Feeding of Culled Dry Dairy Cows on Carcass Characteristics and Technological and Sensory Meat Quality. Meat Sci. 2007, 76, 635–643. [Google Scholar] [CrossRef]
- Hernandez-Calva, L.M.; He, M.; Juarez, M.; Aalhus, J.L.; Dugan, M.E.R.; McAllister, T.A. Effect of Flaxseed and Forage Type on Carcass and Meat Quality of Finishing Cull Cows. Can. J. Anim. Sci. 2011, 91, 613–622. [Google Scholar] [CrossRef]
- Minchin, W.; Buckley, F.; Kenny, D.A.; Monahan, F.J.; Shalloo, L.; O’Donovan, M. Effect of Grass Silage and Concentrate Based Finishing Strategies on Cull Dairy Cow Performance, Carcass and Meat Quality Characteristics. Meat Sci. 2009, 81, 93–101. [Google Scholar] [CrossRef] [PubMed]
- Moreno, T.; Botana, A.; Bispo, E.; Gonzalez, L.; Garcia, C.; Mesas, J. High-Energy Forage Feeding Diets and Body Condition on the Finishing of Cull Dairy Cows. Animal 2012, 6, 1634–1641. [Google Scholar] [CrossRef]
- Fiems, L.O.; De Campeneere, S.; Van Caelenbergh, W.; De Boever, J.L.; Vanacker, J.M. Carcass and Meat Quality in Double-Muscled Belgian Blue Bulls and Cows. Meat Sci. 2003, 63, 345–352. [Google Scholar] [CrossRef]
- Setyabrata, D.; Kim, Y.H.B. Impacts of Aging/Freezing Sequence on Microstructure, Protein Degradation and Physico-Chemical Properties of Beef Muscles. Meat Sci. 2019, 151, 64–74. [Google Scholar] [CrossRef]
- Melton, S.L. Effects of Feeds on Flavor of Red Meat: A Review. J. Anim. Sci. 1990, 68, 4421–4435. [Google Scholar] [CrossRef]
- Holmer, S.F.; Homm, J.W.; Berger, L.L.; Stetzer, A.J.; Brewer, M.S.; Mckeith, F.K.; Killefer, J. Realimentation of Cull Beef Cows. II. Meat Quality of Muscles from the Chuck, Loin and Round in Response to Diet and Enhancement. J. Muscle Foods 2009, 20, 307–324. [Google Scholar] [CrossRef]
- Cabaraux, J.F.; Hornick, J.L.; Dotreppe, O.; Dufrasne, I.; Clinquart, A.; Istasse, L. Effects of the Calving Number on Animal Performance, Carcass and Meat Composition in Finishing Belgian Blue Double-Muscled Culled Females. Livest. Prod. Sci. 2004, 87, 161–169. [Google Scholar] [CrossRef]
- Soulat, J.; Monteils, V.; Ellies-Oury, M.-P.; Papillon, S.; Picard, B. What Is the Impact of the Rearing Management Applied during the Heifers’ Whole Life on the Toughness of Five Raw Rib Muscles in Relation with Carcass Traits? Meat Sci. 2021, 179, 108533. [Google Scholar] [CrossRef]
- Gatellier, P.; Mercier, Y.; Juin, H.; Renerre, M. Effect of Finishing Mode (Pasture- or Mixed-Diet) on Lipid Composition, Colour Stability and Lipid Oxidation in Meat from Charolais Cattle. Meat Sci. 2005, 69, 175–186. [Google Scholar] [CrossRef]


| Carcass Traits | Description of the Carcass Trait | RM-1 | RM-2 | RM-3 | p |
|---|---|---|---|---|---|
| Emmean ± SE | Emmean ± SE | Emmean ± SE | |||
| n = 149 | n = 82 | n = 140 | |||
| Cold weight (kg) | 450 b ± 6 | 460 ab ± 7 | 466 a ± 6 | 0.01 | |
| Conformation score (scale 1 to 15) | EUROP classification scales for conformation (from P- = 1 to E+ = 15) | 8.7 ± 0.1 | 8.9 ± 0.1 | 8.90 ± 0.1 | 0.13 |
| Fat score (scale 1 to 5) | EUROP classification scales for fat score (1 = lean to 5 = very fat) | 2.9 ± 0.03 | 3.0 ± 0.03 | 3.0 ± 0.02 | 0.19 |
| n= 129 | n= 63 | n= 102 | |||
| pH | The assessment of the ultimate pH was performed at 24h post-mortem | 5.7 a ± 0.1 | 5.5 b ± 0.1 | 5.5 b ± 0.1 | <0.001 |
| Assessment at the 6 th rib level | n= 131 | n= 65 | n= 104 | ||
| Longissimus muscle seepage (scale 1 to 5 scale) | Longissimus muscle seepage assessment at the 6th rib level (1 = the cut section is dry with no drop to 5 = the cut section have important drop) | 2.0 ± 0.2 | 2.1 ± 0.2 | 1.9 ± 0.2 | 0.56 |
| Subcutaneous fat (cm) | Measure of the subcutaneous thickness | 0.8 ± 0.2 | 0.6 ± 0.3 | 1.0 ± 0.2 | 0.18 |
| Intermuscular fat (1 to 5 scale) | Inter-muscular fat assessment at the 6th rib level (1 = limited development to 5 = large amount) | 2.0 ± 0.2 | 1.9 ± 0.2 | 2.2 ± 0.2 | 0.06 |
| Nerves (1 to 5 scale) | Nerves assessment at the 6th rib level (1 = lack of visible nerves to 5 = many visible nerves) | 1.2 ± 0.1 | 1.2 ± 0.1 | 1.2 ± 0.1 | 0.76 |
| Overall meat grain (1 to 5 scale) | Overall meat grain assessment at the 6th rib level (1 = smooth, soft, without harshness to 5 = very rough/granular) | 2.1 ± 0.2 | 2.1 ± 0.2 | 2.1 ± 0.2 | 0.65 |
| Longissimus meat grain (1 to 5 scale) | Longissimus meat grain assessment by touch at the 6th rib level (1 = smooth, soft, without harshness to 5 = very rough/granular) | 1.7 ± 0.2 | 1.6 ± 0.3 | 1.6 ± 0.2 | 0.45 |
| Rhomboideus meat grain (1 to 5 scale) | Rhomboideus meat grain assessment by touch at the 6th rib level (1 = smooth, soft, without harshness to 5 = very rough/granular) | 1.6 a ± 0.2 | 1.5 ab ± 0.2 | 1.4 b ± 0.2 | 0.04 |
| Fat color (0 to 9 scale) | Fat color assessment at the 6th rib level using the color chart described by UNECE [23] | 3.2 a ± 0.3 | 2.6 b ± 0.3 | 2.8 b ± 0.3 | <0.001 |
| Color homogeneity of muscles at the 6th rib (1 to 4 scale) | Color homogeneity assessment at the 6th rib level between muscles (1 = homogeneous, 2 = bicolor, 3 = tricolor, and 4 = more than 3 colors) | 1.9 a ± 0.1 | 1.8 ab ± 0.1 | 1.7 b ± 0.1 | 0.03 |
| Longissimus color (0 to 7 scale) | Longissimus color assessment at the 6th rib level using the color chart described by UNECE [23] | 4.2 b ± 0.3 | 5.0 a ± 0.3 | 4.6 ab ± 0.3 | <0.001 |
| Longissimus marbling (0 to 6 scale) | Longissimus marbling assessment at the 6th rib level using the marbling scale described by UNECE [23] | 1.1 ± 0.2 | 1.2 ± 0.2 | 1.24 ± 0.2 | 0.51 |
| Descriptors | Definition |
|---|---|
| Red color intensity | Refers to the red color intensity of the meat sample after cooking (0 = light to 10 = dark) |
| Initial tenderness | Facility to chew and cut the meat sample at the first bite (0 = tough to 10 = very tender) |
| Overall tenderness | Time and numbers of chewing required to masticate the meat sample ready for swallowing (0 = tough to 10 = very tender) |
| Overall juiciness | Perception of water content in the meat sample during the mastication (0 = dry to 10 = very juicy) |
| Presence of nerves | Quantities of nerves perceived in the meat sample (0 = none to 10 = very important) |
| Residue | Amount of the residue after chewing (0 = none to 10 = very important) |
| Flavor intensity | Global flavor intensity assessment of the beef meat (0 = none to 10 = very intense) |
| Fat aroma | Fat aroma intensity (0 = none to 10 = very intense) |
| Atypical flavor | Flavor associated with aromas that should not normally be present in meat (e.g., aftertaste, rancid) (0 = none to 10 = very intense) |
| Flavor persistence | Refers to remnant beef flavor duration in the mouth perceived after swallowing (0 = very quick to 10 = very long) |
| Overall acceptability | Overall liking (hedonic perception) of the meat sample (0 = highly disliked to 10 = highly liked) |
| Rearing Factors | Description of the Rearing Factor | RM-1 (n = 149) | RM-2 (n = 82) | RM-3 (n = 140) | p |
|---|---|---|---|---|---|
| Quantitative Rearing Factors | Mean ± SE | Mean ± SE | Mean ± SE | ||
| Age of the cow (years) | Age of the cow’s mother at the cow’s birth | 5.5 ± 0.2 | 5.5 ± 0.3 | 4.9 ± 0.2 | 0.10 |
| Housing period | |||||
| Housing_duration (days) | Numbers of days spent in stall during PWP | 104.6 ± 3.4 | 102.8 ± 3.9 | 109.3 ± 3.7 | 0.46 |
| Housing_conc_duration (days) | Number of days of offered concentrates in the calf diet during housing | 64.9 b ± 4.5 | 84.6 a ± 5.1 | 89.3 a ± 4.4 | <0.001 |
| Conc_CP_housing_PWP (%) | Calculated average of the concentrates’ crude protein in the housing diet during PWP | 9.0 b ± 0.6 | 15.8 a ± 0.6 | 14.5 a ± 0.6 | <0.001 |
| Conc_NE_housing_PWP (Mcal) | Calculated average of the concentrates’ net energy in the housing diet during PWP | 1.1 b ± 0.1 | 1.6 a ± 0.1 | 1.5 a ± 0.05 | <0.001 |
| Outside period | |||||
| Pasture_duration (days) | Number of days spent at pasture during PWP | 146.3 a ± 3.2 | 126.0 b ± 4.8 | 144.6 a ± 3.2 | <0.001 |
| Tot_forage_outside_duration_PWP (days) | Number of days of offered forages in the calf’s diet during outside period | 96.0 b ± 6.5 | 93.3 b ± 7.9 | 142.5 a ± 3.5 | <0.001 |
| Overall PWP | |||||
| Conc_duration_PWP (days) | Number of days of offered concentrates in the calf’s diet during PWP | 68.0 c ± 4.9 | 170.4 b ± 7.0 | 195.8 a ± 7.0 | <0.001 |
| Conc_CP_PWP (%) | Calculated average of the concentrates’ crude protein in the diet during PWP | 9.1 b ± 0.6 | 15.8 a ± 0.4 | 17.0 a ± 0.4 | <0.001 |
| Conc_NE_PWP (Mcal) | Calculated average of the concentrates’ net energy in the diet during PWP | 1.1 b ± 0.1 | 1.7 a ± 0.04 | 1.7 a ± 0.03 | <0.001 |
| Qualitative Rearing Factors | |||||
| Insemination type | |||||
| Artificial | Artificial insemination using frozen semen | 48.3% | 23.2% | 20.0% | <0.001 |
| Natural | Insemination performed by a bull | 51.7% | 76.8% | 80.0% | |
| Calving | |||||
| Easy | Natural calving | 16.8% | 17.1% | 31.4% | 0.005 |
| Help | Farmer intervention during the calving | 83.2% | 82.9% | 68.6% | |
| Housing period | |||||
| Forage_housing_PWP | |||||
| No | No offered forages in calf’s diet during housing period | 35.6% | 36.6% | 86.4% | <0.001 |
| Yes | Offered forages in calf’s diet during housing period | 64.4% | 63.4% | 13.6% | |
| Outside period | |||||
| Conc_outside_PWP | |||||
| No | No offered concentrates in calf’s diet during outside period | 96.0% | 34.2% | 12.9% | <0.001 |
| Yes | Offered concentrates in calf’s diet during outside period | 4.0% | 65.8% | 87.1% | |
| Conc_CP_outside_PWP (Mcal) | |||||
| No | No offered concentrates in calf’s diet during outside period | 96.0% | 34.1% | 12.9% | <0.001 |
| ≤18% | During the outside period, the calculated average of concentrate’s crude protein content was below 18% | 4.0% | 53.7% | 50.7% | |
| >18% | During the outside period, the calculated average of concentrate’s crude protein content was above 18% | 0% | 12.2% | 36.4% | |
| Conc_NE_outside_PWP (Mcal) | |||||
| No | No offered concentrates in calf’s diet during outside period | 96.0% | 34.1% | 12.9% | <0.001 |
| ≤1.8 Mcal | During the outside period, the calculated average of concentrate’s net energy content was below 1.8 Mcal | 0% | 25.6% | 70.7% | |
| >1.8 Mcal | During the outside period, the calculated average of concentrate’s net energy content was above 1.8 Mcal | 4.0% | 40.2% | 16.4% | |
| Rearing Factors | Description of the Rearing Factor | RM-1 (n = 149) | RM-2 (n = 82) | RM-3 (n = 140) | p |
|---|---|---|---|---|---|
| Quantitative Rearing Factors | Mean ± SE | Mean ± SE | Mean ± SE | ||
| Age at the weaning (months) | Age of cow at the weaning | 8.7 ± 0.08 | 8.7 ± 0.1 | 8.4 ± 0.07 | 0.08 |
| Housing period | |||||
| Housing_duration_GP (days) | Number of days spent in housing during GP | 190.5 c ± 6.5 | 247.4 b ± 10.5 | 284.5 a ± 5.9 | <0.001 |
| Hay_housing_GP (%) | Calculation of the hay percentage in the average housing diet across the whole GP | 41.8 a ± 2.3 | 29.0 b ± 3.4 | 36.2 ab ± 2.8 | 0.009 |
| Grass_silage_housing_GP (%) | Calculation of the grass silage percentage in the average housing diet across the whole GP | 20.4 b ± 1.9 | 37.6 a ± 3.3 | 42.2 a ± 2.6 | <0.001 |
| Conc_housing_duration_GP (days) | Number of days of offered concentrates in the housing diet during GP | 154.1 b ± 7.4 | 28.8 c ± 5.6 | 264.5 a ± 5.6 | <0.001 |
| Conc_CP_housing_GP (%) | Calculated average of concentrate’s crude protein content across the whole housing period | 13.7 b ± 0.5 | 5.7 c ± 0.8 | 18.1 a ± 0.3 | <0.001 |
| Conc_NE_housing_GP (Mcal) | Calculated average of concentrate’s net energy content across the whole housing period | 1.6 b ± 0.05 | 0.7 c ± 0.1 | 1.9 a ± 0.01 | <0.001 |
| Outside period | |||||
| Outside_duration_GP (days) | Number of days spent outside during GP | 602.3 a ± 8.8 | 501.0 b ± 14.5 | 504.8 b ± 5.4 | <0.001 |
| Pasture_duration_GP (days) | Number of days spent at pasture during GP (cows graze) | 532.4 a ± 8.6 | 446.3 c ± 10.1 | 478.0 b ± 3.9 | <0.001 |
| Forage_comp_outside_GP (days) | Number of days when forages were offered during the whole outside period of GP | 231.0 a ± 13.0 | 243.2 a ± 20.1 | 156.6 b ± 9.0 | <0.001 |
| Overall GP | |||||
| GP_duration (days) | Number of days between the weaning and the first calving | 792.8 a ± 7.3 | 748.4 b ± 13.9 | 789.3 a ± 3.7 | <0.001 |
| Conc_duration_GP (days) | Number of days offered concentrates in the diet during GP | 259.6 b ± 6.9 | 58.2 c ± 8.1 | 316.5 a ± 4.6 | <0.001 |
| Conc_quanti_intake_GP (kg) | Total concentrate quantity intake per heifer during the whole GP | 296.6 b ± 12.8 | 85.6 c ± 12.1 | 590.1 a ± 22.5 | <0.001 |
| Conc_CP_GP (%) | Calculated average of concentrate’s crude protein content across the whole GP | 15.1 b ± 0.4 | 9.7 c ± 0.8 | 18.0 a ± 0.3 | <0.001 |
| Conc_NE_GP (Mcal) | Calculated average of concentrate’s net energy content across the whole GP | 1.8 a ± 0.03 | 1.3 b ± 0.1 | 1.9 a ± 0.01 | <0.001 |
| Qualitative Rearing Factors | |||||
| Housing period | |||||
| Conc_quanti_intake_housing_GP (kg) | |||||
| 0 kg | No offered concentrates during the housing period | 13.4% | 63.4% | 0% | <0.001 |
| <100 kg | Total concentrate quantity intake per heifer during the housing period was below 100 kg | 20.1% | 12.2% | 1.4% | |
| [100 kg; 200 kg] | Total concentrate quantity intake per heifer during the housing period was between 100 kg and 200 kg | 32.9% | 21.9% | 4.3% | |
| [200 kg; 400 kg] | Total concentrate quantity intake per heifer during the housing period was between 200 kg and 400 kg | 26.2% | 2.4% | 42.1% | |
| [400 kg; 800 kg] | Total concentrate quantity intake per heifer during the housing period was between 400 kg and 800 kg | 7.4% | 0% | 30.0% | |
| >800 kg | Total concentrate quantity intake per heifer during the housing period was above 800 kg | 0% | 0% | 22.1% | |
| Outside period | |||||
| Hay_outside_GP (%) | |||||
| No | No offered hay during the outside period | 11.4% | 26.8% | 18.6% | <0.001 |
| <50% | In the forage supplementation during the outside period, the proportion of hay was below 50% | 10.1% | 2.4% | 7.1% | |
| [50%; 80%] | In the forage supplementation during the outside period, the proportion of hay was between 50% and 80% | 17.4% | 21.9% | 35.7% | |
| >80% | In the forage supplementation during the outside period, the proportion of hay was above 80% | 61.1% | 48.8% | 38.6% | |
| Conc_outside_duration_GP (days) | |||||
| No | No offered concentrates during the outside period | 20.1% | 63.4% | 48.6% | <0.001 |
| ≤100 days | During the outside period, the duration of concentrate distribution was below 100 days | 28.9% | 34.1% | 34.3% | |
| >100 days | During the outside period, the duration of concentrate distribution was above 100 days | 51.0% | 2.4% | 17.1% | |
| Conc_quanti_intake_outside_GP (kg) | |||||
| 0 kg | No offered concentrates during the outside period | 20.1% | 63.4% | 48.6% | <0.001 |
| <100 kg | Total concentrate quantity intake per heifer during the outside period was below 100 kg | 19.5% | 26.8% | 5.0% | |
| [100 kg; 200 kg] | Total concentrate quantity intake per heifer during the outside period was between 100 kg and 200 kg | 34.9% | 1.2% | 34.3% | |
| >200 kg | Total concentrate quantity intake per heifer during the outside period was above 200 kg | 25.5% | 8.5% | 12.1% | |
| Conc_CP_outside_GP (%) | |||||
| No | No offered concentrates during the outside period | 20.1% | 63.4% | 48.6% | <0.001 |
| <16% | Across the whole GP, the calculated average of concentrate’s crude protein content was below 16% | 34.9% | 17.1% | 1.4% | |
| [16%; 18%] | Across the whole GP, the calculated average of concentrate’s crude protein content was between 16% and 18% | 34.2% | 19.5% | 5.7% | |
| >18% | Across the whole GP, the calculated average of concentrate’s crude protein content was above 18% | 10.7% | 0% | 44.3% | |
| Conc_NE_outside_GP (Mcal) | |||||
| No | No offered concentrates during the outside period | 20.1% | 63.4% | 48.6% | <0.001 |
| <1.8 Mcal | Across the whole GP, the calculated average of concentrate’s net energy content was below 1.8 Mcal | 22.8% | 12.2% | 33.6% | |
| [1.8 Mcal; 2 Mcal] | Across the whole GP, the calculated average of concentrate’s net energy content was between 1.8 Mcal and 2 Mcal | 45.6% | 7.3% | 15.0% | |
| >2 Mcal | Across the whole GP, the calculated average of concentrate’s net energy content was above 2 Mcal | 11.4% | 17.1% | 2.9% | |
| Rearing Factors | Description of the Rearing Factor | RM-1 (n = 149) | RM-2 (n = 82) | RM-3 (n = 140) | p |
|---|---|---|---|---|---|
| Quantitative Rearing Factors | Mean ± SE | Mean ± SE | Mean ± SE | ||
| Age_first_calving | Age of the cow at this first calving | 2.9 ± 0.03 | 2.9 ± 0.03 | 3.0 ± 0.02 | 0.16 |
| Housing period | |||||
| Housing_duration_BP (days) | Number of days spent in housing during BP | 517.5 b ± 29.6 | 604.0 ab ± 51.7 | 623.0 a ± 29.0 | 0.05 |
| Outside period | |||||
| Outside_duration_BP (days) | Number of days spent outside during GP | 724.0 ± 50.6 | 808.9 ± 74.8 | 882.1 ± 50.4 | 0.10 |
| Overall BP | |||||
| BP_duration (days) | Number of days between the first calving and the beginning of fattening | 1241.4 ± 79.2 | 1412.9 ± 124.7 | 1505.1 ± 77.4 | 0.07 |
| Conc_duration_BP (days) | Number of days offered concentrates in the diet during BP | 349.7 b ± 30.4 | 12.9 c ± 8.5 | 599.6 a ± 30.3 | <0.001 |
| Conc_quanti_intake_BP (kg) | Total concentrate quantity intake per cow during the whole BP | 408.2 b ± 38.3 | 23.3 c ± 15.3 | 900.9 a ± 56.2 | <0.001 |
| Qualitative Rearing Factors | |||||
| Housing period | |||||
| Hay_BP (%) | |||||
| No | Across the BP, the cows had not hay in the housing diet | 5.4% | 40.2% | 39.3% | <0.001 |
| <25% | Across the BP, the calculated average percentage of hay in the housing diet was below 25% | 28.9% | 21.9% | 18.6% | |
| [25%; 50%] | Across the BP, the calculated average percentage of hay in the housing diet was between 25% and 50% | 34.9% | 34.1% | 16.4% | |
| [50%; 60%] | Across the BP, the calculated average percentage of hay in the housing diet was between 50% and 60% | 15.4% | 0% | 24.3% | |
| >60% | Across the BP, the calculated average percentage of hay in the housing diet was above 60% | 15.4% | 3.7% | 1.4% | |
| Grass_silage_BP (%) | |||||
| No | Across the BP, the cows had not grass silage in the housing diet | 43.6% | 14.6% | 14.3% | <0.001 |
| <50% | Across the BP, the calculated average percentage of grass silage in the housing diet was below 50% | 28.2% | 32.9% | 12.9% | |
| [50%; 60%] | Across the BP, the calculated average percentage of grass silage in the housing diet was between 50% and 60% | 9.4% | 13.4% | 27.9% | |
| >60% | Across the BP, the calculated average percentage of grass silage in the housing diet was above 60% | 18.8% | 39.0% | 45.0% | |
| Corn_silage_BP (%) | |||||
| No | Across the BP, the cows had not corn silage in the housing diet | 77.2% | 25.6% | 47.1% | <0.001 |
| <25% | Across the BP, the calculated average percentage of corn silage in the housing diet was below 25% | 11.4% | 29.3% | 32.9% | |
| [25%; 45%] | Across the BP, the calculated average percentage of corn silage in the housing diet was between 25% and 45% | 11.4% | 45.1% | 20.0% | |
| Outside Period | |||||
| Forage_comp_outside_BP (days) | |||||
| No | No forage supplementation during the outside period | 32.2% | 24.4% | 9.3% | <0.001 |
| <100 days | The duration of the forage supplementation was below 100 days, during the outside period | 24.8% | 6.1% | 31.4% | |
| [100 days; 300 days] | The duration of the forage supplementation was between 100 and 300 days, during the outside period | 19.5% | 29.3% | 27.9% | |
| [300 days; 600 days] | The duration of the forage supplementation was between 300 and 600 days, during the outside period | 12.7% | 14.6% | 13.6% | |
| >600 days | The duration of the forage supplementation was above 600 days, during the outside period | 10.7% | 25.6% | 17.9% | |
| Overall BP | |||||
| Conc_CP_BP (%) | |||||
| No | No offered concentrates during BP | 29.5% | 96.3% | 4.3% | <0.001 |
| <15% | Across the whole BP, the calculated average of concentrate’s crude protein content was below 15% | 44.3% | 0% | 35.0% | |
| [15%; 18%] | Across the whole BP, the calculated average of concentrate’s crude protein content was between 15% and 18% | 3.3% | 3.7% | 34.3% | |
| >18% | Across the whole BP, the calculated average of concentrate’s crude protein content was above 18% | 22.8% | 0% | 26.4% | |
| Conc_NE_BP (Mcal) | |||||
| No | No offered concentrates during BP | 29.5% | 96.3% | 4.3% | <0.001 |
| <1.8 Mcal | Across the whole BP, the calculated average of concentrate’s net energy content was below 1.8 Mcal | 19.5% | 0% | 23.6% | |
| [1.8 Mcal; 2 Mcal] | Across the whole BP, the calculated average of concentrate’s net energy content was between 1.8 Mcal and 2 Mcal | 6.7% | 3.7% | 42.9% | |
| >2 Mcal | Across the whole BP, the calculated average of concentrate’s net energy content was above 2 Mcal | 44.3% | 0% | 29.3% | |
| Rearing Factors | Description of the Rearing Factor | RM-1 (n = 149) | RM-2 (n = 82) | RM-3 (n = 140) | p |
|---|---|---|---|---|---|
| Quantitative Rearing Factors | Mean ± SE | Mean ± SE | Mean ± SE | ||
| Age early fattening (months) | Age of the cull cow at the beginning of FP | 6.3 ± 0.2 | 6.6 ± 0.3 | 7.0 ± 0.2 | 0.07 |
| Slaughter age (months) | Age of the cull cow at the slaughter | 6.6 ± 0.2 | 7.0 ± 0.3 | 7.4 ± 0.2 | 0.07 |
| Housing period | |||||
| Housing_FP_duration (days) | Number of days spent in stall during the FP | 33.7 b ± 4.1 | 124.5 a ± 6.4 | 109.9 a ± 3.7 | < 0.001 |
| Overall FP | |||||
| FP_duration (days) | Number of days between the beginning of FP and the slaughter | 113.5 ± 4.8 | 125.8 ± 6.1 | 123.7 ± 4.3 | 0.17 |
| Forage_comp_FP (days) | Number of days when forages were offered during the FP | 63.9 b ± 5.1 | 124.5 a ± 6.4 | 123.7 a ± 4.3 | <0.001 |
| Conc_quanti_intake_FP (kg) | Total concentrate quantity intake per cull cow during the whole FP | 566.5 b ± 30.5 | 1070.3 a ± 72.7 | 1013.6 a ± 36.2 | <0.001 |
| Conc_CP_FP (%) | Calculated average of concentrate’s crude protein content across the whole FP | 17.4 b ± 0.2 | 17.0 b ± 0.5 | 18.9 a ± 0.3 | <0.001 |
| Conc_EN_FP (Mcal) | Calculated average of concentrate’s net energy content across the whole FP | 1.9 a ± 0.01 | 1.8 b ± 0.04 | 1.9 ab ± 0.01 | 0.002 |
| Qualitative rearing factors | |||||
| Pasture_duration_FP (days) | |||||
| No pasture | No pasture during the FP | 26.8% | 97.6% | 80.0% | <0.001 |
| ≤100 days | During the FP, the number of days at pasture was below 100 days | 44.3% | 2.4% | 12.9% | |
| >100 days | During the FP, the number of days at pasture was above 100 days | 28.9% | 0% | 7.1% | |
| Fattening system | |||||
| Housing | The finishing was carried out in stall | 26.8% | 97.6% | 80.0% | <0.001 |
| Pasture | The finishing was carried out at pasture | 59.1% | 2.4% | 0.7% | |
| Pasture&Housing | The finishing started at pasture and was finished in stall | 14.1% | 0% | 19.3% | |
| Main conserved forage in the FP diet (%) | |||||
| No | No offered conserved forages in the FP diet | 36.2% | 2.4% | 0% | <0.001 |
| Hay_FP | The percentage of hay in the FP diet was above 62% | 18.1% | 8.5% | 0% | |
| Grass_silage_FP | The percentage of grass silage in the FP diet was above77% | 6.7% | 6.1% | 5.7% | |
| Wrapped_haylage_FP | The percentage of wrapped haylage in the FP diet was above71% | 18.8% | 26.8% | 7.9% | |
| Corn_silage_FP | The percentage of corn silage in the FP diet was above 90% | 0% | 19.5% | 32.1% | |
| Straw_FP | The percentage of straw in the FP diet was above 60% | 15.4% | 29.3% | 36.4% | |
| Sorghum_FP | The percentage of sorghum silage in the FP diet was above 71% | 0% | 0% | 5.0% | |
| Hay&Corn_silage_FP | The percentage of the sum of hay and corn silage in the FP diet was above 92% | 1.3% | 0% | 6.4% | |
| Corn_silage&Wrapped_haylage_FP | The percentage of the sum of corn silage and wrapped haylage in the FP diet was above 91% | 0% | 0% | 6.4% | |
| Hay&Corn_silage&Grass_silage_FP | The percentage of hay, corn silage and grass silage in the FP diet was 100% | 3.4% | 0% | 0% | |
| Corn_silage&Grass_silage&Wrapped_haylage_FP | The percentage of corn silage, grass silage, and wrapped haylage in the FP diet was above 81% | 0% | 7.3% | 0% | |
| Meat Traits | RM-1 | RM-2 | RM-3 | p |
|---|---|---|---|---|
| Mean ± SE1 | Mean ± SE | Mean ± SE | ||
| Raw seratus ventralis muscle | n= 140 | n= 81 | n= 130 | |
| Shear force (N/cm2) | 62.2 ± 1.7 | 60.2 ± 1.6 | 61.4 ± 1.4 | 0.70 |
| Raw longissimus muscle (LM) | ||||
| Color | n= 143 | n= 81 | n= 130 | |
| L* | 39.5 ± 0.2 | 39.8 ± 0.3 | 40.3 ± 0.2 | 0.07 |
| a* | 19.4 ± 0.3 | 19.0 ± 0.3 | 18.4 ± 0.3 | 0.06 |
| b* | 12.1 ± 0.1 | 11.7 ± 0.2 | 11.8 ± 0.1 | 0.06 |
| TPA texture profile | n= 123 | n= 73 | n= 109 | |
| Springiness | 0.5 ± 0.01 | 0.5 ± 0.01 | 0.5 ± 0.01 | 0.99 |
| Hardness | 1.6 ± 0.04 | 1.6 ± 0.05 | 1.7 ± 0.04 | 0.50 |
| Cohesiveness | 2.5 ± 0.1 | 2.4 ± 0.2 | 2.2 ± 0.1 | 0.32 |
| Resilience | 0.30 ± 0.01 | 0.3 ± 0.01 | 0.2 ± 0.01 | 0.14 |
| Gumminess | 4.1 ± 0.2 | 3.7 ± 0.3 | 3.6 ± 0.2 | 0.30 |
| Chewiness | 1.9 ± 0.1 | 1.7 ± 0.1 | 1.7 ± 0.1 | 0.29 |
| Cooked LM | ||||
| Sensory descriptors (0–10 scale) | Emmean ± SE | Emmean ± SE | Emmean ± SE | |
| n= 138 | n= 79 | n= 128 | ||
| Red color intensity | 4.1 ab ± 0.2 | 4.3 a ± 0.2 | 3.7 b ± 0.2 | 0.01 |
| Initial tenderness | 6.0 ± 0.1 | 6.1 ± 0.2 | 6.0 ± 0.1 | 0.72 |
| Overall tenderness | 5.5 ± 0.2 | 5.6 ± 0.2 | 5.5 ± 0.2 | 0.50 |
| Overall juiciness | 4.7 ± 0.2 | 4.8 ± 0.2 | 4.8 ± 0.2 | 0.58 |
| Presence of nerves | 2.2 ± 0.2 | 2.3 ± 0.2 | 2.3 ± 0.2 | 0.49 |
| Residue | 3.2 ± 0.2 | 3.1 ± 0.2 | 3.1 ± 0.2 | 0.86 |
| Flavor intensity | 5.9 b ± 0.1 | 5.9 ab ± 0.1 | 6.0 a ± 0.1 | 0.01 |
| Fat aroma | 3.6 b ± 0.2 | 3.8 ab ± 0.2 | 3.9 a ± 0.2 | 0.005 |
| Atypical flavor | 0.9 ± 0.2 | 0.8 ± 0.2 | 1.0 ± 0.2 | 0.07 |
| Flavor persistence | 4.9 b ± 0.2 | 4.9 b ± 0.2 | 5.1 a ± 0.2 | 0.001 |
| Overall acceptability | 5.4 ± 0.1 | 5.5 ± 0.2 | 5.4 ± 0.1 | 0.63 |
Publisher’s Note: MDPI stays neutral with regard to jurisdictional claims in published maps and institutional affiliations. |
© 2022 by the authors. Licensee MDPI, Basel, Switzerland. This article is an open access article distributed under the terms and conditions of the Creative Commons Attribution (CC BY) license (https://creativecommons.org/licenses/by/4.0/).
Share and Cite
Soulat, J.; Picard, B.; Monteils, V. Does the Rearing Management following by Charolais Cull Cows Influence the Qualities of Carcass and Beef Meat? Foods 2022, 11, 2889. https://doi.org/10.3390/foods11182889
Soulat J, Picard B, Monteils V. Does the Rearing Management following by Charolais Cull Cows Influence the Qualities of Carcass and Beef Meat? Foods. 2022; 11(18):2889. https://doi.org/10.3390/foods11182889
Chicago/Turabian StyleSoulat, Julien, Brigitte Picard, and Valérie Monteils. 2022. "Does the Rearing Management following by Charolais Cull Cows Influence the Qualities of Carcass and Beef Meat?" Foods 11, no. 18: 2889. https://doi.org/10.3390/foods11182889