Article

Prediction of Total Soluble Solids and pH of Strawberry Fruits Using RGB, HSV and HSL Colour Spaces and Machine Learning Models

by
Jayanta Kumar Basak
1,2,
Bolappa Gamage Kaushalya Madhavi
3,
Bhola Paudel
3,
Na Eun Kim
3 and
Hyeon Tae Kim
3,*
1
Institute of Smart Farm, Gyeongsang National University, Jinju 52828, Korea
2
Department of Environmental Science and Disaster Management, Noakhali Science and Technology University, Noakhali 3814, Bangladesh
3
Department of Bio-Systems Engineering, Institute of Smart Farm, Gyeongsang National University, Jinju 52828, Korea
*
Author to whom correspondence should be addressed.
Foods 2022, 11(14), 2086; https://doi.org/10.3390/foods11142086
Submission received: 6 June 2022 / Revised: 23 June 2022 / Accepted: 12 July 2022 / Published: 13 July 2022

Abstract

:
Determination of internal qualities such as total soluble solids (TSS) and pH is a paramount concern in strawberry cultivation. Therefore, the main objective of the current study was to develop a non-destructive approach with machine learning algorithms for predicting TSS and pH of strawberries. Six hundred samples (100 samples in each ripening stage) in six ripening stages were collected randomly for measuring the biometrical characteristics, i.e., length, diameters, weight and TSS and pH values. An image of each strawberry fruit was captured for colour feature extraction using an image processing technique. Channels of each colour space (RGB, HSV and HSL) were used as input variables for developing multiple linear regression (MLR) and support vector machine regression (SVM-R) models. The result of the study indicated that SVM-R model with HSV colour space performed slightly better than MLR model for TSS and pH prediction. The HSV based SVM-R model could explain a maximum of 84.1% and 79.2% for TSS and 78.8% and 72.6% for pH of the variations in measured and predicted data in training and testing stages, respectively. Further experiments need to be conducted with different strawberry cultivars for the prediction of more internal qualities along with the improvement of model performance.

1. Introduction

Strawberry (Fragaria x ananassa) is widely consumed because of its distinctive flavour and appearance, and it was found to have the potential ability to prohibit the growth of cancer cells [1,2,3]. Moreover, the decision for subsequent consumption of strawberries also depends on the internal quality of fruits, which is related to the total soluble solids (TSS) content, acidity (pH) and one of the most important vitamin C [4]. With the improvement in the quality of strawberry fruits, the determination of internal quality parameters, such as TSS and pH, is a paramount concern. Therefore, developing an effective and simple method for assessing the interior properties of strawberries is essential to provide consumers with consistent, safe and nutritious fruit.
TSS and pH are the important internal parameters of strawberries for determining their maturity and taste [5]. The levels of these two chemical properties also influence the crop values and the acceptance level by consumers [6]. TSS in strawberries mainly contains sugars and acids with small quantities of dissolved vitamins, fructans, proteins, pigments, phenolics and minerals [7,8]. Sugar content in strawberries is implicated in flavour and determine caloric value of fruits [9]. pH in strawberries, which mainly comes from citric acid, plays a significant role in escalating the ripening of the fruit [10]. In addition, ascorbic acid is one of the most important organic acids involved in flavour, texture, pH and colour of the strawberry [9]. The TSS and pH attributes are significantly affected by the different levels of ripening stages [6]. As a non-climacteric fruit, the full ripening stage is usually chosen for its harvesting since it does not gain desirable properties suited for fresh consumption before detachment [11]. With the changing of ripening stages from white ripening to dark red, significant variations of TSS and pH levels with the fruit’s colour were observed in several strawberry cultivars [12,13]. Likewise, large variations of the fruit’s colour, TSS and pH, according to the different ripening stages of strawberries, were also reported by Martínez-Bolaños et al. [14]. Therefore, the determination and quantification of TSS and pH with considering the fruit’s colour in different ripening stages are of key concern in food sciences research.
The TSS and pH of strawberries are commonly measured by instrumental assessment along with sensory evaluation methods [4,15]. Hydrometer, refractometer and high-performance chromatography are available instruments widely used for assessing the TSS level, while pH meter based on the potentiometric/electrometric techniques are commonly accepted and used for determining pH levels [16,17,18,19,20]. A hydrometer is a simple and common instrument for quantifying TSS. However, it is inadequate and inaccurate due to the incorrect reading associated with huge variations in surface tension on account of surface contamination [21]. Different types of refractometers have also been used for measuring the internal qualities of strawberry fruits, which are more suitable and reliable because they are not affected by the suspended solids, nevertheless, sometimes errors may happen if the readings are taken rapidly [17]. High-performance chromatography techniques are the most effective and innovative method in measuring high accuracy results; however, it is worth noting that the method is very complex and not suitable for quantifying internal quality parameters in a wide range in field levels [21]. Apart from instrumental techniques, sensory evaluation methods, such as triangle test, duo-trio test and paired comparison test, are traditionally used to evaluate the subjective based result other than quantitative and do not give insight into the wider applicability [22]. In addition, all instrumental assessment techniques and sensory evaluation methods are time consuming procedures and those are more applicable in laboratory experiments compared to the real fields.
Recently, the improvement of non-destructive technologies, such as Visible/near-infrared (Vis/NIR) spectroscopy, computer vision and hyperspectral imaging, have gained more attention for measuring the internal qualities of fruits. Among the non-destructive technologies, Vis/NIR spectroscopy is one of the promising analytical methods where pre-sampling is not essential for determining the fruit’s quality [23]. Several studies have been conducted using Vis/NIR spectroscopy to assess the chemical properties of fruits including apples, kiwifruits, tomatoes, oranges, mangoes, mandarins, plums, watermelons and apricot [23,24,25,26,27,28]. Recently, the developed version of Vis/NIR techniques is also being used for sorting different types of fruits based on their internal quality parameters [29]. However, one of the major problems of using this method is the thickness of fruit rinds; less accuracy is obtained for high skin thickness of fruits like watermelon and citrus [21]. Apart from the Vis/NIR spectroscopy technique, several imaging techniques such as multi- and hyper-spectral, thermal imaging techniques have been developed and applied successfully for the quality assessment of a variety of fruits [30]. Nowadays, fruits can be easily inspected and assessed internal parameters using multi- and hyper-spectral imaging techniques. Over the past decade, several studies were reported for quality assessment including dry matter, TSS and pH of strawberries using multi- and hyper-spectral imaging techniques [31,32]. In addition, laser-induced method, thermal imaging, photoacoustic spectroscopy or imaging, X-ray techniques and odour imaging non-destructive techniques have been used for the qualitative detection of fruits. However, the main limitations of these non-destructive technologies are highly expensive equipment needs to be used and the procedures are very complex which are sometime inconceivable for farmhands for fruits’ quality detection and assessment. Therefore, in this study, we have introduced a simple and inexpensive method where we applied three colour spaces, i.e., Red, Blue and Green (RGB); Hue, Saturation and Value (HSV); and Hue, Saturation and Lightness (HSL), acquired by image processing technique and developed prediction models using machine learning algorithms for measuring TSS and pH of strawberries.
According to the previous literature, RGB, HSV and HSL colour spaces have been extensively used for sorting strawberries [33,34,35]. Pardede et al. [34] used four colour spaces, i.e., RGB, HSV, HSL and L * a * b *, and support vector machine (SVM) algorithms to evaluate the level of ripeness of fruits, and based on the experimental results, it was shown that HSV colour feature achieved the best accuracy levels in determining the ripening stages of fruits. In another study, SVM and Caffe-Net algorithms with fast recognition methods were used to evaluate the maturity level of strawberries [36]. Hariri et al. [37] investigated the ripeness level of bell pepper by using a content-based image classification system in different maturity stages and obtained a classification accuracy of 93.89%. A multi-class classification approach and SVM with linear kernel were applied for tomato ripeness measurement where the ripeness classification accuracy had 90.80% [38]. From the available literature [39,40,41], maximum experiments were conducted on various image classification techniques and SVM algorithms to determine the ripeness level of fruits. Hence, the present study was conducted to establish relationships and to develop models between colour spaces, i.e., RGB, HSV and HSL, and fruit’s quality parameters (TSS and pH) using a linear model, i.e., multiple linear regression (MLR) and a non-linear model, i.e., support vector machine regression (SVM-R). This non-destructive method minimizes sampling efforts and expenses as well as improves precision where the samples are complicated to handle. Hence, the main objectives of this study are (1) to determine the TSS and pH level in the six ripening stages of strawberry fruits; (2) to acquire RGB, HSV and HSL colour space values using an image processing technique; (3) to develop MLR and SVM-R models using the colour space’s values for predicting TSS and pH values of strawberries and, finally, (4) to analyse the sensitivity of the best colour space’s values in determining influential colour channels on TSS and pH prediction.

2. Materials and Methods

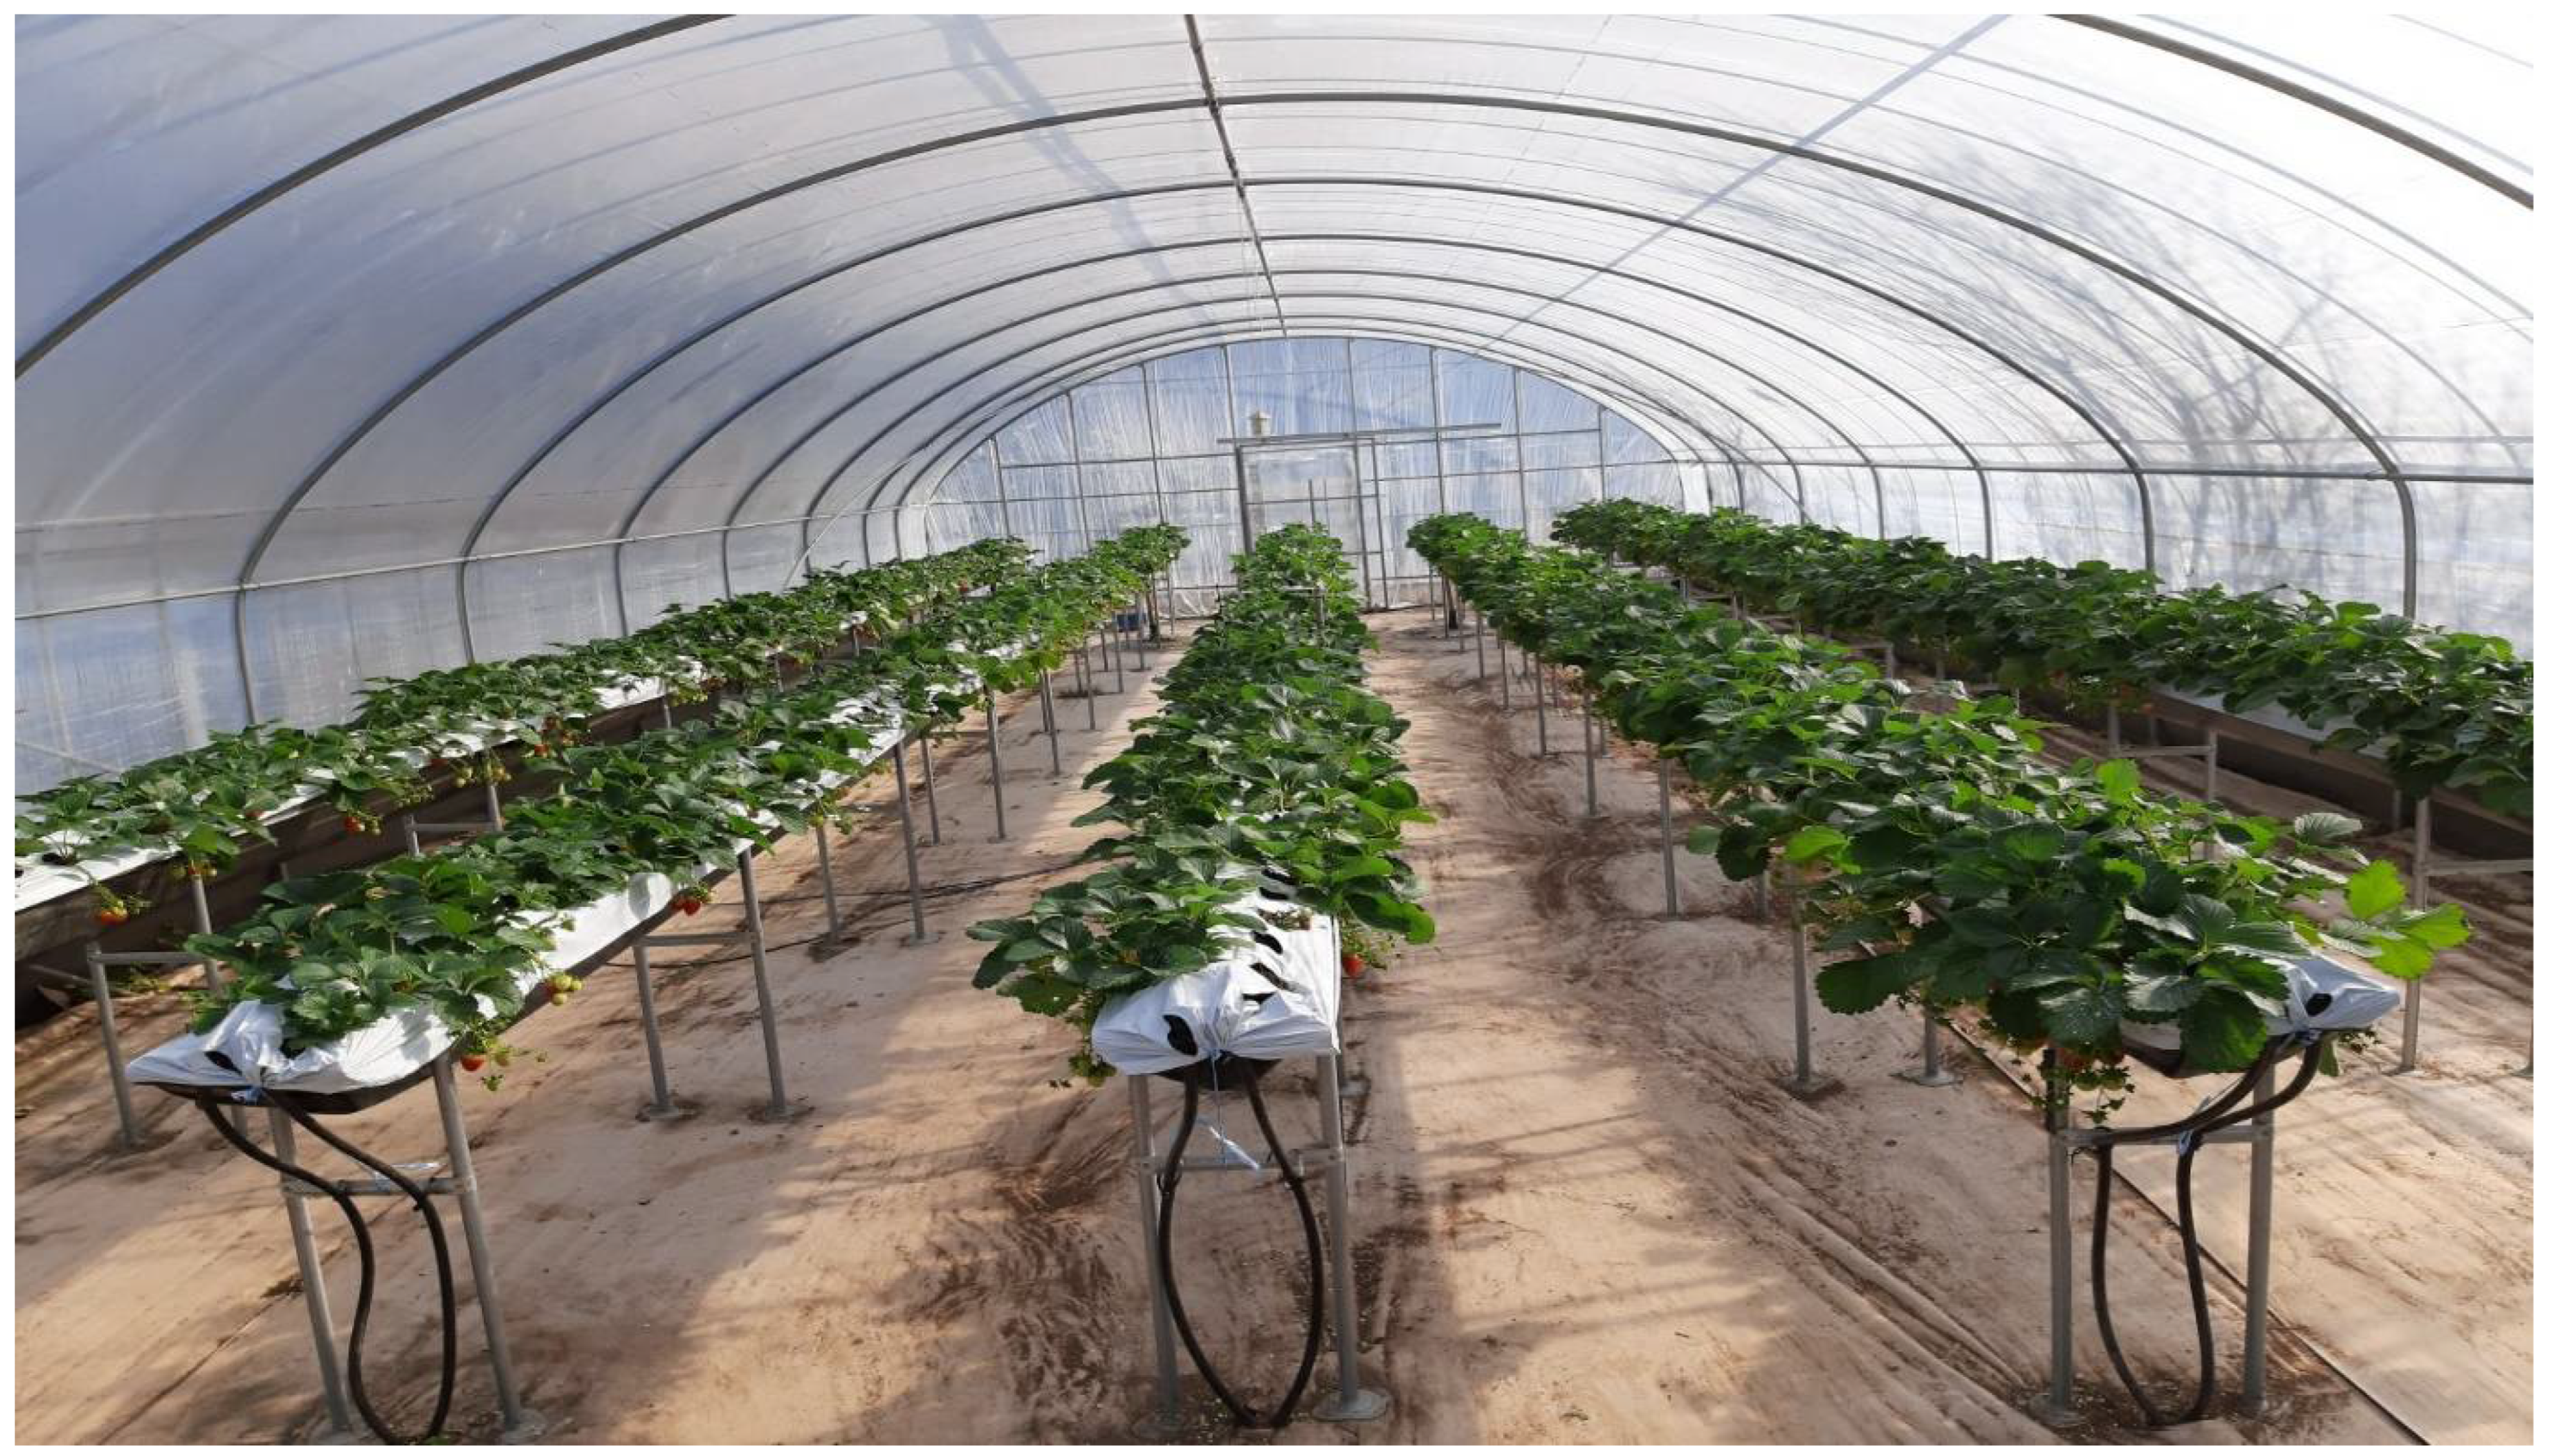
2.1. Plant Materials and Sample Collection

The Seolhyang strawberry (Fragaria x ananassa Duch.) plants were grown in a greenhouse at Smart Farm Systems Laboratory at Gyeongsang National University in Korea from September 2021 to January 2022. The air temperature inside the greenhouse was controlled with a Farmlink controller system (Farmlink™ v 3.0, Jinju, Gyeongsangnam-Do, South Korea) during all growing stages, allowing temperatures only to range from 10 to 30 °C [6]. Moreover, other environmental parameters inside the greenhouse such as CO2, humidity and light were monitored using a highly accurate sensor unit MCH 383SD (Lutron Electronic Enterprises Co. Ltd., Taipei, Taiwan). A total of five hundred strawberry plants in five rows have been cultivated under the combination of bio plus compost soil and Hoagland solution (Figure 1). Bio plus compost soil is very famous for greenhouse crop cultivation in Korea which consist of cocopeat (68.86%), peat moss (11.00%), perlite (11.00%) and zeolite (9.00%) [42]. Irrigation was applied daily in the range from 20 to 30 mL per plant in early stage to 30 to 50 mL per plant in ripening stage of strawberries [43].
Strawberries were harvested at six ripening stages, i.e., Whiting (RS1), Turning (RS2), Half-red (RS3), Three-quarter red (RS4), Bright red (RS5) and Dark red (RS6) based on the colour development on skin, ranging from white to dark red [6]. The typical samples of strawberries of the six ripening stages as shown in Figure 2. In each ripening stage, 100 fruits were collected and numbered for biometrical characteristics, TSS and pH determination and image acquisition.

2.2. Determination of Biometrical Characteristics, Total Soluble Solid and pH

Before the determination of biometrical characteristics, TSS and pH, each fruit was washed with water, drained and dried with paper towels first. Biometrical characteristics including weight, diameters and length were measured on 100 fruits at each ripening stage. For measuring the fresh weight (in g) of fruits, a digital balance (FX-300iWP, A&D Company Ltd., Tokyo, Japan) was used. A digital Vernier caliper (Digital Caliper E03-150 122-521, Datac Co., Ltd., Seoul, Korea) was used to determine the stem length and diameters (in mm). Table 1 shows the summary statistics of fruits’ weight, length and diameters in six ripening stages.
TSS and pH were measured directly using a portable digital refractometer (Model: KERN ORA 32BA, KERN & SOHN GmbH, Balingen, Germany) and a digital pH meter (Model: HM Digital pH-200 Waterproof Temperature pH Meter, HM Digital, Daejon, Korea), respectively. Extracted juice prepared using a mechanical blender (Model: TT-I777, Two thousand Machinery Co., Ltd., Guangzhou, China) from individual fruit was used to determine the pH according to the method of AOCC [44], while the TSS was measured using the procedure described by Dadzie and Orchard [45]. The summary statistics of TSS and pH of fruits in each ripening stage are presented in Table 1.

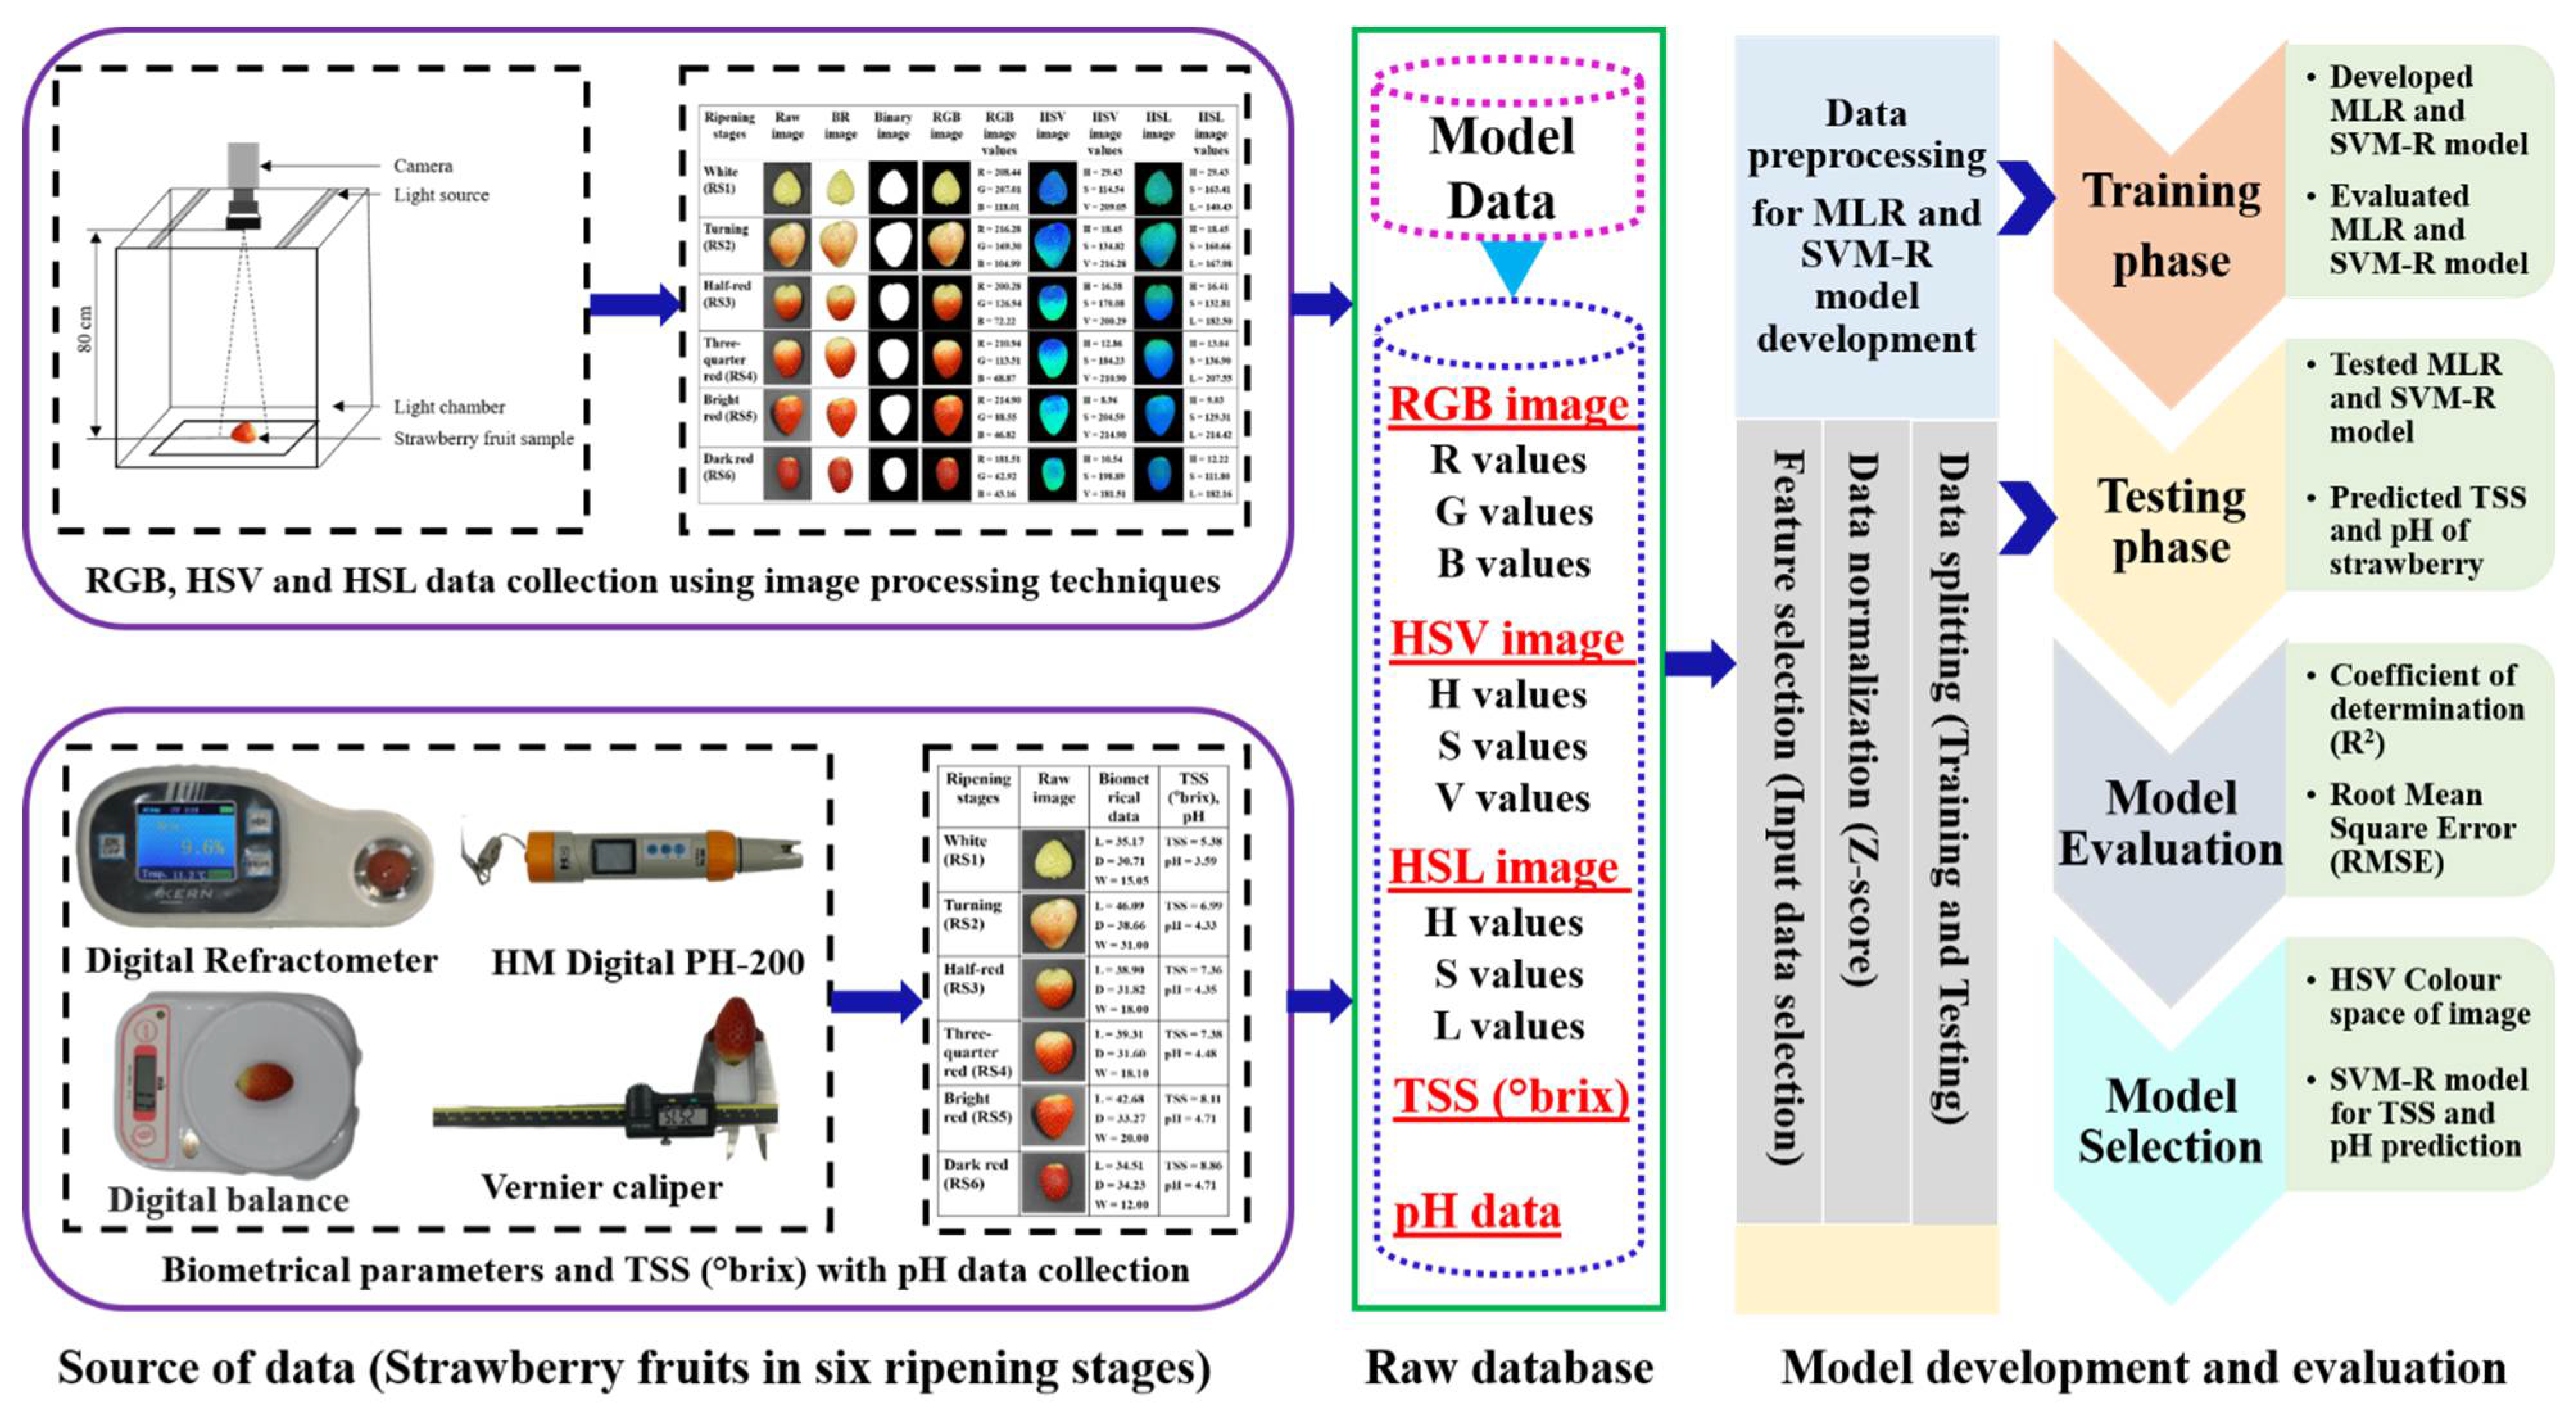
2.3. Image Acquisition of Strawberry Fruits

A laboratory-based imaging system was applied to acquire strawberries images. To acquire the images, each strawberry sample was placed in a smooth rectangular light chamber (80 × 80 × 80 cm). The light chamber consisted of two strips of light-emitting diodes (LEDs) and the total light emitting capacity of lamps in each strip was 10 W. The inner part of the light chamber (except the bottom surface) consisted of an aluminium surface, reflecting the light from all directions to ensure no shadow forms around the strawberry and got high-quality images. The bottom surface inside the light chamber consists of a black surface for an even background. An RGB camera (SONY DSC-RX100 vii, Sony, Seoul, Korea) with 5472 × 3648 pixels resolution was used for capturing images. The distance between the camera lens and the sample plate was fixed as 80 cm. Images were captured on the two opposite sides in horizontal plane of each one of the 600 strawberries in the six ripening stages (Figure 2). During the image acquisition time, the procedures were kept the same for all strawberries.

2.4. Colour Feature Extraction of Strawberry Fruits

The acquired images were processed using open-source libraries in a Python (Python 3.7.0) environment. Our region of interest (ROI) was only the fruit parts, therefore, each image sample of strawberries was segmented from its background using remove.bg software and resized it by 500 × 500 pixels. After background removal from each image, red (R), green (G) and blue (B) values were computed using a channel splitting algorithm developed using Python. RGB colour space is a common colour standard for obtaining a wide array of colours where each channel ranges from 0 to 255 [46]. Subsequently, each RGB image was converted to HSV (Hue, Saturation and Value) and HSL (Hue, Saturation and Lightness) colour spaces. The HSV colour space represents the nuances of colour in 3-D cylindrical coordinates which is often called the hexcone model. The HSL colour space was developed with the same idea as the HSV colour space with 3-D cylindrical coordinates; however, due to consisting of 2 cones, HSL model is called the bi-hexconemodel [34]. The following equations have been used to transfer of RGB colour space into the HSV (Equations (1)–(3)) and HSL (Equations (4) and (6)) colour spaces [47,48].
V = M a x   ( R ,   G ,   B )
H = { u n d e f i n e d ,   i f   M a x = M i n ( G B M a x M i n ) × A ,   i f   M a x = R ( B R M a x M i n + 2 ) × A ,   i f   M a x = G ( R G M a x M i n + 4 ) × A ,   i f   M a x = B
S = { 0 ,   i f   M a x = M i n ( M a x M i n ) ,   o t h e r s
where in RGB colour space, R, G and B values vary from 0 to 255. Max = max (R, G, B), Min = min (R, G, B) and A = π/3 if H is expressed in radians or A = 60 ° if H is expressed in degrees. The range of H varies from −π/3 to +5π/3 in radians scale and − 60 ° to 300 ° in degree scale. Whereas the S and V vary from 0 to 255.
L = M a x + M i n 2
H = { u n d e f i n e d ,   i f   M a x = M i n ( G B M a x M i n ) × 60 ° ,   i f   M a x = R ( B R M a x M i n + 2 ) × 60 ° ,   i f   M a x = G ( R G M a x M i n + 4 ) × 60 ° ,   i f   M a x = B
S = { 0 ,   i f   M a x = M i n M a x M i n 2 L 255 ,   i f   L 127   M a x M i n 2 ( 2 L 255 ) ,   i f   L < 127
where Max = max (R, G, B) and Min = min (R, G, B). The range of H varies from −π/3 to +5π/3 in radians scale, while the S and L values vary from 0 to 255.

2.5. Data Pre-Processing for Prediction Model Development

As a first step, overall datasets, i.e., R, G, B values from RGB colour space; H, S, V values from HSV colour space; and H, S, L values from HSL colour space, and TSS and pH were obtained in six ripening stages of 600 strawberries. In the next step, the measured data were subjected to the data preprocessing techniques, including missing data analysis, feature extraction and data normalization, as well as training and testing data partition. In the measured data, there were no missing values; therefore, the current research did not consider any method for imputing the missing data. A rank correlation test was widely used to identify the right features from the available datasets [49]. In this study, rank correlation, i.e., the Pearson correlation technique, was applied, as briefly described in the input datasets for model development section. A different range of variables in a same dataset used as an input parameters for developing machine learning (ML) models may reduce the model’s learning performance and prediction efficiency [49]. For that reason, data normalization, a popular data preprocessing technique, has been commonly used to avoid complications. In this study, the Z-score data normalization technique (Equation (7)) has been applied to keep data in the range from 0 to 1 within the same scale that was used across all numeric columns in datasets.
Z = x μ σ
where Z , x , μ and σ denote the standard score, value in the data set, mean of all values in the data set and standard deviation, respectively.
Moreover, the prediction capabilities of ML models are also influenced by the data partition in the training and testing stages. Several studies used 70:30 (training: testing), 80:20 and 90:10 partition to develop and validate model [49,50,51,52]. After examining the model performance using the three data partitions (70:30, 80:20 and 90:10), the current study utilized 80% data during the training stage and 20% data during the testing stage.

2.6. Development of Multiple Linear Regression (MLR)

MLR model is developed using the same principle as simple linear regression where the analysis is carried out to predict one dependent variable for a given set of independent variables [53]. MLR offers a wide range of real-world applications in three main areas: evaluating relationships between variables, numerical predictions and time series forecasting. It is widely used in various fields including yield prediction of crops, weather forecasting, demand calculation of electricity, business forecast, etc. [52,54,55]. The formula of MLR model is represented by the Equation (8).
Y i = β o + β 1 X 1 + β 2 X 2 + .   .. + β n X n + ε i
where Y i is the predicted variable (TSS/pH) in this formula, β0βn are the coefficients of regression, X1Xn are the input variables (R, G, B values for RGB colour space; H, S, V values for HSV colour space and H, S, L values for HSL colour space), and ε is the error associated with the ith observation. The basic architecture of MLR is shown in Figure 3a.

2.7. Development of Support Vector Machine Regression (SVM-R)

SVM is a powerful non-linear multivariate technique that creates a hyperplane or set of hyperplanes in a high-dimensional space for classification named support vector classification (SVC), and the same principle is applied for support vector machine regression (SVM-R) [56,57]. Using kernel functions in non-linear SVM is important since SVM effectiveness is influenced by the kernel function employed in the model [47]. The SVM model is built using three basic kernel functions: polynomial, radial basis and sigmoid functions, with the radial basis function (RBF) being the most commonly employed due to its ability to handle non-linear relationships more efficiently compared to others [23]. After experimenting on several SVM-R structures using the three kernel functions with gamma (γ), epsilon (ε) and penalty parameter of the error term (C), the study decided to apply radial basis function (RBF) as kernel type, γ = 0.5, ε = 0.1 and C = 50. In this study, the predicted TSS and pH values of strawberries were followed by the SVM-R operated formula (Equation (9)).
Y ^ 0 = i = 1 n K ( X i , X 0 ) ( α i α i * ) ; K ( X i , X 0 ) = exp ( | X i X j | ) 2 Y
where α i and α i * denote the support vectors and K ( X i , X 0 ) represents the radial basis function. The basic architecture of the one-dimensional SVM-R is shown in Figure 3b.

2.8. Application Methodology and Performance Metrics

In this study, MLR and SVM-R models were developed employing open-source libraries in Python (Python 3.7.0) environment. As a high-level programming language, python was extensively used in scientific fields. Data processing, manipulation and visualization were accompanied using NumPy [58], Pandas [59] and Matplotlib [60], respectively in the python environment. Root mean square error (RMSE) (Equation (10)) and coefficient of determination (R2) (Equation (11)) evaluation metrics have been used to measure the performance of the two models. Statistical Package for the Social Sciences (IBM, SPSS Statistics 22.0.0.0, New York, NY, USA) was used for statistical analysis and Origin Pro 9.5.5 (OriginLab, Northampton, MA, USA) was used for the data representation as figures. Figure 4 shows the aggregate workflow of the current study systematically.
R M S E = 1 n Σ t = 1 n   ( y t   a c t u a l y t   p r e d i c t e d ) 2
R 2 = 1 Σ t = 1 n ( y t   a c t u a l y t   p r e d i c t e d ) 2 Σ t = 1 n ( y t   a c t u a l y t   m e a n ) 2

3. Results and Discussion

3.1. Changes in Biometrical Characteristics, Total Soluble Solid and pH

In this study, a total of 600 samples were collected for analysing biometrical characteristics (length, diameter and weight), total soluble solids (TSS) and pH in six different ripening stages of strawberries. Table 1 shows the summary of statistics of each measurement for all datasets. Length, diameter, weight, TSS and pH of strawberries changed significantly in different repining stages and the variation was particularly observed in all stages for TSS and pH measurement. In addition, the length, diameter and weight of strawberries did not change significantly in all ripening stages at the same levels. Analysing the 100 samples in each ripening stage, significant variations were observed among white (RS1), half red (RS3) and bright red (RS5) stages for length, diameter and weight of strawberries. These observations were expected since growing and ripening occur simultaneously in strawberry fruits [61]. Abeles and Takeda [62] reported an increase in growing phase of ‘Tribute’ strawberries from white to red ripening stage. Strawberry varieties such as ‘Pajaro’, ‘Chandler’ and ‘Selva’ were shown the similar patterns [63,64,65]. Length, diameter and weight of strawberry fruit are scarcely mentioned in this current study. In general, strawberries collected in different ripening stages showed good biometrical characteristics.
TSS in strawberries increased continuously from the white to dark red ripening stage with statistically significant. TSS in tested strawberries (TSS = 4.90–10.15 °brix) was into the range (TSS = 4.8–10.9 °brix) reported in literature for the ripening stages of strawberries [12,66]. Similar results were mentioned for different strawberry cultivars in the ripening stages [13,67]. During the ripening stages, the fruit’s starch degrades and transforms into TSS components by the hydrolysis of enzymes, i.e., α-amylase and β-amylase [68]. Villanueva et al. [69] stated that total sugar levels rise as the strawberries ripen, whereas invertase enzyme activity declines. Like TSS, pH levels also increased significantly in the ripening stages, and their changes were highly correlated with TSS (r = 0.76). The content of pH in tested fruits (pH = 3.45–5.32) was into the range (pH = 3.20–5.40) reported for fruit from many strawberry cultivars, including ‘Daewang’, ‘Maehyang’ and ‘Santa’ [70]. Montero et al. [9] reported that the pH levels increased continuously for ‘Chadler’ strawberries in the ripening period. Similar results were mentioned for ‘Oso Grande’ and ‘Sweet Charly’ strawberries [11]. The increasing trend of a strawberry’s pH level may occur due to the breaking down of organic acids and converting into sugar after the respiration process [71]. As a result, the TSS and pH values increased with the decreased of organic acids such as malic or citric acid, where these acids are the primary substrates for the respiration process in ripening period [72].

3.2. Changes in Channels of RGB, HSV and HSL Colour Spaces

Based on the analysis of variance (ANOVA), the study results found that strawberries at six ripening stages had high significant variations of colour values (Table 2, Table 3 and Table 4). The colour of strawberries develops from white to dark red during its ripening process [73]. In RGB colour space, R values increased significantly in RS2, RS3, RS4 and RS5 stages compared to RS1, however, in the RS6 stage, remarkably, it reduced. In addition, G and B values gradually decreased from the white to dark red stage and the variations were found significantly in all ripening stages of strawberries (Table 2). Similar changes in colour spaces were reported for ripening ‘Selva’ strawberries [63]. In the case of HSV colour space, Hue (H) colour channel in strawberries diminished continuously from RS1 to RS5. Initially, H value was calculated 65% lower at the RS5 stage compared to RS1.
Ferreyra et al. [63] and de Jesús Ornelas-Paz et al. [6] also reported a continuous decrease of H in ripening stages. In addition, S values significantly reduced in all ripening stages, whereas V values showed a different level of change (Table 3). Like HSV colour space, a similar pattern of changes has been observed in HSL colour space (Table 4). In general, S and L values of sampled ripe fruit (RS6; S = 109.21 ± 4.16 and L = 195.71 ± 7.24) were in the typical range (S = ~ 100.00–220.00 and L = ~ 120.00–230.00) reported in literatures during different ripening stages of strawberries [11,74]. Similar findings were stated in ripening fruits from other strawberry cultivars [12].

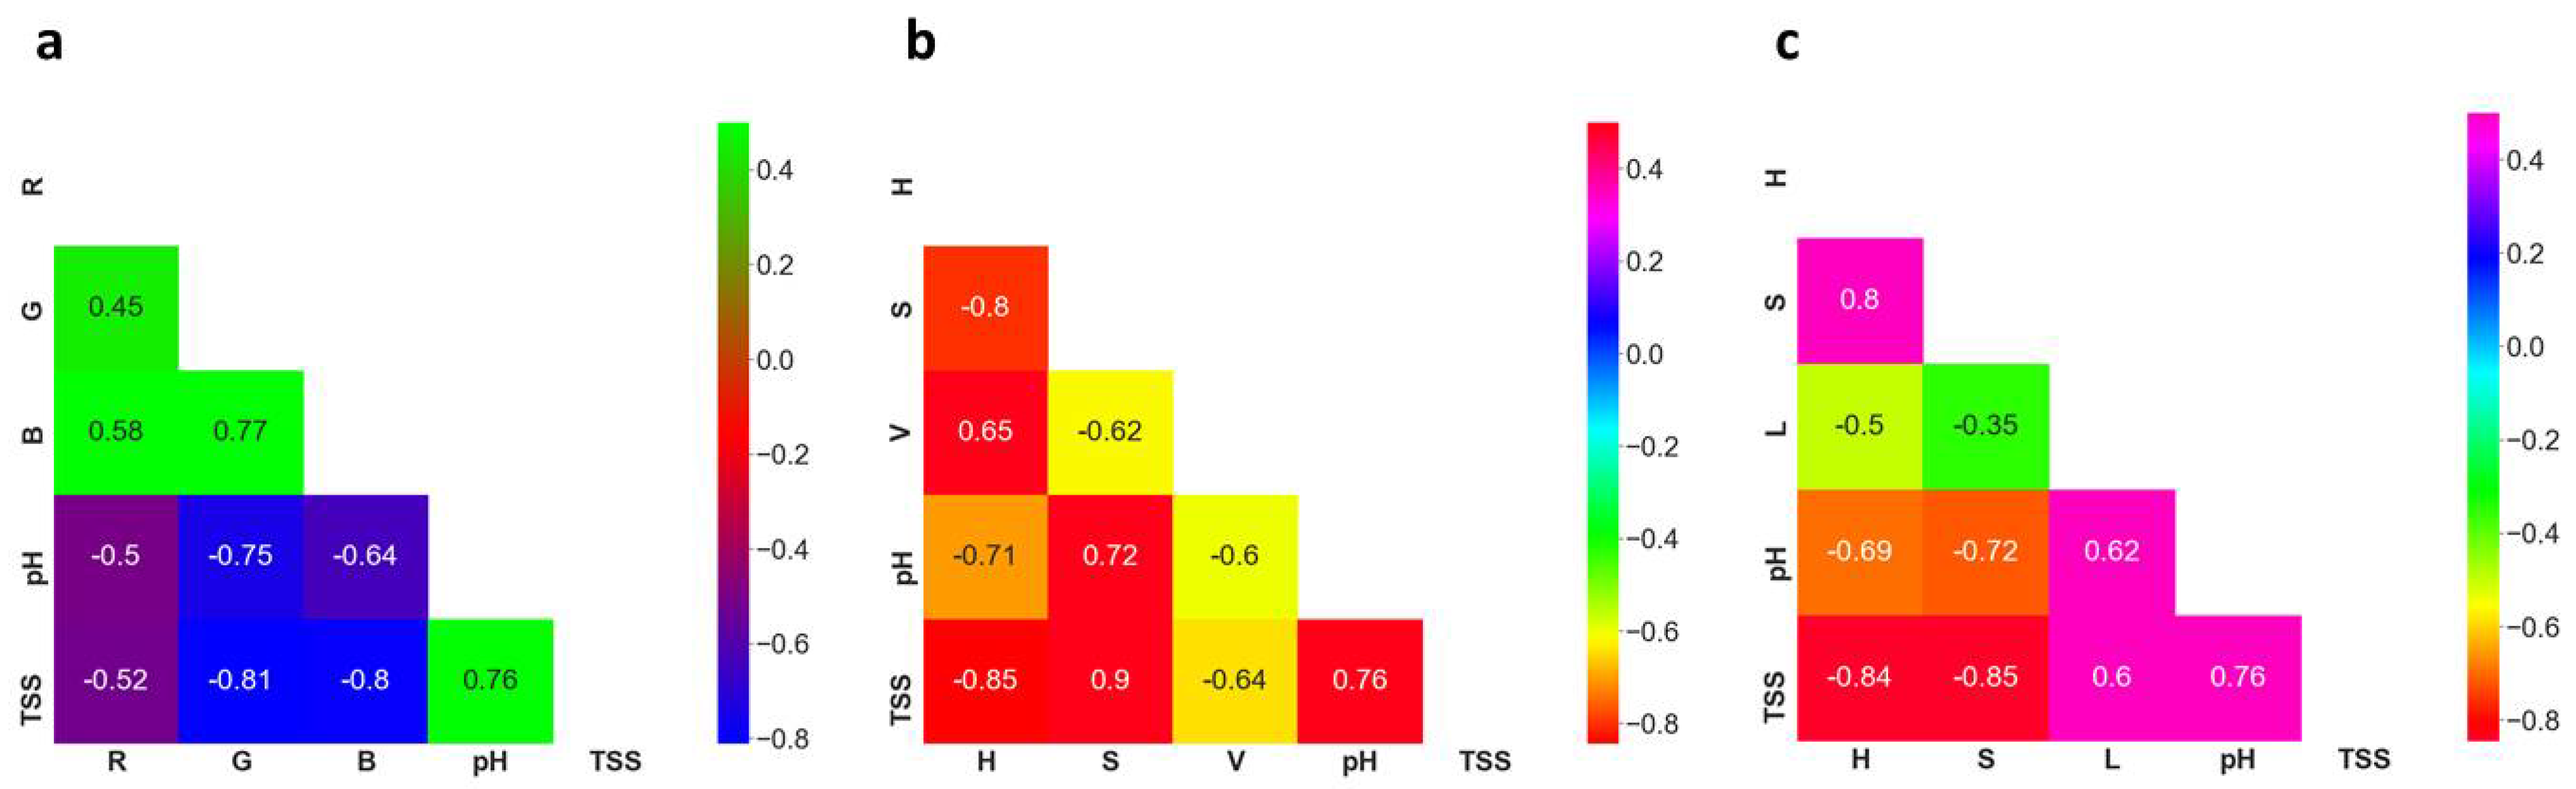
3.3. Input Datasets for Model Development

The selection of input variables is one of the most important aspects of developing machine learning models as well as improving model accuracy [50]. There are various approaches to find out the most suitable variables; however, the correlation coefficient is one of the most effective methods for this subject [75]. In the current study, we used the Pearson correlation coefficient technique, which explained the explanatory and response variables and determined the strength of a relationship between those variables. Having a good relationship, the independent variables can be considered a strong predictor of the dependent variables [76]. The relationship between the independent variables, i.e., RGB (red, green and blue), HSV (Hue, Saturation and Value) and HSL (Hue, Saturation and Lightness) colour spaces and dependent variables (TSS and pH), are illustrated using heat maps (Figure 5).
As shown in Figure 5, there was a negative correlation between RGB colour space and TSS and pH values. The findings of the study also revealed that G was more influential factor compared to R and B channels in predicting TSS (r = −0.81) and pH (r = −0.75) values. Moreover, a high positive correlation was found between the S channel and TSS (r = 0.90) and pH (r = 0.72) values in HSV colour space, whereas a negative correlation was exhibited between H channel and TSS and pH values. Like H channel, V channel also showed a negative relationship with TSS and pH values. According to the heat map results (Figure 5), in HSL colour space, H and S channels showed a strong negative relationship with TSS and pH, however, L had a positive correlation with the two factors. Based on the overall analysis, it can be concluded that S in HSV colour space had the highest correlation value with TSS and pH among all input channels. In addition, all channels in each colour space had a good correlation (r ≥ 0.5) with TSS and pH; therefore, every channel was considered as an input variable in developing machine learning models in the present study.

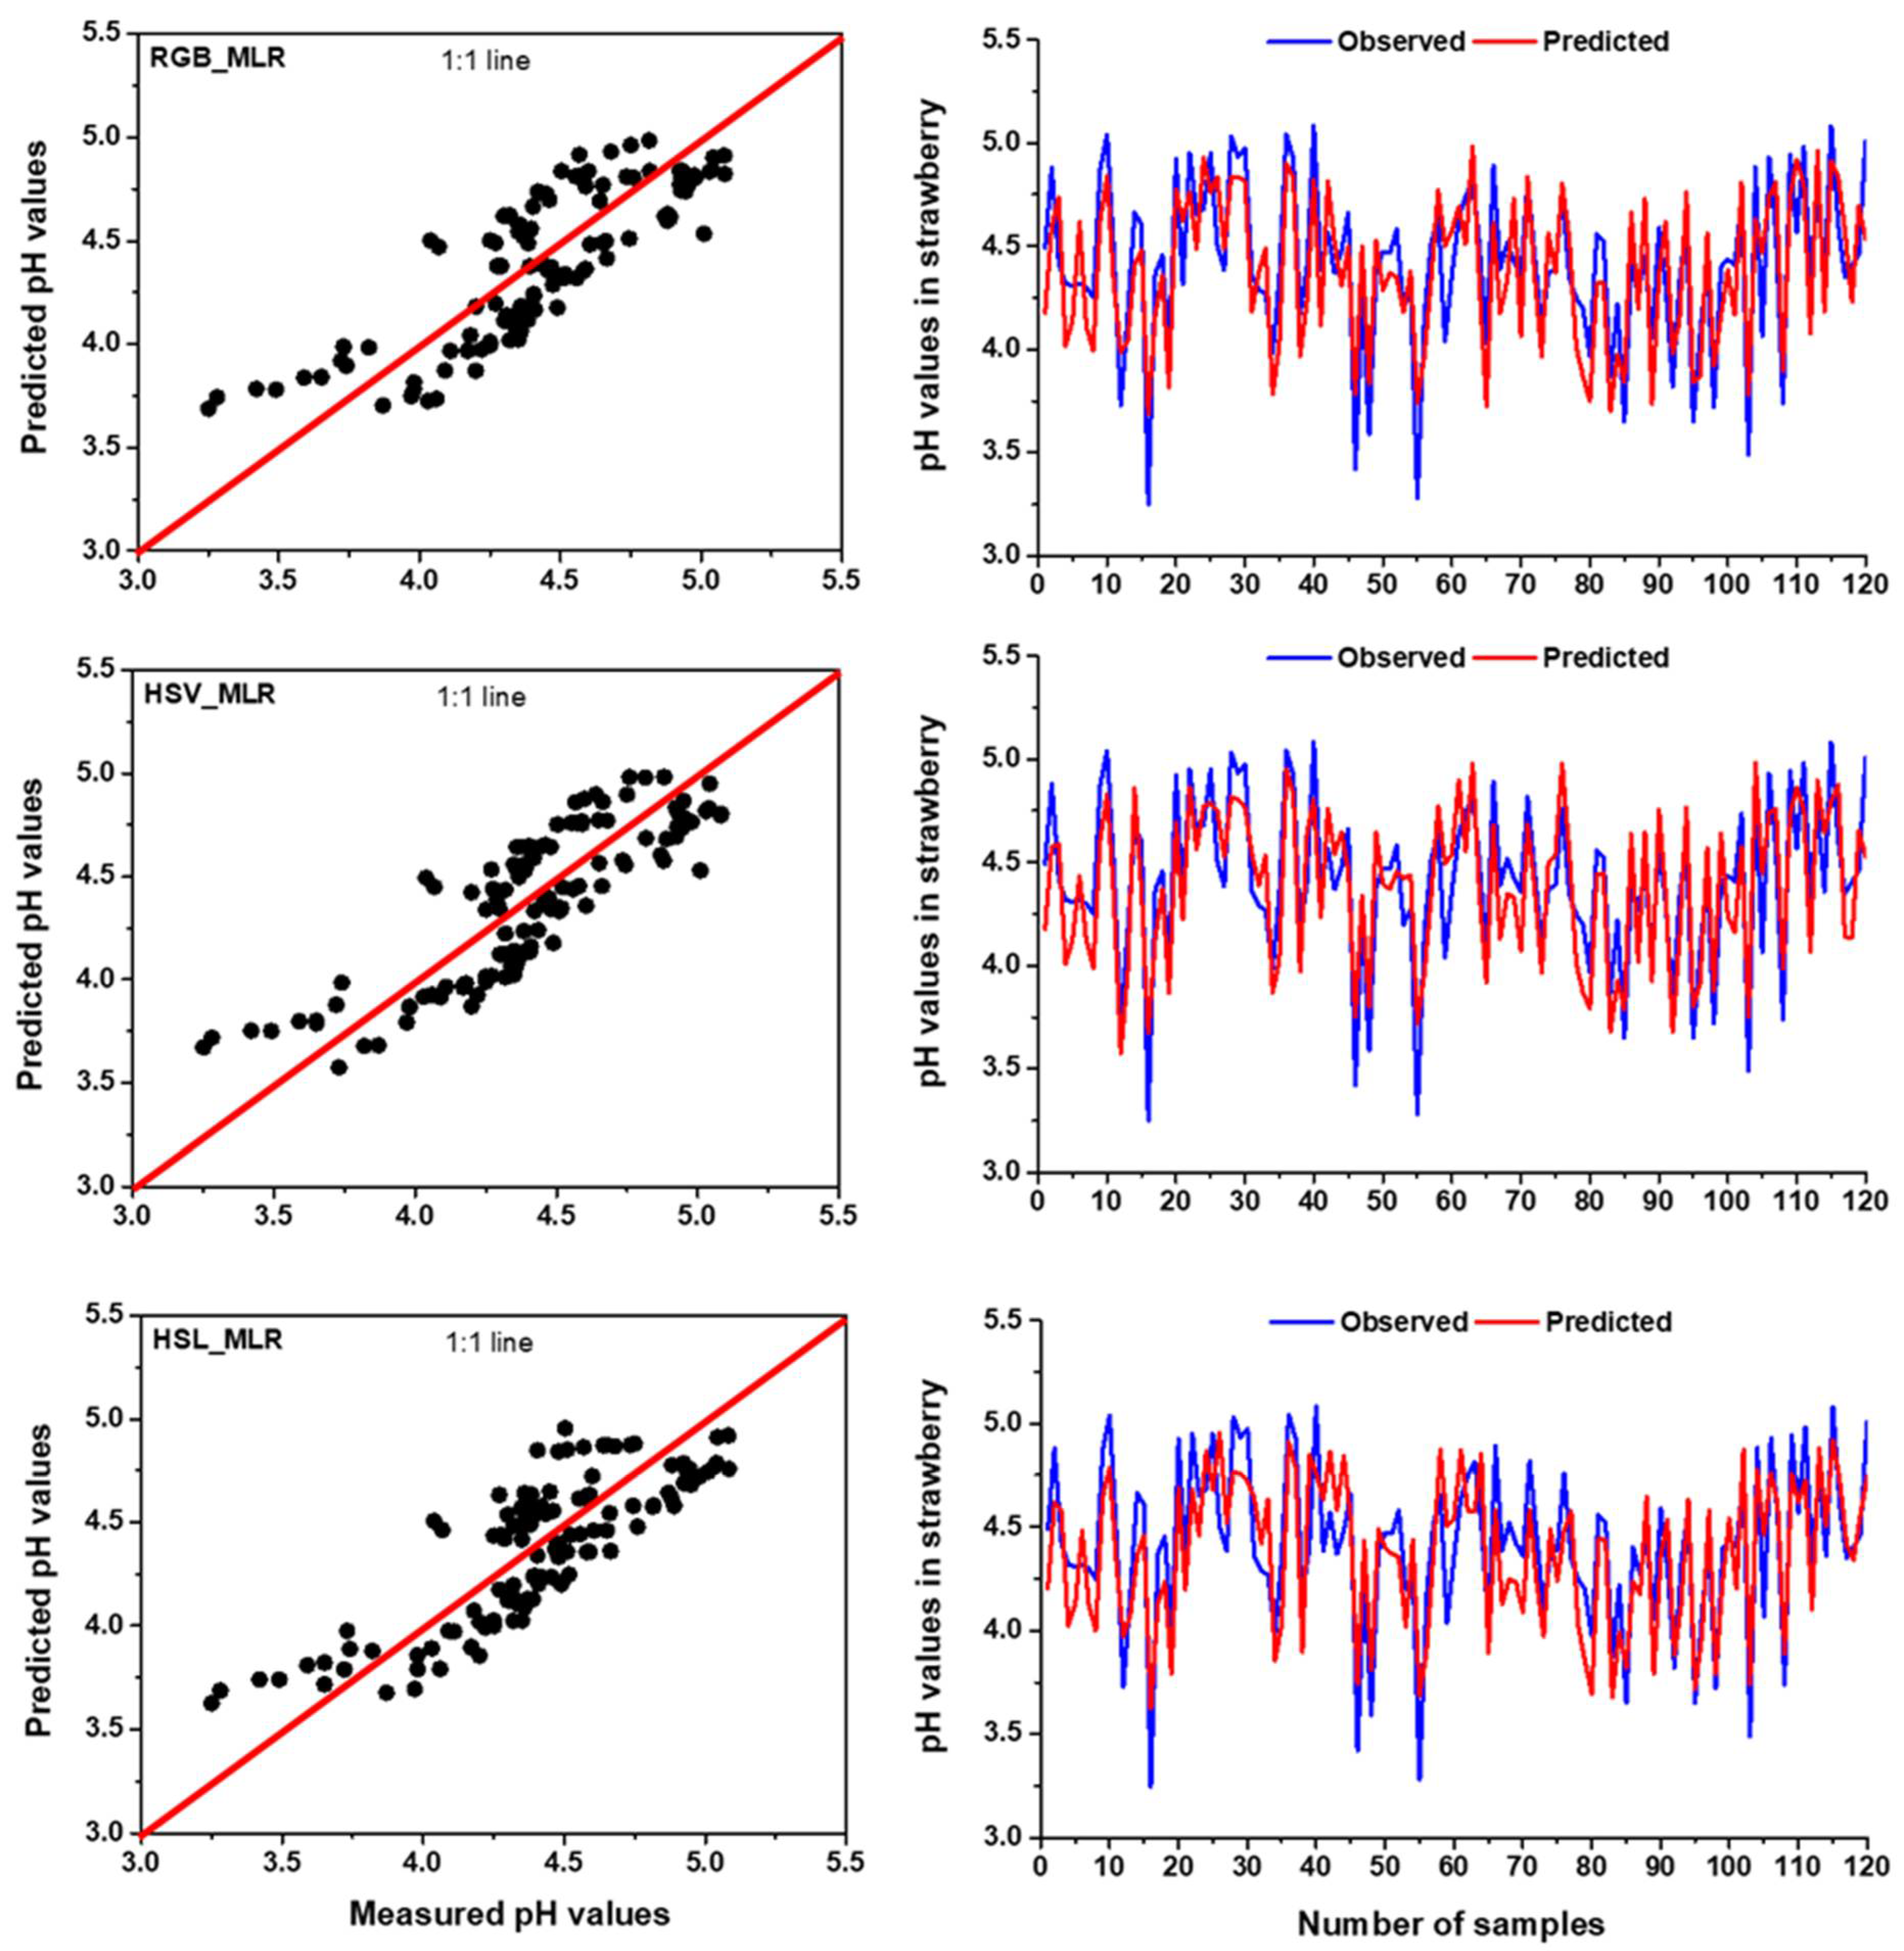
3.4. MLR Model Performance for TSS and pH Prediction

The existence of linear relationships between dependent and independent variables is essential for developing regression-based models to predict outcomes [50]. A number of studies used simple linear models due to their simplicity of nature and easily interpretation of outcomes [42,52,76]. In the present study, we used a linear regression model, i.e., multiple linear regression (MLR) model, in predicting TSS and pH values. Channels of the three colour spaces, i.e., RGB, HSV and HSL, were used as input variables for developing the MLR model. The performances of MLR model to predict TSS and pH are shown in Table 5 and Table 6.
In terms of TSS prediction, the highest R2 was observed with 0.821 (training phase) and 0.763 (testing phase) for HSV colour space, indicating that the MLR model can explain a maximum of 82.1% and 76.3% of the variations in the measured and predicted data in training and testing period, respectively. However, the lowest R2 and the highest RMSE were found in training (R2 = 0.768 and RMSE = 0.532 °brix) and testing (R2 = 0.736 and 0.570 °brix) for RGB colour space (Table 5). Apart from the two-colour spaces, the MLR model also showed better performance for the HSL colour space in predicting TSS. The MLR model based on HSV colour space could predict TSS for training and testing stages with a 6.90% and 3.67% increase in R2 and a reduction of 12.97% and 5.26% in RMSE, respectively, compared to RGB based MLR model. Several studies predicted TSS of strawberries using different types of non-destructive techniques, with variable results [77,78,79]. Agulheiro-Santos et al. [79] established partial least squares regression (PLSR) based on near-infrared spectroscopy (NIRS) for TSS prediction of strawberries with determination of coefficients 0.669 and 0.520 in training and testing, respectively. A similar experiment was conducted by Shen et al. [77] and obtained a slightly better result in strawberry TSS prediction using partial least square discriminant analysis, with determination of coefficients 0.733 in testing. Though the performances of Vis-NIR spectroscopy were acceptable for the quantification of TSS, the main disadvantages of the technique are a lack of spatial information as well as expensive equipment required [80]. The observed and predicted datasets of TSS in RGB, HSV and HSL colour spaces for MLR model over the testing span were presented in scatter plots and time series graphs (Figure 6). Figure 6 illustrated that the observed and predicted values were fitted well and those were very close to the 1:1 line for HSV dataset compared to RGB and HSL, indicating MLR model had high accuracy in the estimation of TSS for HSV colour space.
In terms of pH prediction, the highest R2 was found for HSV colour space in MLR model during the training (R2 = 0.742) and testing (R2 = 0.684), demonstrating that the MLR model can describe a maximum of 74.2% and 68.4% of the variations in the measured and predicted data in training and testing period, respectively. Among the three colour spaces, RGB colour space in MLR model obtained the lowest R2 and the highest RMSE in training (R2 = 0.705 and RMSE = 0.188) and testing (R2 = 0.643 and RMSE = 0.229) in predicting pH (Table 6). Aside from the two-colour spaces, the MLR model also performed better in predicting pH for the HSL colour space. When compared to the RGB-based MLR model, the HSV-based MLR model could predict pH in the training and testing stages with a 5.25% and 6.38% increase in R2 and a reduction of 3.20% and 6.11% in RMSE, respectively. Based on the outcomes of the model, it can be concluded that MLR model can predict pH using the colour features of strawberries. Guo et al. [78] related the colour feature to strawberry pH and showed that strawberries with different colour features represent the different levels of pH, demonstrating that colour features can provide supplementary, diverse and potentially effective information for determining pH in strawberries. Similar findings were also observed in fruits from other strawberry cultivars [6,17]. Figure 7 shows that the observed data were fitted well with the predicted data and the values were very close to the 1:1 line, representing the MLR model with HSV obtained better accuracy compared to RGB and HSL colour spaces in predicting pH.

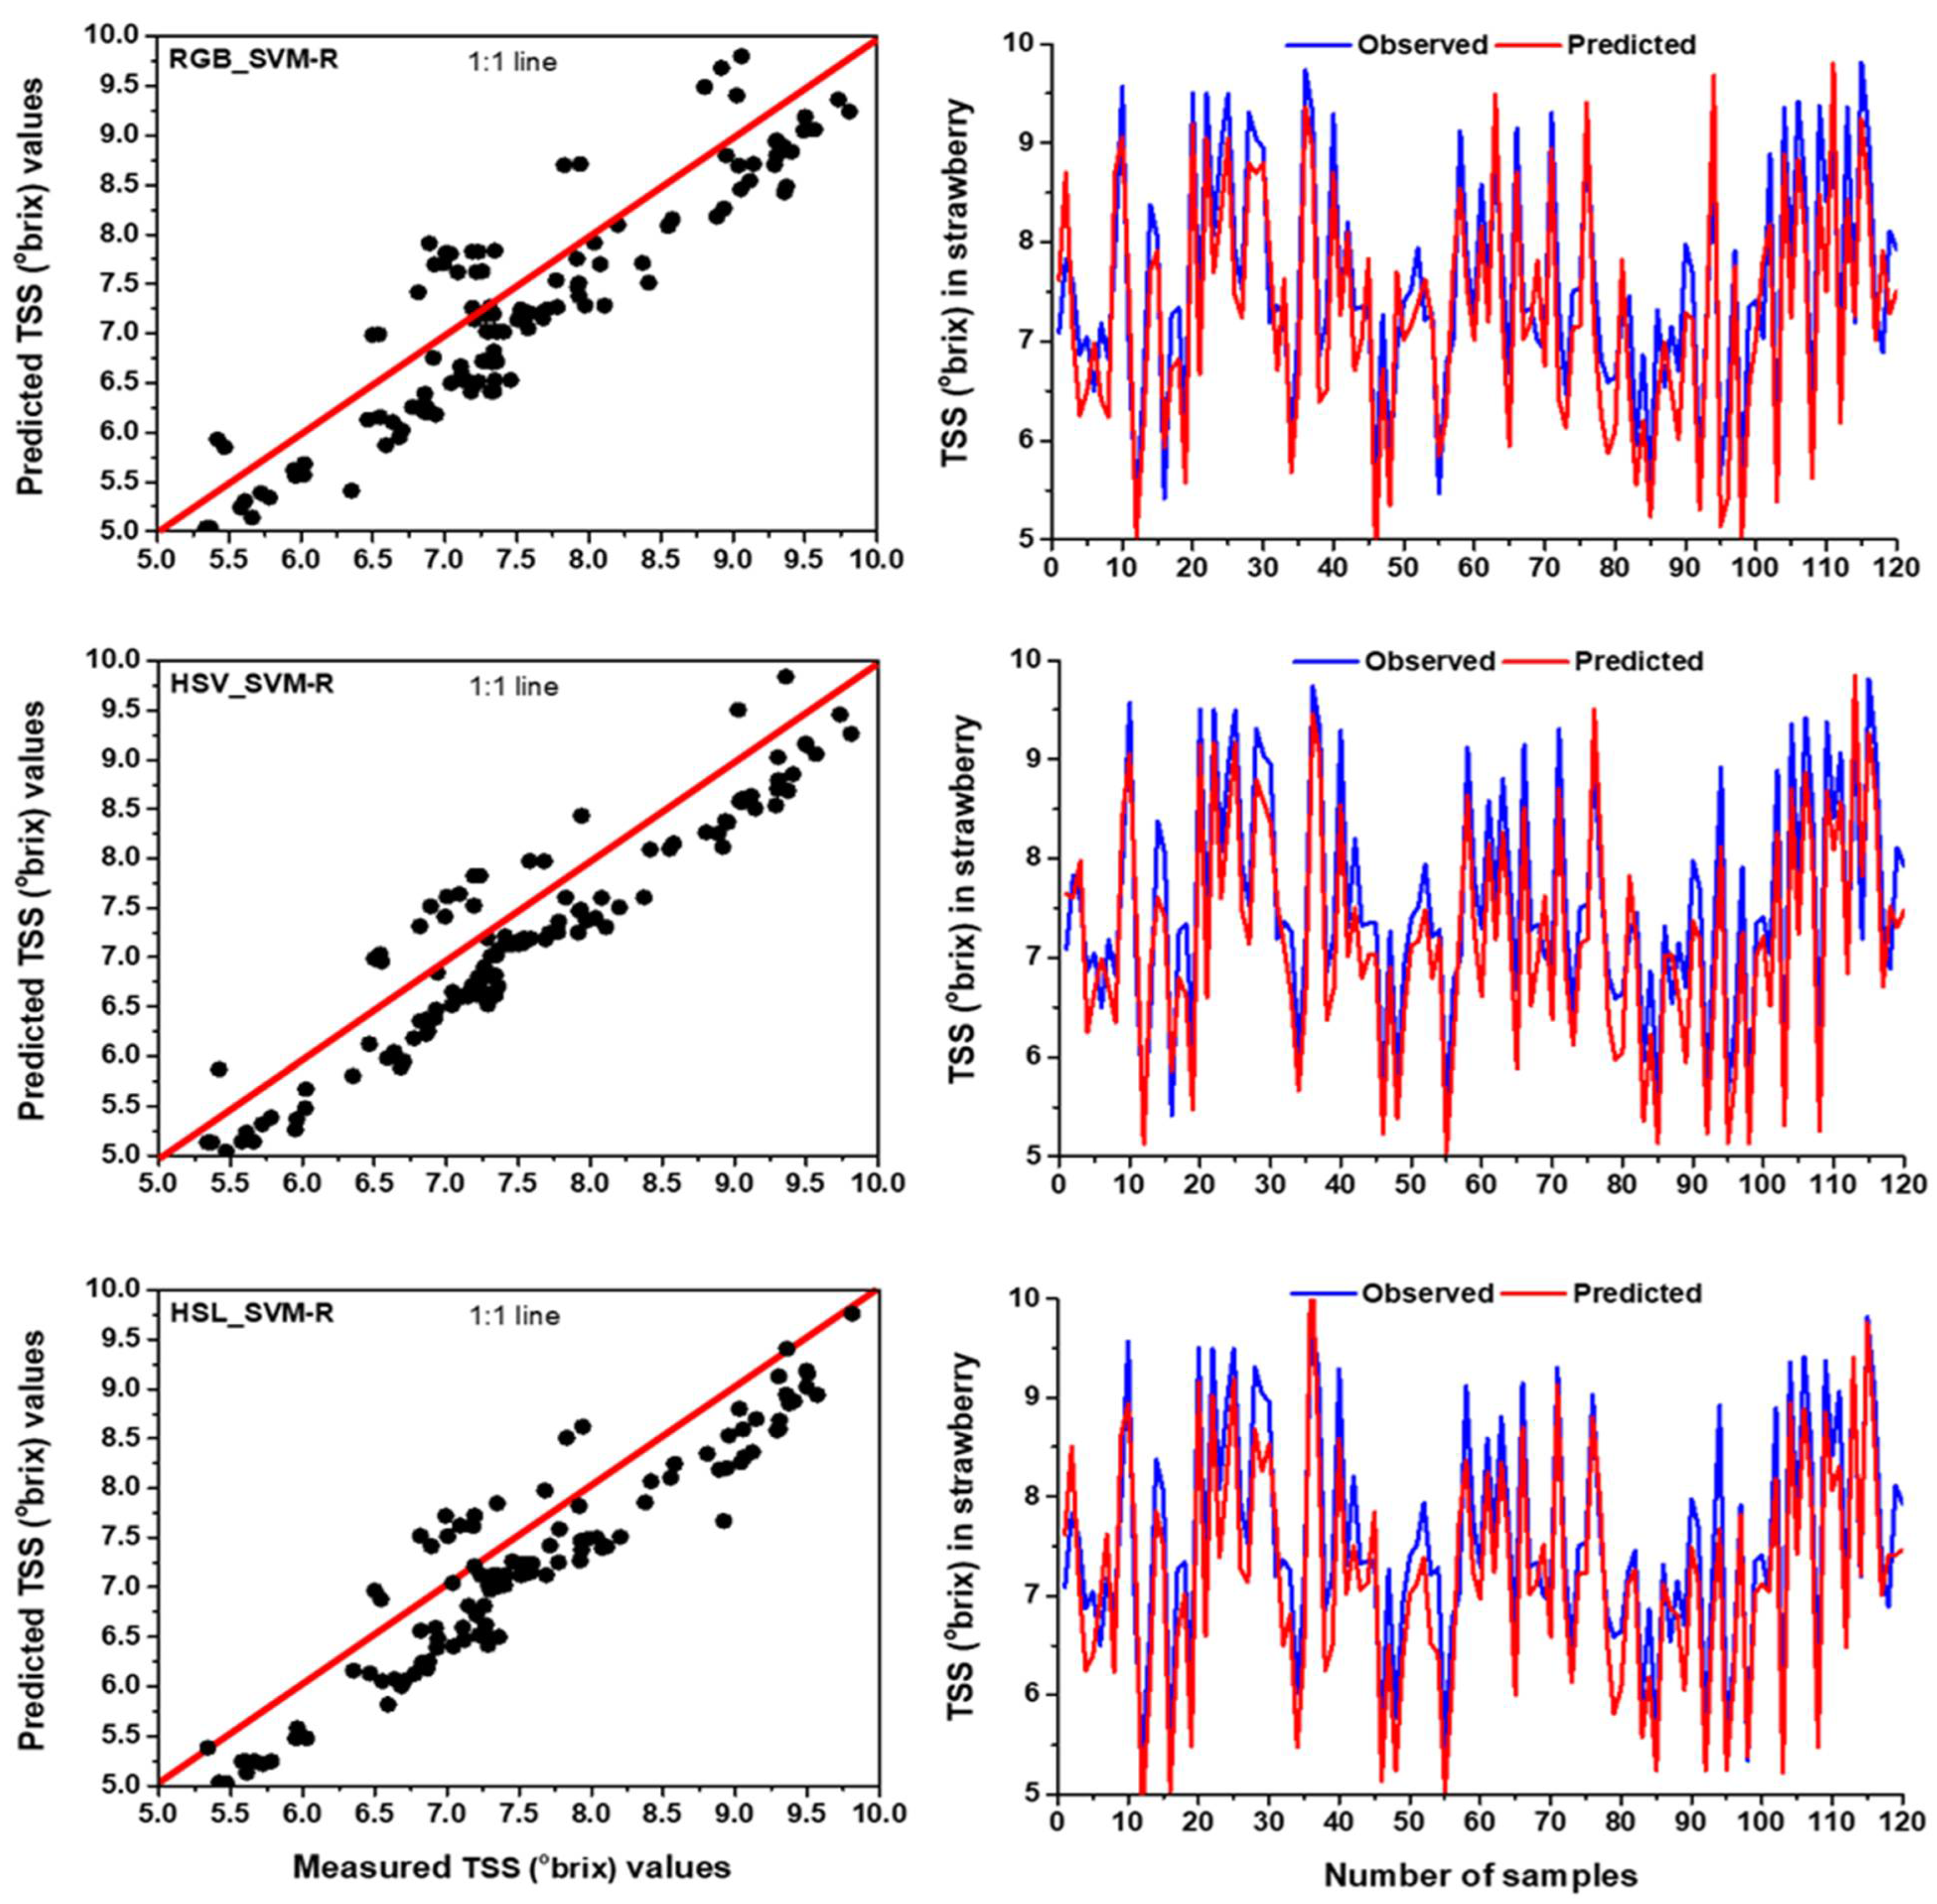
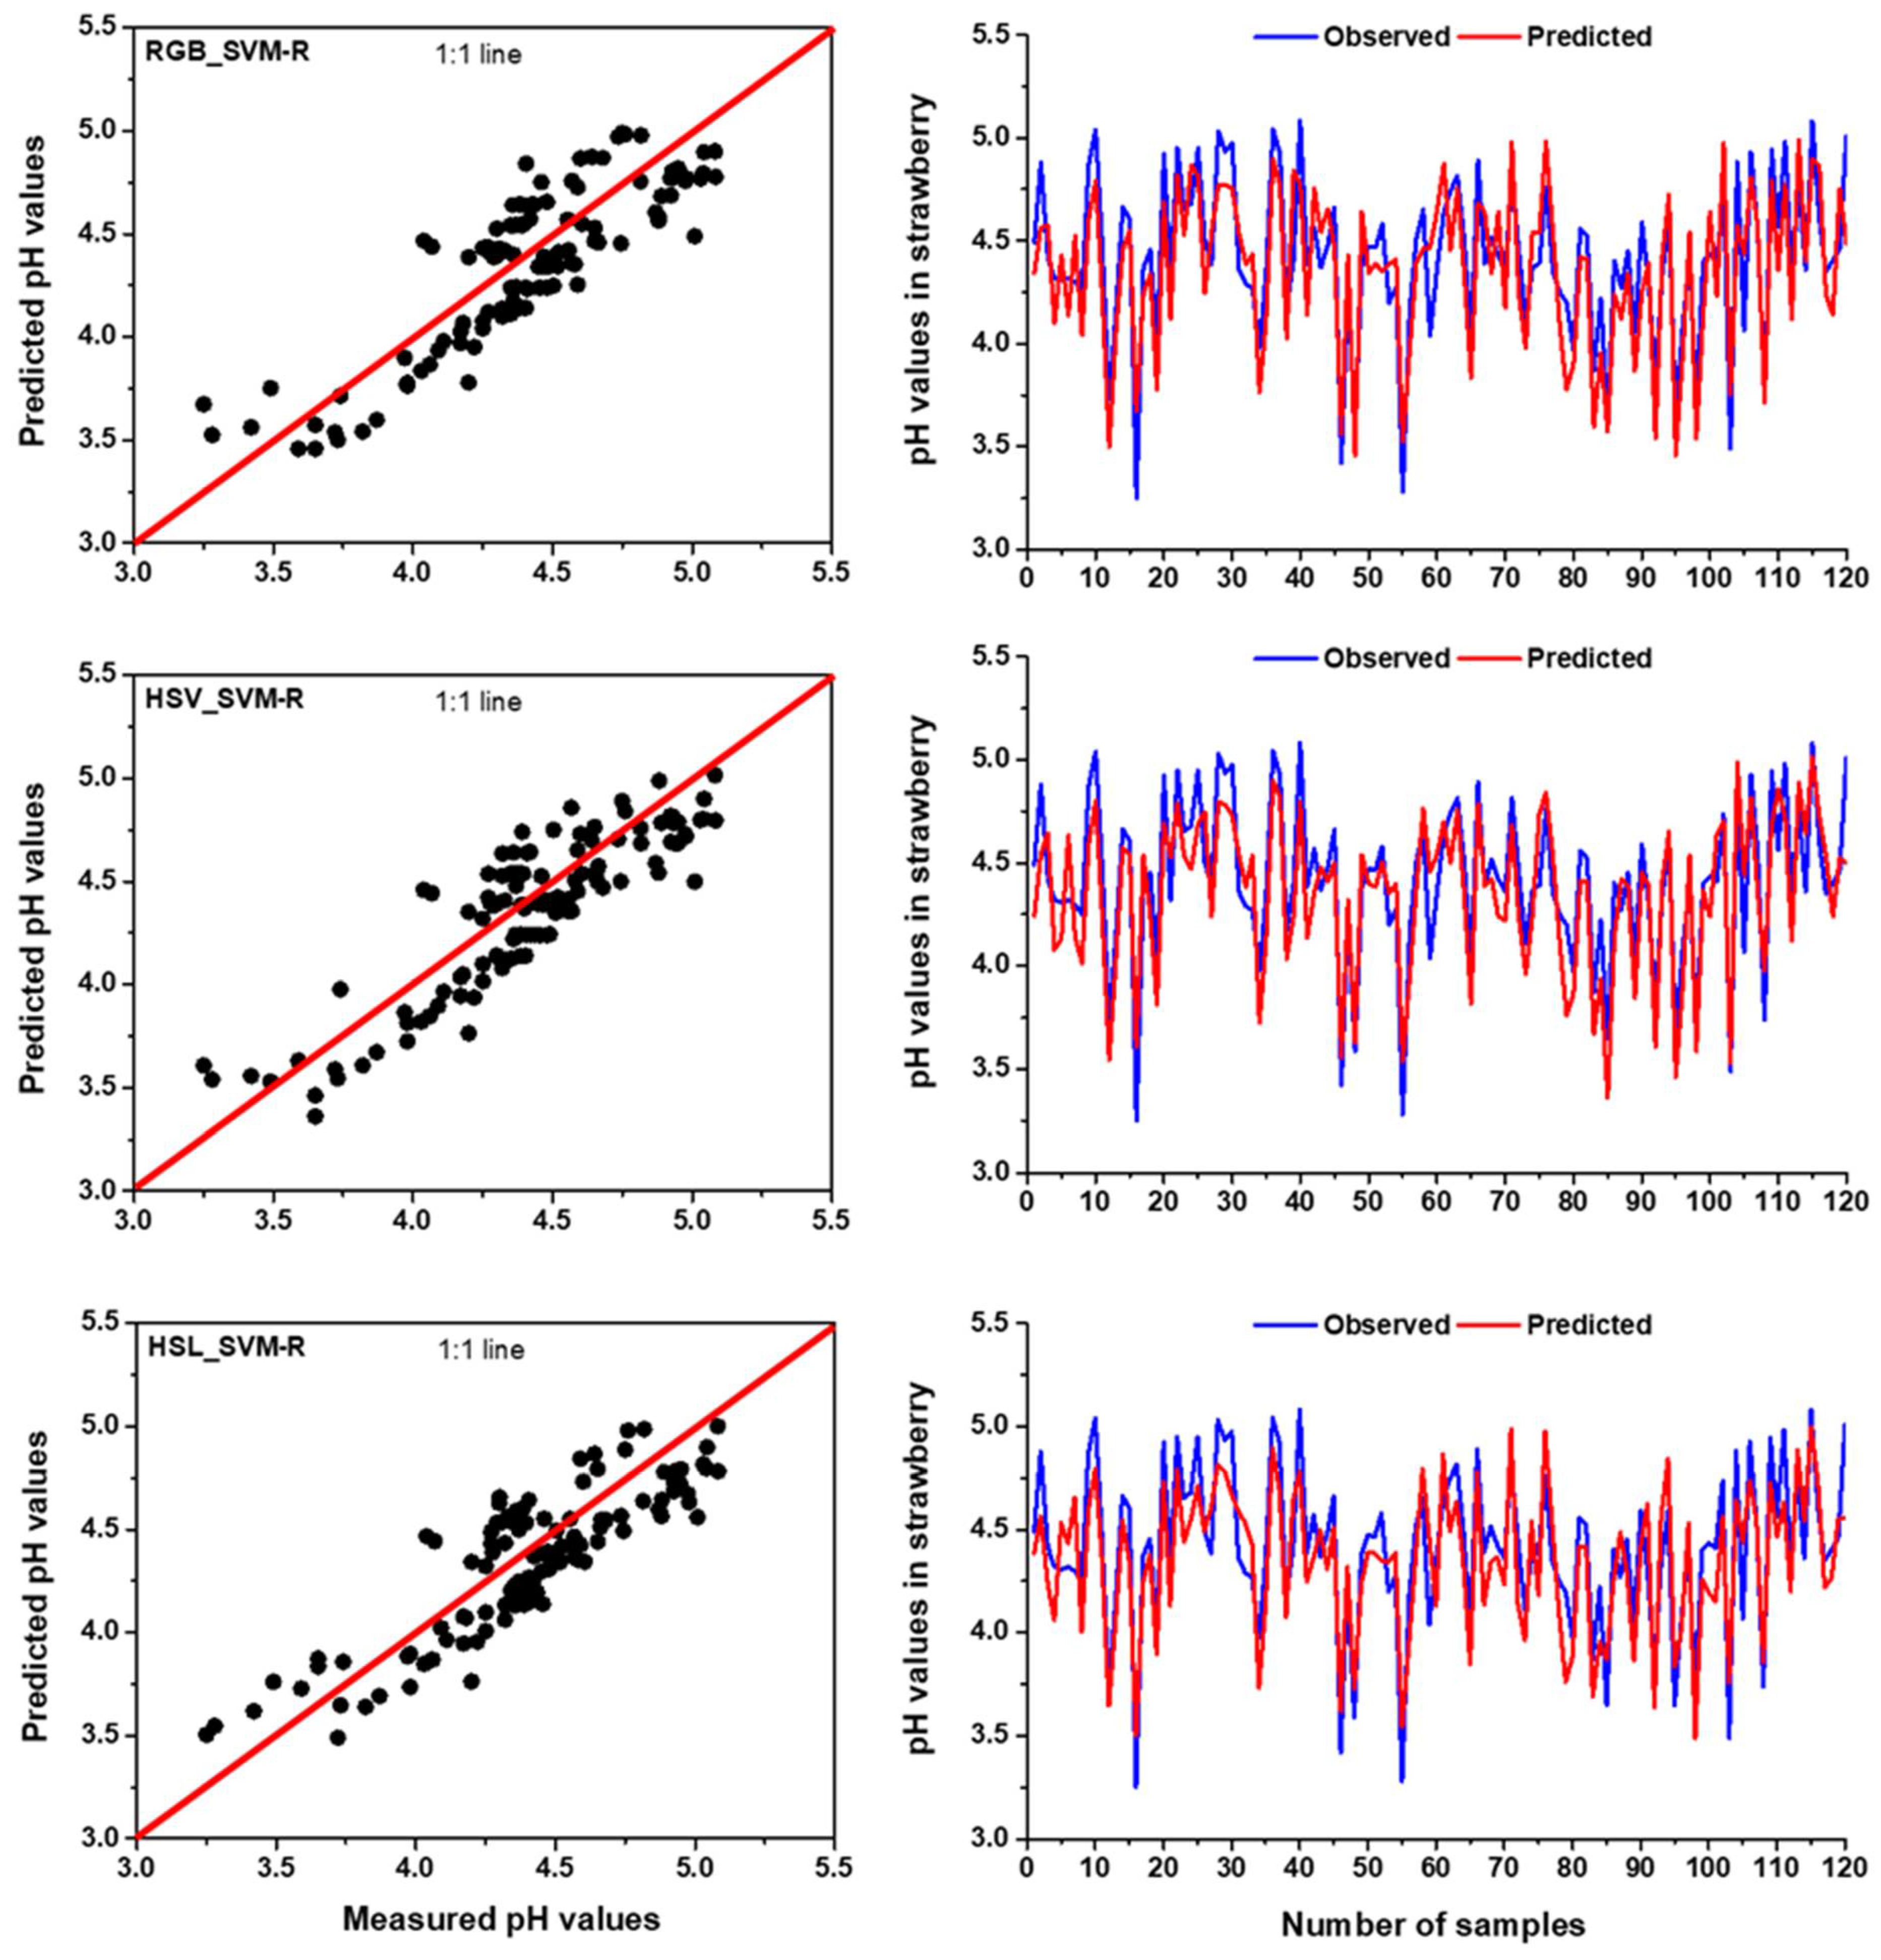
3.5. SVM-R Model Performance for TSS and pH Prediction

The support vector machine regression (SVM-R) can fit well for non-linear data and results in better calibration and prediction with high R2 and low RMSE [23]. Since MLR is a linear based regression model, a non-linear regression model, i.e., SVM-R model, was carried out for prediction of TSS and pH of strawberries in the present study. The SVM-R model provided high accuracy for its non-linear approach, and several studies have used this technique to predict TSS and pH for a number of fruits [23,81]. Like MLR, SVM-R was also applied to the same data to compare the TSS and pH predictability of the three colour spaces.
Based on the two statistical parameters, i.e., R2 and RMSE, the result of the current study showed that the SVM-R with HSV colour space provided better performance compared to SVM-R based on RGB and HSL colour space. Measured and predicted parameters of SVM-R models including R2 and RMSE for each colour space for TSS prediction are presented in Table 5. According to the SVM-R outcomes, the highest R2 (training = 0.841 and testing = 0.792) and the lowest RMSE (training = 0.437 and testing = 0.506) values were found for HSV colour space. This finding stated that the SVM-R model with HSV could explain a maximum 84.1% in training and 79.2% in testing period which can effectively predict the TSS of strawberries. On the other hand, the worst performance was found for the RGB-based SVM-R model (Table 5). In addition, the HSV-based SVM-R model could predict TSS in training and testing stages with a 2.70% and 5.46% increase in R2 and a 9.18 % and 8.67% reduction in RMSE, respectively compared to the RGB-based SVM-R model. Similar results were reported by Hernanz et al. [82], that applied multivariate statistical methods with different colour spaces to single out the colour features to correlate them with the TSS content. Some previous studies were conducted to compare the performance of RGB, HSV and HSL colour segmentation methods in object detection [83,84]. Mohd Ali et al. [83] stated that HSV colour algorithm achieved a better detection accuracy in objects compared to RGB colour space. Moreover, the predicted and measured data of TSS obtained from SVM-R model with RGB, HSV and HSL colour spaces were presented in scatter plots and time series graphs (Figure 8). According to Figure 8, the observed and predicted data were well-fitted and the values were very close to the 1:1 line for HSV, demonstrating SVM-R model had higher accuracy in the prediction of TSS for HSV compared to RGB and HSL colour space.
As with TSS prediction, pH prediction also followed similar results for the input parameters. A reasonable fit is observed for pH, using the SVM-R model with HSV colour space, with R2 of 0.788 and 0.726, and RMSE of 0.165 and 0.201 in training and testing period, respectively. The prediction performance of the pH of the collected strawberries with RGB colour feature was slightly lower compared to HSV and HSL based SVM-R model. The comparison evaluation metrics showed that the HSV based SVM-R model can predict a 5.35% and 6.37% increase in R2 and a reduction of 5.71% and 6.07% in RMSE in training and testing stages, respectively compared to RGB based SVM-R model. Moreover, the SVM-R model can explain a maximum of 78.8% and 72.6% of the variations in measured and predicted data in training and testing stages, respectively.
This is in concurrence with the results reported by Weng et al. [85], showing the determination coefficients: R2 = 0.744 in training and R2 = 0.660 in testing when the SVM with colour and textural features of strawberries were applied in pH prediction. Moreover, multivariate methods with spectra data, colour, texture and morphology of analytes extracted from the hyperspectral images were widely applied for pH determination [85]. Hu et al. [86] developed an advanced level hyperspectral imaging system for predicting internal properties of strawberries such as TSS and pH using a random frog based algorithm. Though these techniques sometimes achieved high performance in the prediction of fruit qualities, the main disadvantages of those non-destructive methods are highly expensive equipment needs to be used and the procedures are very complex which is sometimes inconceivable for farmhands for fruits quality detection and assessment. In the current study, we used SVM-R model in predicting pH where the observed and predicted pH data were fitted well and the values were very close to the 1:1 line for HSV colour space, suggesting the model had a high accuracy value (Figure 9).

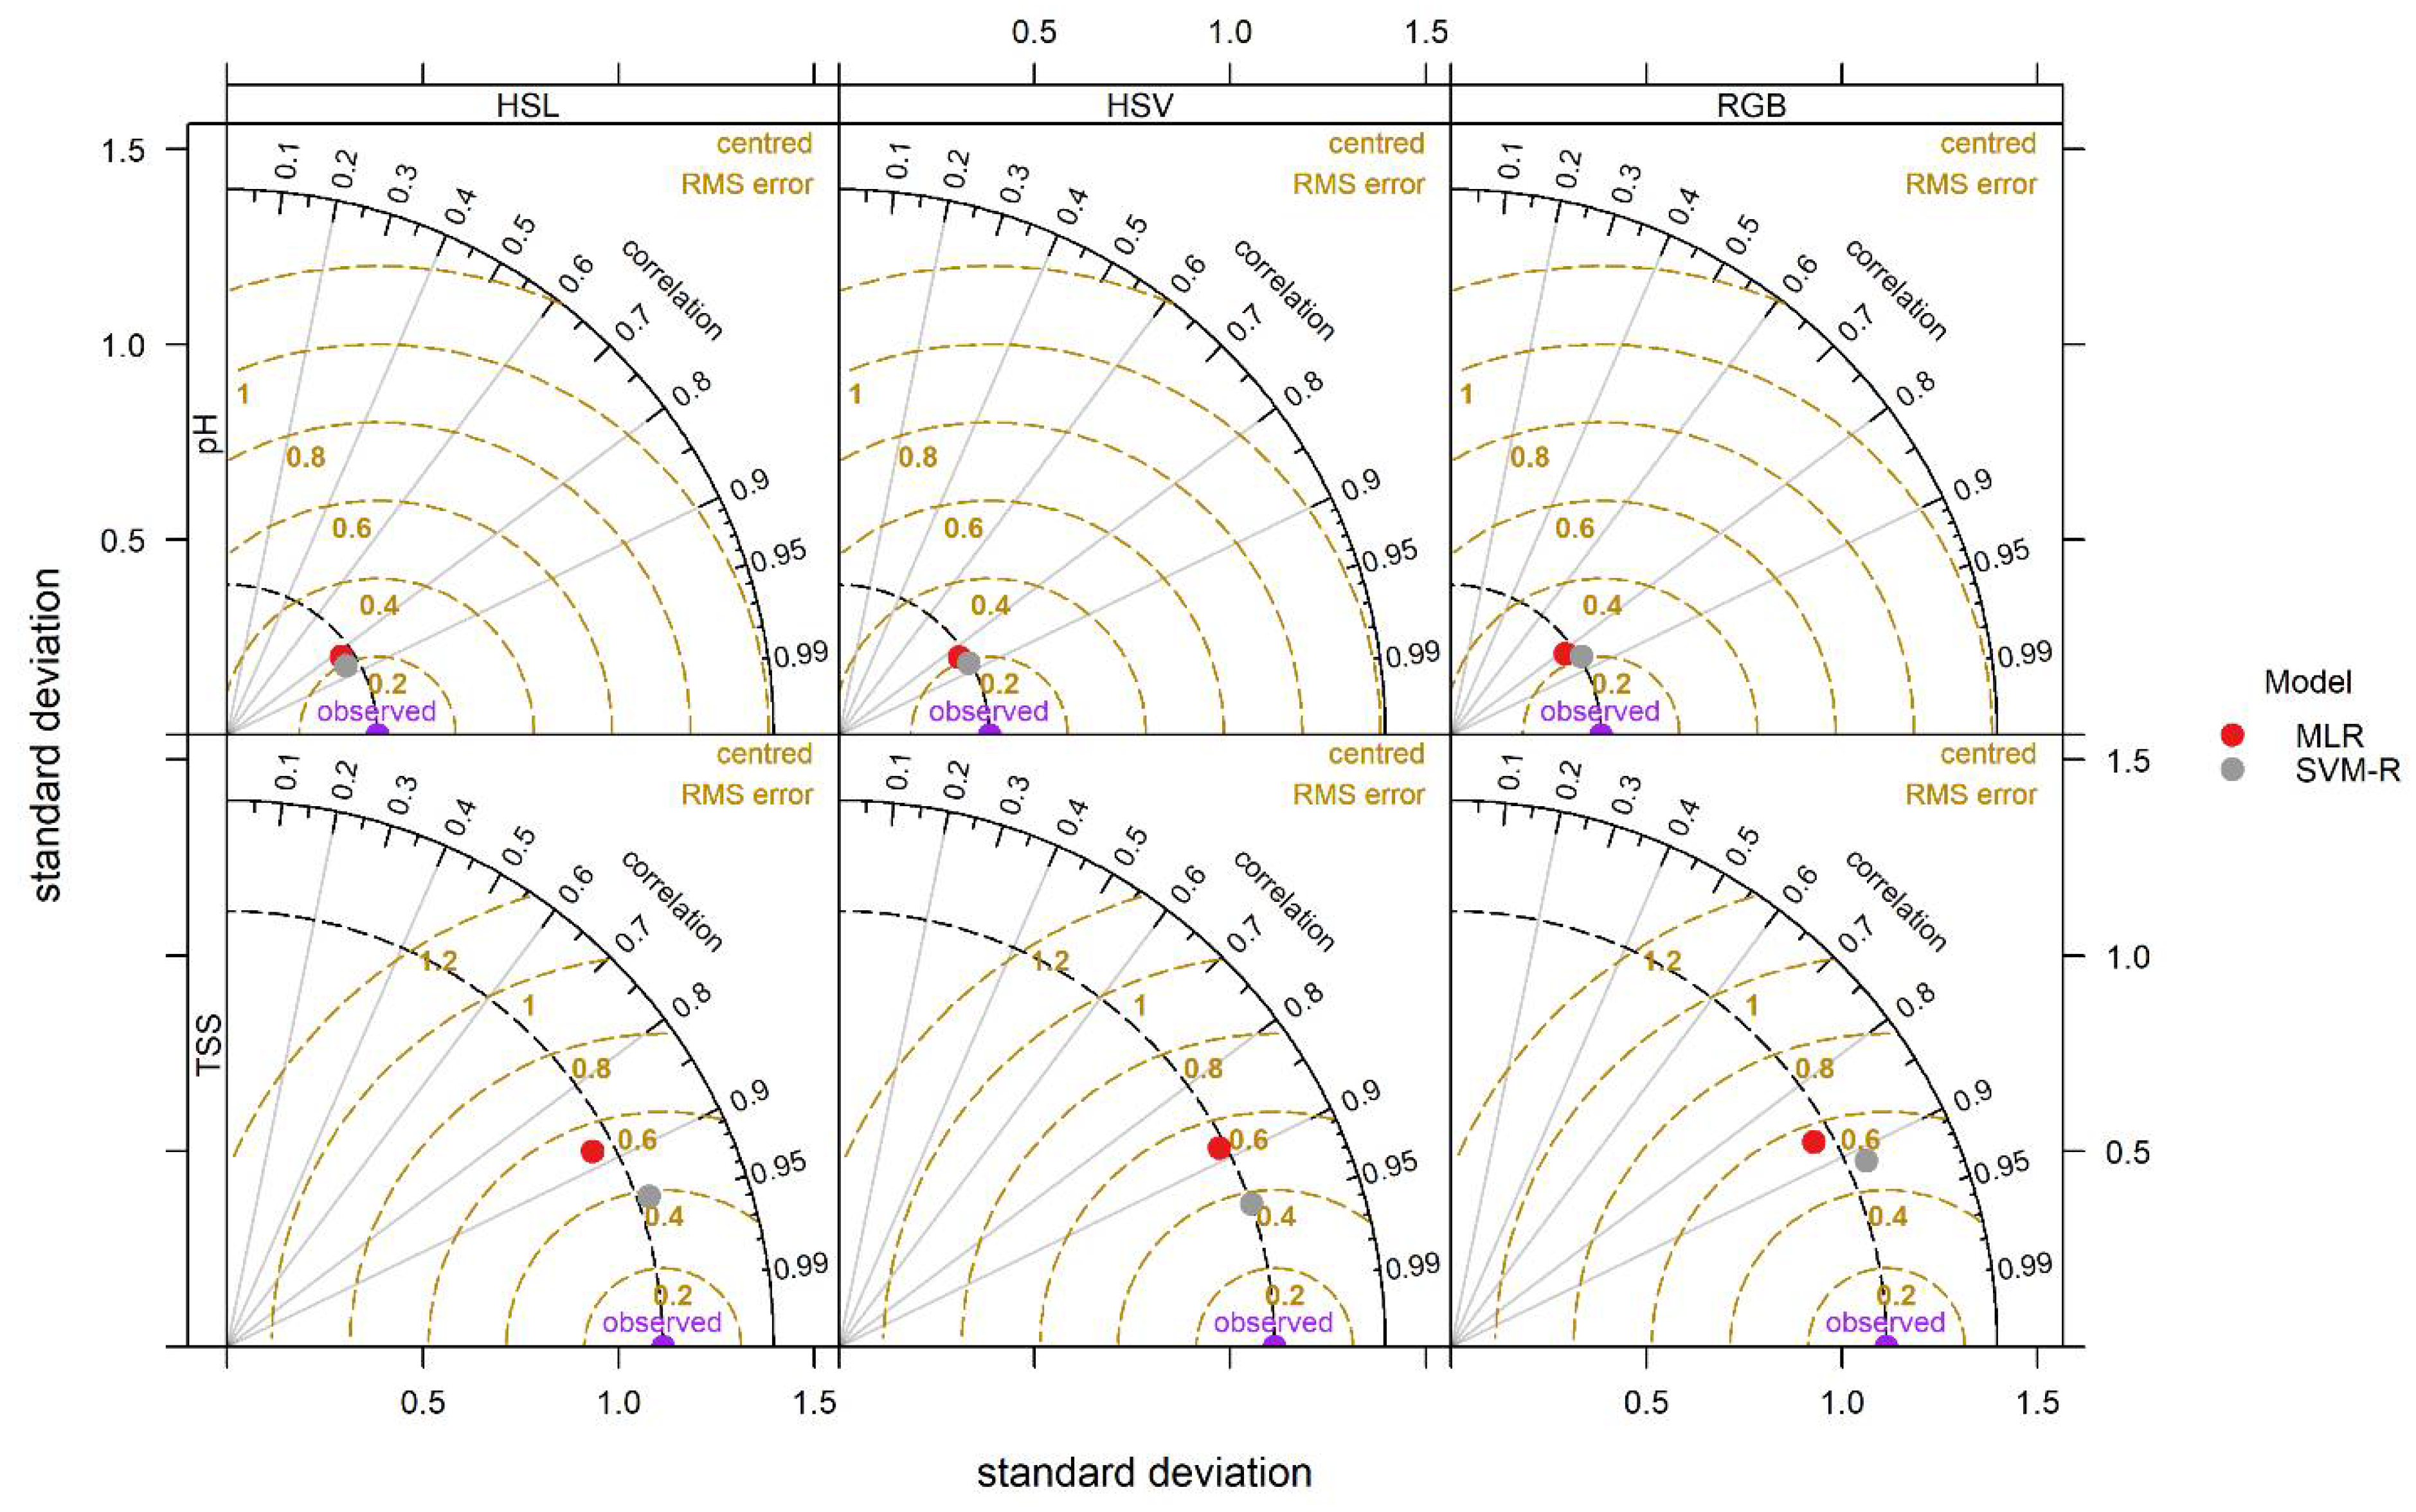
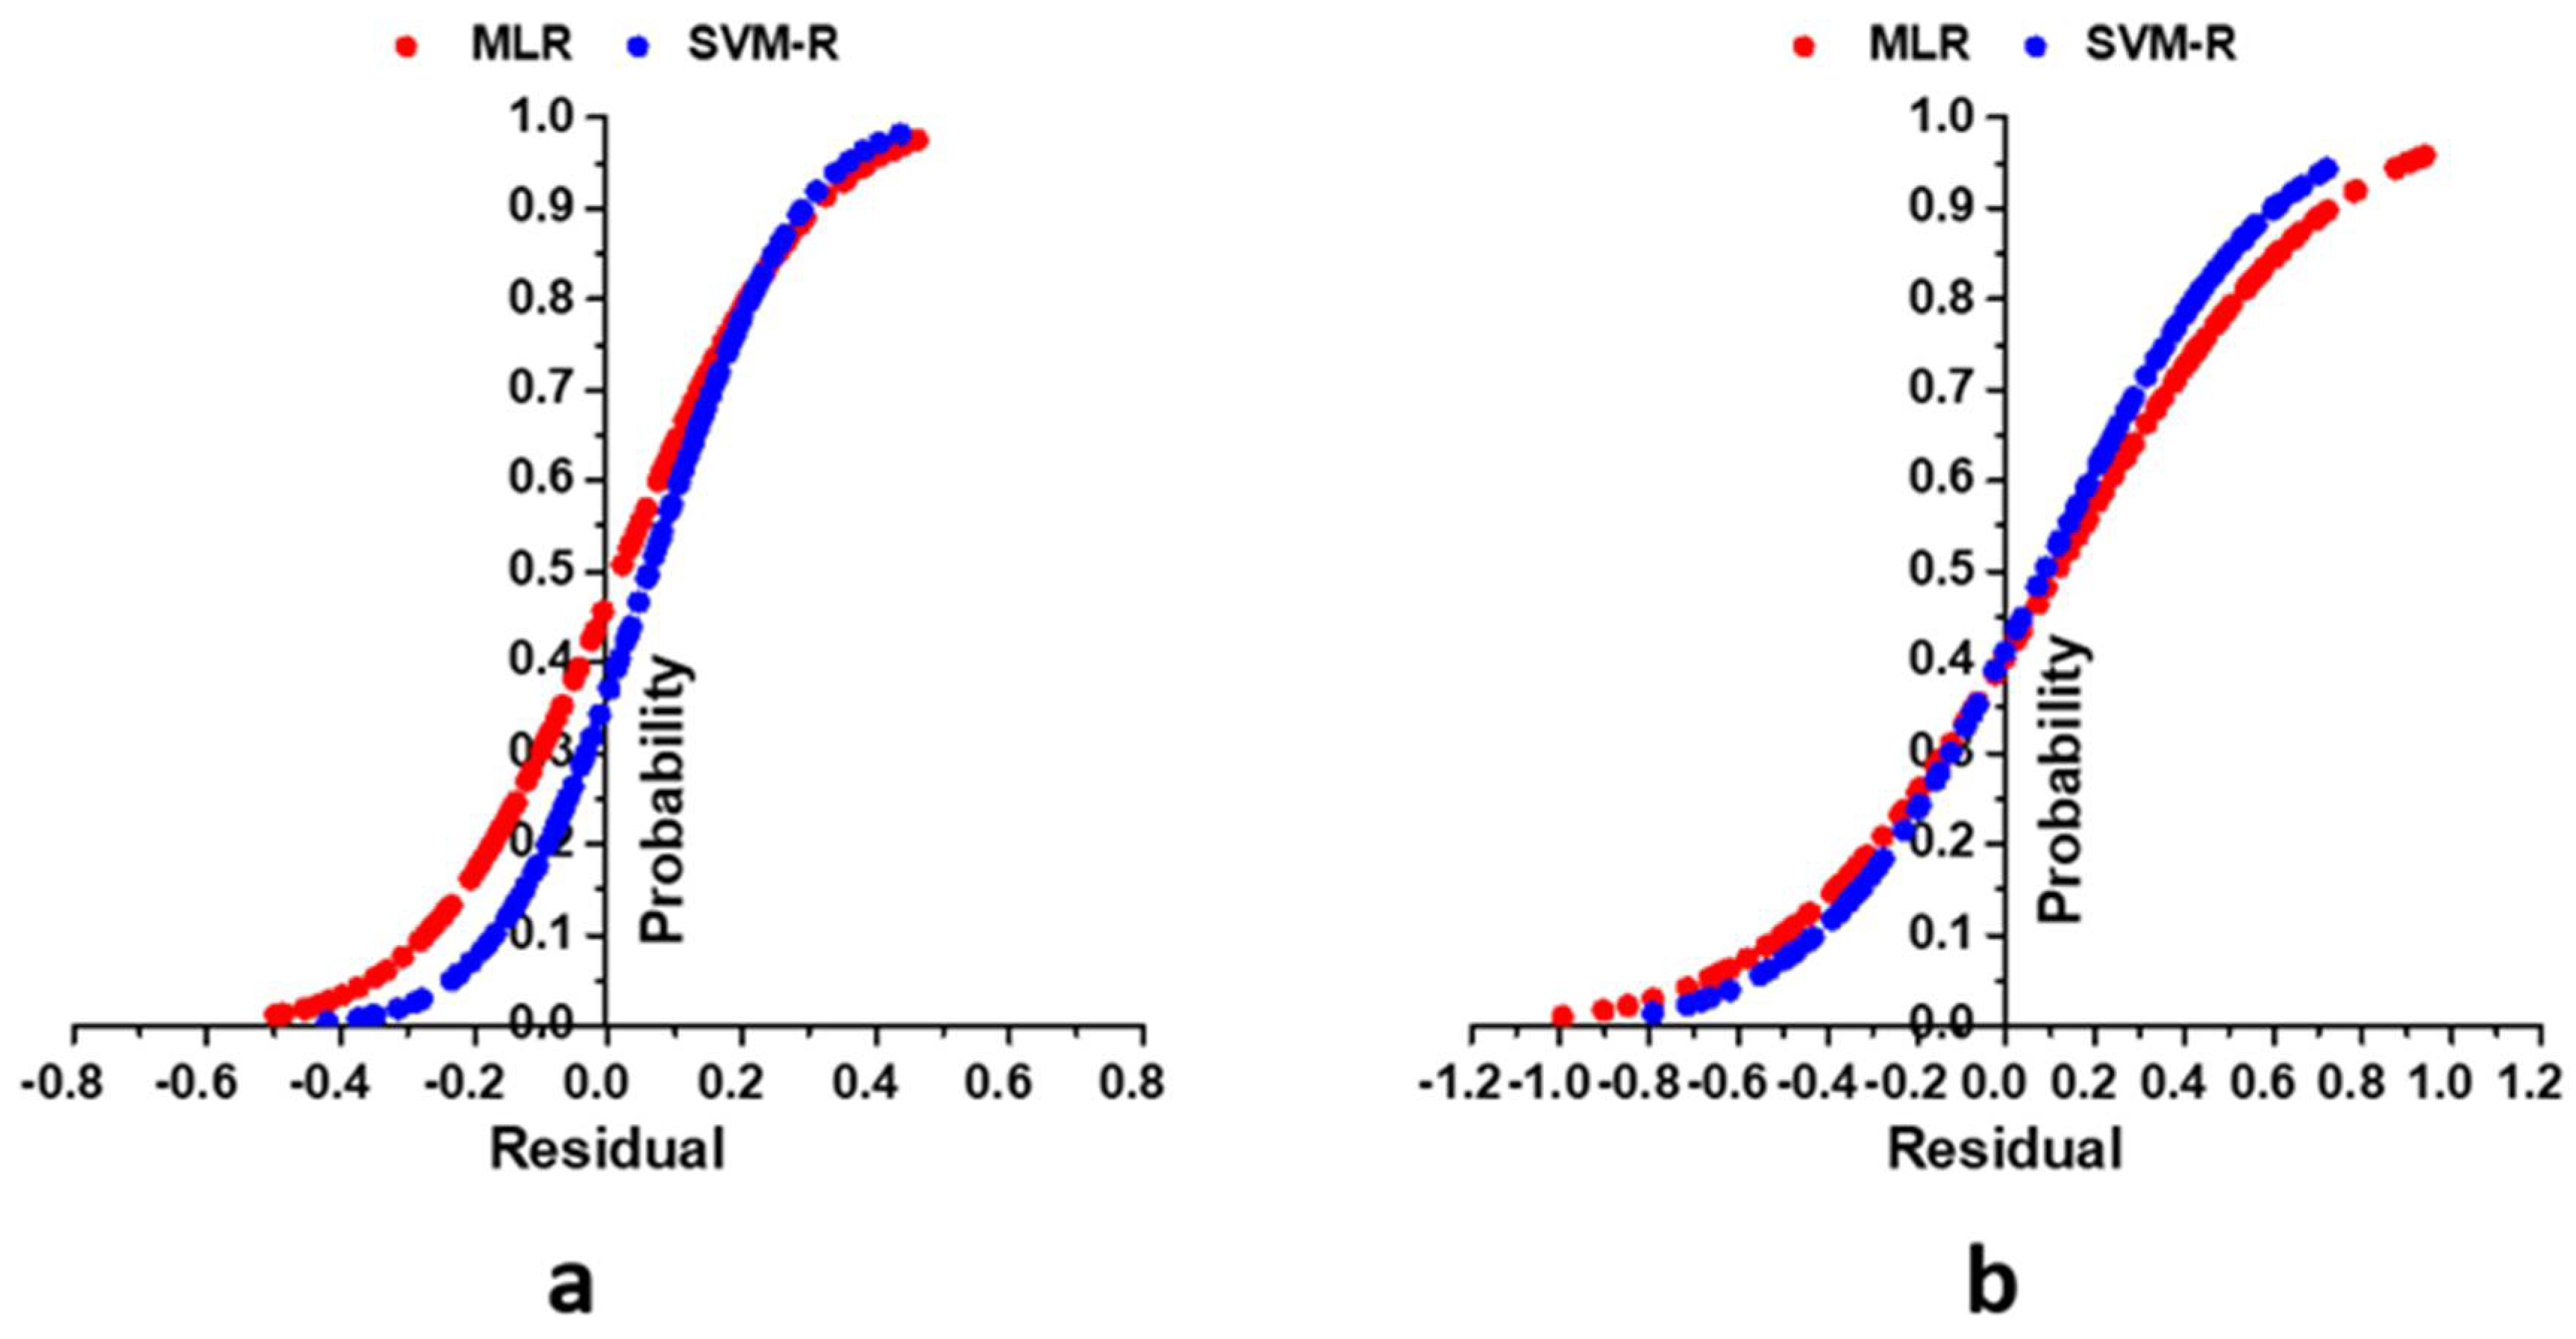
3.6. Comparison between MLR and SVM-R Model’s Performance with Colour Spaces

When comparing all the developed machine learning models based on MLR and SVM-R algorithms with different colour spaces (RGB, HSV and HSL), the HSV colour space was the best for both MLR and SVM-R models for the prediction of TSS and pH values. However, we also observed that the HSL colour space also achieved a relatively good prediction accuracy for TSS and pH values. This finding indicated that peel colour changes in Seolhyang strawberries had a certain relationship with the internal quality parameters of fruit such as pH and TSS. Nunes et al. [11] demonstrated that the colour development of ‘Oso Grande’ strawberries increased during the ripening which had a direct relationship to internal quality parameters because all quality parameters are highly influenced by the ripening time. Similar changes were also observed in ‘Sweet Charlie’ strawberry cultivar [87]. Moreover, in the image processing technique, it is a critical issue to select a suitable colour space from a large variety of available colour spaces that can produce the best prediction result for models. With a comparison of the prediction among RGB, HSV and HSL colour spaces, we found that HSV was better than RGB and HSL regardless of which model was used. One of the main reasons behind this may be three channels, i.e., Hue, Saturation and Value, in HSV are approximately orthogonal in shape that can reduce more the influence of other channel changes and avoid the channel overlapping compared to RGB and HSL colour spaces [88]. This may be one of the main reasons why most of the studies used HSV colour space for internal quality assessment in fruit and object detection methods [83,84,88].
In addition, SVM-R models had a little better performance than the MLR in TSS and pH prediction (Figure 10). Based on the statistical evaluation parameters (R2 and RMSE), the findings of the study showed that the selected SVM-R model based on HSV colour space could predict TSS with 2.43% and 3.80% increase in R2 and a reduction of 5.62% and 6.30% in RMSE in training and testing stages, respectively compared to HSV based MLR model. In terms of pH prediction, SVM-R model with HSV could predict with 6.20% and 6.14% increase in R2 and a reduction of 9.34% and 6.51% in RMSE in training and testing stages, respectively, compared to MLR model with HSV colour space. This reason might be a certain portion of the relationship between input and predicted parameters existed in a non-linear relationship and the non-linear relation could contribute to the better performance of the SVM-R model. Fernández-Ahumada et al. [85] noted that the higher ability of the SVM-R model compared with the MLR model due to capturing a strong nonlinearity and a large number of data. Moreover, results obtained from the cumulative distribution function revealed that the SVM-R model obtained a residual value of 77.5% of the actual and predicted data of TSS between the ranges of −0.5 to 0.5, whereas it was 61.67% for the MLR model in the same range (Figure 11b). Like TSS, the SVM-R model has a residual of 76.67% of the actual and predicted data for pH between the ranges of −0.2 to 0.2 whereas, it was 60.83% for MLR model. In addition, Figure 11 illustrated a non-linear relationship between the predicted (TSS and pH) and measured variables (channels in RGB, HSV and HSL colour space).

3.7. Sensitivity Analysis of Colour Spaces

To find out the effect of each channel, i.e., Hue, Saturation and Value, of HSV colour spaces, a sensitivity test was carried out for the SVM-R and MLR models. The ability of SVM-R and MLR models little decreased when they were run without the S value during the pH prediction (Figure 12). As shown in Figure 12, without the S as an input value, SVM-R and MLR obtained the lowest R2 (0.717 and 0.661) and the highest RMSE (0.196 and 0.223) in the testing stage, respectively. Therefore, it can be said that S was the most influential input variable in predicting pH, followed by V and H, respectively. Like pH, sensitivity test was conducted in TSS prediction using the SVM-R and MLR model with HSV colour space. The findings of the sensitivity also showed that excluding S, the performance of both models decreased, indicating S was the most important channel in HSV colour space in predicting TSS. According to the findings of the sensitivity analysis, it can be concluded that the S and H were the most and least influential factors, corresponding to predict TSS and pH for both models. Some published articles also reported similar results on the importance of colour channels in object detection [89,90].

4. Conclusions

The study was carried out to evaluate the application of machine learning models for the TSS and pH prediction of strawberries using image processing technique. The results showed that biometrical characteristics, i.e., length, diameters, weight of strawberries, TSS and pH, and channels of each colour space changed significantly at different levels from the white to dark red stage. The channels of RGB, HSV and HSL colour spaces were used as input variables for TSS and pH prediction models and the performance of both models were evaluated using two statistical parameters (R2 and RMSE). The results indicated that all SVM-R models performed slightly better than MLR models for the prediction of TSS and pH values, demonstrating a non-linear relationship between the explanatory and response variables. Simultaneously, the results also showed that the HSV was the best one among the three colour spaces for the developed MLR and SVM-R models. The HSV based SVM-R model could explain a maximum of 84.1% and 79.2% for TSS and 78.8% and 72.6% for pH of the variations in measured and predicted data in the training and testing stages, respectively. Moreover, sensitivity analysis showed that the S (Saturation) and H (Hue) were the most and least influential channels in HSV colour space to predict TSS and pH values. In future, more samples with different strawberry cultivars may need to be studied to further measure whether the SVM-R models performed better than other regression-based models, such as Random Forest, for the prediction of more internal qualities of fruits. The present study suggested that this new approach is a promising non-destructive, time-efficient and less expensive equipment required for rapid monitoring; therefore, our next research will focus on its application in the real field.

Author Contributions

Conceived and designed the experiment, performed the experiment, analysed and interpreted the data, wrote the paper, J.K.B.; supervised, reviewed and edited the article H.T.K.; B.G.K.M. and B.P., helped during the experimental setup and data collection period; and project administration, N.E.K. All authors have read and agreed to the published version of the manuscript.

Funding

This research has been financially supported by the Korea Institute of Planning and Evaluation for Technology in Food, Agriculture, Forestry and Fisheries (IPET) through Agriculture, Food and Rural Affairs Convergence Technologies Program for Educating Creative Global Leader, funded by the Ministry of Agriculture, Food and Rural Affairs (MAFRA) (717001-7) and in part by Brain Pool program through the National Research Foundation of Korea (2021H1D3A2A02038875).

Data Availability Statement

The datasets generated during and/or analysed during the current study are available from the corresponding author on reasonable request.

Conflicts of Interest

The authors declare no conflict of interest.

References

  1. Manganaris, G.A.; Goulas, V.; Vicente, A.R.; Terry, L.A. Berry antioxidants: Small fruits providing large benefits. J. Sci. Food Agric. 2014, 94, 825–833. [Google Scholar] [CrossRef] [Green Version]
  2. Seeram, N.P.; Adams, L.S.; Zhang, Y.; Lee, R.; Sand, D.; Scheuller, H.S.; Heber, D. Blackberry, black raspberry, blueberry, cranberry, red raspberry, and strawberry extracts inhibit growth and stimulate apoptosis of human cancer cells in vitro. J. Agric. Food Chem. 2006, 54, 9329–9339. [Google Scholar] [CrossRef] [PubMed]
  3. Zanini, S.; Marzotto, M.; Giovinazzo, F.; Bassi, C.; Bellavite, P. Effects of dietary components on cancer of the digestive system. Crit. Rev. Food Sci. Nutr. 2015, 55, 1870–1885. [Google Scholar] [CrossRef] [PubMed]
  4. Shewfelt, R.L. Chapter 17—Measuring Quality and Maturity. In Postharvest Handling: A Systems Approach; Florkowski, W.J., Shwefelt, R.L., Brueckner, B., Prussia, S.E., Eds.; Elsevier: San Diego, CA, USA, 2009; Volume 2, pp. 461–481. [Google Scholar]
  5. Guo, C.; Liu, F.; Kong, W.; He, Y.; Lou, B. Hyperspectral imaging analysis for ripeness evaluation of strawberry with support vector machine. J. Food Eng. 2016, 179, 11–18. [Google Scholar]
  6. De Jesús Ornelas-Paz, J.; Yahia, E.M.; Ramírez-Bustamante, N.; Pérez-Martínez, J.D.; del Pilar Escalante-Minakata, M.; Ibarra-Junquera, V.; Acosta-Muñiz, C.; Guerrero-Prieto, V.; Ochoa-Reyes, E. Physical attributes and chemical composition of organic strawberry fruit (Fragaria x ananassa Duch, Cv. Albion) at six stages of ripening. Food Chem. 2013, 138, 372–381. [Google Scholar] [CrossRef]
  7. Chope, G.A.; Terry, L.A.; White, P.J. Effect of controlled atmosphere storage on abscisic acid concentration and other biochemical attributes of onion bulbs. Postharvest Biol. Technol. 2006, 39, 233–242. [Google Scholar] [CrossRef]
  8. Kader, A.A. Flavor quality of fruits and vegetables. J. Sci. Food Agric. 2008, 88, 1863–1868. [Google Scholar] [CrossRef]
  9. Montero, T.M.; Mollá, E.M.; Esteban, R.M.; López-Andréu, F.J. Quality attributes of strawberry during ripening. Sci. Hortic. 1996, 65, 239–250. [Google Scholar] [CrossRef]
  10. Mahmood, T.; Anwar, F.; Abbas, M.; Saari, N. Effect of maturity on phenolics (phenolic acids and flavonoids) profile of strawberry cultivars and mulberry species from Pakistan. Int. J. Mol. Sci. 2012, 13, 4591–4607. [Google Scholar] [CrossRef] [Green Version]
  11. Nunes, M.C.N.; Brecht, J.K.; Morais, A.M.M.B.; Sargent, S.A. Physicochemical changes during strawberry development in the field compared with those that occur in harvested fruit during storage. J. Sci. Food Agric. 2006, 86, 180–190. [Google Scholar] [CrossRef]
  12. Kafkas, E.; Koşar, M.; Paydaş, S.; Kafkas, S.; Başer, K.H.C. Quality characteristics of strawberry genotypes at different maturation stages. Food Chem. 2007, 100, 1229–1236. [Google Scholar] [CrossRef]
  13. Ménager, I.; Jost, M.; Aubert, C. Changes in physicochemical characteristics and volatile constituents of strawberry (Cv. Cigaline) during maturation. J. Agric. Food Chem. 2004, 52, 1248–1254. [Google Scholar] [CrossRef] [PubMed]
  14. Martínez-Bolaños, M.; Nieto-Angel, D.; Téliz-Ortiz, D.; Rodríguez-Alcazar, J.; Martínez-Damian, M.T.; Vaquera-Huerta, H.; Carrillo Mendoza, O. Quality comparison of Mexican and American strawberries (Fragaria x ananassa Duch) varieties. Rev. Chapingo. Ser. Hortic. 2008, 14, 113–119. [Google Scholar]
  15. Genizi, A.; Cohen, E. The chemical composition and sensory flavour quality of ‘Mineola’tangerines. II. Relationship between composition and sensory properties. J. Hortic. Sci. 1988, 63, 179–182. [Google Scholar] [CrossRef]
  16. Nogueira, L.C.; Silva, F.; Ferreira, I.M.; Trugo, L.C. Separation and quantification of beer carbohydrates by high-performance liquid chromatography with evaporative light scattering detection. J. Chromatogr. A 2005, 1065, 207–210. [Google Scholar] [CrossRef] [PubMed]
  17. Pereira, F.M.V.; de Souza Carvalho, A.; Cabeça, L.F.; Colnago, L.A. Classification of intact fresh plums according to sweetness using time-domain nuclear magnetic resonance and chemometrics. Microchem. J. 2013, 108, 14–17. [Google Scholar] [CrossRef]
  18. Dongare, M.L.; Buchade, P.B.; Awatade, M.N.; Shaligram, A.D. Mathematical modeling and simulation of refractive index based Brix measurement system. Optik 2014, 125, 946–949. [Google Scholar] [CrossRef]
  19. Ma, C.; Sun, Z.; Chen, C.; Zhang, L.; Zhu, S. Simultaneous separation and determination of fructose, sorbitol, glucose and sucrose in fruits by HPLC–ELSD. Food Chem. 2014, 145, 784–788. [Google Scholar] [CrossRef]
  20. Johnson, F.J. Official Methods of Analysis of the Association of Official Analytical Chemists; Helrich, K., Ed.; Association of Official Analytical Chemists: Arlington, VA, USA, 1990; Volume 2, pp. 19–121. [Google Scholar]
  21. Magwaza, L.S.; Opara, U.L. Analytical methods for determination of sugars and sweetness of horticultural products—A review. Sci. Hortic. 2015, 184, 179–192. [Google Scholar] [CrossRef]
  22. Beullens, K.; Mészáros, P.; Vermeir, S.; Kirsanov, D.; Legin, A.; Buysens, S.; Cap, N.; Nicolaï, B.M.; Lammertyn, J. Analysis of tomato taste using two types of electronic tongues. Sens. Actuators B Chem. 2008, 131, 10–17. [Google Scholar] [CrossRef]
  23. Sarkar, S.; Basak, J.K.; Moon, B.E.; Kim, H.T. A comparative study of PLSR and SVM-R with various preprocessing techniques for the quantitative determination of soluble solids content of hardy kiwi fruit by a portable vis/NIR spectrometer. Foods 2020, 9, 1078. [Google Scholar] [CrossRef] [PubMed]
  24. Basile, T.; Marsico, A.D.; Perniola, R. Use of Artificial Neural Networks and NIR Spectroscopy for Non-Destructive Grape Texture Prediction. Foods 2022, 11, 281. [Google Scholar] [CrossRef] [PubMed]
  25. Beullens, K.; Kirsanov, D.; Irudayaraj, J.; Rudnitskaya, A.; Legin, A.; Nicolaï, B.M.; Lammertyn, J. The electronic tongue and ATR–FTIR for rapid detection of sugars and acids in tomatoes. Sens. Actuators B Chem. 2006, 116, 107–115. [Google Scholar] [CrossRef]
  26. Saranwong, S.; Sornsrivichai, J.; Kawano, S. Prediction of ripe-stage eating quality of mango fruit from its harvest quality measured nondestructively by near infrared spectroscopy. Postharvest Biol. Technol. 2004, 31, 137–145. [Google Scholar] [CrossRef]
  27. McDonald, H.; Arpaia, M.L.; Caporaso, F.; Obenland, D.; Were, L.; Rakovski, C.; Prakash, A. Effect of gamma irradiation treatment at phytosanitary dose levels on the quality of ‘Lane Late’navel oranges. Postharvest Biol. Technol. 2013, 86, 91–99. [Google Scholar] [CrossRef]
  28. Wang, A.; Hu, D.; Xie, L. Comparison of detection modes in terms of the necessity of visible region (VIS) and influence of the peel on soluble solids content (SSC) determination of navel orange using VIS–SWNIR spectroscopy. J. Food Eng. 2014, 126, 126–132. [Google Scholar] [CrossRef]
  29. Jie, D.; Xie, L.; Rao, X.; Ying, Y. Using visible and near infrared diffuse transmittance technique to predict soluble solids content of watermelon in an on-line detection system. Postharvest Biol. Technol. 2014, 90, 1–6. [Google Scholar] [CrossRef]
  30. Magwaza, L.S.; Opara, U.L.; Nieuwoudt, H.; Cronje, P.J.R.; Saeys, W.; Nicolaï, B. NIR spectroscopy applications for internal and external quality analysis of citrus fruit—A review. Food Bioprocess Technol. 2012, 5, 425–444. [Google Scholar] [CrossRef]
  31. ElMasry, G.; Wang, N.; ElSayed, A.; Ngadi, M. Hyperspectral imaging for nondestructive determination of some quality attributes for strawberry. J. Food Eng. 2007, 81, 98–107. [Google Scholar] [CrossRef]
  32. Peng, Y.; Lu, R. Analysis of spatially resolved hyperspectral scattering images for assessing apple fruit firmness and soluble solids content. Postharvest Biol. Technol. 2008, 48, 52–62. [Google Scholar] [CrossRef]
  33. Indrabayu, I.; Arifin, N.; Areni, I.S. Strawberry ripeness classification system based on skin tone color using multi-class support vector machine. In Proceedings of the 2019 International Conference on Information and Communications Technology (ICOIACT), Yogyakarta, Indonesia, 24–25 July 2019; IEEE: New York, NY, USA, 2019; pp. 191–195. [Google Scholar]
  34. Pardede, J.; Husada, M.G.; Hermana, A.N.; Rumapea, S.A. Fruit ripeness based on RGB, HSV, HSL, L a b color feature using SVM. In Proceedings of the 2019 International Conference of Computer Science and Information Technology (ICoSNIKOM), Medan, Indonesia, 28–29 November 2019; IEEE: New York, NY, USA, 2019; pp. 1–5. [Google Scholar]
  35. Prakash, J.S.; Vignesh, K.A.; Ashok, C.; Adithyan, R. Multi class Support Vector Machines classifier for machine vision application. In Proceedings of the 2012 International Conference on Machine Vision and Image Processing (MVIP), Coimbatore, India, 14–15 December 2012; IEEE: New York, NY, USA, 2012; pp. 197–199. [Google Scholar]
  36. Li, X.; Li, J.; Tang, J. A deep learning method for recognizing elevated mature strawberries. In Proceedings of the 2018 33rd Youth Academic Annual Conference of Chinese Association of Automation (YAC), Nanjing, China, 18–20 May 2018; IEEE: New York, NY, USA, 2018; pp. 1072–1077. [Google Scholar]
  37. Elhariri, E.; El-Bendary, N.; Hussein, A.M.M.; Hassanien, A.E.; Badr, A. Bell pepper ripeness classification based on support vector machine. In Proceedings of the 2014 International Conference on Engineering and Technology (ICET), Cairo, Egypt, 19–20 April 2014; IEEE: New York, NY, USA, 2014; pp. 1–6. [Google Scholar]
  38. El-Bendary, N.; El Hariri, E.; Hassanien, A.E.; Badr, A. Using machine learning techniques for evaluating tomato ripeness. Expert Syst. Appl. 2015, 42, 1892–1905. [Google Scholar] [CrossRef]
  39. Mohammadi, V.; Kheiralipour, K.; Ghasemi-Varnamkhasti, M. Detecting maturity of persimmon fruit based on image processing technique. Sci. Hortic. 2015, 184, 123–128. [Google Scholar] [CrossRef]
  40. Cho, B.H.; Koseki, S. Determination of banana quality indices during the ripening process at different temperatures using smartphone images and an artificial neural network. Sci. Hortic. 2021, 288, 110382. [Google Scholar] [CrossRef]
  41. Villaseñor-Aguilar, M.J.; Bravo-Sánchez, M.G.; Padilla-Medina, J.A.; Vázquez-Vera, J.L.; Guevara-González, R.G.; García-Rodríguez, F.J.; Barranco-Gutiérrez, A.I. A maturity estimation of bell pepper (Capsicum annuum L.) by artificial vision system for quality control. Appl. Sci. 2020, 10, 5097. [Google Scholar] [CrossRef]
  42. Gamage, B.; Madhavi, K.; Basak, J.K.; Paudel, B.; Kim, N.E.; Choi, G.M.; Kim, H.T. Prediction of Strawberry Leaf Color Using RGB Mean Values Based on Soil Physicochemical Parameters Using Machine Learning Models. Agronomy 2022, 12, 981. [Google Scholar]
  43. Khan, F.; Kim, N.E.; Bhujel, A.; Jaihuni, M.; Lee, D.H.; Basak, J.K.; Kim, H.T. Assessment of Combined Trichoderma-Enriched Biofertilizer and Nutrients Solutions on the Growth and Yield of Strawberry Plants. J. Biosyst. Eng. 2021, 46, 225–235. [Google Scholar] [CrossRef]
  44. Allender, C.; Brain, K.; Haupt, K.; Piletsky, S. Analytica Chimica Acta: Preface. Anal. Chim. Acta 2005, 542, 1–2. [Google Scholar] [CrossRef]
  45. Dadzie, B.K.; Orchard, J.E. Routine Post-Harvest Screening of Banana/Plantain Hybrids: Criteria and Methods; CGIAR: Avenue Agropolis, France, 1997; ISBN 2910810224. [Google Scholar]
  46. Xie, C.; He, Y. Spectrum and image texture features analysis for early blight disease detection on eggplant leaves. Sensors 2016, 16, 676. [Google Scholar] [CrossRef] [Green Version]
  47. González-Pérez, J.L.; Espino-Gudiño, M.C.; Gudiño-Bazaldúa, J.; Rojas-Rentería, J.L.; Rodríguez-Hernández, V.; Castaño, V.M. Color image segmentation using perceptual spaces through applets for determining and preventing diseases in chili peppers. Afr. J. Biotechnol. 2013, 12, 679–688. [Google Scholar]
  48. Shaik, K.B.; Ganesan, P.; Kalist, V.; Sathish, B.S.; Jenitha, J.M.M. Comparative study of skin color detection and segmentation in HSV and YCbCr color space. Procedia Comput. Sci. 2015, 57, 41–48. [Google Scholar] [CrossRef] [Green Version]
  49. Arulmozhi, E.; Bhujel, A.; Moon, B.-E.; Kim, H.-T. The application of cameras in precision pig farming: An overview for swine-keeping professionals. Animals 2021, 11, 2343. [Google Scholar] [CrossRef] [PubMed]
  50. Basak, J.K.; Okyere, F.G.; Arulmozhi, E.; Park, J.; Khan, F.; Kim, H.T. Artificial neural networks and multiple linear regression as potential methods for modelling body surface temperature of pig. J. Appl. Anim. Res. 2020, 48, 207–219. [Google Scholar] [CrossRef]
  51. Basak, J.K.; Arulmozhi, E.; Khan, F.; Okyere, F.G.; Park, J.; Lee, D.H.; Kim, H.T. Assessment of the influence of environmental variables on pig’s body temperature using ann and mlr models. Indian J. Anim. Res. 2020, 54, 1165–1170. [Google Scholar] [CrossRef]
  52. Basak, J.K.; Arulmozhi, E.; Moon, B.E.; Bhujel, A.; Kim, H.T. Modelling methane emissions from pig manure using statistical and machine learning methods. Air Qual. Atmos. Health 2022, 15, 575–589. [Google Scholar] [CrossRef]
  53. Grégoire, G. Multiple linear regression. EAS Publ. Ser. 2014, 66, 45–72. [Google Scholar] [CrossRef]
  54. Basak, J.K.; Qasim, W.; Okyere, F.G.; Khan, F.; Lee, Y.J.; Park, J.; Kim, H.T. Regression analysis to estimate morphology parameters of pepper plant in a controlled greenhouse system. J. Biosyst. Eng. 2019, 44, 57–68. [Google Scholar] [CrossRef]
  55. Zhao, T.; Xue, H. Regression analysis and indoor air temperature model of greenhouse in northern dry and cold regions. In Proceedings of the International Conference on Computer and Computing Technologies in Agriculture, Nanchang, China, 22–25 October 2010; Springer: Berlin/Heidelberg, Germany, 2010; pp. 252–258. [Google Scholar]
  56. Thissen, U.; Pepers, M.; Üstün, B.; Melssen, W.J.; Buydens, L.M.C. Comparing support vector machines to PLS for spectral regression applications. Chemom. Intell. Lab. Syst. 2004, 73, 169–179. [Google Scholar] [CrossRef]
  57. Drucker, H.; Burges, C.J.; Kaufman, L.; Smola, A.; Vapnik, V. Support vector regression machines. Adv. Neural Inf. Process. Syst. 1996, 9, 155–161. [Google Scholar]
  58. Van Der Walt, S.; Colbert, S.C.; Varoquaux, G. The NumPy array: A structure for efficient numerical computation. Comput. Sci. Eng. 2011, 13, 22–30. [Google Scholar] [CrossRef] [Green Version]
  59. McKinney, W. Data Structures for Statistical Computing in Python. In Proceedings of the 9th Python in Science Conference, Austin, TX, USA, 28 June–3 July 2010; van der Walt, S., Millman, J., Eds.; SCIPY: Austin, TX, USA, 2010; pp. 56–61. [Google Scholar]
  60. Hunter, J.D. Matplotlib: A 2D graphics environment. Comput. Sci. Eng. 2007, 9, 90–95. [Google Scholar] [CrossRef]
  61. Perkins-Veazie, P.; Huber, D.J. Growth and ripening of strawberry fruit under field conditions. In Proceedings of the Annual Meeting of the Florida State Horticulture Society, Crystal River, FL, USA, 22–23 May 1988; Florida Online Journals, Florida, USA, 1988. pp. 253–256. [Google Scholar]
  62. Abeles, F.B.; Takeda, F. Cellulase activity and ethylene in ripening strawberry and apple fruits. Sci. Hortic. 1990, 42, 269–275. [Google Scholar] [CrossRef]
  63. Ferreyra, R.M.; Viña, S.Z.; Mugridge, A.; Chaves, A.R. Growth and ripening season effects on antioxidant capacity of strawberry cultivar Selva. Sci. Hortic. 2007, 112, 27–32. [Google Scholar] [CrossRef]
  64. Figueroa, C.R.; Pimentel, P.; Gaete-Eastman, C.; Moya, M.; Herrera, R.; Caligari, P.D.S.; Moya-León, M.A. Softening rate of the Chilean strawberry (Fragaria chiloensis) fruit reflects the expression of polygalacturonase and pectate lyase genes. Postharvest Biol. Technol. 2008, 49, 210–220. [Google Scholar] [CrossRef]
  65. Doymaz, I. Convective drying kinetics of strawberry. Chem. Eng. Process. Process Intensif. 2008, 47, 914–919. [Google Scholar] [CrossRef]
  66. Karlidag, H.; Yildirim, E.; Turan, M. Exogenous applications of salicylic acid affect quality and yield of strawberry grown under antifrost heated greenhouse conditions. J. Plant Nutr. Soil Sci. 2009, 172, 270–276. [Google Scholar] [CrossRef]
  67. Azodanlou, R.; Darbellay, C.; Luisier, J.-L.; Villettaz, J.-C.; Amadò, R. Changes in flavour and texture during the ripening of strawberries. Eur. Food Res. Technol. 2004, 218, 167–172. [Google Scholar]
  68. Nascimento, G.G.F.; Locatelli, J.; Freitas, P.C.; Silva, G.L. Antibacterial activity of plant extracts and phytochemicals on antibiotic-resistant bacteria. Brazilian J. Microbiol. 2000, 31, 247–256. [Google Scholar] [CrossRef]
  69. Villanueva, M.J.; Tenorio, M.D.; Esteban, M.A.; Mendoza, M.C. Compositional changes during ripening of two cultivars of muskmelon fruits. Food Chem. 2004, 87, 179–185. [Google Scholar] [CrossRef]
  70. Jeong, H.J.; Choi, H.G.; Moon, B.Y.; Cheong, J.W.; Kang, N.J. Comparative analysis of the fruit characteristics of four strawberry cultivars commonly grown in South Korea. Hortic. Sci. Technol. 2016, 34, 396–404. [Google Scholar] [CrossRef]
  71. Ali, A.; Maqbool, M.; Ramachandran, S.; Alderson, P.G. Gum arabic as a novel edible coating for enhancing shelf-life and improving postharvest quality of tomato (Solanum lycopersicum L.) fruit. Postharvest Biol. Technol. 2010, 58, 42–47. [Google Scholar] [CrossRef]
  72. Imaduddin, A.H.; Susanto, W.H. Pengaruh tingkat kematangan buah belimbing (Averrhoa carambola L.) dan Proporsi penambahan gula terhadap karakteristik fisikokimia dan organoleptik lempok belimbing. J. Pangan Agroindustri 2017, 5, 45–57. [Google Scholar]
  73. Janurianti, N.M.D.; Utama, I.M.S.; Gunam, I.B.W. Colour and quality of strawberry fruit (Fragaria x ananassa Duch.) at different levels of maturity. Sustain. Environ. Agric. Sci. 2021, 5, 22–28. [Google Scholar] [CrossRef]
  74. Hernandez-Munoz, P.; Almenar, E.; Del Valle, V.; Velez, D.; Gavara, R. Effect of chitosan coating combined with postharvest calcium treatment on strawberry (Fragaria x ananassa) quality during refrigerated storage. Food Chem. 2008, 110, 428–435. [Google Scholar] [CrossRef] [PubMed]
  75. Abdipour, M.; Younessi-Hmazekhanlu, M.; Ramazani, S.H.R. Artificial neural networks and multiple linear regression as potential methods for modeling seed yield of safflower (Carthamus tinctorius L.). Ind. Crops Prod. 2019, 127, 185–194. [Google Scholar] [CrossRef]
  76. Arulmozhi, E.; Basak, J.K.; Sihalath, T.; Park, J.; Kim, H.T.; Moon, B.E. Machine learning-based microclimate model for indoor air temperature and relative humidity prediction in a swine building. Animals 2021, 11, 222. [Google Scholar] [CrossRef] [PubMed]
  77. Shen, F.; Zhang, B.; Cao, C.; Jiang, X. On-line discrimination of storage shelf-life and prediction of post-harvest quality for strawberry fruit by visible and near infrared spectroscopy. J. Food Process Eng. 2018, 41, e12866. [Google Scholar] [CrossRef]
  78. Guo, Z.; Huang, W.; Chen, L.; Wang, X.; Peng, Y. Nondestructive evaluation of soluble solid content in strawberry by near infrared spectroscopy. In Proceedings of the Piageng 2013: Image Processing and Photonics for Agricultural Engineering, Sanya, China, 27–28 January 2013; SPIE: Bellingham, WA, USA, 2013; 8761, pp. 128–132. [Google Scholar]
  79. Agulheiro-Santos, A.C.; Ricardo-Rodrigues, S.; Laranjo, M.; Melgão, C.; Velázquez, R. Non-destructive prediction of total soluble solids in strawberry using near infrared spectroscopy. J. Sci. Food Agric. 2022. [Google Scholar] [CrossRef]
  80. Manley, M. Near-infrared spectroscopy and hyperspectral imaging: Non-destructive analysis of biological materials. Chem. Soc. Rev. 2014, 43, 8200–8214. [Google Scholar] [CrossRef] [Green Version]
  81. Mancini, M.; Mazzoni, L.; Gagliardi, F.; Balducci, F.; Duca, D.; Toscano, G.; Mezzetti, B.; Capocasa, F. Application of the non-destructive NIR technique for the evaluation of strawberry fruits quality parameters. Foods 2020, 9, 441. [Google Scholar] [CrossRef] [Green Version]
  82. Hernanz, D.; Recamales, Á.F.; Meléndez-Martínez, A.J.; González-Miret, M.L.; Heredia, F.J. Multivariate Statistical Analysis of the Color—Anthocyanin Relationships in Different Soilless-Grown Strawberry Genotypes. J. Agric. Food Chem. 2008, 56, 2735–2741. [Google Scholar] [CrossRef]
  83. Mohd Ali, N.; Md Rashid, N.K.A.; Mustafah, Y.M. Performance comparison between RGB and HSV color segmentations for road signs detection. Appl. Mech. Mater. 2013, 393, 550–555. [Google Scholar] [CrossRef]
  84. Bora, D.J.; Gupta, A.K.; Khan, F.A. Comparing the performance of L* A* B* and HSV color spaces with respect to color image segmentation. arXiv 2015, arXiv:1506.01472. [Google Scholar]
  85. Weng, S.; Yu, S.; Guo, B.; Tang, P.; Liang, D. Non-destructive detection of strawberry quality using multi-features of hyperspectral imaging and multivariate methods. Sensors 2020, 20, 3074. [Google Scholar] [CrossRef] [PubMed]
  86. Hu, M.-H.; Dong, Q.-L.; Liu, B.-L.; Opara, U.L.; Chen, L. Estimating blueberry mechanical properties based on random frog selected hyperspectral data. Postharvest Biol. Technol. 2015, 106, 1–10. [Google Scholar] [CrossRef]
  87. Voca, S.; Jakobek, L.; Druzic, J.; Sindrak, Z.; Dobricevic, N.; Seruga, M.; Kovac, A. Quality of strawberries produced applying two different growing systems Calidad de fresas producidas aplicando dos diferentes sistemas de cultivo. Cyta-J. Food 2009, 7, 201–207. [Google Scholar] [CrossRef]
  88. Pu, Y.; Wei, X.; Su, Y.; Zhao, Z.; Qian, W.; Xu, D. Implementation and research of multi-method color transfer algorithms in different color spaces. In Proceedings of the 2010 International Conference on Machine Vision and Human-Machine Interface, Kaifeng, China, 24–25 April 2010; IEEE: New York, NY, USA, 2010; pp. 713–717. [Google Scholar]
  89. Kurniastuti, I.; Yuliati, E.N.I.; Yudianto, F.; Wulan, T.D. Determination of Hue Saturation Value (HSV) color feature in kidney histology image. In Proceedings of the Journal of Physics: Conference Series, Singapore, 10–11 March 2022; IOP Publishing: Bristol, UK, 2022; Volume 2157, p. 12020. [Google Scholar]
  90. Hosseini, S.M.; Yazdi, H.S.; Amjadi, S.; Farsi, H. A novel color space creating method applied to skin color detection. In Proceedings of the 2009 International Conference on Digital Image Processing, Bangkok, Thailand, 7–9 March 2009; IEEE: New York, NY, USA, 2009; pp. 17–21. [Google Scholar]
Figure 1. Experimental greenhouse for strawberry cultivation.
Foods 11 02086 g001
Figure 2. Images of strawberries with background removal (BR), binary, RGB, HSV and HSL colour spaces in six ripening stages. Biometrical data (Length (L in mm), diameter (D in mm) and weight (W in g)) and TSS (°brix) with pH are shown in the two right columns, respectively.
Foods 11 02086 g002
Figure 3. Diagrams show the structure of (a) multiple linear regression (MLR) and (b) support vector machine regression (SVM-R).
Foods 11 02086 g003
Figure 4. Flow diagram of prediction of total soluble solids (TSS) and pH content of strawberries in six ripening stages with RGB, HSV and HSL colour spaces using multiple linear regression (MLR) and support vector machine regression (SVM-R).
Foods 11 02086 g004
Figure 5. Pearson correlation coefficients for the relationship between predictor and response variables were used in this study. Heat map (a) represents the relationship between colour space values of RGB images and response variables (TSS and pH); (b) represents the relationship between colour space values of HSV images and response variables (TSS and pH) and (c) represents the relationship between colour space values of HSL images and response variables (TSS and pH). The colour intensity in the matrix is proportional to the correlation coefficients.
Foods 11 02086 g005
Figure 6. The comparison results between measured and predicted values by MLR model with RGB, HSV and HSL colour spaces for TSS prediction in the testing period using time series and scatter plots with 1:1 line.
Foods 11 02086 g006
Figure 7. The comparison results between measured and predicted values by MLR model with RGB, HSV and HSL colour spaces for pH prediction in the testing period using time series and scatter plots with 1:1 line.
Foods 11 02086 g007
Figure 8. The comparison results between measured and predicted values by SVM-R model with RGB, HSV and HSL colour spaces for TSS prediction in the testing period using time series and scatter plots with 1:1 line.
Foods 11 02086 g008
Figure 9. The comparison results between measured and predicted values by SVM-R model with RGB, HSV and HSL colour spaces for pH prediction in the testing period using time series and scatter plots with 1:1 line.
Foods 11 02086 g009
Figure 10. Taylor diagram of testing results of MLR and SVM-R models with RGB, HSV and HSL datasets for TSS and pH prediction.
Foods 11 02086 g010
Figure 11. Cumulative distribution analysis using MLR and SVM-R models, (a) graph calculated from measured and predicted pH values (b) graph calculated from measured and predicted TSS content data during the testing period.
Foods 11 02086 g011
Figure 12. Sensitivity analysis of the HSV colour spaces on pH and TSS of strawberry fruits using MLR and SVM-R models. A: MLR/SVM-R model without V values; B: MLR/SVM-R model without S values; C: MLR/SVM-R model without H values. Sensitivity analysis of the HSV colour spaces on pH using MLR model (a); Sensitivity analysis of the HSV colour spaces on pH using SVM-R model (b); Sensitivity analysis of the HSV colour spaces on TSS using MLR model (c); Sensitivity analysis of the HSV colour spaces on TSS using SVM-R model (d).
Foods 11 02086 g012
Table 1. Biometrical characteristics, total soluble solids (TSS) and pH in strawberry fruits at six stages of ripening.
Ripening StageLength (mm)Diameter (mm)Weight (g)TSS (°brix)pH
White (RS1)36.72 ± 2.12 a30.79 ± 1.42 a15.33 ± 1.84 a5.99 ± 0.48 a3.85 ± 0.24 a
Turning (RS2)37.34 ± 3.36 a31.57 ± 2.47 a17.17 ± 4.06 b6.69 ± 0.36 b4.17 ± 0.18 b
Half-red (RS3)39.35 ± 2.61 b31.66 ± 2.79 ab18.31 ± 3.43 b7.18 ± 0.34 c4.34 ± 0.06 c
Three-quarter red (RS4)41.01 ± 4.17 c31.11 ± 1.71 a18.34 ± 2.57 b7.29 ± 0.22 c4.46 ± 0.12 d
Bright red (RS5)43.30 ± 2.92 d32.48 ± 1.73 bc19.97 ± 2.54 c8.24 ± 0.41 d4.59 ± 0.21 e
Dark red (RS6)42.71 ± 4.03 d33.00 ± 2.70 c20.58 ± 4.76 c9.19 ± 0.35 e4.87 ± 0.16 f
Overall in six stages40.07 ± 4.1231.77 ± 2.3218.28 ± 3.767.43 ± 1.104.38 ± 0.36
Values denote the mean of 100 individual measurements of strawberries (n = 100) in each ripening stage ± the standard deviation. Values not mentioned by the same letter in the same column are significantly different (p < 0.05).
Table 2. Values of RGB (Red: R, Green: G, Blue: B) colour space in strawberry fruits at six stages of ripening.
Ripening StageRGB Colour Space
RGB
RS1203.54 ± 6.52 a200.66 ± 6.52 a120.02 ± 11.18 a
RS2208.84 ± 4.18 b183.49 ± 11.70 b111.29 ± 10.99 b
RS3207.42 ± 9.86 b133.60 ± 9.02 c78.17 ± 10.32 c
RS4208.06 ± 8.77 b118.09 ± 7.02 d68.75 ± 5.21 d
RS5209.14 ± 5.50 b89.09 ± 8.07 e46.86 ± 5.91 e
RS6181.80 ± 6.34 c59.21 ± 4.98 f39.57 ± 3.64 f
Overall 203.13 ± 12.04130.69 ± 50.1877.44 ± 31.19
Values of RGB colour spaces collected from 100 individual collections of strawberry fruit (n = 100) images in each ripening stage denote the mean ± the standard deviation. Values not mentioned by the same letter in the same column are significantly different (p < 0.05).
Table 3. Values of HSV (Hue: H, Saturation: S, Value: V) colour space in strawberry fruits at six stages of ripening.
Ripening StageHSV Colour Space
HSV
RS128.87 ± 0.26 a110.29 ± 10.45 a203.88 ± 6.52 a
RS224.17 ± 2.14 b125.88 ± 13.52 b208.92 ± 4.17 b
RS316.20 ± 1.03 c171.47 ± 10.70 c207.43 ± 9.85 b
RS413.85 ± 0.85 d183.39 ± 4.58 d208.08 ± 8.77 b
RS59.76 ± 0.87 e206.12 ± 5.89 e209.14 ± 5.51 b
RS69.98 ± 1.54 f207.08 ± 5.18 e181.80 ± 6.34 c
Overall 16.95 ± 7.42167.37 ± 38.36203.21 ± 12.05
Values of HSV colour spaces collected from 100 individual collections of strawberry fruit (n = 100) images in each ripening stage denote the mean ± the standard deviation. Values not mentioned by the same letter in the same column are significantly different (p < 0.05).
Table 4. Values of HSL (Hue: H, Saturation: S, Lightness: L) colour space in strawberry fruits at six stages of ripening.
Ripening StageHSL Colour Space
HSL
RS128.87 ± 0.26 a161.65 ± 8.79 a133.34 ± 5.47 a
RS224.17 ± 2.14 b159.48 ± 2.14 a153.85 ± 11.05 b
RS316.24 ± 1.02 c139.83 ± 9.73 b190.73 ± 10.93 c
RS413.85 ± 0.85 d135.28 ± 6.64 c201.48 ± 6.58 d
RS59.92 ± 0.87 e125.63 ± 5.15 d212.64 ± 3.06 e
RS611.03 ± 2.34 f109.21 ± 4.16 e195.71 ± 7.24 f
Overall 17.35 ± 7.08138.51 ± 19.68181.29 ± 29.21
Values HSL of colour spaces collected from 100 individual collections of strawberry fruit (n = 100) images in each ripening stage denote the mean ± the standard deviation. Values not mentioned by the same letter in the same column are significantly different (p < 0.05).
Table 5. Performance metrics (R2 and RMSE) of the models for predicting TSS of strawberry fruits during the testing and training period. The values in italics indicate the best results in each model among the three colour spaces.
Model NameDatasetTrainingTesting
R2RMSER2RMSE
MLRRGB0.7680.5320.7360.570
HSV0.8210.4630.7630.540
HSL0.8080.4790.7560.547
SVM-RRGB0.8190.4810.7510.554
HSV0.8410.4370.7920.506
HSL0.8330.4470.7840.515
Table 6. Performance metrics (R2 and RMSE) of the models for predicting the pH of strawberry fruits during the testing and training period. The values in italics indicate the best results in each model among the three colour spaces.
Model NameDatasetTrainingTesting
R2RMSER2RMSE
MLRRGB0.7050.1880.6430.229
HSV0.7420.1820.6840.215
HSL0.7220.1890.6550.225
SVM-RRGB0.7480.1750.6880.214
HSV0.7880.1650.7260.201
HSL0.7740.1710.7140.204
Publisher’s Note: MDPI stays neutral with regard to jurisdictional claims in published maps and institutional affiliations.

