Article

Flaxseed Polysaccharide Alters Colonic Gene Expression of Lipid Metabolism and Energy Metabolism in Obese Rats

1
College of Food Science and Engineering, Nanchang Univeristy, Nanchang 330096, China
2
Department of Food Science and Engineering, Jinan University, Guangzhou 510632, China
*
Author to whom correspondence should be addressed.
Foods 2022, 11(13), 1991; https://doi.org/10.3390/foods11131991
Submission received: 1 June 2022 / Revised: 15 June 2022 / Accepted: 29 June 2022 / Published: 5 July 2022

Abstract

:
Obesity is one of the most serious public health challenges. Recently, we found that flaxseed polysaccharides (FPs) had an anti-obesity effect through promoting lipid metabolism, but the obesity-inhibiting pathway of FP is still unclear. In this study, after FP intervention in an obese rat model, a transcriptome study was performed to further investigate how FP intervention alters the gene expression of colonic epithelial tissues (CETs). The results showed that there were 3785 genes differentially expressed due to the FP intervention, namely 374 downregulated and 3411 upregulated genes. After analyzing all the differentially expressed genes, two classical KEGG pathways were found to be related to obesity, namely the PPAR-signaling pathway and energy metabolism, involving genes Fabp1–5, Lpl, Gyk, Qqp7, Pparg, Rxrg, Acsl1, Acsl4, Acsl6, Cpt1c, Car1–4, Ca5b, Car8, Car12–14, Cps1, Ndufa4l2, Cox6b2, Atp6v1g2, Ndufa4l2 and Cox4i2. QRT-PCR results showed a consistent expression trend. Our results indicate that FP promotes lipid metabolism by changing the expression of some key genes of CETs, thus inhibiting obesity.

Graphical Abstract

1. Introduction

Obesity is a public health challenge we are facing, the causes of which include biological, behavioral, and environmental factors [1]. According to the World Health Organization, more than 340 million children and adolescents aged 5–19 years were found to be overweight or obese in 2016 [2]. Developing from the disproportion between energy expenditure and caloric intake [3], obesity is associated with increased risk for diabetes, cancer, and other chronic diseases [4].
Elevated dietary fiber intake is effective at reducing obesity and metabolic syndrome induced by a high-fat diet [5]. Dietary fiber resists digestion in the small intestine, and passes into the large intestine where it may undergo partial or entire fermentation by the intestinal microflora [6]. It was reported that some dietary fibers influenced the genes of colonic epithelial cells that were involved in the pathways participating in substrate oxidation to produce energy [7]. Furthermore, gut microbiota can influence energy acquisition from dietary ingredients, and rats’ genes regulate energy expenditure and storage [8].
Flaxseed polysaccharide (FP) is an active complex carbohydrate (polysaccharide) from flaxseed shell [9]. As is known to us, polysaccharide with a complex structure cannot be degraded in the simulated digestive system, but decomposed and used by bacteria after integrally reaching the large intestine [10]. The intestinal bacteria will ferment or degrade the polysaccharide and produce short-chain fatty acids, oligosaccharides, etc. These products will pass through the intestinal mucus layer and interact with epithelial tissues, which leads to the various effects of polysaccharides [11].
FP is a heteropolysaccharide composed of acidic and neutral components [9]. In our previous research, we found that FP has an anti-obesity effect via promoting lipid metabolism, inducing satiety, and regulating the intestinal flora [12,13]. As a polysaccharide, FP cannot be digested and absorbed directly as nutrients by the body to play a role, so the obesity-inhibiting FP pathway is still unclear. We speculate that FP will be fermented or degraded by gut microbiota, and then alter the gene expression of CETs and regulate lipid metabolism and energy metabolism in vivo through its interaction with intestinal flora. However, it was unknown which gene expression in CETs is changed by FP. In this study, we aimed to further investigate the mechanism by which FP may induce weight loss by identifying genes of CETs that are differentially expressed in the presence and absence of dietary FP.

2. Materials and Methods

2.1. Chemicals and Reagents

TRIzol reagent was bought (Invitrogen, Carlsbad, CA, USA). A BestarTM qPCR RT kit was purchased (DBI Bioscience Co., Shanghai, China). Flaxseed polysaccharides (FPs) were generously provided by Professor Yong Wang at Jinan University. Briefly, the flaxseed shell was isolated from crushed flaxseed, and the crude polysaccharides were obtained after water extraction, alcohol precipitation and deproteinization. After ion-exchange column chromatography and dextran-gel column chromatography, FPs were prepared [14]. It contained two fractions, FP-1 and FP-2, with molecular weights of 2626 kDa and 1182 kDa, respectively, based on their analysis [14]. The FP used in this experiment contained these two components.

2.2. Animals, Diets, and Sample Preparation

As shown in our previous research [13], eighteen male Sprague–Dawley (SPF grade) rats, 4 weeks old, were bought from Guangdong Medical Laboratory Animal Center (Guangzhou China). After 10 days of adaptive feeding with a standard diet (D12450B), the rats were randomly divided into two groups, namely the control group (Group Con, n = 6) and the obesity group (n = 12), to establish the obesity model. Rats in Group Con were fed with a standard diet (D12450B), and rats in the obesity group were given a high-fat diet (D12492). After about 8 weeks, the average weight of the rats in the obesity group (467.8 ± 19.9 g) was 20% higher than that of Group Con (384.6 ± 6.9 g), indicating the establishment of the obesity model. Subsequently, rats in the obesity group were randomly divided (n = 6 for each) into High-fat group (Group HFD) and FP-diet group (Group FPD). Group Con and Group HFD were fed the control diet (AIN-93M), and Group FPD was fed an FP diet (10% cornstarch in AIN-93M was replaced by the same amount of FP) for 52 days. The rats were weighed weekly. The detailed recipes of each diet are shown in Table 1.
On day 53, all rats were fasted overnight and were anesthetized with sodium pentobarbital. After the execution of the rats, the CETs were obtained with a scalpel and then placed on disinfected silver paper. They were frozen in liquid nitrogen immediately and stored at −80℃ until RNA extraction. The experiments were ratified by the Research Animal Administration Center of Jinan University (Guangzhou, China, Approval No.20180402-03), following all Institutional Animal Care and Use Committee of Jinan University guidelines for the use and care of animals.

2.3. cDNA Library Construction, RNA-seq and Bioinformatics Analysis

These processes were performed as described previously [15]. Briefly, total RNA of the colonic epithelial tissues was extracted using TRIzol reagent. The RNA quality was determined and quantified. The cDNA library was generated using high-quality RNA samples, and was sequenced by the Illumina HiSeq 4000. Raw read data from RNA-seq were filtered using SeqPrep and Sickle software. Clean reads were mapped to the reference genome with bowtie2 software. Gene abundances were quantified by RSEM. DEGs were determined using DEseq2. If the adjusted p-value < 0.05, the genes were considered to be significantly differentially expressed. Subsequently, KEGG Pathway analysis, KEGG Pathway enrichment analysis as well as PPI (protein-protein interaction) network analysis were performed [16].

2.4. Quantitative Real-Time PCR (qRT-PCR) Analysis

TRIzol reagents were used to extract total RNA. The cDNA was synthesized using a BestarTM qPCR RT kit and the gene mRNA expression was determined with a BestarTM SybrGreen qPCR Master Mix. The PCR conditions were maintained at 95 °C for 2 min, followed by 40 cycles of 94 °C for 20 s, 58 °C for 20 s and 72 °C for 20 s. The program Primer 5 (Premier, Walnut Creek, CA, USA) was used to design primers for PCR. The sequences of all the primers used are provided in Table 2. The average cycle threshold (Ct) values were used for quantification using the 2−∆∆Ct method. β-actin was used as reference gene.

2.5. Statistical Analysis

Numerical data are expressed as means ± standard deviation (SD). SPSS 25.0 software (IBM Corporation, Armonk, NY, USA) was used to analyze the difference between the means. Two-tailed Student’s t-test was used to compare the data of different groups. p < 0.05 (*) or p < 0.01 (**) was considered statistically significant.

3. Results

3.1. Gene Expression Profile of CETs

After feeding FP for 54 days at the end of the trial, the weight of rats in Group FPD decreased by 9.81% compared with that in Group HFD (Figure 1), which indicated that FP induced body weight loss. An average of 52.16 million reads was obtained, and a large portion (95.14%) of high-quality clean reads were generated. The proportion of clean reads with a basic quality greater or equal to Q30 is higher than 95.14% with 48.37–50.25% GC content, which indicated the high quality of data. An average of 96.04% clean reads was mapped to the reference genome, among which 90.06% were mapped to the unique position.
As shown in Figure 2a, 80.45% of the genes were in common among all three groups. Furthermore, the genes between Group Con and Group HFD were somewhat similar, while Group FPD was obviously different compared with them (Figure 2b). The result indicated that FP intervention would change the expression of CETs.
The variation in mRNA expression between Group Con and Group HFD is shown in Figure 2c. A total of 28 DEGs, including 14 upregulated and 14 downregulated, were identified. There were 4344 DEGs identified between Group Con and Group FPD (Figure 2d), including 476 downregulated and 3868 upregulated (p < 0.05). Furthermore, 3785 DEGs were identified between Group HFD and Group FPD (Figure 2e), including 374 downregulated and 3411 upregulated DEGs (p < 0.05).

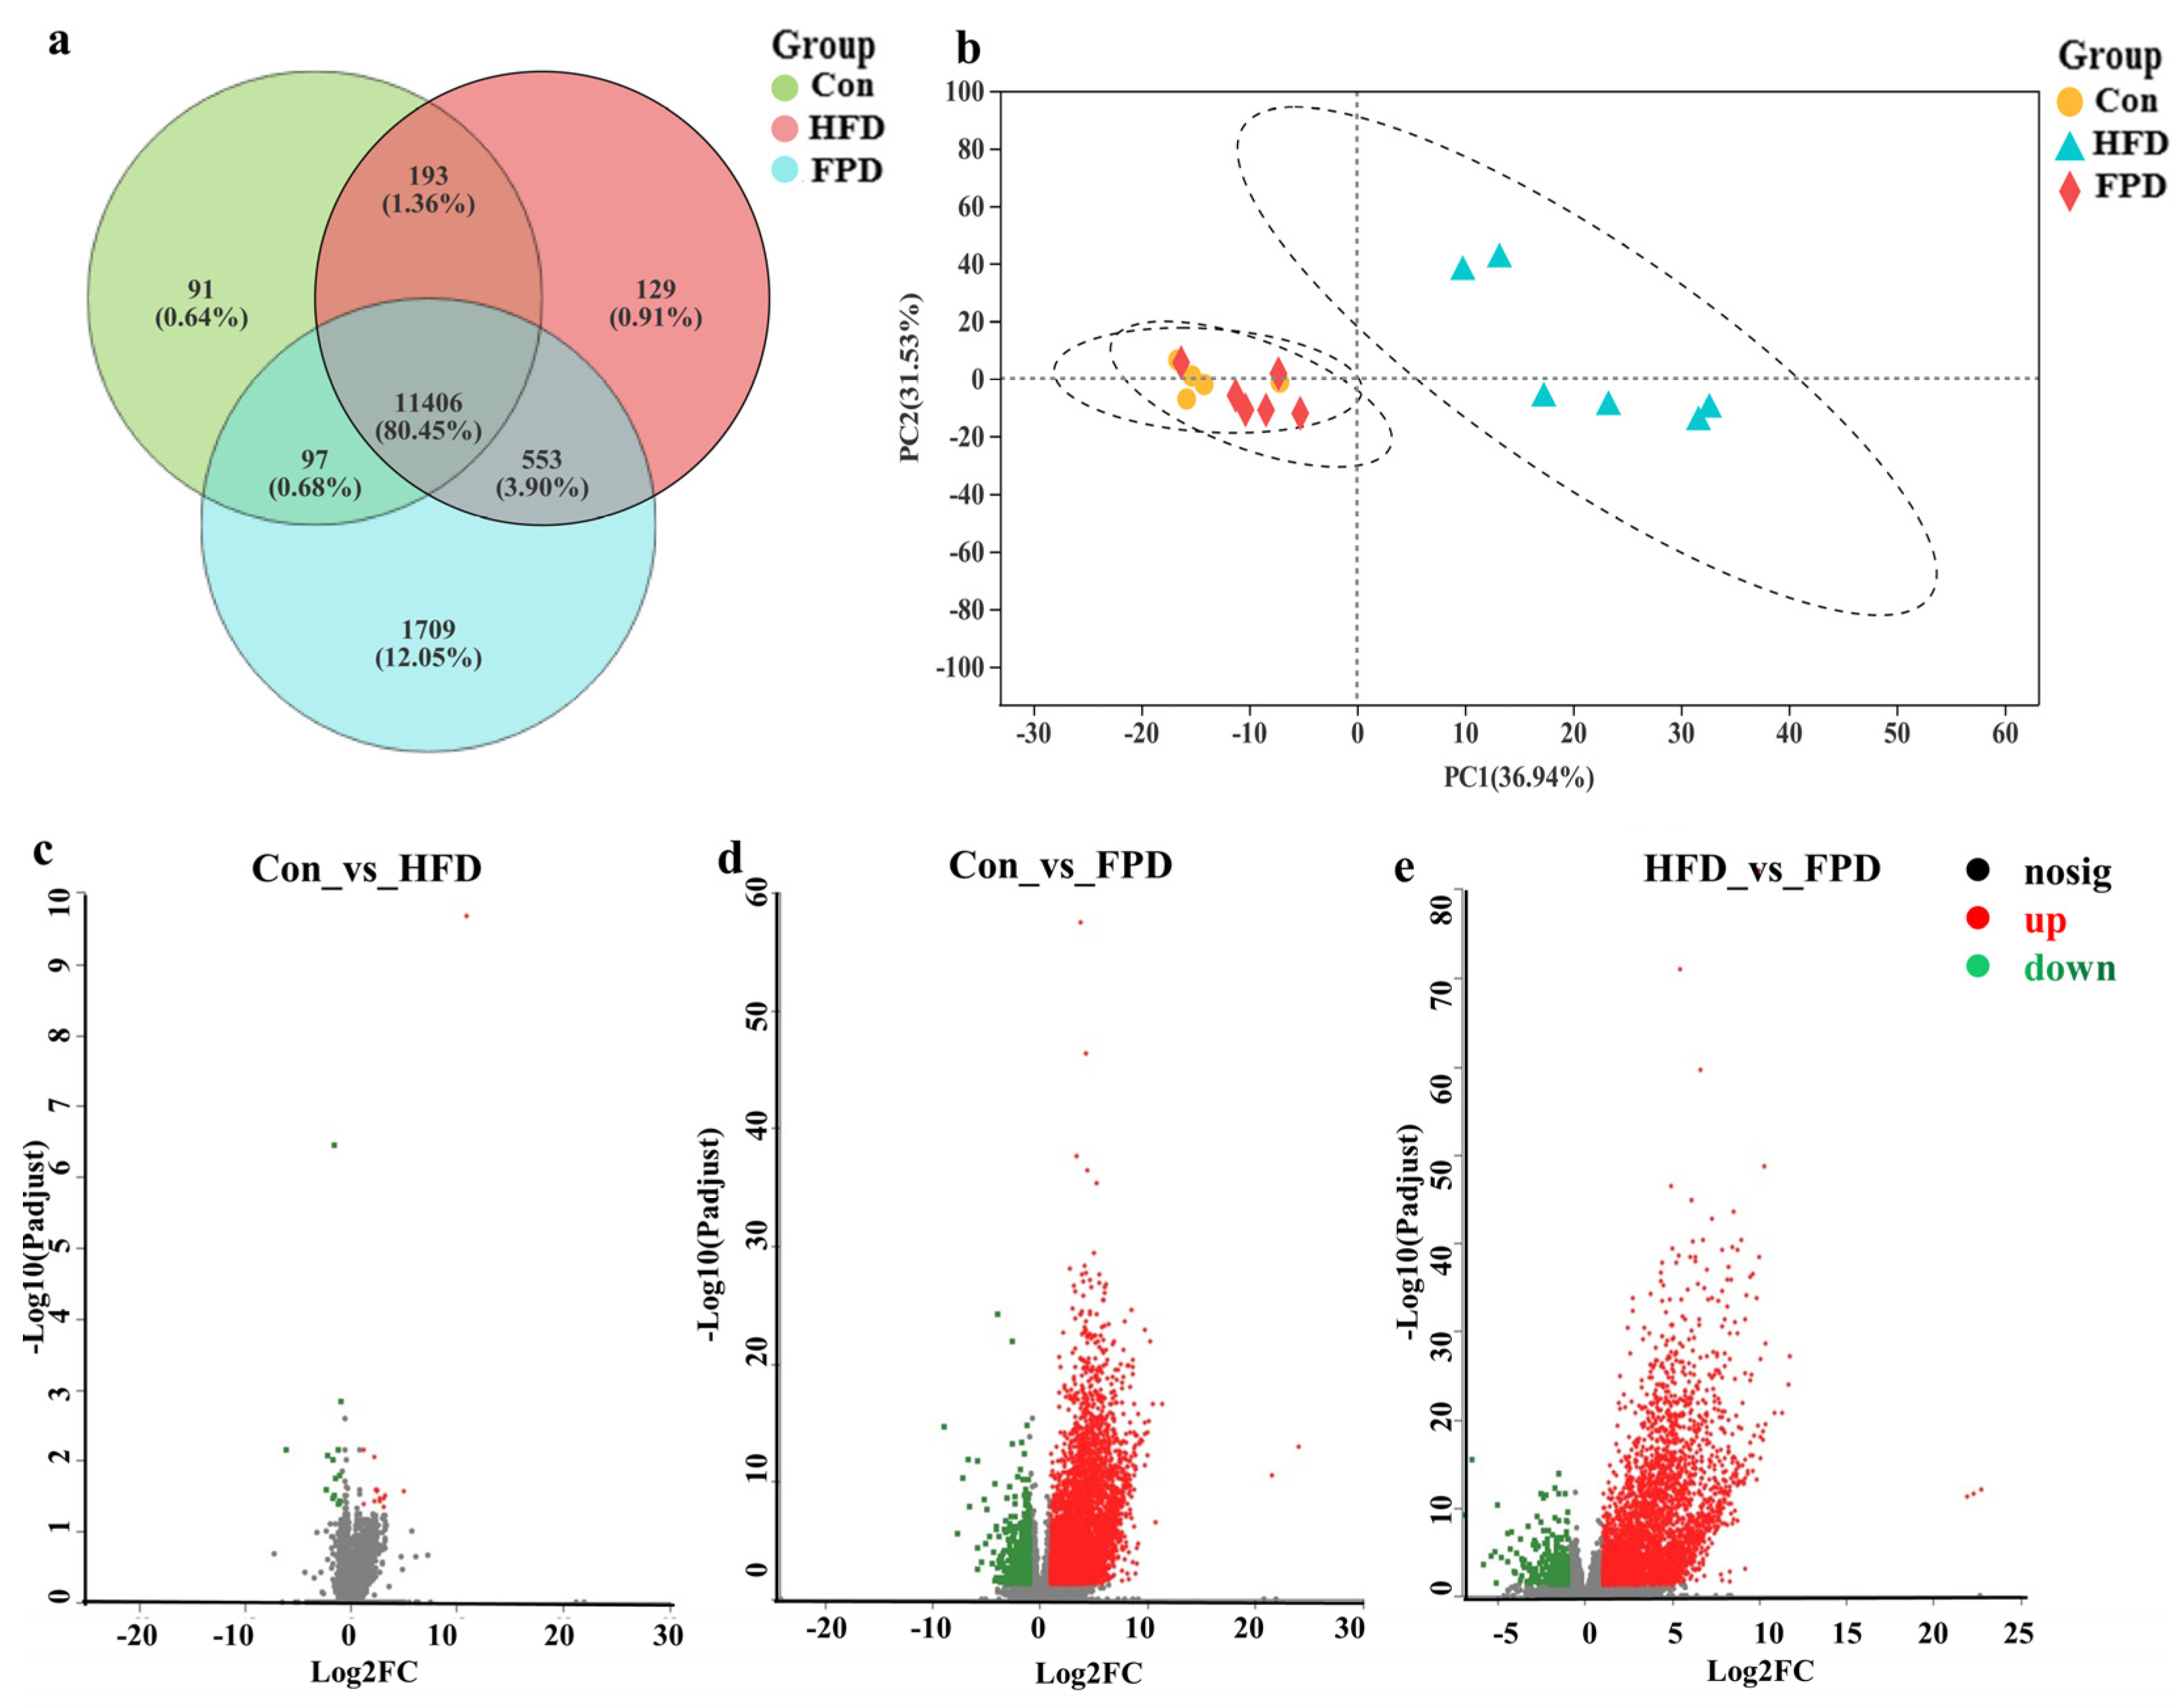
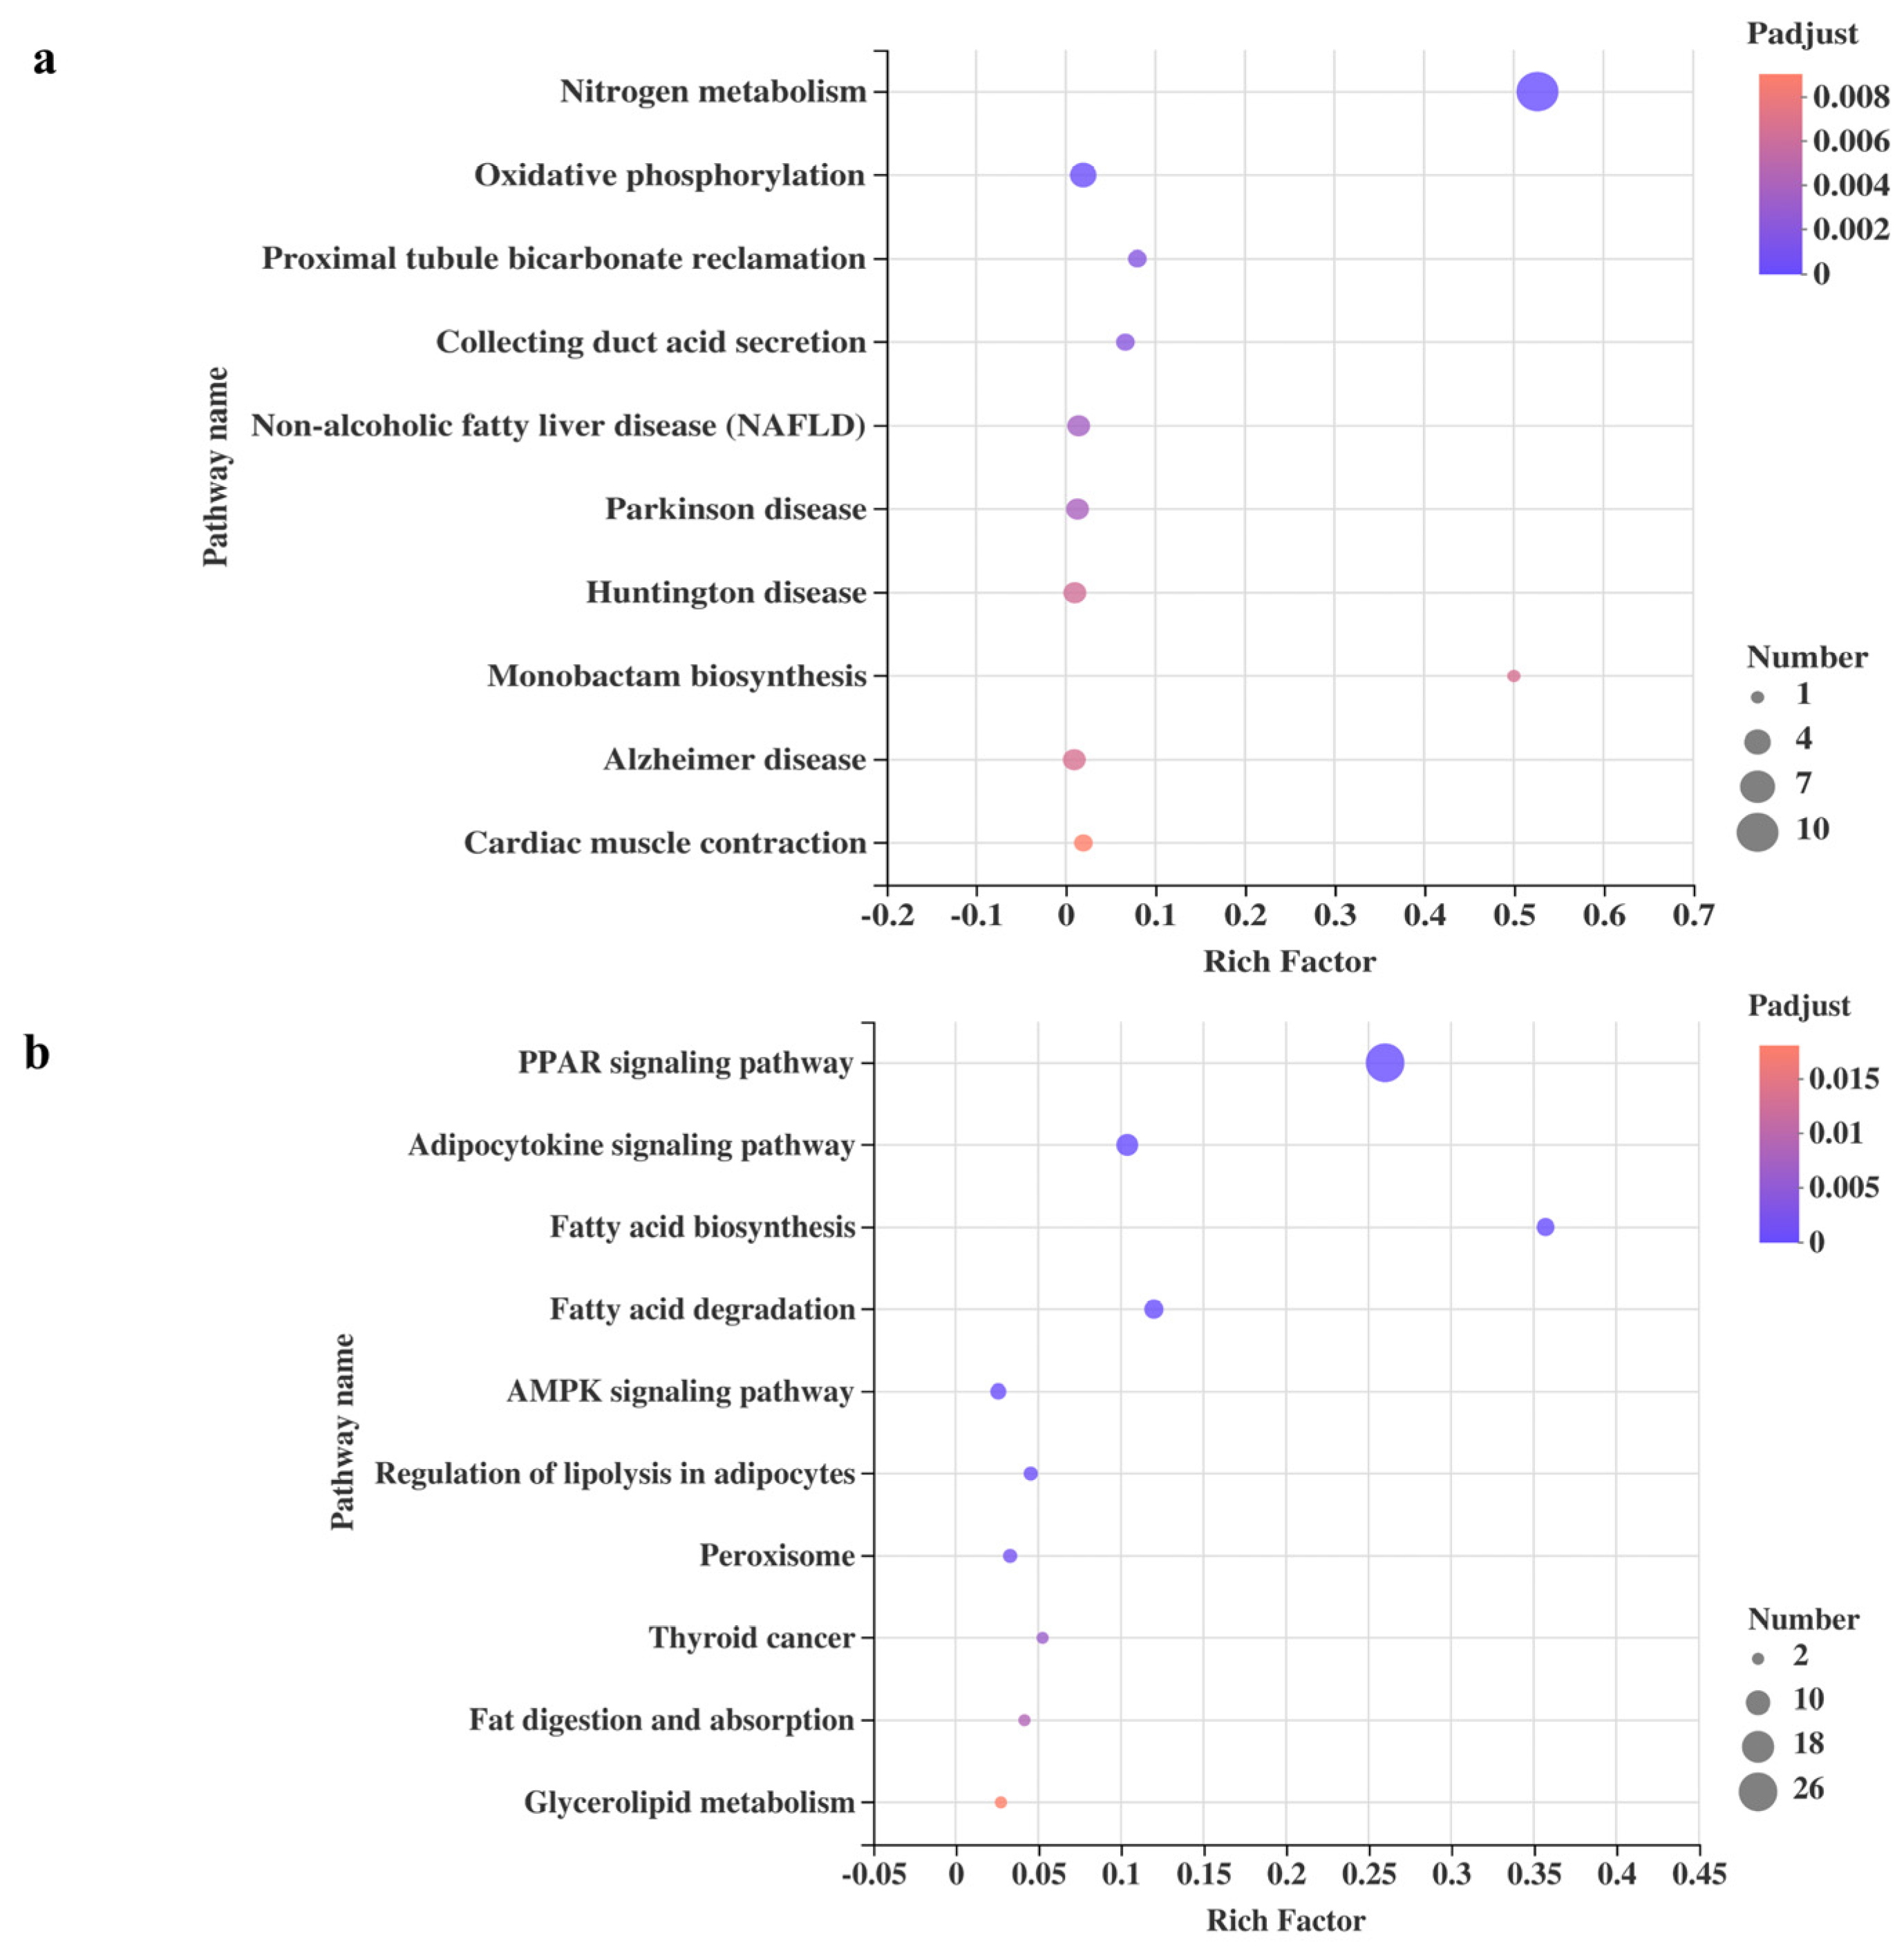
3.2. Analysis of DEGs Profile

To study the mechanism by which FP may induce weight loss in obese rats, we further analyzed the DEGs between Group HFD and Group FPD. The DEGs were mapped in the KEGG pathway database. In the comparison of the HFD and FPD treatments, annotated genes were divided into six categories. Most of them were enriched in signal transduction (Figure 3). It has been reported that weight loss involves a variety of mechanisms, such as inhibiting energy intake and stimulating energy expenditure. Furthermore, it has been found that the enrichment of colonic genes in the PPAR-signaling pathway was closely related to the anti-obesity effect [17]. In this research, 15 DEGs were found to be enriched in the energy-metabolism pathway and 26 DEGs in the PPAR-signaling pathway.
Through KEGG pathway enrichment analysis of DEGs in ‘energy metabolism’ and the ‘PPAR-signaling pathway’ between Group HFD and Group FPD, we further studied which biochemical reactions these genes participated in. The top 10 ranked KEGG pathways of DEGs in ‘energy metabolism’ are shown in Figure 4a. ‘Nitrogen metabolism’ had the highest rich factor and therefore showed the strongest enrichment degree, followed by ‘monobactam biosynthesis’. ‘Nitrogen metabolism’ showed the most DEGs, followed by ‘oxidative phosphorylation’, and the DEGs in the two pathways are listed in Table 3. Furthermore, Figure 4b shows the top 10 ranked KEGG pathways of DEGs in the PPAR-signaling pathway. The adipocytokine-signaling pathway showed the most DEGs, followed by ‘fatty acid degradation’ and ‘fatty acid biosynthesis’. The DEGs enriched in the PPAR-signaling pathway were further analyzed and the PPI network (Figure 5a) shows the associations between 23 DEGs (Table 3).

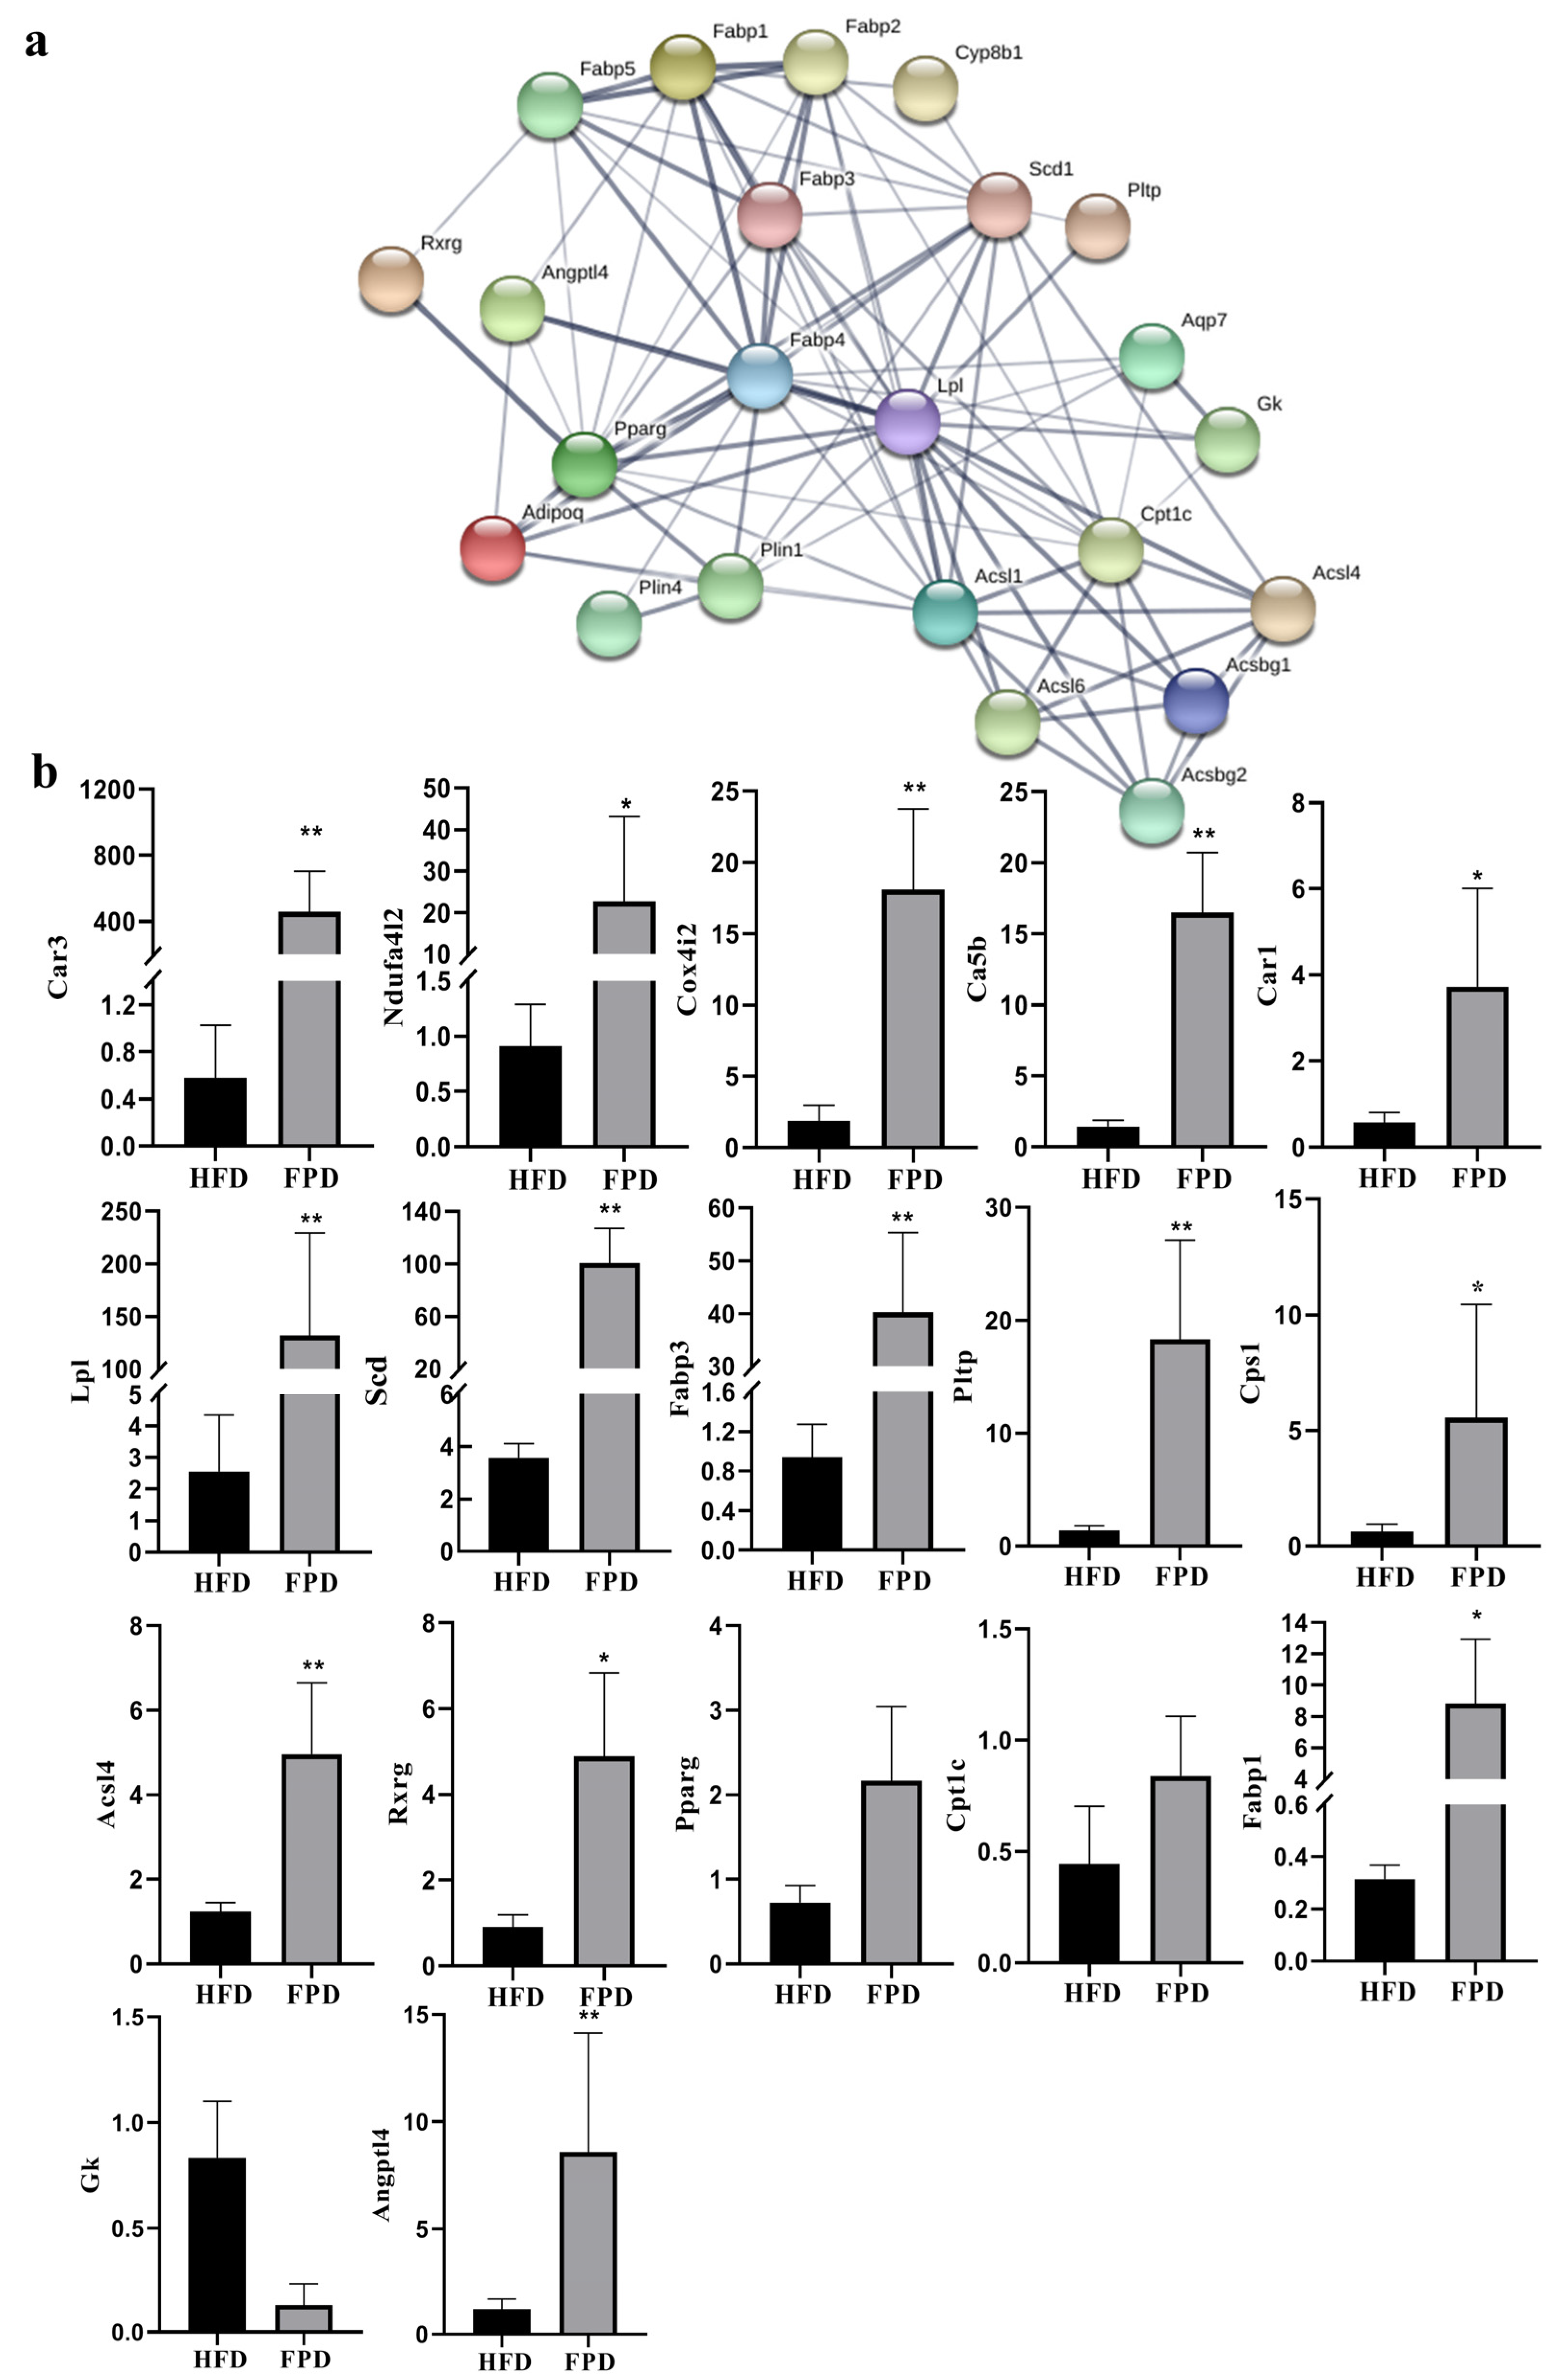
3.3. Verification of DEGs

To verify the results of transcriptome sequencing, 17 important DEGs were selected for qRT-PCR, and the results are shown in Figure 5b. The expression trends were consistent with those obtained by RNA-seq, indicating that the RNA-seq data reliably reflected the change in gene expression.

4. Discussion

This experiment investigated the gene expression of CETs affected by FP intervention in an obese rat model. Compared with Group HFD and Group FPD, 3785 DEGs were found after FP intervention, 15 of which were enriched in the energy-metabolism pathway. Furthermore, 23 DEGs in the PPAR-signaling pathway showed strong connection.

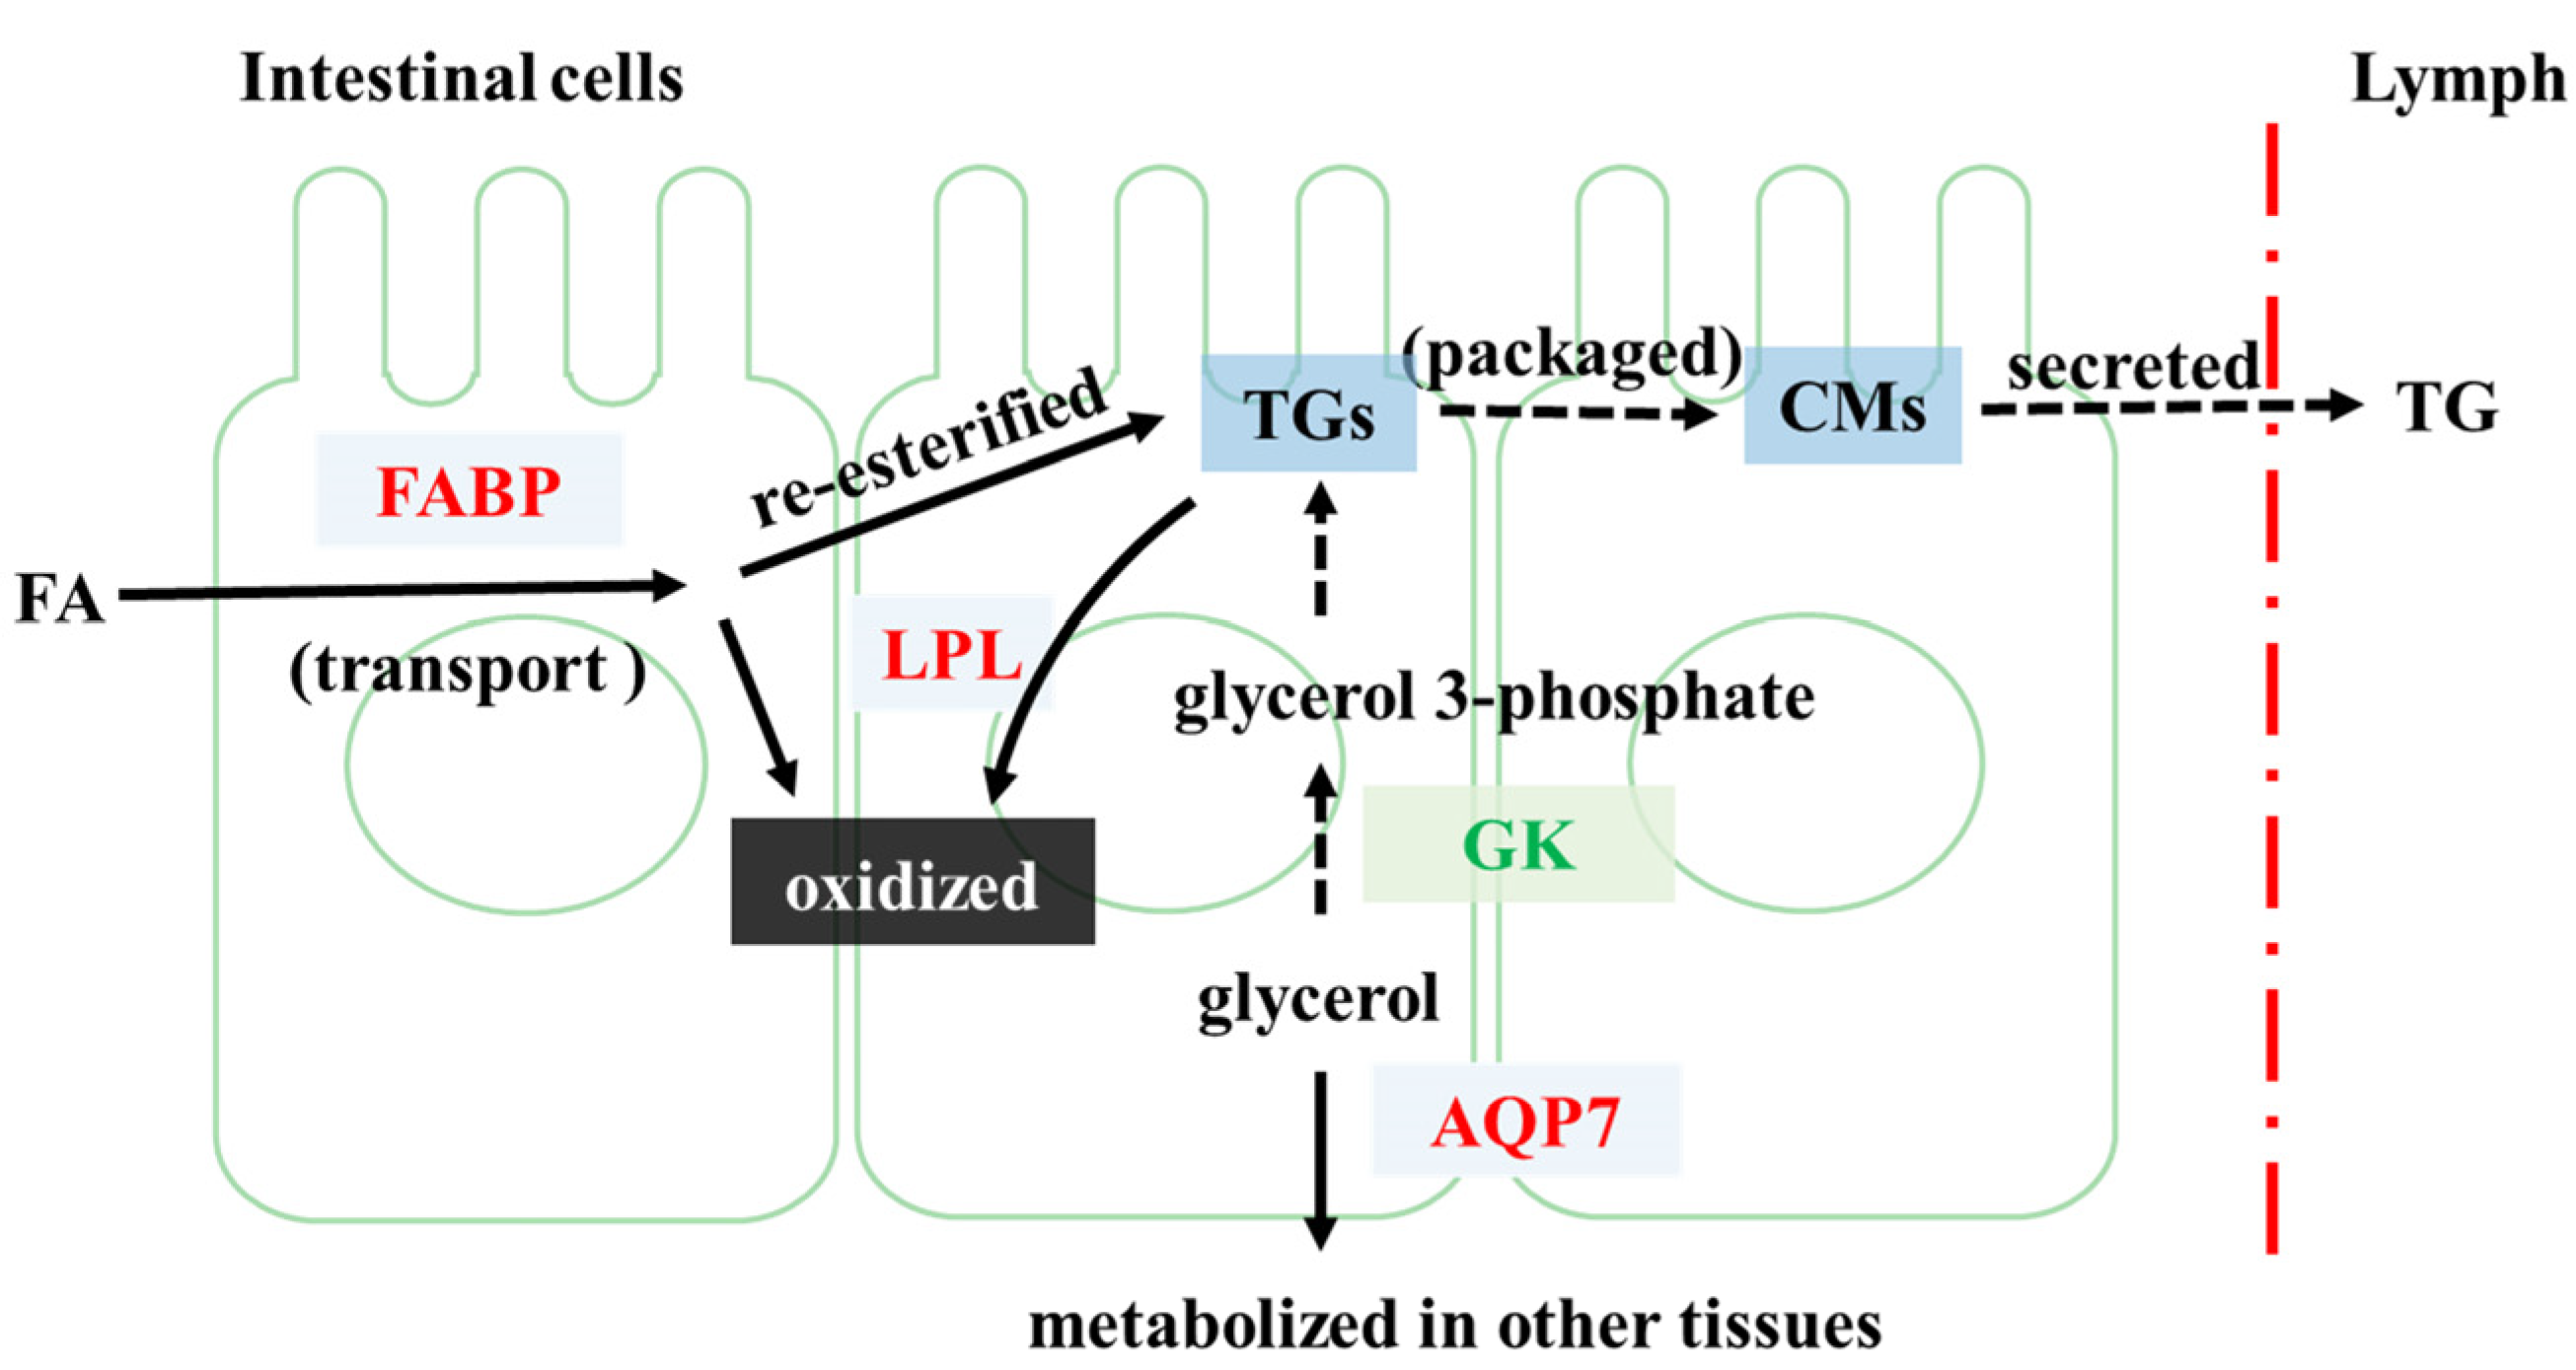
4.1. FP Intervention Regulated Lipid Metabolism of CETs

The potential mechanism by which FP intervention may alter lipid metabolism of CETs is shown in Figure 6. In our study, we found that FP intervention altered the expression of 10 genes related to lipid metabolism, namely Fabp1–5, Lpl, Gyk, Qqp7, Pparg, Rxrg, Acsl1, Acsl4, Acsl6 and Cpt1c. These genes play different roles in the process of lipid metabolism.
FP intervention upregulated the expression of Fabp1–5 and Lpl. FABPs mediate the transport of fatty acids (FAs) to different organelles [18]. Upon entry into intestinal cells, free FA and glycerol are metabolized or re-esterified into triglycerides (TG), which are secreted into the lymph after being packaged as chylomicrons [19]. The reduced clearance or increased yields of chylomicrons can lead to hypertriglyceridemia [20]. The processed Chylomicrons-TG can be metabolized at the tissue level through LPL, releasing FA for tissue uptake [21]. Thus, the upregulation of Lpl might inhibit the release of chylomicrons and the rise of plasma TG levels. In our previous study, it was found that the serum TG level of FP-fed rats was significantly lower than that of obese rats [13], which is consistent with our current inference.
FP intervention downregulated Gyk and upregulated Aqp7. Catalyzed by glycerol kinase, the product of glycerol, glycerol 3-phosphate, can be the main substrate in the synthesis of TG [22]. AQP7 facilitates the transport of glycerol across cell membranes [23]. Therefore, FP intervention might inhibit the synthesis of TG and facilitate the transport of glycerol that would be metabolized in other tissues.
It is also very important to accelerate the oxidation of FAs, which in turn helps to inhibit their re-esterification. In the present study, the upregulation of Pparg and Rxrg was found. Several prior studies have demonstrated that PPAR agonists can induce the expression of lipid oxidation genes [24]. The heterodimeric partners of PPARs include RXR [25]. Researchers found that the activation of PPARγ could control the pathway related to FA metabolism [19]. Thus, FP intervention might alter the transcription of genes related to lipid metabolism by enhancing the activation of PPARγ and RXR.
FP intervention upregulated Acsl1, Acsl4, Acsl6 and Cpt1c. ACSL catalyzes the form of acyl-coenzyme A (CoA), which enters the mitochondria matrix through the mediation of the CPT system [26,27]. Thus, FP intervention might promote the conversion of FA to acyl-CoA and the mitochondrial transport. FP intervention also upregulated Plin1, Adipoq, Angptl4 and Scd, which were found to play an important role in the prevention and regulation of inflammation [28,29,30,31]. Our previous study showed that, compared with obese rats, the serum inflammatory cytokines, including IL-6, TNF-α, and IL-1 β, were significantly decreased in FP-fed rats, which is in accordance with the inference that FP intervention can inhibit inflammation [13].
In general, the regulation of lipid metabolism by FP intervention may be mainly through the regulation of the PPAR-signaling pathway, thus stimulating FA oxidation and reducing inflammation.

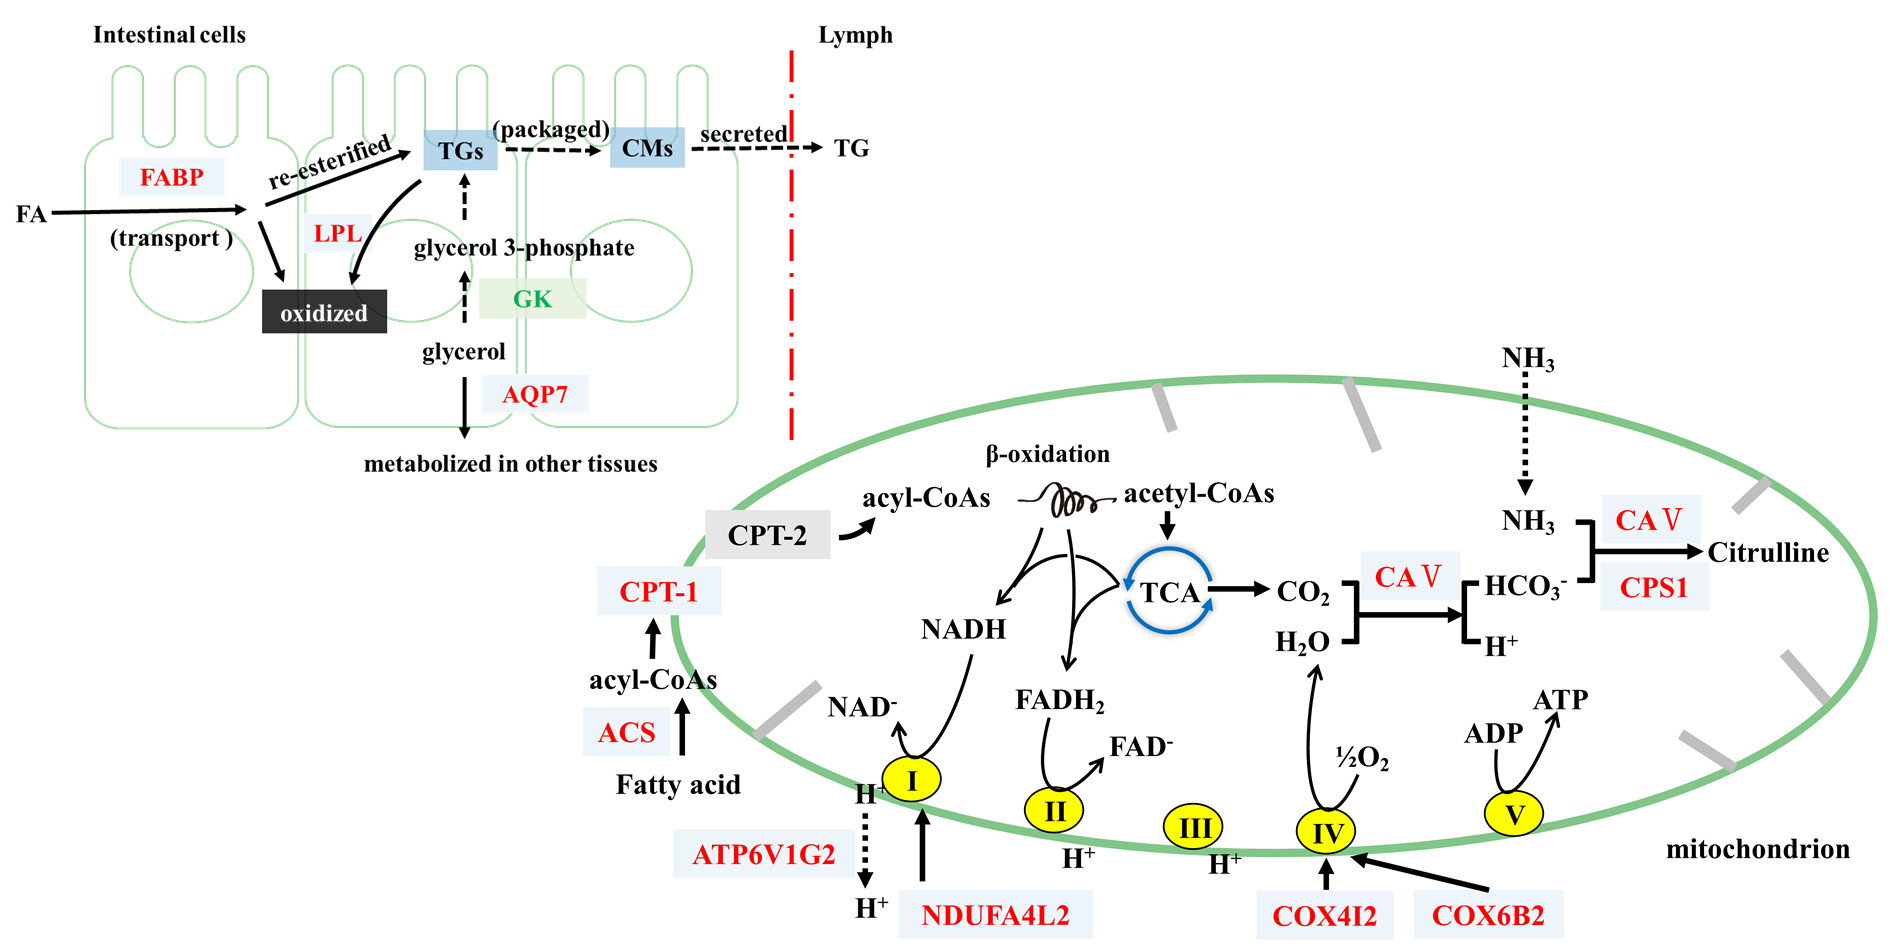
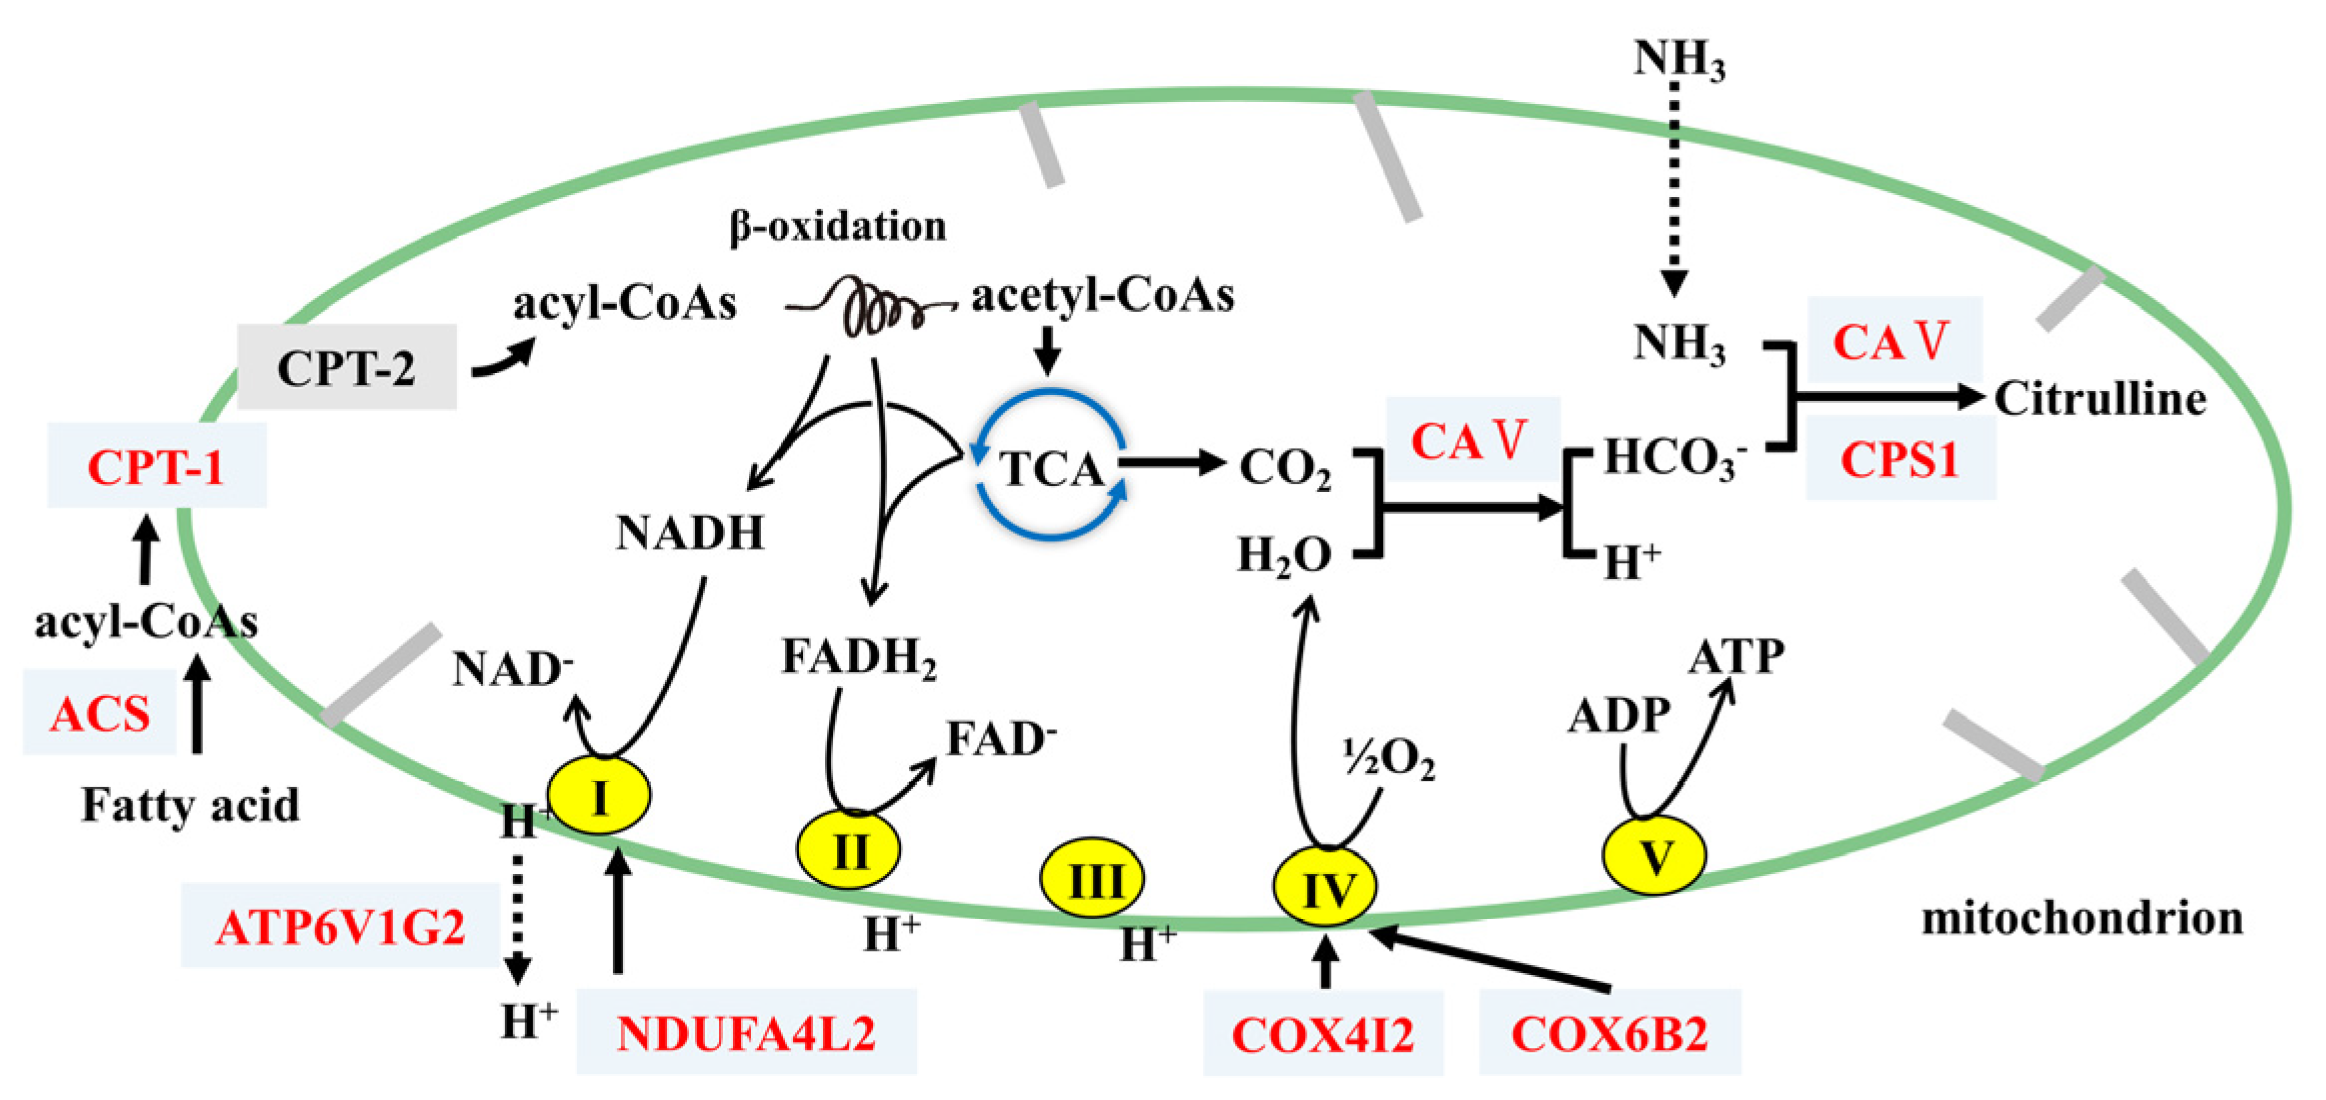
4.2. FP Intervention Regulated Energy Metabolism of CETs

The potential mechanism by which FP intervention may alter energy metabolism of CETs is shown in Figure 7. Many Carbonic anhydrases (CAs, including Car1–4, Ca5b, Car8 and Car12–14) were found to be upregulated, which catalyze the reaction of water to form protons and bicarbonate (H2O + CO2 Foods 11 01991 i001 H2CO3 Foods 11 01991 i001 HCO3 + H+) [32]. Thus, FP intervention upregulated CAs and might accelerate the consumption of CO2, reducing its accumulation in cells and enhancing the tricarboxylic acid (TCA) cycle. This would further increase energy consumption. We also found that the upregulation of Cps1, which participated in the metabolism of metabolic ammonia and HCO3 into citrulline with Ca5b, plays an important part in the detoxification of intestinal ammonia [33,34].
FP intervention upregulated Ndufa4l2, Cox6b2 and Atp6v1g2. Generated from the TCA cycle and β-oxidation, NADH and FADH2 provide electrons to the electron transport chain [35]. NDUFA4L2 was found to fine-tune the activity of complex I, and COX6B2 promoted the assembly of complex IV [36,37]. V1 of ATP6V1G2 contains the sites of ATP hydrolysis [38]. Thus, FP intervention might help to accelerate the generation of ATP, stimulate energy consumption and hydrolyze ATP to provide energy for H+ transport.
FP intervention upregulated Ndufa4l2 and Cox4i2. As the TCAs progress and oxygen consumption in the electron transport chain increases, however, the oxygen concentration in the CETs decreases. The mitochondria in the cells consume large amounts of oxygen, and oxidative phosphorylation adapts to hypoxia through the remodeling of electron transport chain [39]. NDUFA4L2 and COX4I2 can decrease mitochondrial oxygen consumption through reducing the activity of complex I and complex IV, respectively [40]. Thus, FP intervention might help prevent mitochondria from hypoxia, which keeps the energy expenditure steady.
As described above, the Adipoq gene of CETs that encodes adiponectin was upregulated. Playing an important role in the regulation of glucose and lipid metabolism, adiponectin increases insulin sensitivity and improves systemic lipid metabolism [41]. The decrease in adiponectin level in circulation in cases of obesity is widely related to various obesity-related diseases [42]. In previous research, we found that FP intervention significantly upregulated adiponectin, probably via the gut–brain axis [13]. The gut–brain axis also plays a key role in the control of energy balance [43]. Thus, the regulation of energy metabolism and lipid metabolism under FP intervention might be achieved through the gut–brain axis.
The relationship between dietary fiber and gene expression of the intestinal tract has been reported. For example, it was found that polyglucose regulated intestinal gene expression, upregulating an important regulator of triglyceride named FXR [44]. Furthermore, inulin fiber upregulated peptide YY and proglucagon transcripts in the colon of rats [45]. However, to our knowledge, whether the expression of colonic genes affected by FP is related to lipid metabolism and energy metabolism has not been studied. In this research, potential mechanisms are proposed, and genes that promote FA oxidation are clustered in the PPAR-signaling pathway, and genes that promote further energy metabolism are clustered in the energy-metabolism pathway.
Interestingly, there were only 28 DEGs between Group Con and Group HFD. Diet is able to modulate gene expression [46]. After the model of obese rats was successfully established by feeding rats with a high-fat diet, the gene expression of obese rats in Group HFD changed. This is the reason why they continued to develop and maintain the obesity phenotype after stopping the high-fat diet. After the obesity model was successfully established, Group Con and Group HFD were fed the same control diet, which made the gene expression of the two groups close.
The limitation of this study is that the regulation of genes related to lipid metabolism and energy metabolism in CETs by FP cannot be extended to the change in systemic metabolism. However, it provides insights into the gene expression changes of CETs associated with FP intervention and helps to understand the interaction between obesity, CETs and FP.

5. Conclusions

FP intervention altered the gene expression in CETs, regulating lipid metabolism and energy metabolism. By altering the gene expression of the PPAR-signaling pathway, FP intervention might accelerate FA catabolism and reduce inflammation. By regulating energy metabolism, FP intervention might facilitate the transformation of FA oxidation products to ATP. As shown here, this study offers novel hypotheses that the anti-obesity effect of FP might be closely related to the regulation of some key genes in CETs, which play an important role in lipid metabolism and energy metabolism.

Author Contributions

Writing—original draft preparation, X.L.; writing—review and editing, X.P.; supervision, X.P.; project administration, L.L.; funding acquisition, H.W. All authors have read and agreed to the published version of the manuscript.

Funding

This research was funded by Open Fund of State Key Laboratory of Food Science and Technology of Nanchang University (No. SKLF-KF-201818).

Institutional Review Board Statement

The animal study protocol was approved by the Institutional Review Board (or Ethics Committee) of the Institutional Animal Care Committee of Jinan University (protocol code: 20190312-24, approved on 12 March 2019).

Informed Consent Statement

Not applicable.

Data Availability Statement

Not applicable.

Acknowledgments

We thank Bing Yu, Ruixia Qiu and Shulin Deng from the Department of Food Science and Engineering, Jinan University, for their valuable contribution to the experiments in this research.

Conflicts of Interest

The authors declare no conflict of interest.

References

  1. Hill, J.O. Understanding and addressing the epidemic of obesity: An energy balance perspective. Endocr. Rev. 2006, 27, 750–761. [Google Scholar] [CrossRef] [PubMed] [Green Version]
  2. Kim, B.; Choi, H.-N.; Yim, J.-E. Effect of diet on the gut microbiota associated with obesity. J. Obes. Metab. Syndr. 2019, 28, 216. [Google Scholar] [CrossRef] [Green Version]
  3. Pi-Sunyer, F.X. The obesity epidemic: Pathophysiology and consequences of obesity. Obes. Res. 2002, 10, 97S–104S. [Google Scholar] [CrossRef]
  4. Han, S.-F.; Jiao, J.; Zhang, W.; Xu, J.-Y.; Zhang, W.; Fu, C.-L.; Qin, L.-Q. Lipolysis and thermogenesis in adipose tissues as new potential mechanisms for metabolic benefits of dietary fiber. Nutrition 2017, 33, 118–124. [Google Scholar] [CrossRef] [PubMed]
  5. Xu, C.; Liu, J.; Gao, J.; Wu, X.; Cui, C.; Wei, H.; Zheng, R.; Peng, J. Combined soluble fiber-mediated intestinal microbiota improve insulin sensitivity of obese mice. Nutrients 2020, 12, 351. [Google Scholar] [CrossRef] [Green Version]
  6. Papathanasopoulos, A.; Camilleri, M. Dietary fiber supplements: Effects in obesity and metabolic syndrome and relationship to gastrointestinal functions. Gastroenterology 2010, 138, 65–72.e62. [Google Scholar] [CrossRef] [PubMed] [Green Version]
  7. Lange, K.; Hugenholtz, F.; Jonathan, M.C.; Schols, H.A.; Kleerebezem, M.; Smidt, H.; Müller, M.; Hooiveld, G.J. Comparison of the effects of five dietary fibers on mucosal transcriptional profiles, and luminal microbiota composition and SCFA concentrations in murine colon. Mol. Nutr. Food Res. 2015, 59, 1590–1602. [Google Scholar] [CrossRef]
  8. Bäckhed, F.; Manchester, J.K.; Semenkovich, C.F.; Gordon, J.I. Mechanisms underlying the resistance to diet-induced obesity in germ-free mice. Proc. Natl. Acad. Sci. USA 2007, 104, 979–984. [Google Scholar] [CrossRef] [Green Version]
  9. Safdar, B.; Pang, Z.; Liu, X.; Jatoi, M.A.; Mehmood, A.; Rashid, M.T.; Ali, N.; Naveed, M. Flaxseed gum: Extraction, bioactive composition, structural characterization, and its potential antioxidant activity. J. Food Biochem. 2019, 43, e13014. [Google Scholar] [CrossRef]
  10. Zhou, X.; Zhang, Z.; Huang, F.; Yang, C.; Huang, Q. In Vitro Digestion and Fermentation by Human Fecal Microbiota of Polysaccharides from Flaxseed. Molecules 2020, 25, 4354. [Google Scholar] [CrossRef]
  11. Yu, J.; Hu, Q.; Liu, J.; Luo, J.; Liu, L.; Peng, X. Metabolites of gut microbiota fermenting Poria cocos polysaccharide alleviates chronic nonbacterial prostatitis in rats. Int. J. Biol. Macromol. 2022, 209 Pt B, 1593–1604. [Google Scholar] [CrossRef]
  12. Luo, J.; Li, Y.; Mai, Y.; Gao, L.; Ou, S.; Wang, Y.; Liu, L.; Peng, X. Flaxseed gum reduces body weight by regulating gut microbiota. J. Funct. Foods 2018, 47, 136–142. [Google Scholar] [CrossRef]
  13. Luo, J.; Qi, J.; Wang, W.; Luo, Z.; Liu, L.; Zhang, G.; Zhou, Q.; Liu, J.; Peng, X. Antiobesity effect of flaxseed polysaccharide via inducing satiety due to leptin resistance removal and promoting lipid metabolism through the AMP-activated protein kinase (AMPK) signaling pathway. J. Agric. Food Chem. 2019, 67, 7040–7049. [Google Scholar] [CrossRef] [PubMed]
  14. Li, X.F. Purification, Structural Analysis and Its Macrophage Immunomodulatory and Anti-Hepatitis B Virus Activities. Master’s Thesis, Jinan University, Jinan, China, 2016. [Google Scholar]
  15. Zhang, C.; Xie, J.; Li, X.; Luo, J.; Huang, X.; Liu, L.; Peng, X. Alliin alters gut microbiota and gene expression of colonic epithelial tissues. J. Food Biochem. 2019, 43, e12795. [Google Scholar] [CrossRef] [PubMed]
  16. Li, S.C.; Xuan, Y.P.; Gao, B.; Sun, X.; Miao, S.C.; Lu, T.; Wang, Y.Y.; Jiao, W.J. Identification of an eight-gene prognostic signature for lung adenocarcinoma. Cancer Manag. Res. 2018, 10, 3383–3392. [Google Scholar] [CrossRef] [PubMed] [Green Version]
  17. Yan, H.; Fei, N.; Wu, G.; Zhang, C.; Zhao, L.; Zhang, M. Regulated inflammation and lipid metabolism in colon mRNA expressions of obese germfree mice responding to Enterobacter cloacae B29 combined with the high fat diet. Front. Microbiol. 2016, 7, 1786. [Google Scholar] [CrossRef] [Green Version]
  18. Amiri, M.; Yousefnia, S.; Forootan, F.S.; Peymani, M.; Ghaedi, K.; Esfahani, M.H.N. Diverse roles of fatty acid binding proteins (FABPs) in development and pathogenesis of cancers. Gene 2018, 676, 171–183. [Google Scholar] [CrossRef]
  19. Duszka, K.; Oresic, M.; Le May, C.; König, J.; Wahli, W. PPARγ modulates long chain fatty acid processing in the intestinal epithelium. Int. J. Mol. Sci. 2017, 18, 2559. [Google Scholar] [CrossRef] [Green Version]
  20. Demignot, S.; Beilstein, F.; Morel, E. Triglyceride-rich lipoproteins and cytosolic lipid droplets in enterocytes: Key players in intestinal physiology and metabolic disorders. Biochimie 2014, 96, 48–55. [Google Scholar] [CrossRef] [Green Version]
  21. Lambert, J.E.; Parks, E.J. Postprandial metabolism of meal triglyceride in humans. Biochim. Biophys. Acta (BBA)-Mol. Cell Biol. Lipids 2012, 1821, 721–726. [Google Scholar] [CrossRef] [Green Version]
  22. Xu, T.; Li, J.; Zou, J.; Qiu, B.; Liu, W.; Lin, X.; Li, D.; Liu, Z.; Du, F. Rat Small Intestinal Mucosal Epithelial Cells Absorb Dietary 1, 3-Diacylglycerol Via Phosphatidic Acid Pathways. Lipids 2018, 53, 335–344. [Google Scholar] [CrossRef] [PubMed]
  23. Iena, F.M.; Lebeck, J. Implications of aquaglyceroporin 7 in energy metabolism. Int. J. Mol. Sci. 2018, 19, 154. [Google Scholar] [CrossRef] [PubMed] [Green Version]
  24. Dávalos-Salas, M.; Montgomery, M.K.; Reehorst, C.M.; Nightingale, R.; Ng, I.; Anderton, H.; Al-Obaidi, S.; Lesmana, A.; Scott, C.M.; Ioannidis, P. Deletion of intestinal Hdac3 remodels the lipidome of enterocytes and protects mice from diet-induced obesity. Nat. Commun. 2019, 10, 1–14. [Google Scholar] [CrossRef] [PubMed] [Green Version]
  25. Nakamura, M.T.; Yudell, B.E.; Loor, J.J. Regulation of energy metabolism by long-chain fatty acids. Prog. Lipid Res. 2014, 53, 124–144. [Google Scholar] [CrossRef]
  26. Dai, J.; Liang, K.; Zhao, S.; Jia, W.; Liu, Y.; Wu, H.; Lv, J.; Cao, C.; Chen, T.; Zhuang, S. Chemoproteomics reveals baicalin activates hepatic CPT1 to ameliorate diet-induced obesity and hepatic steatosis. Proc. Natl. Acad. Sci. USA 2018, 115, E5896–E5905. [Google Scholar] [CrossRef] [Green Version]
  27. Kuwata, H.; Nakatani, E.; Shimbara-Matsubayashi, S.; Ishikawa, F.; Shibanuma, M.; Sasaki, Y.; Yoda, E.; Nakatani, Y.; Hara, S. Long-chain acyl-CoA synthetase 4 participates in the formation of highly unsaturated fatty acid-containing phospholipids in murine macrophages. Biochim. Biophys. Acta (BBA)-Mol. Cell Biol. Lipids 2019, 1864, 1606–1618. [Google Scholar] [CrossRef]
  28. Ducheix, S.; Peres, C.; Härdfeldt, J.; Frau, C.; Mocciaro, G.; Piccinin, E.; Lobaccaro, J.-M.; De Santis, S.; Chieppa, M.; Bertrand-Michel, J. Deletion of stearoyl-CoA desaturase-1 from the intestinal epithelium promotes inflammation and tumorigenesis, reversed by dietary oleate. Gastroenterology 2018, 155, 1524–1538.e1529. [Google Scholar] [CrossRef]
  29. Phua, T.; Sng, M.K.; Tan, E.H.P.; Chee, D.S.L.; Li, Y.; Wee, J.W.K.; Teo, Z.; Chan, J.S.K.; Lim, M.M.K.; Tan, C.K. Angiopoietin-like 4 mediates colonic inflammation by regulating chemokine transcript stability via tristetraprolin. Sci. Rep. 2017, 7, 1–16. [Google Scholar]
  30. Smetnev, S.; Klimushina, M.; Kutsenko, V.; Kiseleva, A.; Gumanova, N.; Kots, A.; Skirko, O.; Ershova, A.; Yarovaya, E.; Metelskaya, V. Associations of SNPs of the ADIPOQ Gene with Serum Adiponectin Levels, Unstable Angina, and Coronary Artery Disease. Biomolecules 2019, 9, 537. [Google Scholar] [CrossRef] [Green Version]
  31. Sohn, J.H.; Lee, Y.K.; Han, J.S.; Jeon, Y.G.; Kim, J.I.; Choe, S.S.; Kim, S.J.; Yoo, H.J.; Kim, J.B. Perilipin 1 (Plin1) deficiency promotes inflammatory responses in lean adipose tissue through lipid dysregulation. J. Biol. Chem. 2018, 293, 13974–13988. [Google Scholar] [CrossRef] [Green Version]
  32. Renner, S.W.; Walker, L.M.; Forsberg, L.J.; Sexton, J.Z.; Brenman, J.E. Carbonic anhydrase III (Car3) is not required for fatty acid synthesis and does not protect against high-fat diet induced obesity in mice. PLoS ONE 2017, 12, e0176502. [Google Scholar]
  33. Saarnio, J.; Parkkila, S.; Parkkila, A.-K.; Waheed, A.; Karttunen, T.; Sly, W.S. Cell-specific expression of mitochondrial carbonic anhydrase in the human and rat gastrointestinal tract. J. Histochem. Cytochem. 1999, 47, 517–524. [Google Scholar] [CrossRef] [PubMed] [Green Version]
  34. Tillman, J.B.; Dhahbi, J.M.; Mote, P.L.; Walford, R.L.; Spindler, S.R. Dietary calorie restriction in mice induces carbamyl phosphate synthetase I gene transcription tissue specifically. J. Biol. Chem. 1996, 271, 3500–3506. [Google Scholar] [CrossRef] [PubMed] [Green Version]
  35. Weinberg, S.E.; Sena, L.A.; Chandel, N.S. Mitochondria in the regulation of innate and adaptive immunity. Immunity 2015, 42, 406–417. [Google Scholar] [CrossRef] [PubMed] [Green Version]
  36. Meng, L.; Yang, X.; Xie, X.; Wang, M. Mitochondrial NDUFA4L2 protein promotes the vitality of lung cancer cells by repressing oxidative stress. Thorac. Cancer 2019, 10, 676–685. [Google Scholar] [CrossRef] [PubMed]
  37. Nie, K.; Li, J.; He, X.; Wang, Y.; Zhao, Q.; Du, M.; Sun, H.; Wang, J.; Lyu, J.; Fang, H. COX6B2 drives metabolic reprogramming toward oxidative phosphorylation to promote metastasis in pancreatic ductal cancer cells. Oncogenesis 2020, 9, 1–13. [Google Scholar] [CrossRef]
  38. Kane, P.M. Targeting reversible disassembly as a mechanism of controlling V-ATPase activity. Curr. Protein Pept. Sci. 2012, 13, 117–123. [Google Scholar] [CrossRef]
  39. Fuhrmann, D.C.; Brüne, B. Mitochondrial composition and function under the control of hypoxia. Redox Biol. 2017, 12, 208–215. [Google Scholar] [CrossRef]
  40. Evans, A.M.; Mahmoud, A.D.; Moral-Sanz, J.; Hartmann, S. The emerging role of AMPK in the regulation of breathing and oxygen supply. Biochem. J. 2016, 473, 2561–2572. [Google Scholar] [CrossRef] [Green Version]
  41. Adiyaman, S.C.; Ozer, M.; Saydam, B.O.; Akinci, B. The Role of Adiponectin in Maintaining Metabolic Homeostasis. Curr. Diabetes Rev. 2020, 16, 95–103. [Google Scholar] [CrossRef]
  42. Ohashi, K.; Yuasa, D.; Shibata, R.; Murohara, T.; Ouchi, N. Adiponectin as a Target in Obesity-related Inflammatory State. Endocr. Metab. Immune Disord. Drug Targets 2015, 15, 145–150. [Google Scholar] [CrossRef] [PubMed]
  43. Guan, X. The CNS glucagon-like peptide-2 receptor in the control of energy balance and glucose homeostasis. Am. J. Physiol.-Regul. Integr. Comp. Physiol. 2014, 307, R585–R596. [Google Scholar] [CrossRef] [PubMed] [Green Version]
  44. Raza, G.S.; Putaala, H.; Hibberd, A.A.; Alhoniemi, E.; Tiihonen, K.; Mäkelä, K.A.; Herzig, K.-H. Polydextrose changes the gut microbiome and attenuates fasting triglyceride and cholesterol levels in Western diet fed mice. Sci. Rep. 2017, 7, 1–11. [Google Scholar] [CrossRef] [PubMed] [Green Version]
  45. Singh, A.; Zapata, R.C.; Pezeshki, A.; Reidelberger, R.D.; Chelikani, P.K. Inulin fiber dose-dependently modulates energy balance, glucose tolerance, gut microbiota, hormones and diet preference in high-fat-fed male rats. J. Nutr. Biochem. 2018, 59, 142–152. [Google Scholar] [CrossRef]
  46. Franzago, M.; Santurbano, D.; Vitacolonna, E.; Stuppia, L. Genes and Diet in the Prevention of Chronic Diseases in Future Generations. Int. J. Mol. Sci. 2020, 21, 2633. [Google Scholar] [CrossRef]
Figure 1. Percentage of weight loss in Group FPD compared with Group HFD. In Group FPD, rats were fed D12492 during the establishment of the obesity model and then fed an FP-containing diet; in Group HFD, rats were fed D12492 during the establishment of the obesity model and then fed AIN-93M.
Foods 11 01991 g001
Figure 2. FP changed the profile of gene expression in CETs. (a) Venn diagram of genes; (b) Principal Component Analysis of genes; (c) DEGs between Group Con and Group HFD; (d) DEGs between Group Con and Group FPD; (e) DEGs between Group HFD and Group FPD. CETs, colonic epithelial tissues; DEGs, differentially expressed genes; Con, Group Con, rats were fed D12450B during the establishment of the obesity model and then fed AIN-93M; FPD, Group FPD, rats were fed D12492 during the establishment of the obesity model and then fed an FP-containing diet; HFD, Group HFD, rats were fed D12492 during the establishment of the obesity model and then fed AIN-93M.
Foods 11 01991 g002
Figure 3. Changes in intestinal functions between Group HFD and Group FPD. HFD, Group HFD, rats were fed D12492 during the establishment of the obesity model and then fed AIN-93M; FPD, Group FPD, rats were fed D12492 during the establishment of the obesity model and then fed an FP-containing diet.
Foods 11 01991 g003
Figure 4. Changes in intestinal functions between Group HFD and Group FPD. (a) the top 10 ranked KEGG pathways of DEGs in ‘energy metabolism’; (b) the top 10 ranked KEGG pathways of DEGs in the PPAR-signaling pathway. HFD, Group HFD, rats were fed D12492 during the establishment of the obesity model and then fed AIN-93M; FPD, Group FPD, rats were fed D12492 during the establishment of the obesity model and then fed an FP-containing diet.
Foods 11 01991 g004
Figure 5. PPI network and qRT-PCR verification of DEGs. (a) PPI network of 23 DEGs in the PPAR-signaling pathway. The nodes represent the proteins (genes), and the edges represent the interactions of proteins; (b) qRT-PCR verification of DEGs in the PPAR-signaling pathway and energy-metabolism pathway. ** means p < 0.01. * means p < 0.05. DEGs, differentially expressed genes; HFD, Group HFD, rats were fed D12492 during the establishment of the obesity model and then fed AIN-93M; FPD, Group FPD, rats were fed D12492 during the establishment of the obesity model and then fed an FP-containing diet.
Foods 11 01991 g005
Figure 6. Potential regulatory mechanism by which FP may alter genes related to lipid metabolism in CETs. FP intervention upregulates FABP and LPL, promoting the transport of FA in CETs and re-oxidation and decomposition of the re-esterified TGs, which might help to reduce the secretion of TG to Lymph. GK is downregulated, reducing the conversion of glycerol to TG synthesis substrate. AQP7 is upregulated, promoting the transfer and metabolism of glycerol to other tissues. Note that proteins in red represent upregulation in group FPD compared with group HFD, while those in green indicate downregulation.
Foods 11 01991 g006
Figure 7. Potential regulatory mechanism by which FP may alter genes related to mitochondrial energy metabolism in CETs. FP upregulated ACS and CPT-1, promoting the conversion of FA to acyl-CoA and the transfer into mitochondria for β-oxidation and the TCA cycle where CO2, NADH and FADH2 are produced. Related proteins of complexes I and IV are upregulated, promoting oxidative phosphorylation and generated H2O. CA V catalyzes H2O and CO2 into HCO3, and then co-catalyzes for the conversion of NH3 and HCO3 to Citrulline with CPS1. Note that proteins in red represent upregulation in group FPD compared with group HFD, while those in black indicate no significant changes.
Foods 11 01991 g007
Table 1. Detailed recipes of each diet (%).
IngredientsStandard
Diet
(D12450B)
High-Fat
Diet
(D12492)
Control
Diet
(AIN-93M)
Flaxseed
Polysaccharide
Diet
flaxseed polysaccharide0.000.000.0010.00
corn starch33.000.0046.5736.57
dextrin3.3516.3515.5015.50
casein19.1326.1714.0014.00
sucrose34.479.0010.0010.00
cellulose4.786.545.005.00
soybean oil2.393.274.004.00
lard1.9132.060.000.00
mineral mix ain-933.354.583.503.50
vitamin mix ain-930.961.311.001.00
L-cystine0.290.390.180.18
choline bitartrate0.240.330.250.25
Table 2. Sequences of the PCR primers used in gene expression studies.
GeneAccession NumberF/PSequence (5′-3′)Product Length
β-actinNM_031144.3Forward PrimerATTGCTGACAGGATGCAGAA109 bp
Reverse PrimerTAGAGCCACCAATCCACACAG
PpargNM_013124.3Forward PrimerGTCTCACAATGCCATCAGGT87 bp
Reverse PrimerAGCTGGTCGATATCACTGGA
Fabp1NM_012556.2Forward PrimerCCAAGAGAACTTTGAGCCCT151 bp
Reverse PrimerATTGTGGATCACCTTGGACC
RxrgNM_031765.1Forward PrimerATCCCAGCTACACAGATACCC111 bp
Reverse PrimerGACCCATGGCAGAAGTGATG
Cpt1cNM_001034925.2Forward PrimerGTCTTCACTCAGTTCCGACG117 bp
Reverse PrimerAAGTCATTCCAGACACGCC
PltpNM_001168543.1Forward PrimerTTGTACCATCAAGCCGTCAG89 bp
Reverse PrimerGCTCGACTTCAGGCATTGTA
Ca5bNM_001005551.2Forward PrimerCTTGAACAGTTTCGGACCCT103 bp
Reverse PrimerGGACAGTGCGATTCATCAGA
Cps1NM_017072.2Forward PrimerAGCCGTTGTTTGGAATCAGT80 bp
Reverse PrimerGGCCATGGACATCTTGTAGG
ScdNM_139192.2Forward PrimerCGTCAGCACCTTCTTGAGATA168 bp
Reverse PrimerGCGTGATGGTAGTTGTGGAA
Angptl4NM_199115.2Forward PrimerCCACCAATGTTTCCCCCAAT92 bp
Reverse PrimerGCTCTTGGCACAGTTAAGGT
Fabp3NM_024162.2Forward PrimerGCTGGGAGTAGAGTTTGACG139 bp
Reverse PrimerCCCATCACTTAGTTCCCGTG
Car1NM_001107660.1Forward PrimerGTCCTGACCAATGGAGCAAA92 bp
Reverse PrimerGGAATCATGTTTGGCTTCGC
GkNM_024381.2Forward PrimerATGGCCTAATGAAAGCTGGG222 bp
Reverse PrimerCAGGTTTGTCTCTGCCAAGT
Ndufa4l2NM_001271272.1Forward PrimerATGGCAGGAACCAGTCTAGG79 bp
Reverse PrimerTGAAGCCGATCATTGGGATG
Cox4i2NM_053472.1Forward PrimerTTCGCAGAGATGAACCATCG87 bp
Reverse PrimerAATCACCAGAGCCGTGAATC
LplNM_012598.2Forward PrimerTTGGCTCCAGAGTTTGAC145 bp
Reverse PrimerTGCTAATCCAGGAATCAGA
Acsl4NM_053623.1Forward PrimerCCGAGTGAATAACTTTGGA200 bp
Reverse PrimerAGGAAGCCTCAGACTCAT
Car3NM_019292.4Forward PrimerGCTCTGCTAAGACCATCC117 bp
Reverse PrimerATTGGCGAAGTCGGTAGG
Table 3. Information of three KEGG pathways and DEGs enriched.
KEGG PathwayGene NameGene DescriptionRegulation
Oxidative phosphorylationNdufa4l2NDUFA4, mitochondrial complex associated like 2Upregulated
Atp6v1g2ATPase H+ transporting V1 subunit G2Upregulated
Cox4i2cytochrome c oxidase subunit 4i2Upregulated
Cox6b2cytochrome c oxidase subunit VI b polypeptide 2Upregulated
Nitrogen metabolismCps1carbamoyl-phosphate synthase 1Upregulated
Car3carbonic anhydrase 3Upregulated
Car1carbonic anhydrase IUpregulated
Ca5bcarbonic anhydrase 5BUpregulated
Car8carbonic anhydrase 8Upregulated
Car13carbonic anhydrase 13Upregulated
Car2carbonic anhydrase 2Upregulated
Car12carbonic anhydrase 12Upregulated
Car14carbonic anhydrase 14Upregulated
Car4carbonic anhydrase 4Upregulated
PPAR-signaling pathwayPlin4perilipin 4Upregulated
Fabp1fatty acid binding protein 1Upregulated
Fabp3fatty acid binding protein 3Upregulated
Cyp8b1cytochrome P450, family 8, subfamily b, polypeptide 1Upregulated
Scdstearoyl-CoA desaturaseUpregulated
Fabp4fatty acid binding protein 4Upregulated
Lpllipoprotein lipaseUpregulated
Acsl6acyl-CoA synthetase long-chain family member 6Upregulated
Plin1perilipin 1Upregulated
Pltpphospholipid transfer proteinUpregulated
Angptl4angiopoietin-like 4Upregulated
Rxrgretinoid X receptor gammaUpregulated
Adipoqadiponectin, C1Q and collagen domain containingUpregulated
Acsbg2acyl-CoA synthetase bubblegum family member 2Upregulated
Fabp5fatty acid binding protein 5, epidermalUpregulated
Fabp2fatty acid binding protein 2Upregulated
Aqp7aquaporin 7Upregulated
Cpt1ccarnitine palmitoyl transferase 1cUpregulated
Acsl4acyl-CoA synthetase long-chain family member 4Upregulated
Ppargperoxisome proliferator-activated receptor gammaUpregulated
Publisher’s Note: MDPI stays neutral with regard to jurisdictional claims in published maps and institutional affiliations.

