Article

Characterization of Key Odor-Active Compounds in Sun-Dried Black Tea by Sensory and Instrumental-Directed Flavor Analysis

1
College of Tea (Pu’ er), West Yunnan University of Applied Sciences, Pu’er 665000, China
2
Pu’er Institute of Pu-erh Tea, Pu’er 665000, China
3
Key Laboratory of Tea Science of Ministry of Education, Hunan Agricultural University, Changsha 410128, China
*
Author to whom correspondence should be addressed.
Foods 2022, 11(12), 1740; https://doi.org/10.3390/foods11121740
Submission received: 26 April 2022 / Revised: 4 June 2022 / Accepted: 7 June 2022 / Published: 14 June 2022
(This article belongs to the Special Issue Microbiological Safety and Quality of Fermented Products)

Abstract

:
The aroma profile of sun-dried black tea (SBT) was identified by headspace solid–phase microextraction (HS–SPME) coupled with gas chromatography–mass spectrometry (GC–MS) and gas chromatography–olfactometry (GC–O). A total of 37 scents were captured by using the GC–O technique, and 35 scents with odor intensities ranging from 1.09 ± 1.93 to 9.91 ± 0.29 were identified. Twenty-one compounds were further identified as key odor-active compounds with odor activity values (OAVs) greater than or equal to one. These key odor-active compounds were restructured with their detected concentrations, and the aroma profile of the selected SBT sample was successfully imitated to a certain extent. An omission test was performed by designing 25 models and confirmed that (E)-β-damascenone, β-ionone, dihydro-β-ionone, linalool, and geraniol were the key odor-active compounds for the aroma profile of SBT. Meanwhile, phenylethyl alcohol, (E)-2-decenal, hexanal, and methyl salicylate were also important to the aroma profile of SBT. This study can provide theoretical support for the improvement of the aroma quality of sun-dried black tea.

1. Introduction

Tea has many kinds of health benefits. As a beverage, the consumption of tea ranks second only to water in the world [1]. Tea aroma is a prime criterion when evaluating tea quality, and it is also an important basis for consumers to choose. The formation of the tea aroma profile is the result of the comprehensive action of a variety of volatile compounds with different concentrations [2]. With the development and application of gas chromatography–mass spectrometry (GC–MS), more than 600 volatile compounds have been separated and identified in teas [3]. However, it is well known that not all volatile compounds have odors and contribute to the aromatic quality of finished product teas, and only a few of these compounds emit a scent and play a decisive role in the aroma profile of finished product teas, which are defined as the key odor-active compounds [4]. These odor-active compounds account for a small proportion of the complex volatile compounds, but they can dominate the overall aroma of teas. At present, how to effectively separate and identify these key odor-active compounds has become the focus of tea aroma research because the identification of key odor-active compounds in teas will have theoretical guidance for improving the aroma quality.
Sun-dried black tea (SBT), a kind of tea that evolved from Dianhong tea, is between Dianhong and Pu-erh tea, closer to Dianhong tea [5]. SBT is made from the leaves of mature “broad leaf tea” trees (Camellia sinensis [L.] O. Kuntze var. assamica [Mast.] Kitamura) through withering, rolling, fermentation, sun-drying, and other processes [6]. The difference between the processing of SBT and Dianhong tea is that, after withering, rolling, and fermentation SBT is dried naturally by sunlight, while Dianhong tea generally takes 230–250 °C (20–30 min) to improve tea aroma, and then takes 80–100 °C to dry (50–60 min) [7]. Without the high-temperature process, the SBT retains more active substances and presents a unique sweet floral and light green aroma. Several efforts have been carried out to identify the volatile compounds in SBT in recent years [8]. However, little investigation has been carried out on the aroma characterization of SBT, and its key odor-active compounds remain unknown yet, which poses a major obstacle to the scientific elucidation of the aroma quality of the SBT.
The volatile compounds of tea are quite complicated and are found at trace levels, accounting for about 0.01% of the dry weight [9]. In particular, the results of GC–MS analysis varies greatly when different extraction methods are used, such as composition, number, relative content, and so on [10]; even with the same extraction method, the analysis results are greatly affected by the change of extraction conditions [11]. Thus, the selection of suitable extraction technique has become the decisive procedure to enhance the understanding of odor-active compounds of tea [12]. To date, the volatile extraction techniques most often used in teas include direct solvent extraction, simultaneous distillation–extraction (SDE), steam distillation-liquid/liquid extraction, Soxhlet extraction, vacuum hydrodistillation, thermal desorption, supercritical fluid extraction (SFE), solvent-assisted flavor evaporation (SAFE) and headspace solid–phase microextraction (HS–SPME) [13].
Noticeably, as one of the effective technologies to extract volatile matrices, SPME is rapidly emerging as a robust technique for the rapid, solvent-less extraction or preconcentration of volatile and semi-volatile organic compounds in a variety of scientific disciplines [14]. As an equilibrium extraction technique, the accurate quantitation of the SMPE method requires carefully controlled extraction conditions (the volume of the sample and headspace, extraction temperature, the rate of agitation, etc.). The incorporation of an internal standard into the matrix and adherence to specific sampling times will usually result in excellent quantitative correlations. The accuracy of this method has been verified in the identification of key aroma components of cranberry [15], wines [16], Kama flour [17], beers [18], Chios Mastic Gum [19], and so on. Thus, the combination of SPME and gas chromatography-olfactory (GC–O) techniques may have a great potential in the analysis of key odor-active compounds in SBT; however, no systematic research has been carried out on the odor-active compounds of SBT so far.
The main objective of this study is to explore the odor-active compounds in SBT by using instrumental (GC–O and GC–MS) analysis. Meanwhile, the odor activity value (OAVs), odor recombination and omission test were also used to confirm the key odor-active compounds of SBT. Based on these works, we can further understand the essence of the aroma profile of SBT and meanwhile can provide theoretical support for the study of the formation of key odor-active compounds of SBT.

2. Material and Methods

2.1. Materials

In total 20 sun-dried black tea samples harvested in 2019 were collected from a tea market in Pu’er City (Pu’er, Yunnan, China) and Zhenyuan Taihe Sweet Tea Co., Ltd (Pu’er, Yunnan, China), and 11 representative samples were selected by 6 experienced assessors according to the “Methodology for Sensory Evaluation of Tea (Chinese Standards, GB/T 23776–2018)” in the sensory analysis laboratory of Yunnan Tasly Deepure Biological Tea Group Co., Ltd (Pu’er, Yunnan, China). All the representative samples were ground by a grinder with low temperature and passed through 30 mesh for future use. In order to improve the accuracy and applicability of this study, the experiment sample used in the optimization process was prepared by mixing an equal mass of 11 representative sun-dried black tea samples.

2.2. Reagents and Chemicals

Hexanal (≥99%), (E)-2-hexenal (98.0%), benzaldehyde (>99%), 1-octen-3-ol (98%), 2-pentyl-furan (98%), D-limonene (≥99%), benzeneacetaldehyde (95%), linalool (98%), L-borneol (98%), epoxylinalol (>98%), methyl salicylate (≥99 %), β-cyclocitral (95%), (3Z)-3-hexenyl 2-methylbutanoate (98%), 1-methyl-naphthalene (98%), geranic acid (90%), n-hexyl caproate (≥98%), dihydroactinidiolide (98%), and (E)-nerolidol (95%) were purchased from Macklin (Shanghai, China). Linalool oxide I (99%), linalool oxide II (96%), caryophyllene (90%), geranyl acetone (99%), and n-alkanes solution (C8-C32) were purchased from J&K Chemical (Beijing, China). Hexanoic acid (≥99.5%), phenylethyl alcohol (≥99%), α-terpineol (>95%), (Z)-geraniol (>98%), (E)-geraniol (≥99%), (E)-2-decenal (95%), α-ionone (≥90%), β-ionone (97%) and butylated hydroxytoluene (>99.7%) were purchased from Aladdin (Shanghai, China). Safranal (90%), theaspirane (≥95%), (E)-β-damascenone (≥95%), and dihydro-β-ionone (≥90%) were purchased from Bidepharm (Shanghai, China). Sodium chloride (99.5%, analytical grade). Water used in this study was purified by Milli-Q purification system (Millipore, Bedford, MA, USA).

2.3. HS–SPME Procedures

The 65 µm polydimethylsiloxane/divinylbenzene (PDMS/DVB) fiber (Bellefonte, PA, USA) was selected and used for HS–SPME analysis. The extraction process was established as follows: sun-dried black tea (2.0 g), sodium chloride (2.0 g), water (6.0 mL), and a microstirring bar were put into a headspace vial. The vial was sealed and placed in a 50 °C (constant temperature) water bath. After 5 min equilibrium, the fiber was inserted into the vial and kept for 60 min at 120 rpm (stirring speed). After extraction, the fiber was immediately exposed to the GC injector (250 °C, 4 min) for desorption and analysis. Before the experiment five main factors (fiber, amount of water and sodium chloride, extraction temperature, and time) were optimized, and the data of the optimization process is supplied in the Supplementary Material (Figures S1–S5).

2.4. GC–O and GC–MS Analysis

An Agilent 7890A GC (Agilent Technologies, Palo Alto, CA, USA) equipped with an FID and a sniffing port (Sniffer 9000, Brechbühler, Switzerland) was used for GC–O analysis. An Agilent capillary column HP-5MS (30 m × 0.25 mm i.d., 0.25 µm film thickness; Agilent Technologies, Palo Alto, CA, USA) was used for the separation of target compounds. The conditions of the GC were set as follows: initial temperature 50 °C (3 min), increased to 180 °C at a rate of 3 °C min−1 and maintained for 5 min, and then increased to 250 °C at a rate of 10 °C min−1, and maintained for 5 min; the temperature of the injection port, the injection mode and the flow velocity of carrier gas (constant-flow mode; He > 99.999%) were 250 °C, splitless, and 1.0 mL min−1, respectively. The conditions of olfactometry were set as follows: the flow of humidified air was 60 mL min−1 and the temperature of the transfer line was 250 °C. A “Y” glass was used between the FID detector and the sniff port to split the GC effluent into 1:1.
In total, 6 assessors (4 males and 2 females, average age 32, non-smoking history, odor cosmetics were not used during the experiments) were selected from Yunnan Tasly Deepure Biological Tea Group Co., Ltd (Pu’er, Yunnan, China) and Pu’er Institute of Pu-erh Tea among 17 experienced tea experts in accordance with the International Standard method [20] to perform GC–O analysis. Before the experiment, all selected assessors were trained for more than 20 h over a period of 30 d using 13 odor-active standards [α-terpineol, linalool, (E)-nerolidol, (3Z)-3-hexenyl 2-methylbutanoate, hexanal, 2-hexenal, methyl salicylate, phenylethyl alcohol, α-ionone, β-ionone, geraniol, (E)-β-damascenone and 1-octen-3-ol], which were detected in SBT, until all the assessors could quickly describe the aroma characteristics and aroma intensities of all selected odor compounds at their different diluted concentrations. The detection frequency method was used to analyze the aroma characteristics and aroma intensities of each effluent in GC–O analysis. A 9-point scale from 1 to 9, wherein “1”, “5”, and “9” indicated the weak odor, moderate odor, and extreme odor intensity, respectively, was used to quantify odor intensities of the effluents. During the experiments, the odor characteristics and odor intensities of the effluents were recorded and scored, respectively. Finally, the odor intensity value of each detected odor-active compound was averaged for all the scores that were detected by six assessors (three times by each assessor). After GC–O analysis, all the samples were analyzed by using GC–MS under the same capillary column, and the perceived scents were identified by the retention indices (calculated by using n-alkanes from C8 to C32) between the GC–O and the GC–MS, the mass spectra database (NIST11.L) of GC–MS, the odor characteristic of each odor-active compound, and corresponding standard of each odor-active compound.
The conditions of GC–MS were listed as follows: an Agilent 7890A GC equipped with 5975C mass selective detector quadrupole MS instrument (Agilent Technologies, Palo Alto, CA, USA) was used to identify the perceived odor-active compounds. The conditions of GC (injector temperature, oven temperature program, the kind of carrier gas, and the flow rate of carrier gas) and the model capillary column were the same as described under GC–O analysis. The electron-impact (EI), interface temperature, ion source temperature, quadrupole temperature, mass scan range, and solvent delay time were 70 eV, 280 °C, 230 °C, 150 °C, 35–450 aum, and 3.0 min, respectively.

2.5. Quantitation of Odor-Active Compounds and OVA Calculation

Considering that non-volatile components may affect the aroma emission, a deodorized tea (odor-blank matrix) was prepared according to the method of the previous report [21] with minor modification during the quantitative process of odor-active compounds. The preparation process was as follows: 100 g SBT and 800 mL ultrapure water were weighed into a 2000 mL rotary evaporation bottle, following which the tea odor-active compounds were rotary evaporated in a 60 °C water bath. The process was repeated many times (greater than or equal to 5 times) until the sensory flavor of the tea was very light. Thereafter, the SBT was dried using an oven at 60 °C. The deodorized SBT, internal standard (n-decanol), and corresponding standards of odor-active compounds were used to obtain the quantitative result of each target compound. The process was listed as follows: initially, the authentic standards were dissolved using anhydrous alcohol and then diluted with ultrapure water to different concentrations. The dissolved standards dilution, internal standard (0.1 mL n-decanol, 4.15 µg/mL), and deodorized tea (2.0 g) were placed into a 20 mL headspace vial (Agilent Technologies, Palo Alto, CA, USA) and sealed. The vial was kept for 24 h at 4 °C and prepared with the HS–SPME method, as mentioned above (Section 2.3.). The quantitative standard curves of target compounds were established by plotting the peak area ratio against the corresponding concentration ratio.
Odor activity value (OAV) is often used to evaluate the contributions of odor-active compounds and further screen the odor-active compounds that play a decisive role in the aroma profile of the analyzed samples [22]. The OAVs of compounds are equal to the ratio of corresponding concentrations to their respective odor thresholds in water, and compounds with an OAV greater than or equal to one are generally considered to contribute significantly to the aroma profile of the analyzed samples [23]. In this study, the odor thresholds of detected odor-active compounds were obtained from literature or books (References [1–17], supplied in Supplementary Material).

2.6. Aroma Recombination and Omission Test

For the aroma recombination experiment, the deodorized tea (treatment process is consistent with 2.5) was used as a blank matrix. The odor-active compounds with OAVs of greater than or equal to one that detected in a randomly selected SBT were added into the deodorized tea according to their detected concentrations and mixed well. The recombination sample was sealed and kept for 24 h at 4 °C before sensory analysis.
The contributions of a single odor-active compound and a group of odor-active compounds were evaluated using an omission test. Twenty-five aroma models were prepared, and the aroma characteristic and aroma intensities of the reduced models were evaluated against two complete recombination samples with a triangle test according to the method of a reported study [24]. All the recombination samples were coded with random three-digit numbers, and all the assessors were asked to select different ones through sensory analysis.

2.7. Descriptive Sensory Analysis

A total of 10 experienced assessors (6 males and 4 females, average age 30, with non-smoking history, odor cosmetics were not used during the experiments) were selected from Yunnan Tasly Deepure Biological Tea Group Co., Ltd (Pu’er, Yunnan, China) and Pu’er Institute of Pu-erh Tea based on the International Standard method [20] to perform the descriptive sensory analysis of SBT and recombination samples. The procedure of descriptive sensory analysis referenced the method described by the previous study with some modifications [7]. In total, 6 odor terms (floral, fruity, green/grass, sweet, woody, and unpleasant flavor) of SBT and corresponding authentic reference standard (detected in SBT; linalool for a floral note, (Z)-3-hexenyl isovalerate for a fruity note, hexanal for green/grass odors, n-hexyl caproate for a sweet note, β-ionone for a woody note) were determined by 20 assessors through 3 preliminary sessions before the sensory analysis. A 9-point scale from 1 to 9 was used, wherein “1”, “5”, and “9” indicated the weak odor, moderate odor, and extreme odor intensity, respectively.
The descriptive sensory analysis was performed according to the “Methodology for Sensory Evaluation of Tea (Chinese Standards, GB/T 23776–2018)”. SBT (3.0 g) was placed in a special teapot and infused with 150 mL of freshly boiled water (kept for 5 min before sensory analysis). All the samples were coded with three-digit numbers and randomly provided to the assessors after brewing. The intensity value of each odor term was the average scores from 10 assessors (3 times by each assessor).

2.8. Statistical Analysis

Data analysis and figure drawing were performed by using MS Excel 2010 and OriginPro software (version 9.5.1, OriginLab Inc., Northampton, MA, USA), respectively.

3. Results and Discussion

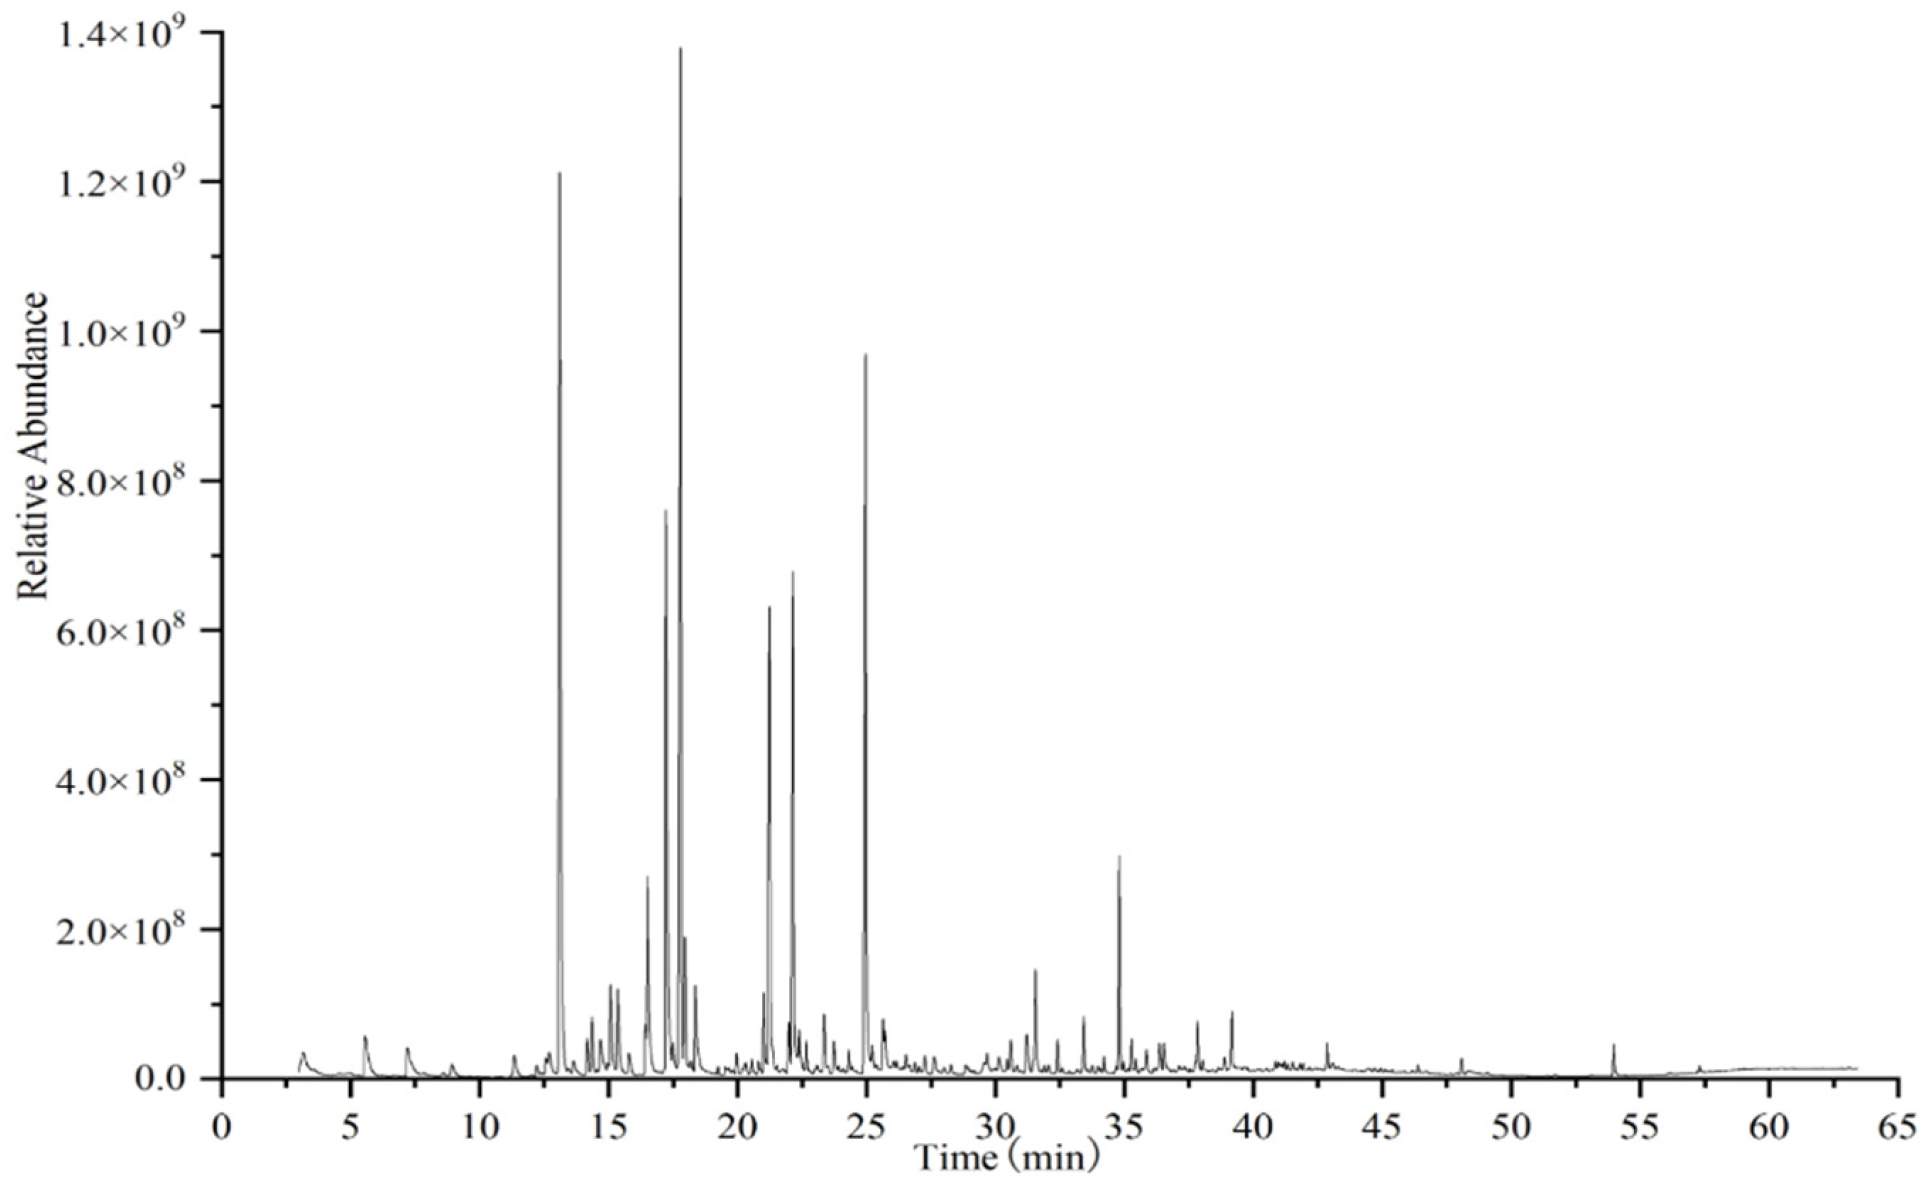
3.1. GC–MS Results for Sun-Dried Black Tea

Prior to GC–O analysis, the volatile compounds in 11 representative SBT samples were analyzed by HS–SPME/GC–MS, and the representative total ion chromatography of SBT was presented in Figure 1. A total of 86 volatile compounds were tentatively identified according to their mass spectrum and RI, including 21 hydrocarbons, 17 alcohols, 14 aldehydes, 13 ketones, 10 esters, 3 organic acids, 2 phenols, 2 ethers, 1 lactone, 1 furan, 1 nitrogen compound, and 1 oxygen heterocyclic compound, which were listed in Table S1. It was reported that 16 hydrocarbons, 17 alcohols, 11 aldehydes, 13 ketones, 10 esters, 3 organic acids, 1 ether, 1 lactone, 2 furans, and 2 nitrogen compounds were detected in a previous study [8]. The main volatile compounds in our study were consistent with those reported by Lv et al. [8].

3.2. Odor-Active Compounds Determination Using GC–O

In order to gain deep insights into the odor characteristics of the volatile compounds and further select the key odor-active compounds from the volatile compounds, GC–O analysis was performed. A total of 37 scents were perceived by GC–O in 11 SBT samples, and 35 compounds were identified using GC–MS based on their mass spectrum, RIs, odor characteristics, and authentic standards, and 2 compounds with moderate odor were not identified (Table 1). Among these detected compounds, β-ionone (AI: 9.91 ± 0.29), (E)-β-damascenone (AI: 9.64 ± 0.48), linalool (AI: 8.64 ± 0.98), linalool oxide II (AI: 8.45 ± 0.78), epoxylinalol (AI: 7.91 ± 0.79), linalool oxide I (AI: 7.82 ± 0.57), dihydro-β-ionone (AI: 7.55 ± 0.99), geraniol (AI: 7.36 ± 1.55), methyl salicylate (AI: 6.82 ± 1.11), α-ionone (AI: 6.36 ± 0.98), phenylethyl alcohol (AI: 5.64 ± 0.77), geranyl acetone (AI: 5.64 ± 0.97), and (E)-nerolidol (AI: 5.45 ± 1.87) had higher aroma intensities, which indicated that these compounds played an important role in the formation of SBT aroma. α-Ionone, β-ionone and dihydro-β-ionone, a group of carotenoid-derived aroma compounds, all presented “woody” and “violet-like” scents, which were detected in sun-dried Pu-erh tea of ancient tea plants from Bulang Mountain [25]. (E)-β-Damascenone presented “rose-like” and “sweet” scents, with low human odor perception threshold, it was reported that (E)-β-damascenone had a great contribution to the aroma profile of black teas [26]. Linalool presented pleasant “floral” and “citrus-like” scents, which were not only detected as key odor-active compounds in green tea, white tea, yellow tea, oolong tea, black tea, and dark tea samples [27] but also detected in flowers and spice plants [28,29]. Linalool oxides (linalool oxide I, linalool oxide II and epoxylinalol) presented “floral” and “woody” scents, which were detected with a high concentration in semi-fermented and fermented teas [27]. Geraniol, phenylethyl alcohol, and (E)-nerolidol all presented a “rose-like” scent, which was detected in many kinds of tea samples. Geraniol and (E)-nerolidol were reported as the key odor-active compounds for the quality of black teas [30], and (E)-nerolidol was also considered to be one of the key odor-active compounds for the high-quality of oolong tea [31]. Geranyl acetone presented “rose-like” and “green” scents, which were detected in black and ripened Pu-erh teas, and were considered to play an important role in the aroma profile of black and ripened Pu-erh teas [32,33]. Methyl salicylate presented “mint” and “wintergreen-like” scents, which were detected only in the teas that had a least a medium-degree fermentation but could not be detected in the green and lightly fermented teas, and it was reported that methyl salicylate and (E)-2-hexenal together could be used as an index to differentiate semi- and fully-fermented teas [34].

3.3. Quantitation of Odor-Active Compounds and OVA Calculation

The odor-active compounds from the bulk of volatile compounds of SBT were identified by using a unique technique of odor-active compounds screening. To deeper evaluate the aroma contributions of these perceived odor-active compounds, their contents were quantitated in 11 SBT samples based on internal standard and their corresponding standards, and the quantitative results of these odor-active compounds supplied in Table 2 and Table S2. The major odor-active compounds of SBT were linalool (2124.78 ± 696.93 µg/kg), linalool oxide II (1113.75 ± 302.78 µg/kg), epoxylinalol (973.71 ± 371.22 µg/kg), methyl salicylate (786.55 ± 409.55 µg/kg), geraniol (523.28 ± 459.73 µg/kg), linalool oxide I (509.49 ± 170.87 µg/kg), phenylethyl alcohol (362.70 ± 167.55 µg/kg), β-ionone (292.96 ± 43.00 µg/kg), benzeneacetaldehyde (259.48 ± 204.12 µg/kg), (E)-nerolidol (207.37 ± 79.16 µg/kg), dihydroactinidiolide (199.13 ± 93.87 µg/kg), (E)-β-damascenone (123.08 ± 46.69 µg/kg), geranyl acetone (107.28 ± 20.18 µg/kg), and theaspirane (102.94 ± 35.94 µg/kg). In contrast, D-limonene (34.64 ± 22.01 µg/kg), (3Z)-3-hexenyl 2-methylbutanoate (32.96 ± 22.46 µg/kg), (Z)-geraniol (31.80 ± 13.19 µg/kg), L-borneol (27.69 ± 26.93 µg/kg), (E)-2-decenal (25.56 ± 52.14 µg/kg), geranic acid (25.13 ± 38.39 µg/kg), dihydro-β-ionone (24.86 ± 7.32 µg/kg), and 1-octen-3-ol (23.52 ± 49.27 µg/kg) in SBT samples were relatively low. These odor-active compounds were the first quantified in SBT.
The contributions of odor-active compounds to the aroma profile of SBT not only depend on its content but also depends on its odor threshold value. Odor-active compounds with OAVs greater than or equal to one were usually considered to play a major role in the aroma profile of the samples [35]. To further deeply elucidate the contribution of the odor-active compounds in SBT, their OAVs were calculated using the quantitative results and reported thresholds, and the calculation results are shown in Table 2 and Table S3.
The OAVs of (E)-β-damascenone (OAV: 61538.79), β-ionone (OAV: 41851.78), dihydro-β-ionone (OAV: 24856.37), linalool (OAV: 354.13), α-ionone (OAV: 168.68), geraniol (OAV: 163.53), phenylethyl alcohol (OAV: 74.02), (E)-2-decenal (OAV: 63.89), methyl salicylate (OAV: 49.16), benzeneacetaldehyde (OAV: 41.19), (E)-nerolidol (OAV: 20.74), linalool oxide II (OAV: 18.56), 1-octen-3-ol (OAV: 15.68), 1-methyl-naphthalene (OAV: 11.60), β-cyclocitral (OAV: 11.58), hexanal (OAV: 7.71), 2-pentyl-furan (OAV: 7.07), linalool oxide I (OAV: 5.09), D-limonene (OAV: 3.46), α-terpineol (OAV: 2.52), and geranyl acetone (OAV: 1.79) were greater than 1, and indicated that these compounds played an important role in the aroma profile of SBT. Among them, alcohols, ketones, hydrocarbons, and aldehydes occupied most of the components, and the results of this study were consistent with those previously reported [8]. However, the OAVs calculation showed that an odor-active compound with higher content did not mean a larger OAV or vice versa. For example, dihydro-β-ionone (24.86 ± 7.32 µg/kg) was present at low concentrations in SBT samples, but its OAV was 24856.37 (its threshold was 0.001 µg/kg in water). By contrast, epoxylinalol (973.71 ± 371.22 µg/kg) was present at a relatively high concentration in SBT samples, but its OAV was only 0.32. In general, the results of OAVs and GC–O were basically consistent with each other.

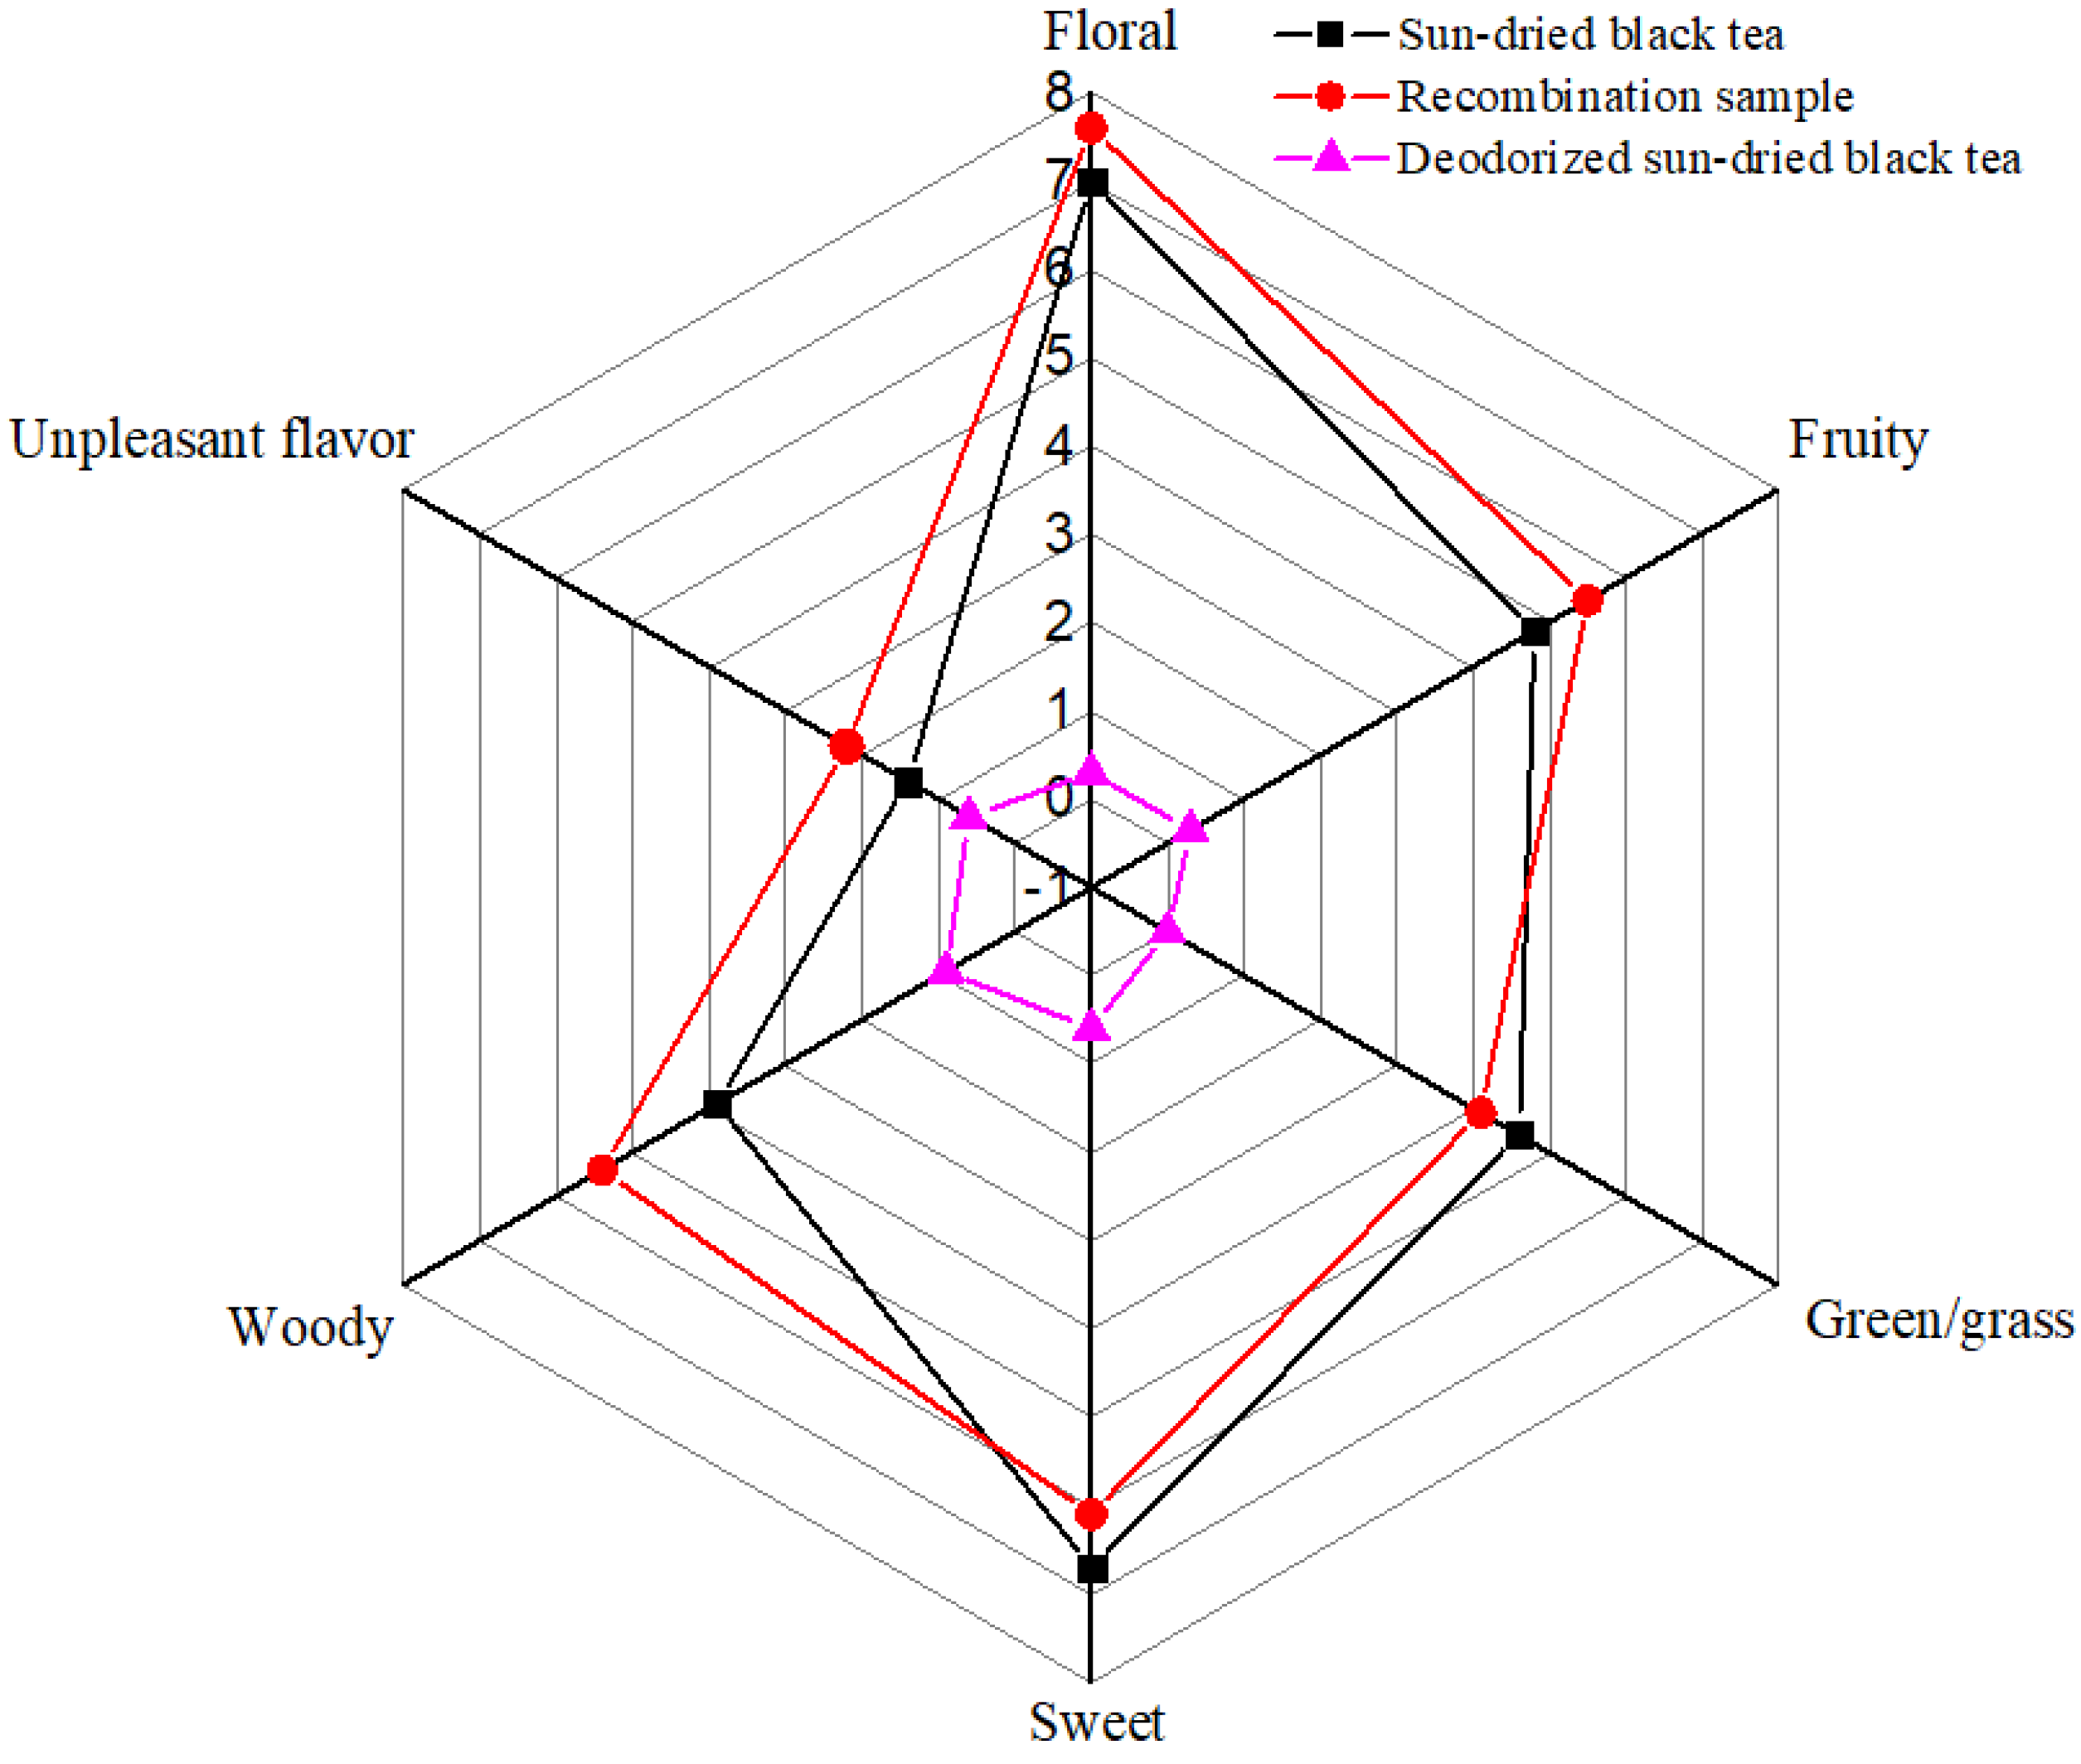
3.4. Aroma Recombination and Omission Test

To confirm the contributions of these compounds with OAVs greater than or equal to one, the aroma recombination test was designed and performed. The deodorized SBT was used as a blank matrix. An SBT sample was randomly selected as a reference for aroma recombination. Then, 21 compounds with OAVs greater than 1 were added to the deodorized tea based on the quantitative results of the reference sun-dried black tea and mixed well. The recombination sample was sealed and kept for 24 h at 4 °C before sensory analysis. The recombination sample and selected reference sun-dried black tea were evaluated by 10 experienced assessors according to the “Methodology for Sensory Evaluation of Tea (Chinese Standards, GB/T 23776–2018)” described in Section 2.7. Six odor terms, including floral, fruity, green/grass, sweet, woody, and unpleasant flavor were identified as the main aroma characteristics based on the sensory results of SBT samples. The sensory results of the recombination sample and selected reference sample are shown in Figure 2. The results showed that the odor profile of the SBT could be successfully imitated to a certain extent by combining these 21 odor-active compounds at their detected concentrations in the selected reference sample, specifically in terms of its floral, fruity, green/grass, and sweet scents. The recombination sample was more inclined to a woody scent. This phenomenon may be due to the conversion of the non-volatile components while preparing the deodorized matrix or the difference in the extraction amounts of odor-active compounds while brewing (the odor-active compounds of the recombination sample were easier to give off). Overall, the results of odor recombination further verified the accuracy of the identified key odor-active compounds in SBT.
In order to deeply verify the contributions of a single odor-active compound with OAVs greater than or equal to 1 to the aroma profile of SBT, the omission test was performed by designing 25 models, in which a single odor-active compound or a group of odor-active compounds was omitted. Taking the recombination sample as a reference, 25 omission models were evaluated by triangle test, and the results are supplied in Table 3.
Model 1 showed that 10 assessors were able to perceive the entire omission of all alcohols (including linalool, geraniol, phenylethyl alcohol, (E)-nerolidol, linalool oxide II, 1-octen-3-ol, linalool oxide I, and α-terpineol) with a very high significance (p ≤ 0.001), indicating that these alcohols played a major role in the aroma formation of SBT. Compared with the recombination sample, the single omission of linalool (model 1-1), geraniol (model 1-2), or phenylethyl alcohol (model 1-3) showed a very high significant difference (p ≤ 0.001), a high significant difference (p ≤ 0.01), and significant difference (p ≤ 0.05), respectively. While the single omission of (E)-nerolidol (model 1-4), linalool oxide II (model 1-5), 1-octen-3-ol (model 1-6), linalool oxide I (model 1-7), or α-terpineol (model 1-8) showed no significant difference (p > 0.05), indicating that the effect of these compounds on the aroma profile of SBT is relatively small.
Model 2 showed that 10 assessors were able to perceive the entire omission of all ketones (including (E)-β-damascenone, β-ionone, dihydro-β-ionone, α-ionone, and geranyl acetone) also with a very high significance (p ≤ 0.001). The single omission of (E)-β-damascenone (model 2-1), β-ionone (model 2-2), or dihydro-β-ionone (model 2-3) also showed a very high significant difference (p ≤ 0.001). The single omission of α-ionone (model 2-4) was resulted in a significant difference (p ≤ 0.05). While the single omission of geranyl acetone (model 2-5) showed no significant difference (p > 0.05).
Model 3 showed that 8 assessors were able to detect the entire omission of all aldehydes ((E)-2-decenal, benzeneacetaldehyde, β-cyclocitral, hexanal) with a high significance (p ≤ 0.01). The single omission of (E)-2-decenal (model 3-1) or hexanal (model 3-4) also showed a significant difference (p ≤ 0.05) compared with the recombination sample. While the single omission of benzeneacetaldehyde (model 3-2) or β-cyclocitral (model 3-3) showed no significant difference (p > 0.05).
Model 4 showed that only 5 assessors were able to detect the entire omission of all hydrocarbons (1-methyl-naphthalene and D-limonene) with no significant difference compared with the recombination sample. Model 5 showed that 7 assessors were able to detect the single omission of methyl salicylate with a significant difference (p ≤ 0.05). Model 6 showed that only 3 assessors were able to detect the single omission of 2-pentyl-furan with no significant difference (p > 0.05).
In summary, (E)-β-damascenone, β-ionone, linalool, dihydro-β-ionone, gerniol, phenylethyl alcohol, α-ionone, (E)-2-decenal, hexanal, and methyl salicylate were recognized as the most important key odor-active compounds in this study that are essential for the aroma quality of SBT.

4. Conclusions

The odor profile of sun-dried black tea was successfully identified by sensory and instrumental-directed flavor analysis. A total of 37 scents were perceived under GC–O analysis, and 35 compounds with odor intensities ranging from 1.09 ± 1.93 to 9.91 ± 0.29 were identified. Twenty-one of them were further identified as key odor-active compounds with OAVs greater than or equal to one based on their quantitative results and thresholds. These key odor-active compounds were restructured with their detected concentrations in a reference sample, and the aroma profile of the selected sun-dried black tea sample was successfully imitated to a certain extent. An omission test was performed by designing 25 models and confirmed that linalool, dihydro-β-ionone, β-ionone, and geraniol were the key odor-active compounds for the aroma profile of sun-dried black tea. Meanwhile, phenylethyl alcohol, (E)-β-damascenone, (E)-2-decenal, hexanal, and methyl salicylate were also important to the aroma profile of sun-dried black tea.

Supplementary Materials

The following supporting information can be downloaded at: https://www.mdpi.com/article/10.3390/foods11121740/s1, Figure S1: The extraction efficiency of four fibers; Figure S2: Influence of water amount on the number and sum of intensity value of aroma-active compounds; Figure S3: Influence of NaCl amount on the number and sum of intensity value of aroma-active compounds; Figure S4: Influence of extraction temperature on the number and sum of intensity value of aroma-active compounds; Figure S5: Influence of extraction time on the number and sum of intensity value of aroma-active compounds; Table S1: Volatile compounds detected by GC-MS in sun-dried black tea; Table S2: The quantitative results of odor-active compounds; Table S3: The OAVs of odor-active compounds.

Author Contributions

C.L., W.Z. and L.Y. designed the work and drafted the original manuscript; C.W. reviewed and edited the manuscript; T.Z., M.Z., W.G. and Q.W. collected and analyzed the data. All authors have read and agreed to the published version of the manuscript.

Funding

This work was supported by the Scientific and Technological Innovation Team of Tea Product Innovation and Comprehensive Utilization of Resources in West Yunnan University of Applied Sciences (2021KYPT0002), the National Natural Science Foundation of China (32102004), and the Project funded by China Postdoctoral Science Foundation (2021M701169).

Institutional Review Board Statement

Not applicable.

Informed Consent Statement

Informed consent was obtained from all subjects involved in the study.

Data Availability Statement

Data is contained within the article.

Acknowledgments

Zhenyuan Taihe Sweet Tea Co., Ltd. provided samples for this experiment. Meanwhile, special thanks are given to Xiang-bo Li for sensory analysis.

Conflicts of Interest

The authors declare that they have no known competing financial interests or personal relationships that could have appeared to influence the work reported in this paper.

Abbreviations

SBTSun-dried black tea
HS–SPMEHeadspace solid–phase microextraction
GC–OGas chromatography–olfactometry
GC–MSGas chromatography–mass spectrometry
OAVOdor activity value

References

  1. Wang, W.; Ma, J.; Shi, Y.; Zhu, Y.; Lin, Z.; Lv, H. Characterization of the key aroma compounds in Longjing tea using stir bar sorptive extraction (SBSE) combined with gas chromatography-mass spectrometry (GC–MS), gas chromatography-olfactometry (GC–O), odor activity value (OAV), and aroma recombination. Food Res. Int. 2020, 130, 108908. [Google Scholar] [CrossRef]
  2. Zhu, Y.; Lv, H.; Dai, W.; Guo, L.; Tan, J.; Zhang, Y.; Yu, Y.; Shao, C.; Peng, Q.; Lin, Z. Separation of aroma components in Xihu Longjing tea using simultaneous distillation extraction with comprehensive two-dimensional gas chromatography-time-of-flight mass spectrometry. Sep. Purif. Technol. 2016, 164, 146–154. [Google Scholar] [CrossRef]
  3. Ho, C.; Zheng, X.; Li, S. Tea aroma formation. Food Sci. Hum. Wellness 2015, 4, 9–27. [Google Scholar] [CrossRef] [Green Version]
  4. Kang, S.; Yan, H.; Zhu, Y.; Liu, X.; Lv, H.; Zhang, Y.; Dai, W.; Guo, L.; Tan, J.; Peng, Q.; et al. Identification and quantification of key odorants in the world’s four most famous black teas. Food Res. Int. 2019, 121, 73–83. [Google Scholar] [CrossRef] [PubMed]
  5. Pan, Y. Innovative processing technology of Pu-erh sun-dried black tea. Newsl. Seric. Tea 2017, 5, 34–35. (In Chinese) [Google Scholar]
  6. Jin, H.; Chen, B.; Bao, Z.; Li, K.; Luo, Z. Analysis and evaluation of product characteristic of Pu-erh sun-dried black tea. Food Res. Dev. 2016, 37, 44–47. (In Chinese) [Google Scholar]
  7. Wang, C.; Zhang, C.; Kong, Y.; Peng, X.; Li, C.; Liu, S.; Du, L.; Xiao, D.; Xu, Y. A comparative study of volatile components in Dianhong teas from fresh leaves of four tea cultivars by using chromatography–mass spectrometry, multivariate data analysis, and descriptive sensory analysis. Food Res. Int. 2017, 100, 267–275. [Google Scholar] [CrossRef]
  8. Lv, S.; Wu, Y.; Wang, C.; Gao, X.; Li, J.; Zhang, W.; Meng, Q. Comparative Study of Volatile Components in Sun-Dried and Baked Black Teas in Yunnan Province. Food Sci. 2016, 37, 62–67. (In Chinese) [Google Scholar]
  9. He, C.; Guo, X.; Yang, Y.; Xie, Y.; Ju, F.; Guo, W. Characterization of the aromatic profile in “zijuan” and “pu-erh” green teas by headspace solid–phase microextraction coupled with GC-O and GC-MS. Anal. Methods. 2016, 8, 4727–4735. [Google Scholar] [CrossRef]
  10. Gao, X.; Lv, S.; Wu, Y.; Li, J.; Zhang, W.; Meng, W.; Wang, C.; Meng, Q. Volatile components of essential oils extracted from Pu-erh ripe tea by different extraction methods. Inter. J. Food Prop. 2017, 20, S240–S253. [Google Scholar] [CrossRef] [Green Version]
  11. Das, P.R.; Kim, Y.; Hong, S.; Eun, J. Profiling of volatile and non-phenolic metabolites–Amino acids, organic acids, and sugars of green tea extracts obtained by different extraction techniques. Food Chem. 2019, 296, 69–77. [Google Scholar] [CrossRef] [PubMed]
  12. Amanpour, A.; Guclu, G.; Kelebek, H.; Selli, S. Characterization of key aroma compounds in fresh and roasted terebinth fruits using aroma extract dilution analysis and GC–MS-Olfactometry. Microchem. J. 2019, 145, 96–104. [Google Scholar] [CrossRef]
  13. Yang, Z.; Baldermann, S.; Watanabe, N. Recent studies of the volatile compounds in tea. Food Res. Int. 2013, 53, 585–599. [Google Scholar] [CrossRef]
  14. Du, L.; Wang, C.; Zhang, C.; Ma, L.; Xu, Y.; Xiao, D. Characterization of the volatile and sensory profile of instant Pu-erh tea using GC × GC–TOFMS and descriptive sensory analysis. Microchem. J. 2019, 146, 986–996. [Google Scholar] [CrossRef]
  15. Zhu, J.; Chen, F.; Wang, L.; Niu, Y.; Chen, H.; Wang, H.; Xiao, Z. Characterization of the key aroma volatile compounds in cranberry (Vaccinium macrocarpon Ait.) using gas chromatography-olfactometry (GC–O) and odor activity value (OAV). J. Agric. Food Chem. 2019, 64, 4990–4999. [Google Scholar] [CrossRef] [PubMed]
  16. Niu, Y.; Wang, P.; Xiao, Z.; Zhu, J.; Sun, X.; Wang, R. Evaluation of the perceptual interaction among ester aroma compounds in cherry wines by GC–MS, GC–O, odor threshold and sensory analysis: An insight at the molecular level. Food Chem. 2019, 275, 143–153. [Google Scholar] [CrossRef]
  17. Kaseleht, K.; Leitner, E.; Paalme, T. Determining aroma-active compounds in Kama flour using SPME-GC-MS and GC–Olfactometry. Flavor. Frag. J. 2010, 26, 122–128. [Google Scholar] [CrossRef]
  18. Giannetti, V.; Mariani, M.B.; Torrelli, P.; Marini, F. Flavour component analysis by HS-SPME/GC–MS and chemometric modeling to characterize Pilsner-style Lager craft beers. Microchem. J. 2019, 149, 103991. [Google Scholar] [CrossRef]
  19. Rigling, M.; Fraatz, M.; Trögel, S.; Sun, J.; Zorn, H.; Zhang, Y. Aroma investigation of Chios Mastic Gum (Pistacia lentiscus Variety Chia) using headspace gas chromatography combined with olfactory detection and chiral analysis. J. Agric. Food Chem. 2019, 67, 13420–13429. [Google Scholar] [CrossRef]
  20. ISO 8586-1; Sensory Analysis-General Guidelines for the Selection, Training and Monitoring of Selected Assessors and Expert Sensory Assessors. ISO: Geneva, Switzerland, 2012.
  21. He, C.; Li, Z.; Liu, H.; Zhang, H.; Wang, L.; Chen, H. Characterization of the key aroma compounds in Semnostachya menglaensis Tsui by gas chromatography–olfactometry, odor activity values, aroma recombination, and omission analysis. Food Res. Int. 2020, 131, 108948. [Google Scholar] [CrossRef]
  22. Niu, Y.; Zhu, Q.; Xiao, Z. Characterization of perceptual interactions among ester aroma compounds found in Chinese Moutai Baijiu by gas chromatography-olfactometry, odor Intensity, olfactory threshold and odor activity value. Food Res. Int. 2020, 131, 108986. [Google Scholar] [CrossRef] [PubMed]
  23. Zhu, J.; Wang, L.; Xiao, Z.; Niu, Y. Characterization of the key aroma compounds in mulberry fruits by application of gas chromatography–olfactometry (GC–O), odor activity value (OAV), gas chromatography-mass spectrometry (GC–MS) and flame photometric detection (FPD). Food Chem. 2018, 245, 775–785. [Google Scholar] [CrossRef] [PubMed]
  24. Wang, L.; Fan, S.; Yan, Y.; Yang, L.; Chen, S.; Xu, Y. Characterization of potent odorants causing a pickle-like off-odor in Moutai-aroma type Baijiu by comparative aroma extract dilution analysis, quantitative measurements, aroma addition, and omission studies. J. Agric. Food Chem. 2020, 68, 1666–1677. [Google Scholar] [CrossRef]
  25. Zhang, W.; Liu, C.; Yang, R.; Zheng, T.; Zhao, M.; Ma, L.; Yan, L. Comparison of volatile profiles and bioactive components of sun-dried Pu-erh tea leaves from ancient tea plants on Bulang Mountain measured by GC-MS and HPLC. J. Zhejiang Univ.-Sci. B. 2019, 20, 563–575. [Google Scholar] [CrossRef] [PubMed]
  26. Magagna, F.; Cordero, C.; Cagliero, C.; Liberto, E.; Rubiolo, P.; Sgorbini, B.; Bicchi, C. Black tea volatiles fingerprinting by comprehensive two-dimensional gas chromatography–Mass spectrometry combined with high concentration capacity sample preparation techniques: Toward a fully automated sensomic assessment. Food Chem. 2017, 225, 276–287. [Google Scholar] [CrossRef] [PubMed]
  27. Feng, Z.; Li, Y.; Li, M.; Wang, Y.; Zhang, L.; Wan, X.; Yang, X. Tea aroma formation from six model manufacturing processes. Food Chem. 2019, 285, 347–354. [Google Scholar] [CrossRef]
  28. Seisonen, S.; Kivima, E.; Vene, K. Characterisation of the aroma profiles of different honeys and corresponding flowers using solid-phase microextraction and gas chromatography–mass spectrometry/olfactometry. Food Chem. 2015, 169, 34–40. [Google Scholar] [CrossRef]
  29. Silvis, I.C.J.; Luning, P.A.; Klose, N.; Jansen, M.; van Ruth, S.M. Similarities and differences of the volatile profiles of six spices explored by proton transfer reaction mass spectrometry. Food Chem. 2019, 271, 318–327. [Google Scholar] [CrossRef]
  30. Joshi, R.; Gulati, A. Fractionation and identification of minor and aroma-active constituents in Kangra orthodox black tea. Food Chem. 2015, 167, 290–298. [Google Scholar] [CrossRef]
  31. Sheibani, E.; Duncan, S.E.; Kuhn, D.D.; Dietrich, A.M.; O’Keefe, S.F. SDE and SPME analysis of flavor compounds in Jin Xuan oolong tea. J. Food Sci. 2016, 81, C348–C358. [Google Scholar] [CrossRef]
  32. Du, L.; Li, J.; Li, W.; Li, Y.; Li, T.; Xiao, D. Characterization of volatile compounds of Pu-erh tea using solid–phase microextraction and simultaneous distillation–extraction coupled with gas chromatography–mass spectrometry. Food Res. Int. 2014, 57, 61–70. [Google Scholar] [CrossRef]
  33. Wang, Z.; Han, B.; Jing, W.; Yi, Z.; Zhang, Y.; Ren, D.; Yi, L. Effects of different steeping temperatures on the leaching of aroma components in black tea by SPME–GC–MS coupled with chemometric method. J. AOAC. Int. 2019, 102, 1834–1844. [Google Scholar] [CrossRef] [PubMed]
  34. Wang, L.; Lee, J.; Chung, J.; Baik, J.; So, S.; Park, S. Discrimination of teas with different degrees of fermentation by SPME–GC analysis of the characteristic volatile flavour compounds. Food Chem. 2008, 109, 196–206. [Google Scholar] [CrossRef] [PubMed]
  35. Selli, S.; Cayhan, G.G. Analysis of volatile compounds of wild gilthead sea bream (Sparus aurata) by simultaneous distillation–extraction (SDE) and GC–MS. Microchem. J. 2009, 93, 232–235. [Google Scholar] [CrossRef]
Figure 1. The representative total ion chromatography of sun-dried black tea.
Foods 11 01740 g001
Figure 2. Aroma profile of the recombination sample and the sun-dried black tea.
Foods 11 01740 g002
Table 1. Odor-active compounds detected by GC-O and GC-MS in sun-dried black tea samples (11 samples).
No.Time (min)RIOdor-Active CompoundsOdor DescriptorsAroma IntensityFrequencyIdentification
13.84800HexanalGreen, grass3.55 ± 1.2314MS/RI/Odor/STD
25.3258512-HexenalGreen, fruity3.00 ± 1.5413MS/RI/Odor/STD
38.92960BenzaldehydeAlmond-like3.00 ± 1.7111MS/RI/Odor/STD
49.699821-Octen-3-olMushroom-like2.73 ± 2.009MS/RI/Odor/STD
510.059922-Pentyl-furanFruity3.55 ± 0.08912MS/RI/Odor/STD
611.021015Hexanoic acidUnpleasant odor2.64 ± 1.728MS/RI/Odor/STD
711.561027D-LimoneneLemon-like3.82 ± 1.5811MS/RI/Odor/STD
812.431046BenzeneacetaldehydeSweet, rose-like4.00 ± 1.7612MS/RI/Odor/STD
913.641072Linalool oxide IFloral, woody7.82 ± 0.05718MS/RI/Odor/STD
1014.391089Linalool oxide IIFloral, woody8.45 ± 0.7818MS/RI/Odor/STD
1115.131105LinaloolFloral, citrus-like8.64 ± 0.9818MS/RI/Odor/STD
1215.751119Phenylethyl alcoholSweet, rose-like5.64 ± 0.7716MS/RI/Odor/STD
1317.901168L-BorneolWoody2.09 ± 1.837MS/RI/Odor/STD
1418.471181EpoxylinalolFloral, woody7.91 ± 0.7918MS/RI/Odor/STD
1519.131196α-TerpineolFloral, fruity4.27 ± 2.3410MS/RI/Odor/STD
1619.291199Methyl salicylateMint, wintergreen-like6.82 ± 1.1118MS/RI/Odor/STD
1719.431202SafranalHerbaceous, sweet2.36 ± 2.536MS/RI/Odor/STD
1820.381222β-CyclocitralMint, fruity3.09 ± 1.5610MS/RI/Odor/STD
1920.921234(Z)-GeraniolRose-like3.64 ± 1.4912MS/RI/Odor/STD
2021.051237(3Z)-3-Hexenyl 2-methylbutanoateFruity2.27 ± 1.488MS/RI/Odor/STD
2122.191261GeraniolRose-like7.36 ± 1.5518MS/RI/Odor/STD
2222.351264(E)-2-DecenalOrange-like1.09 ± 1.934MS/RI/Odor/STD
2323.6212911-Methyl-naphthaleneEarthy-like3.36 ± 1.9210MS/RI/Odor/STD
2423.821295TheaspiraneWoody, Fruity4.91 ± 0.5113MS/RI/Odor/STD
2527.511377Geranic acidSweet, woody1.18 ± 1.694MS/RI/Odor/STD
2627.671381(E)-β-DamascenoneRose-like, sweet9.64 ± 0.4817MS/RI/Odor/STD
2727.871385n-Hexyl caproateSweet, fruity3.36 ± 2.0110MS/RI/Odor/STD
2829.021412CaryophylleneFloral, woody3.09 ± 1.9710MS/RI/Odor/STD
2929.511425α-IononeWoody, violet-like6.36 ± 0.9815MS/RI/Odor/STD
3029.941435Dihydro-β-iononeWoody, violet-like7.55 ± 0.9916MS/RI/Odor/STD
3130.631453Geranyl acetoneRose-like, green5.64 ± 0.9715MS/RI/Odor/STD
3231.931485β-IononeWoody, violet-like9.91 ± 0.2918MS/RI/Odor/STD
3333.001513Butylated hydroxytolueneUnpleasant odor3.27 ± 0.7513MS/RI/Odor/STD
3433.601528DihydroactinidiolideUnpleasant odor4.36 ± 1.4916MS/RI/Odor/STD
3535.081566(E)-NerolidolRose-like5.45 ± 1.8716MS/RI/Odor/STD
3627.221348Unknown1Floral, sweet4.03 ± 0.9213----
3729.251417Unknown2Fruity, sweet3.29 ± 0.4412----
Table 2. The results of quantitative and OAVs calculation of odor-active in sun-dried black tea samples (11 samples).
No.Time (min)RIOdor-Active CompoundsThe Range of Concentration (µg/kg)Average Concentration (µg/kg) OTs (µg/kg)Literature aThe Range of OAVAverage OAVIdentification
127.671381(E)-β-Damascenone58.86–238.97123.08 ± 46.690.002[1,2]29427.88–119483.3861538.79 ± 23342.77MS/RI/Odor/STD
231.931485β-Ionone244.72–409.08292.96 ± 43.000.007[3]34960.64–58440.0041851.78 ± 6143.54MS/RI/Odor/STD
329.941435Dihydro-β-ionone12.39–42.0824.86 ± 7.320.001[4]12385.95–42081.4424856.37 ± 7322.65MS/RI/Odor/STD
415.131105Linalool900.49–3196.252124.78 ± 696.936[5]150.08–532.71354.13 ± 116.16MS/RI/Odor/STD
529.511425α-Ionone38.70–113.5267.47 ± 20.430.4[6]96.75–283.81168.68 ± 51.07MS/RI/Odor/STD
622.191261Geraniol79.47–1324.51523.28 ± 459.733.2[3]24.83–413.91163.53 ± 143.67MS/RI/Odor/STD
715.751119Phenylethyl alcohol205.78–773.33362.70 ± 167.554.9[7]42.00–157.8274.02 ± 34.19MS/RI/Odor/STD
822.351264(E)-2-Decenal0.00–147.9225.56 ± 52.140.4[8]0.00–369.8063.89 ± 130.35MS/RI/Odor/STD
919.291199Methyl salicylate212.96–1418.74786.55 ± 409.5516[9]13.31–88.6749.16 ± 25.60MS/RI/Odor/STD
1012.431046Benzeneacetaldehyde0.00–680.02259.48 ± 204.126.3[10]0.00–107.9441.19 ± 32.40MS/RI/Odor/STD
1135.081566(E)-Nerolidol0.00–284.47207.37 ± 79.1610[11]0.00–28.4520.74 ± 7.92MS/RI/Odor/STD
1214.391089Linalool oxide II853.47–1853.651113.75 ± 302.7860[10]11.22–30.8918.56 ± 5.05MS/RI/Odor/STD
139.699821-Octen-3-ol0.00–178.2323.52 ± 49.271.5[10]0.00–118.8215.68 ± 32.84MS/RI/Odor/STD
1423.6212911-Methyl-naphthalene0.00–298.4286.97 ± 94.377.5[11]0.00–39.7911.60 ± 12.58MS/RI/Odor/STD
1520.381222β-Cyclocitral0.00–123.5257.92 ± 36.365[12]0.00–24.7011.58 ± 7.27MS/RI/Odor/STD
163.845800Hexanal23.65–164.0977.13 ± 41.2910[10]2.36–16.417.71 ± 4.13MS/RI/Odor/STD
1710.059922-Pentyl-furan17.29–69.9842.43 ± 15.316[13]2.88–11.667.07 ± 2.55MS/RI/Odor/STD
1813.641072Linalool oxide I352.21–1000.30509.49 ± 170.87100[10]3.52–10.005.09 ± 1.71MS/RI/Odor/STD
1911.561027D-Limonene0.00–82.2334.64 ± 22.0110[6]0.00–8.223.46 ± 2.20MS/RI/Odor/STD
2019.131196α-Terpineol0.00–113.3052.36 ± 35.1120.8[14]0.00–5.452.52 ± 1.69MS/RI/Odor/STD
2130.631453Geranyl acetone59.66–131.61107.28 ± 20.1860[6]0.99–2.191.79 ± 0.34MS/RI/Odor/STD
225.328512-Hexenal0.00–140.5465.95 ± 45.4590[10]0.00–1.560.73 ± 0.51MS/RI/Odor/STD
2333.611528Dihydroactinidiolide0.00–356.32199.13 ± 93.87500[10]0.00–0.710.40 ± 0.19MS/RI/Odor/STD
2417.91168L-Borneol0.00–82.6327.69 ± 26.9380[15]0.00–1.0320.35 ± 0.34MS/RI/Odor/STD
2518.471181Epoxylinalol0.00–1626.95973.71 ± 371.223000[10]0.17–0.540.32 ± 0.12MS/RI/Odor/STD
2623.821295Theaspirane41.06–184.22102.94 ± 35.941000[11]0.04–0.180.10 ± 0.04MS/RI/Odor/STD
2719.431202Safranal0.00–256.3279.54 ± 103.001000[11]0.00–0.260.08 ± 0.10MS/RI/Odor/STD
288.92960Benzaldehyde0.00–156.0147.00 ± 45.35750.89[10]0.00–0.210.06 ± 0.06MS/RI/Odor/STD
2911.021015Hexanoic acid0.00–148.1750.05 ± 41.92890[10]0.00–0.170.06 ± 0.05MS/RI/Odor/STD
3020.921234(Z)-Geraniol8.79–50.5631.80 ± 13.19680[16]0.01–0.050.05 ± 0.02MS/RI/Odor/STD
3129.021412Caryophyllene0.00–229.9174.78 ± 74.521500[17]0.00–0.150.05 ± 0.05MS/RI/Odor/STD
3233.011513Butylated hydroxytoluene22.96–66.9943.58 ± 10.801000[9]0.02–0.070.04 ± 0.01MS/RI/Odor/STD
3327.871385n-Hexyl caproate0.00–126.6475.51 ± 45.886400[11]0.00–0.020.01 ± 0.01MS/RI/Odor/STD
3421.051237(3Z)-3-Hexenyl 2-methylbutanoate0.00–60.8332.96 ± 22.4610,000[11]0.00–0.01<0.01MS/RI/Odor/STD
3527.511377Geranic acid0.00–117.9225.13 ± 38.3910,000[11]0.00–0.01<0.01MS/RI/Odor/STD
a: Odor thresholds in water, which were found in the literatures (References [1–17] are supplied in Supplementary Material).
Table 3. The results of the omission test.
ModelOdor-Active Compounds Omitted from the Recombination SampleNo. aSignificance b
1All alcohols10***
1-1Linalool10***
1-2Geraniol8**
1-3Phenylethyl alcohol7*
1-4(E)-Nerolidol5
1-5Linalool oxide II5
1-61-Octen-3-ol5
1-7Linalool oxide I4
1-8α-Terpineol3
2All ketones10***
2-1(E)-β-Damascenone10***
2-2β-Ionone10***
2-3Dihydro-β-ionone10***
2-4α-Ionone7*
2-5Geranyl acetone2
3All aldehydes8**
3-1(E)-2-Decenal7*
3-2Benzeneacetaldehyde5
3-3β-Cyclocitral3
3-4Hexanal7*
4All hydrocarbons5
4-11-Methyl-naphthalene4
4-2D-Limonene3
5Methyl salicylate7*
62-Pentyl-furan3
a: Number of correct judgments from 10 assessors; b: * significant (p ≤ 0.05); ** highly significant (α ≤ 0.01); *** very highly significant (p ≤ 0.001).
Publisher’s Note: MDPI stays neutral with regard to jurisdictional claims in published maps and institutional affiliations.

