
Colloidal and Acid Gelling Properties of Mixed Milk and Pea Protein Suspensions

 , , , and
Abstract
:
1. Introduction
2. Materials and Methods
2.1. Materials
2.2. Methods
2.2.1. Preparation of Suspensions
2.2.2. Colloidal Properties
pH of the Suspensions
Viscosity
Color
Sedimentable Material (SM)
Heat Stability
Ethanol Stability
2.2.3. Gelling Properties
Gel Formation and Rheological Analyses
pH Kinetics
Induced Syneresis
2.2.4. Statistical Analysis
3. Results and Discussion
3.1. Colloidal Characterization of the Suspensions
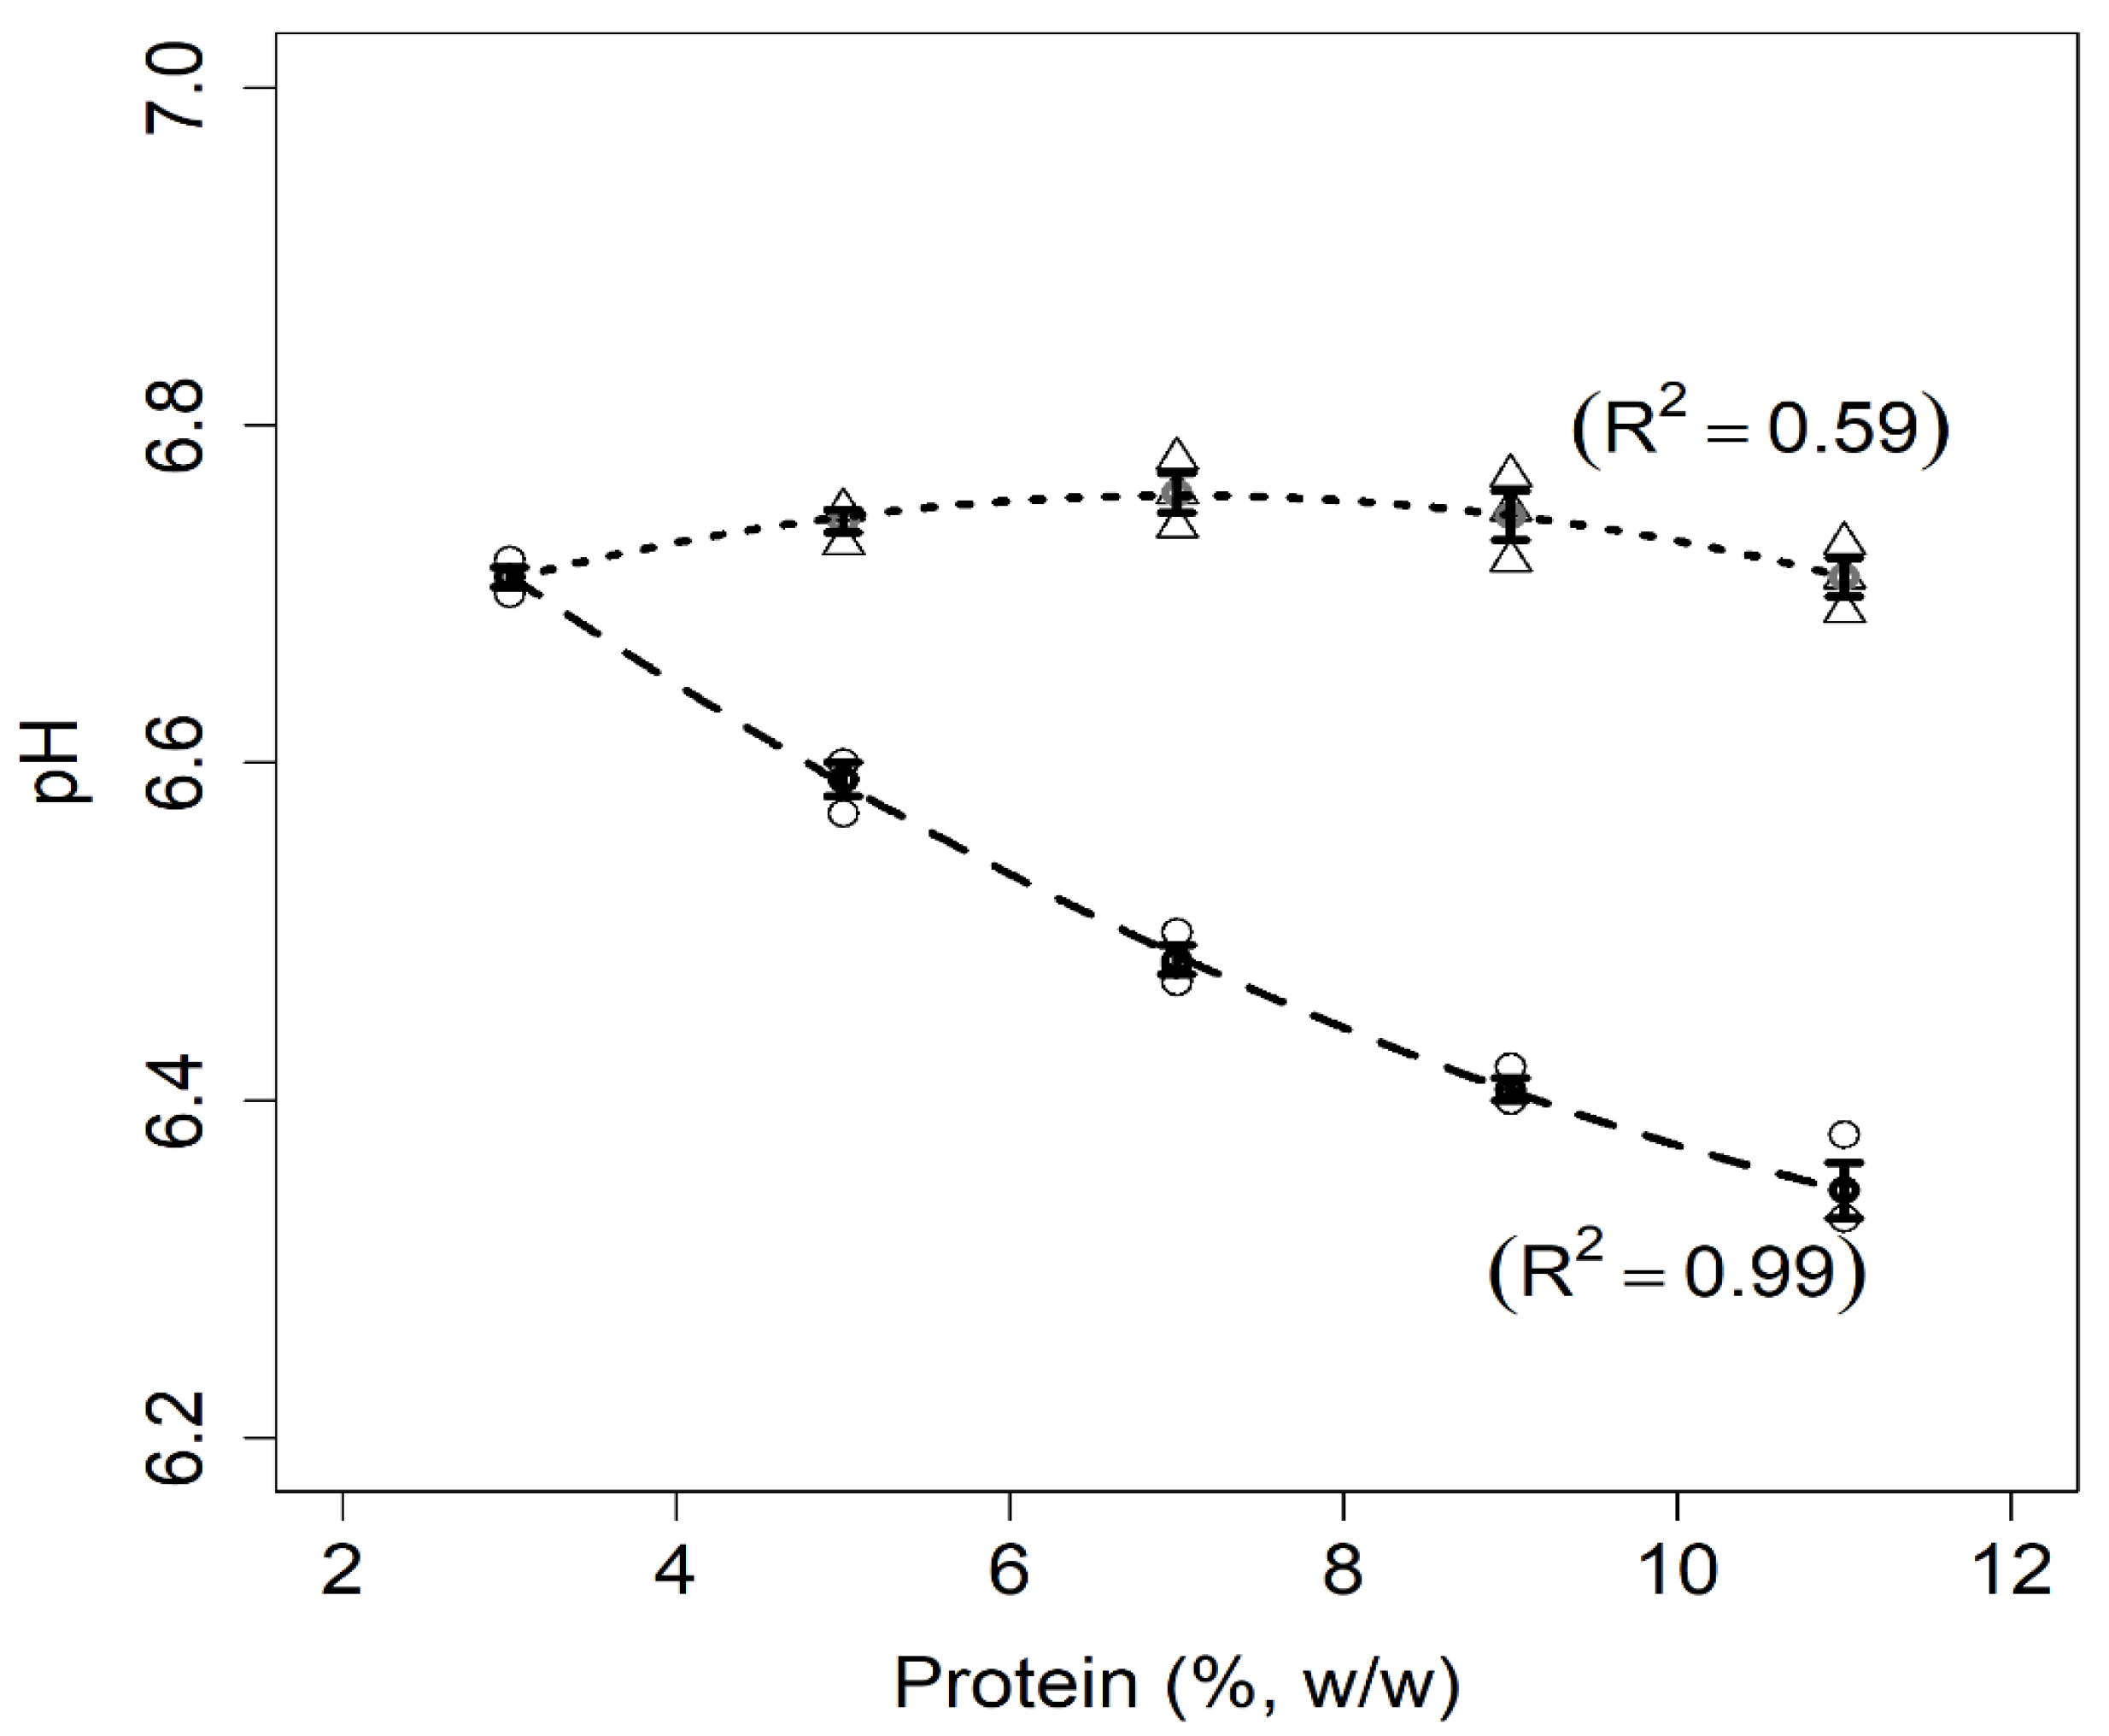
3.1.1. pH
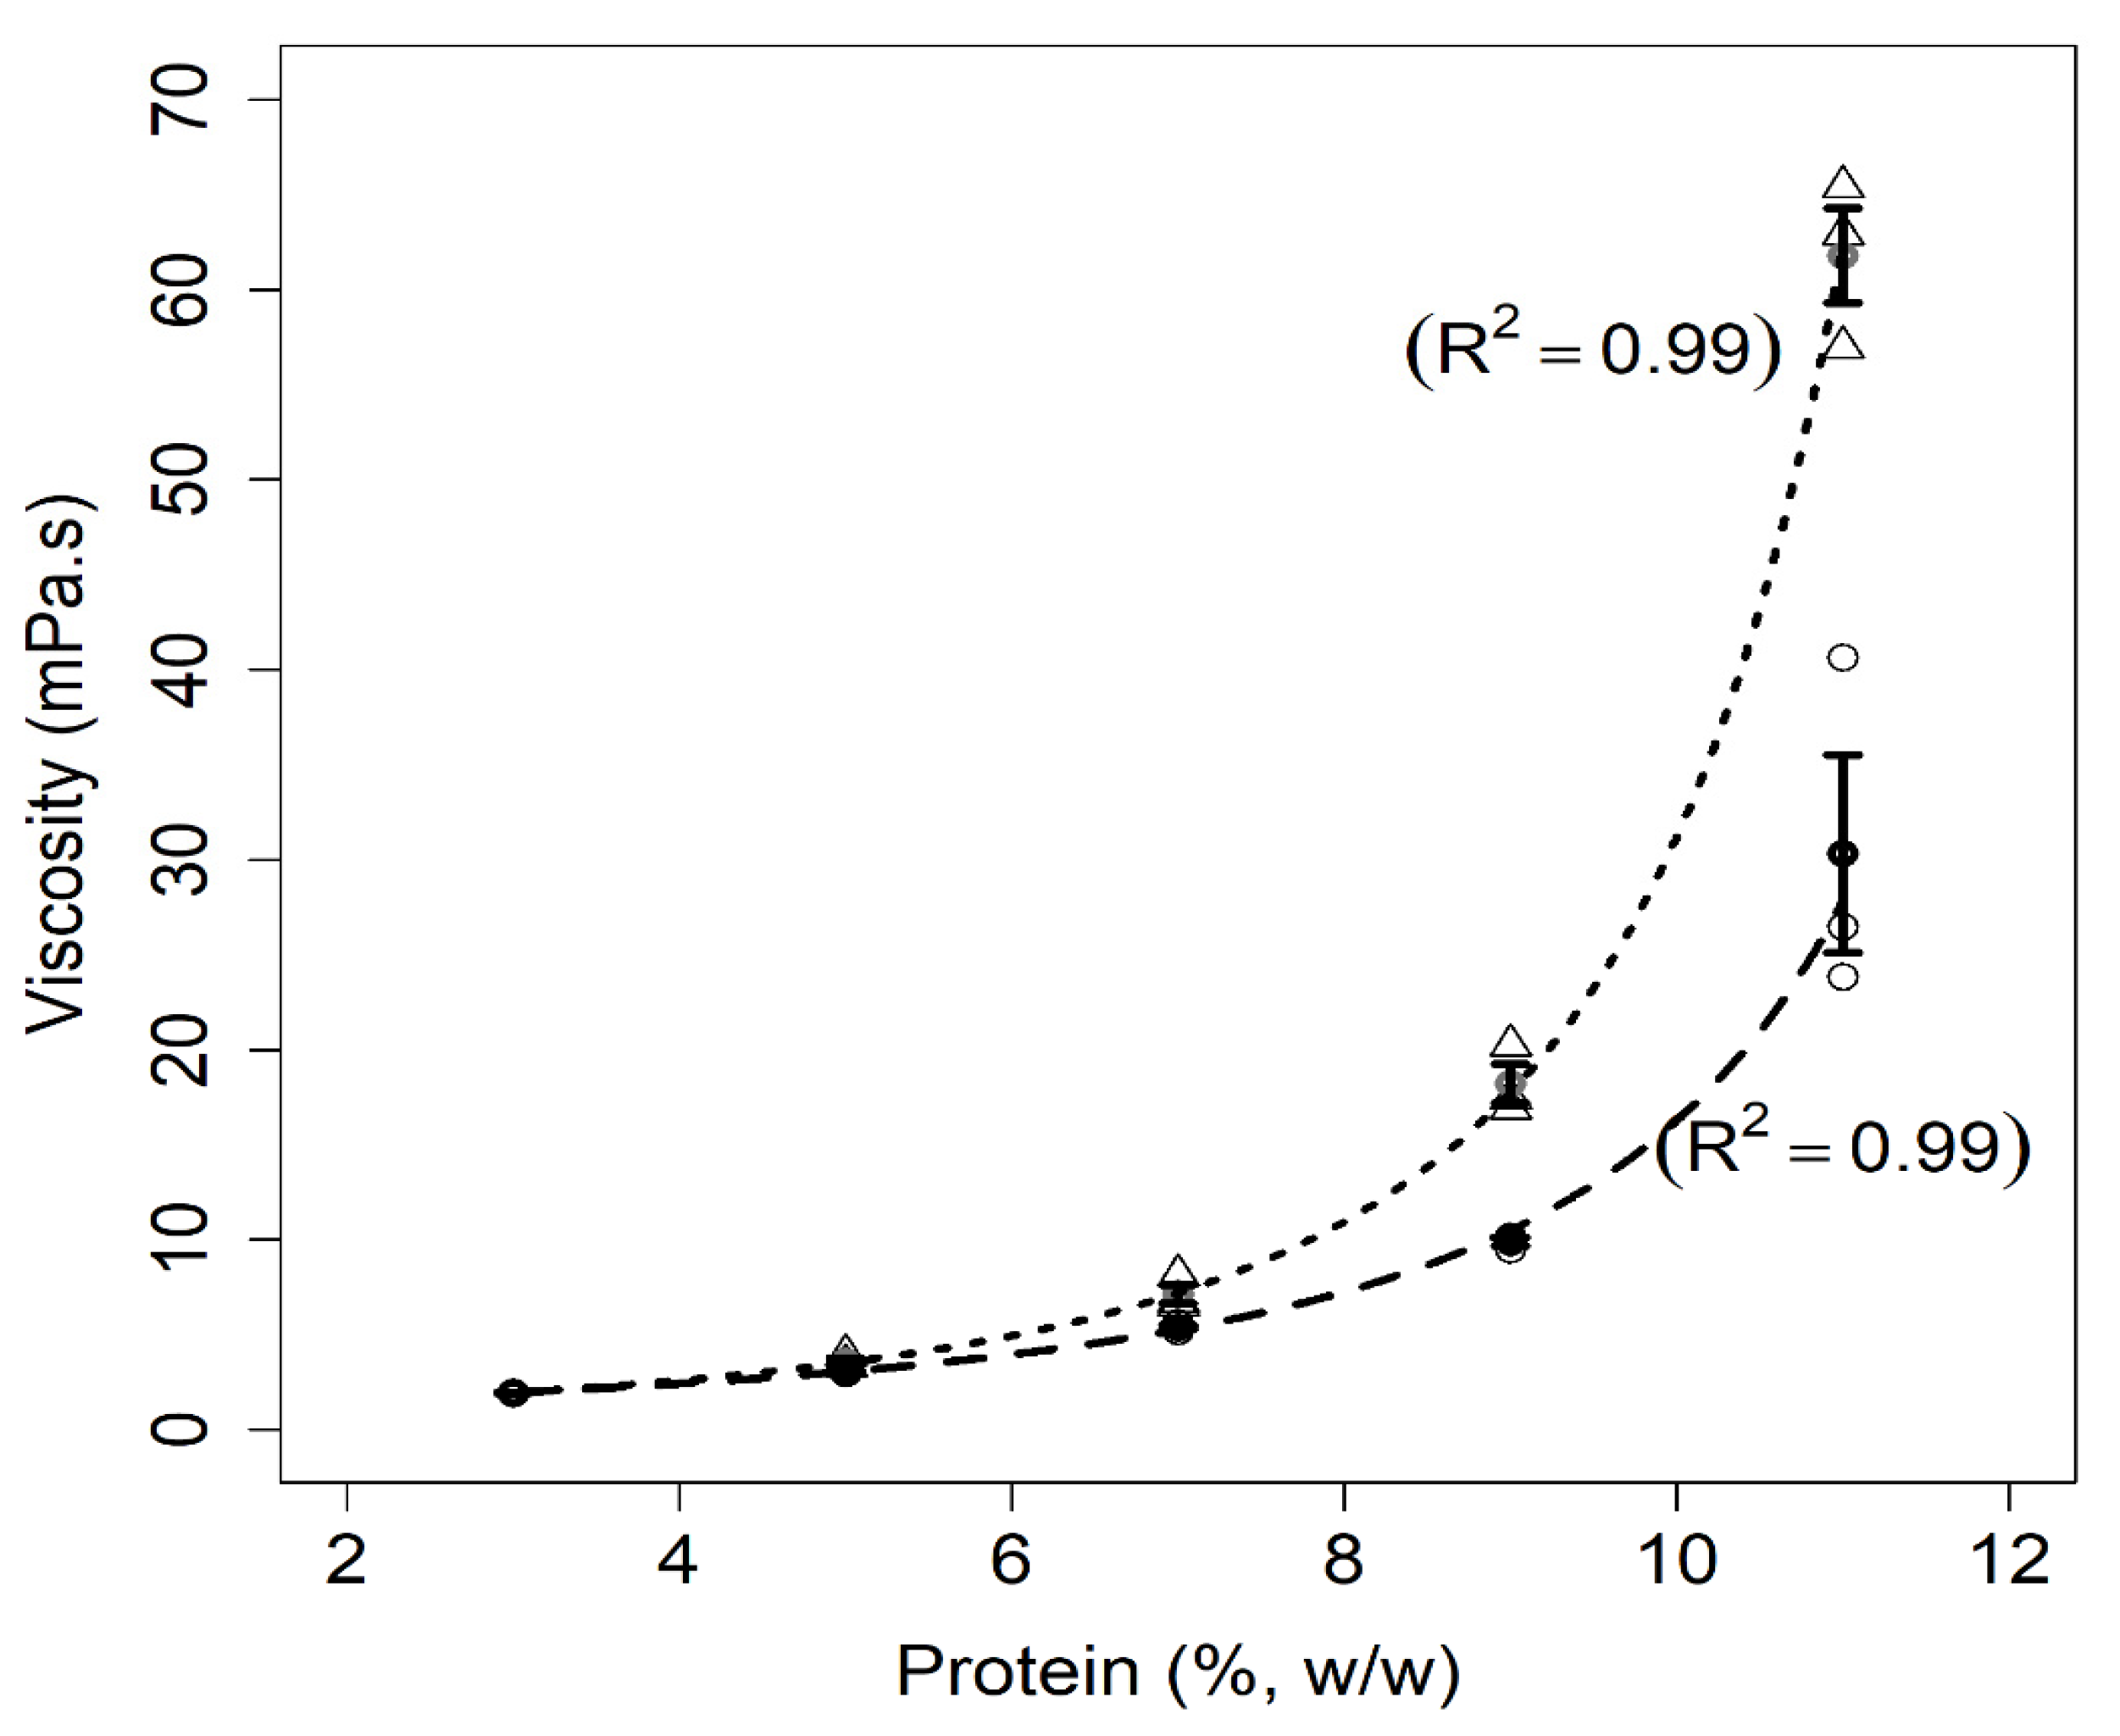
3.1.2. Viscosity
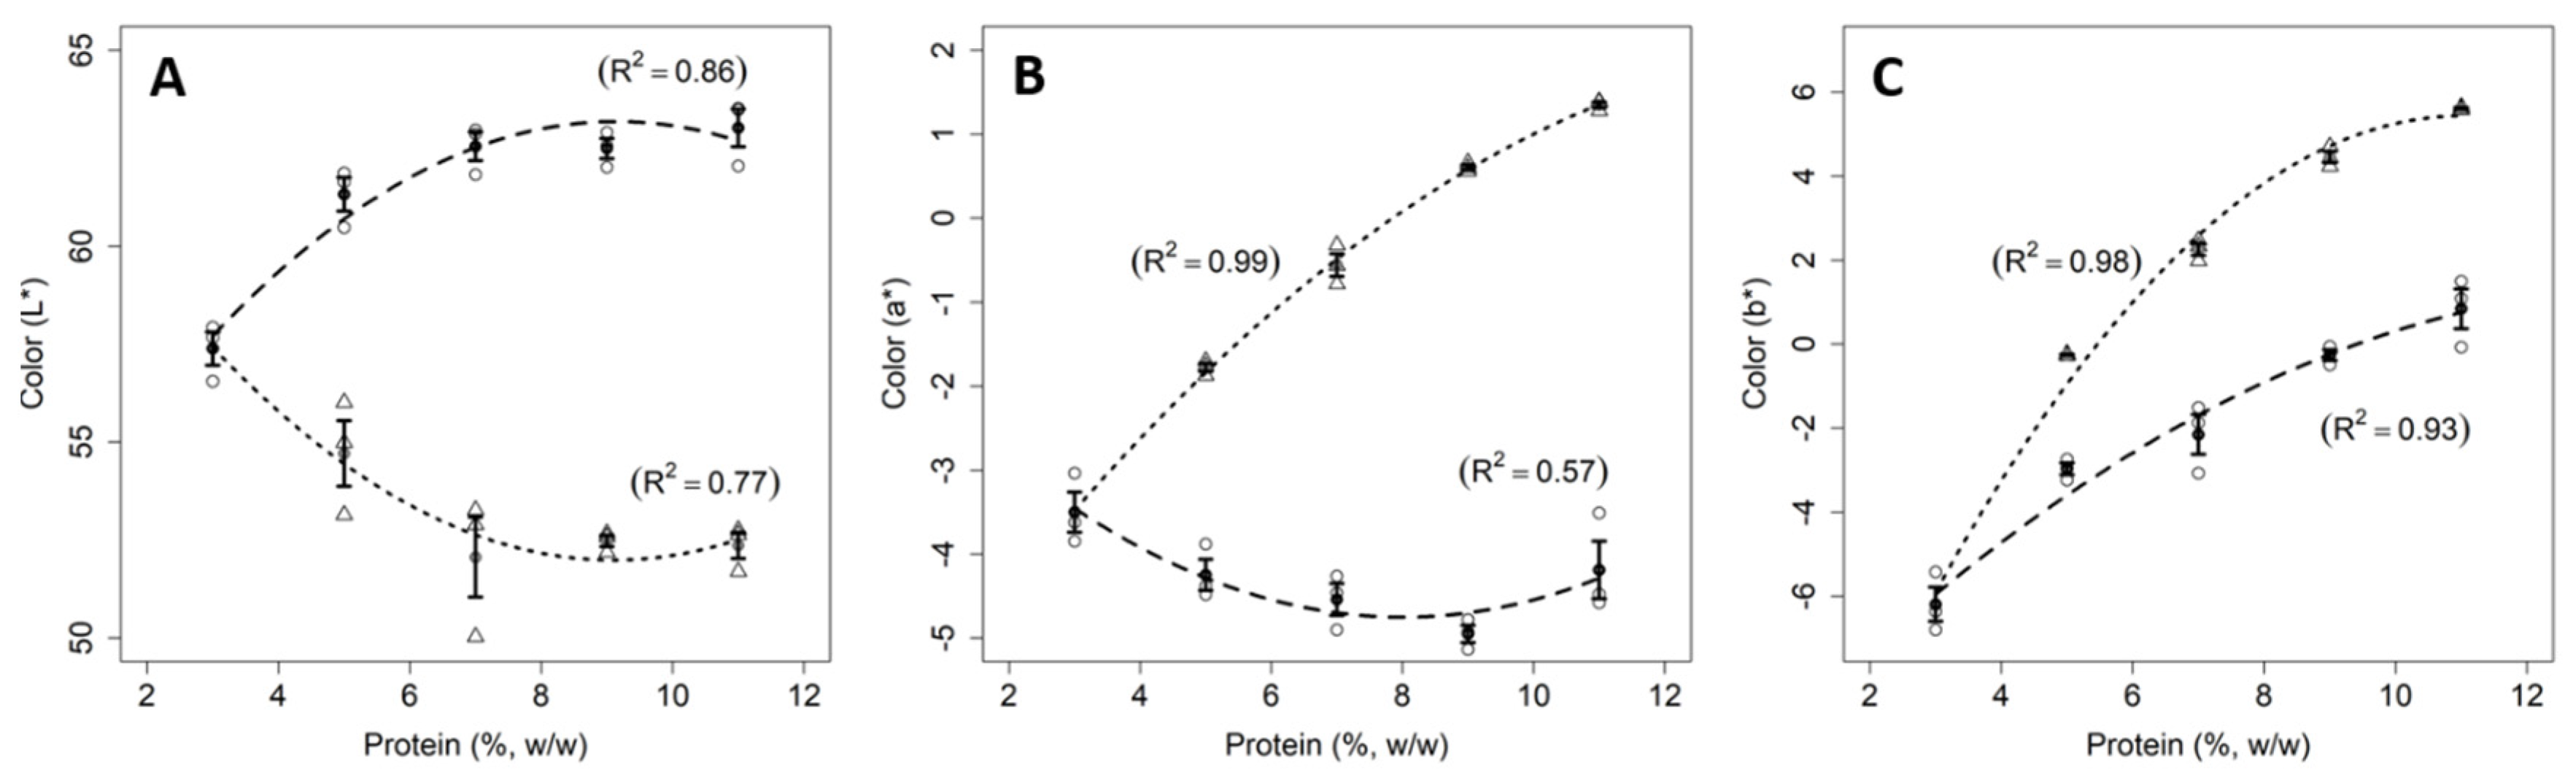
3.1.3. Color
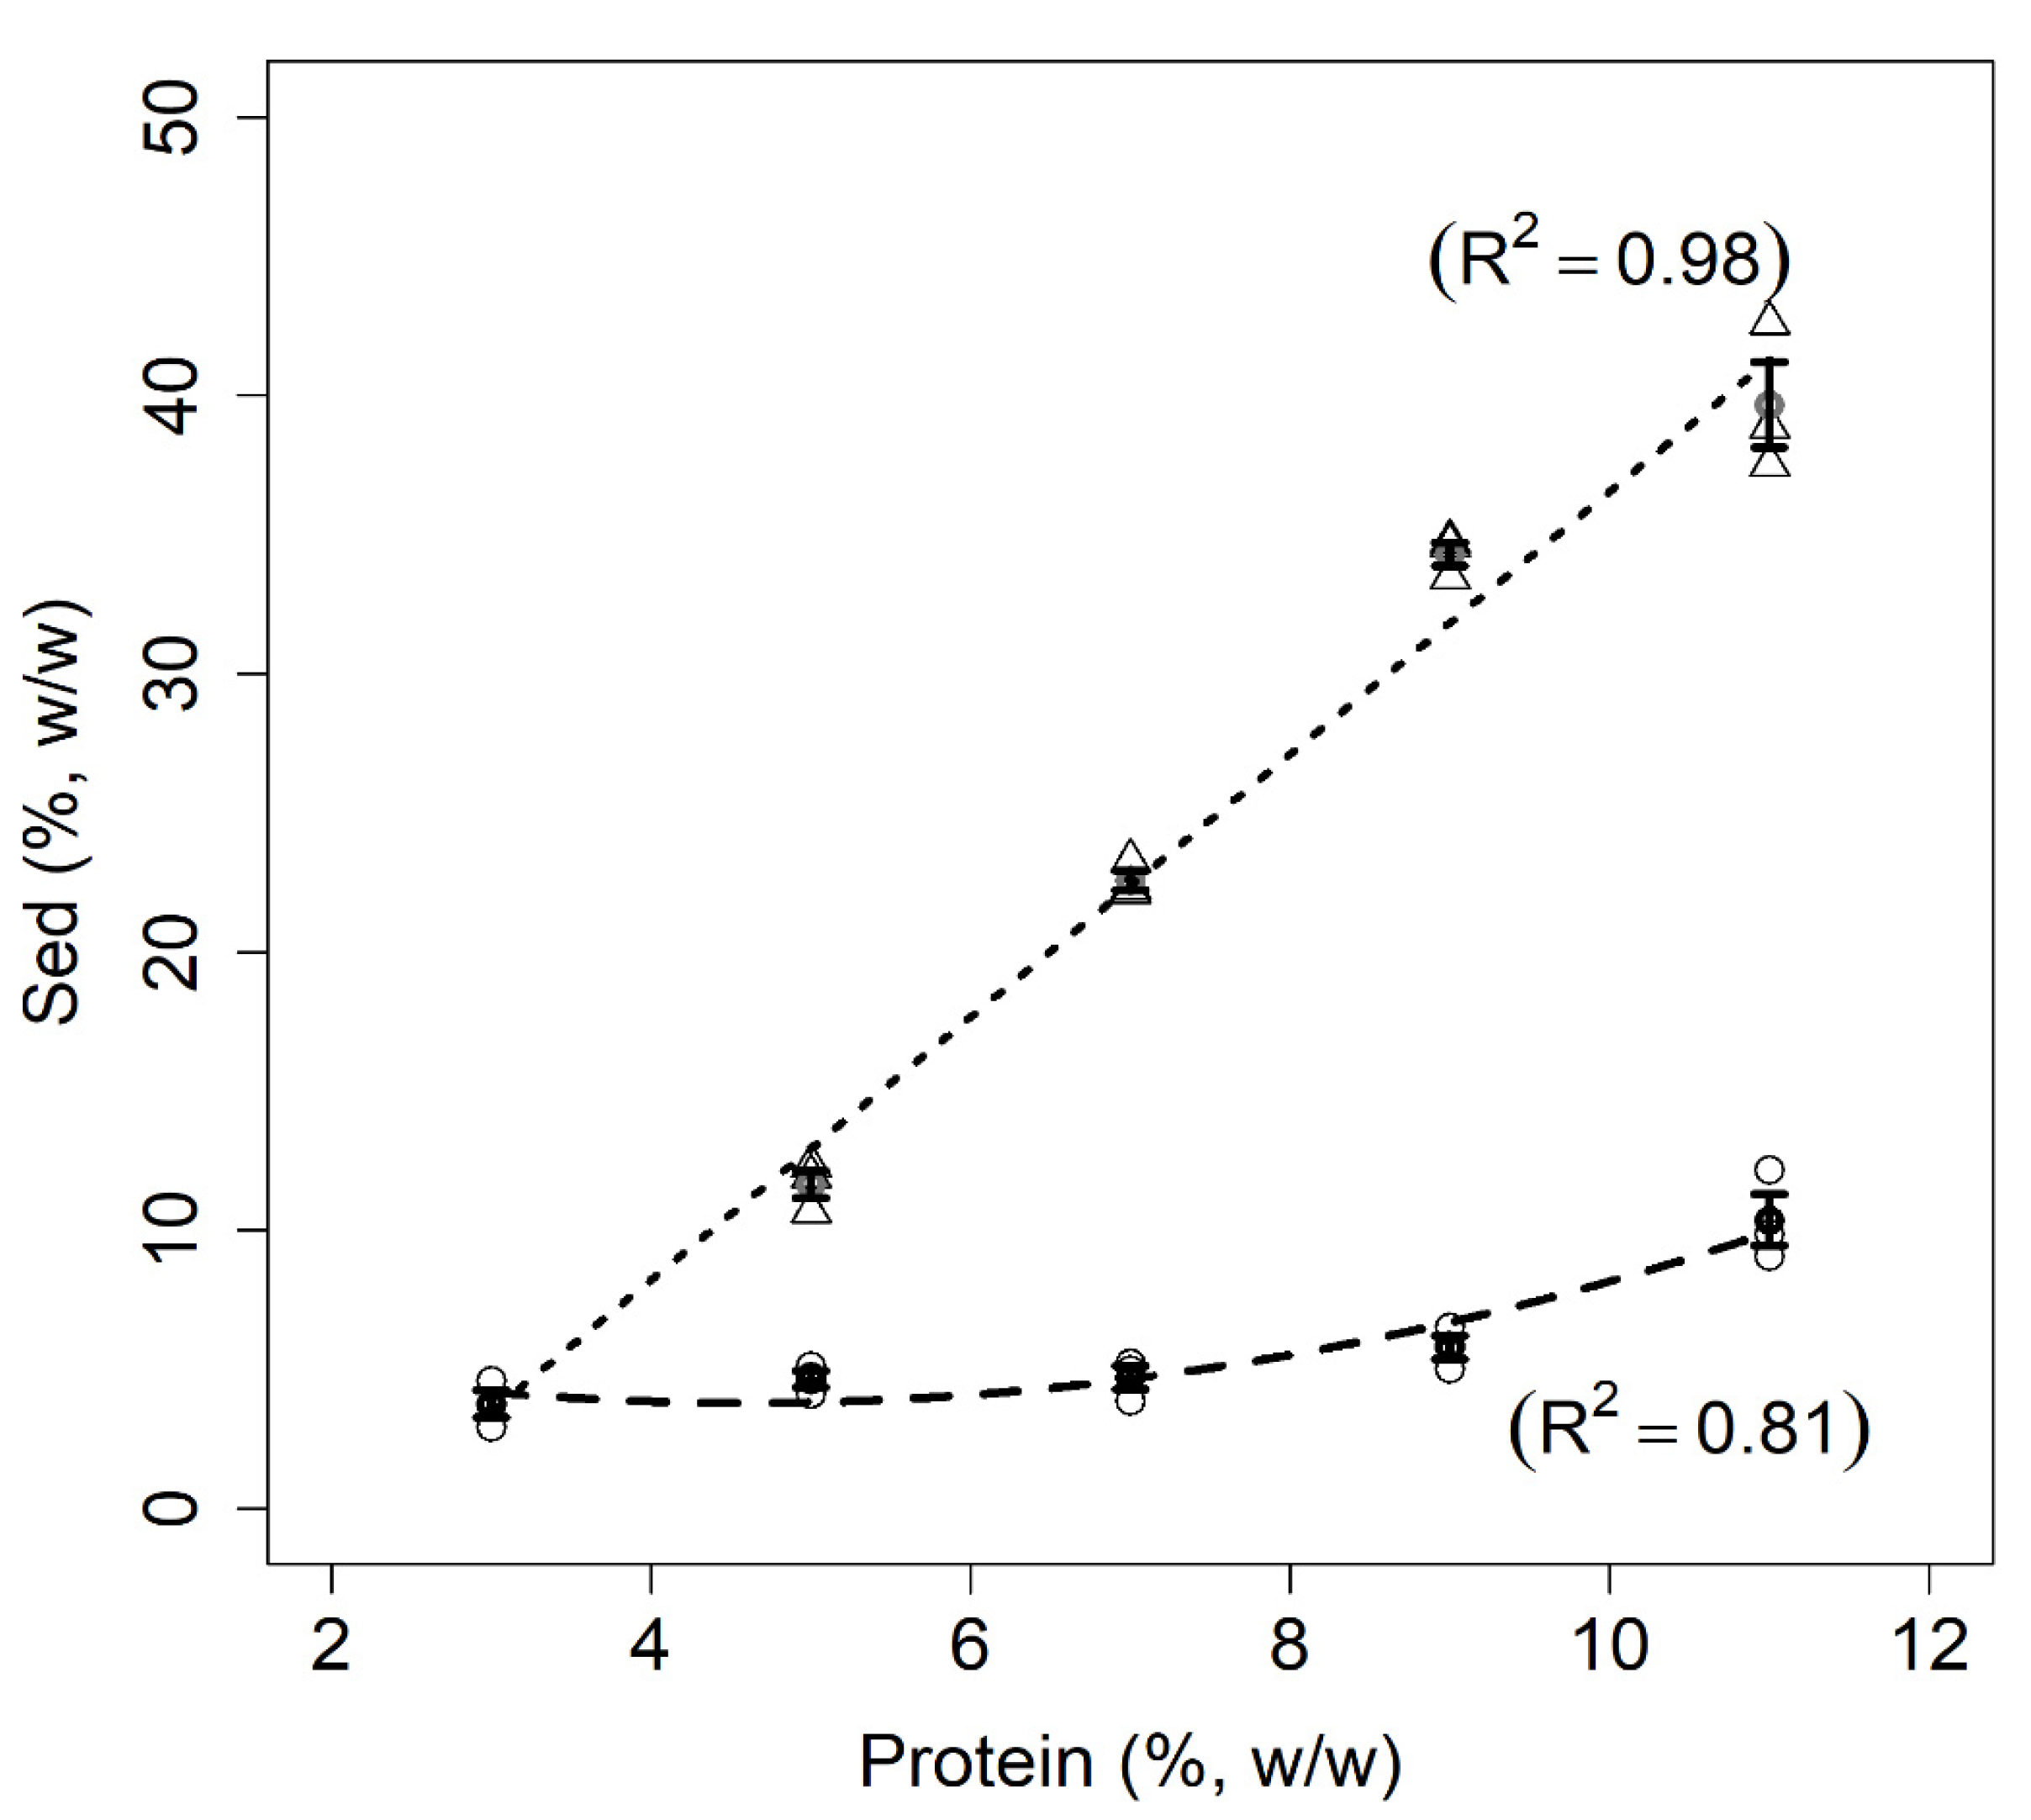
3.1.4. Sedimentable Material (SM)
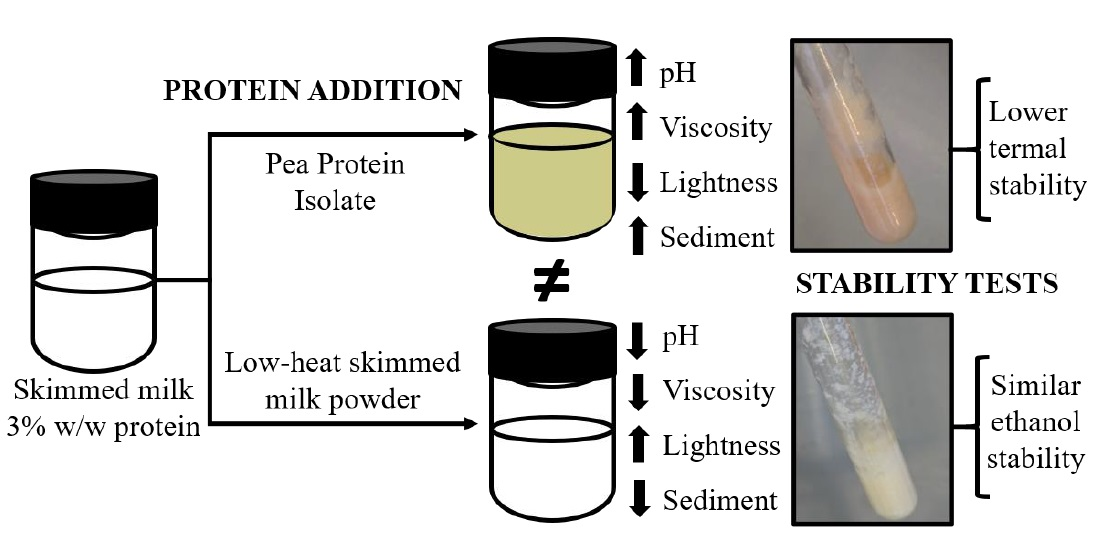
3.1.5. Heat Stability
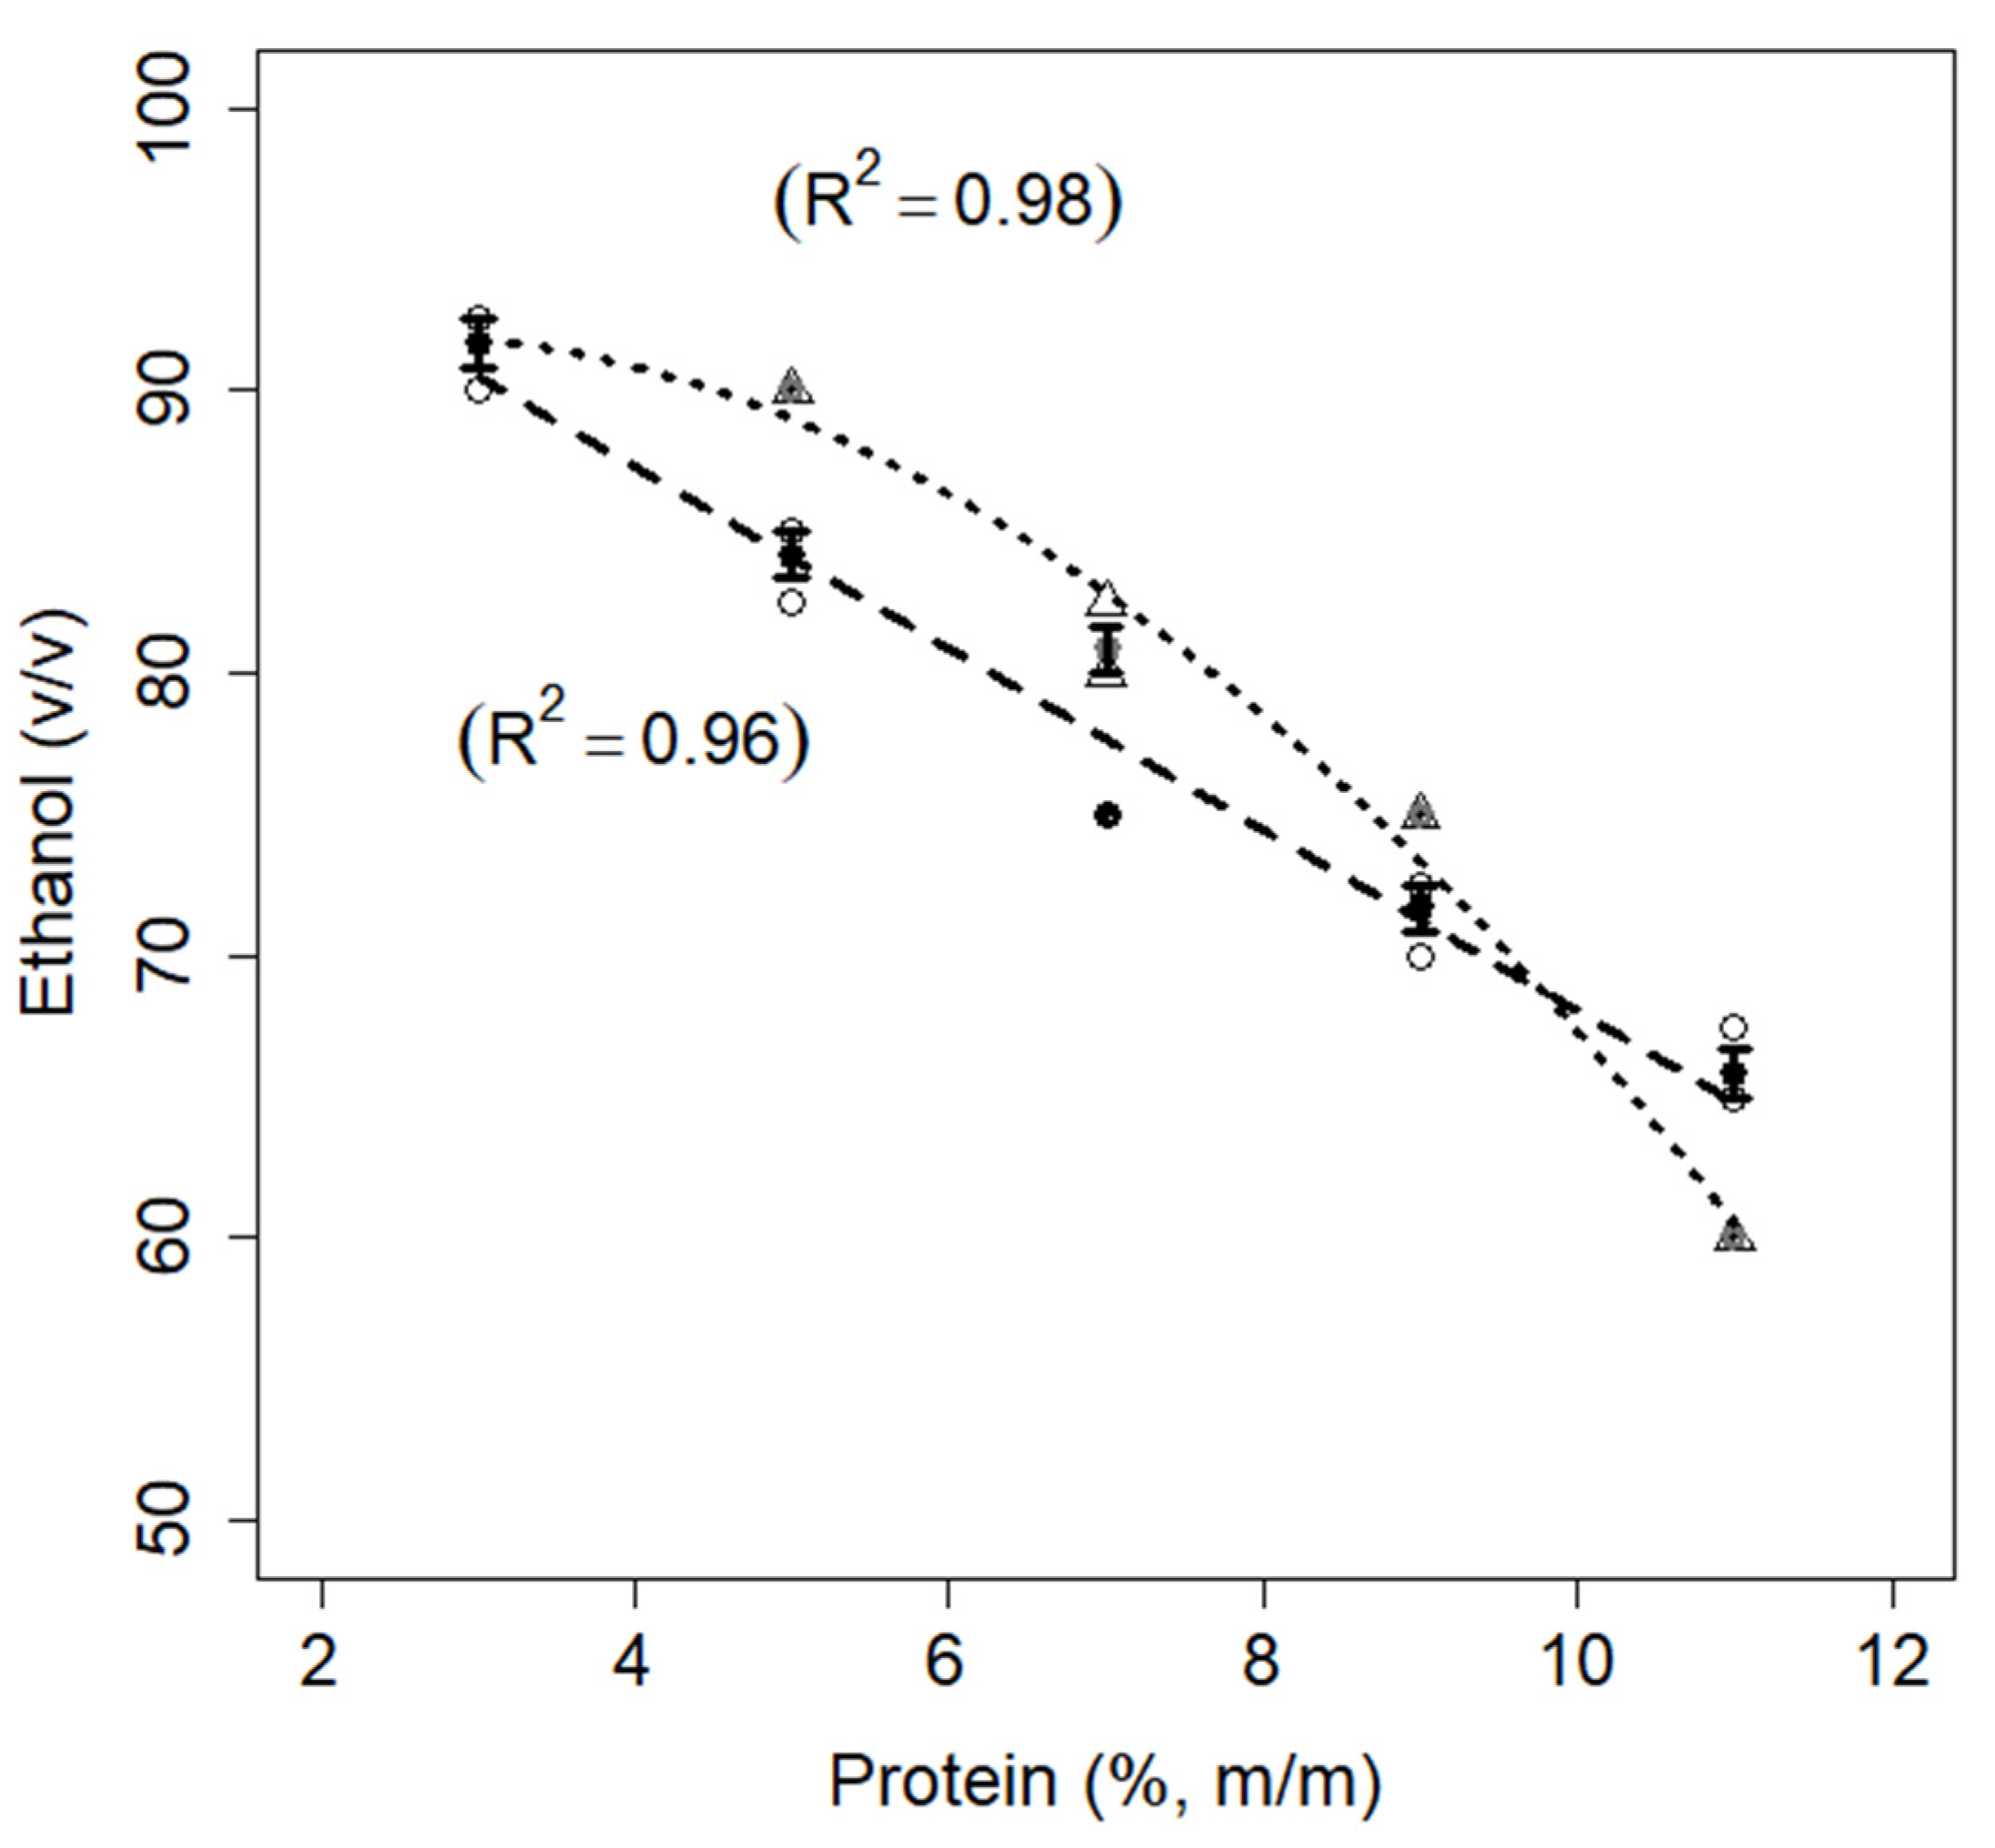
3.1.6. Ethanol Stability
3.2. Rheological Analysis of the Gels
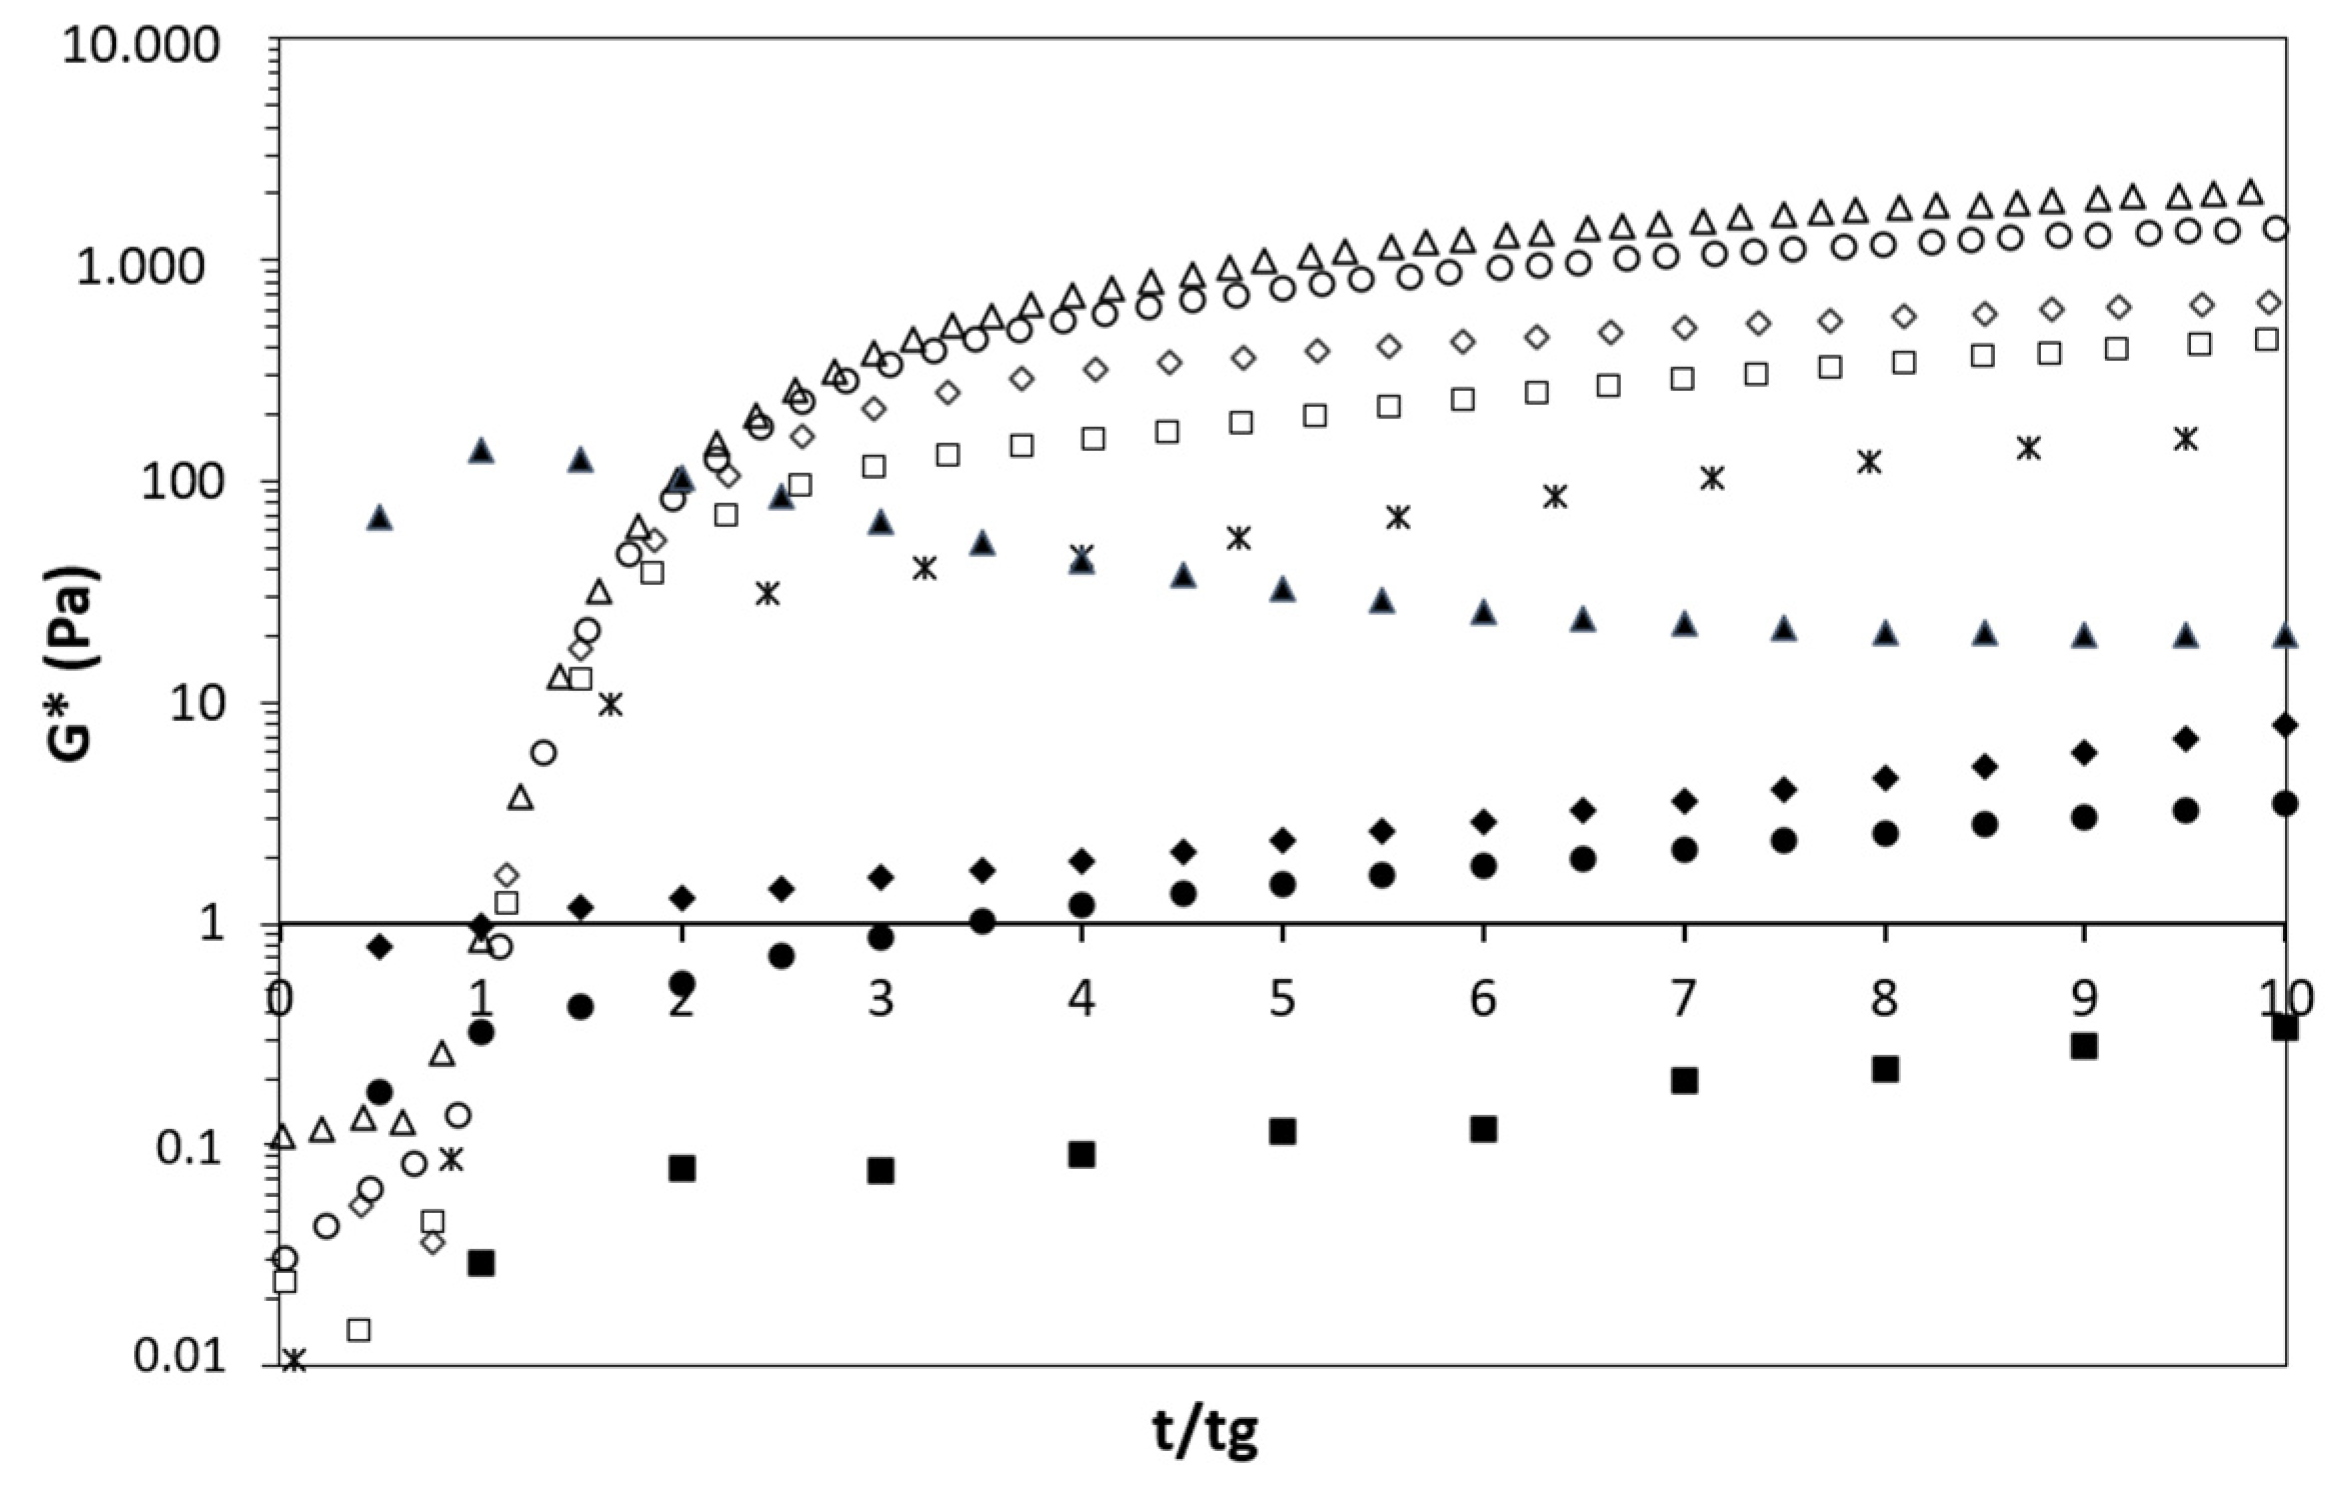
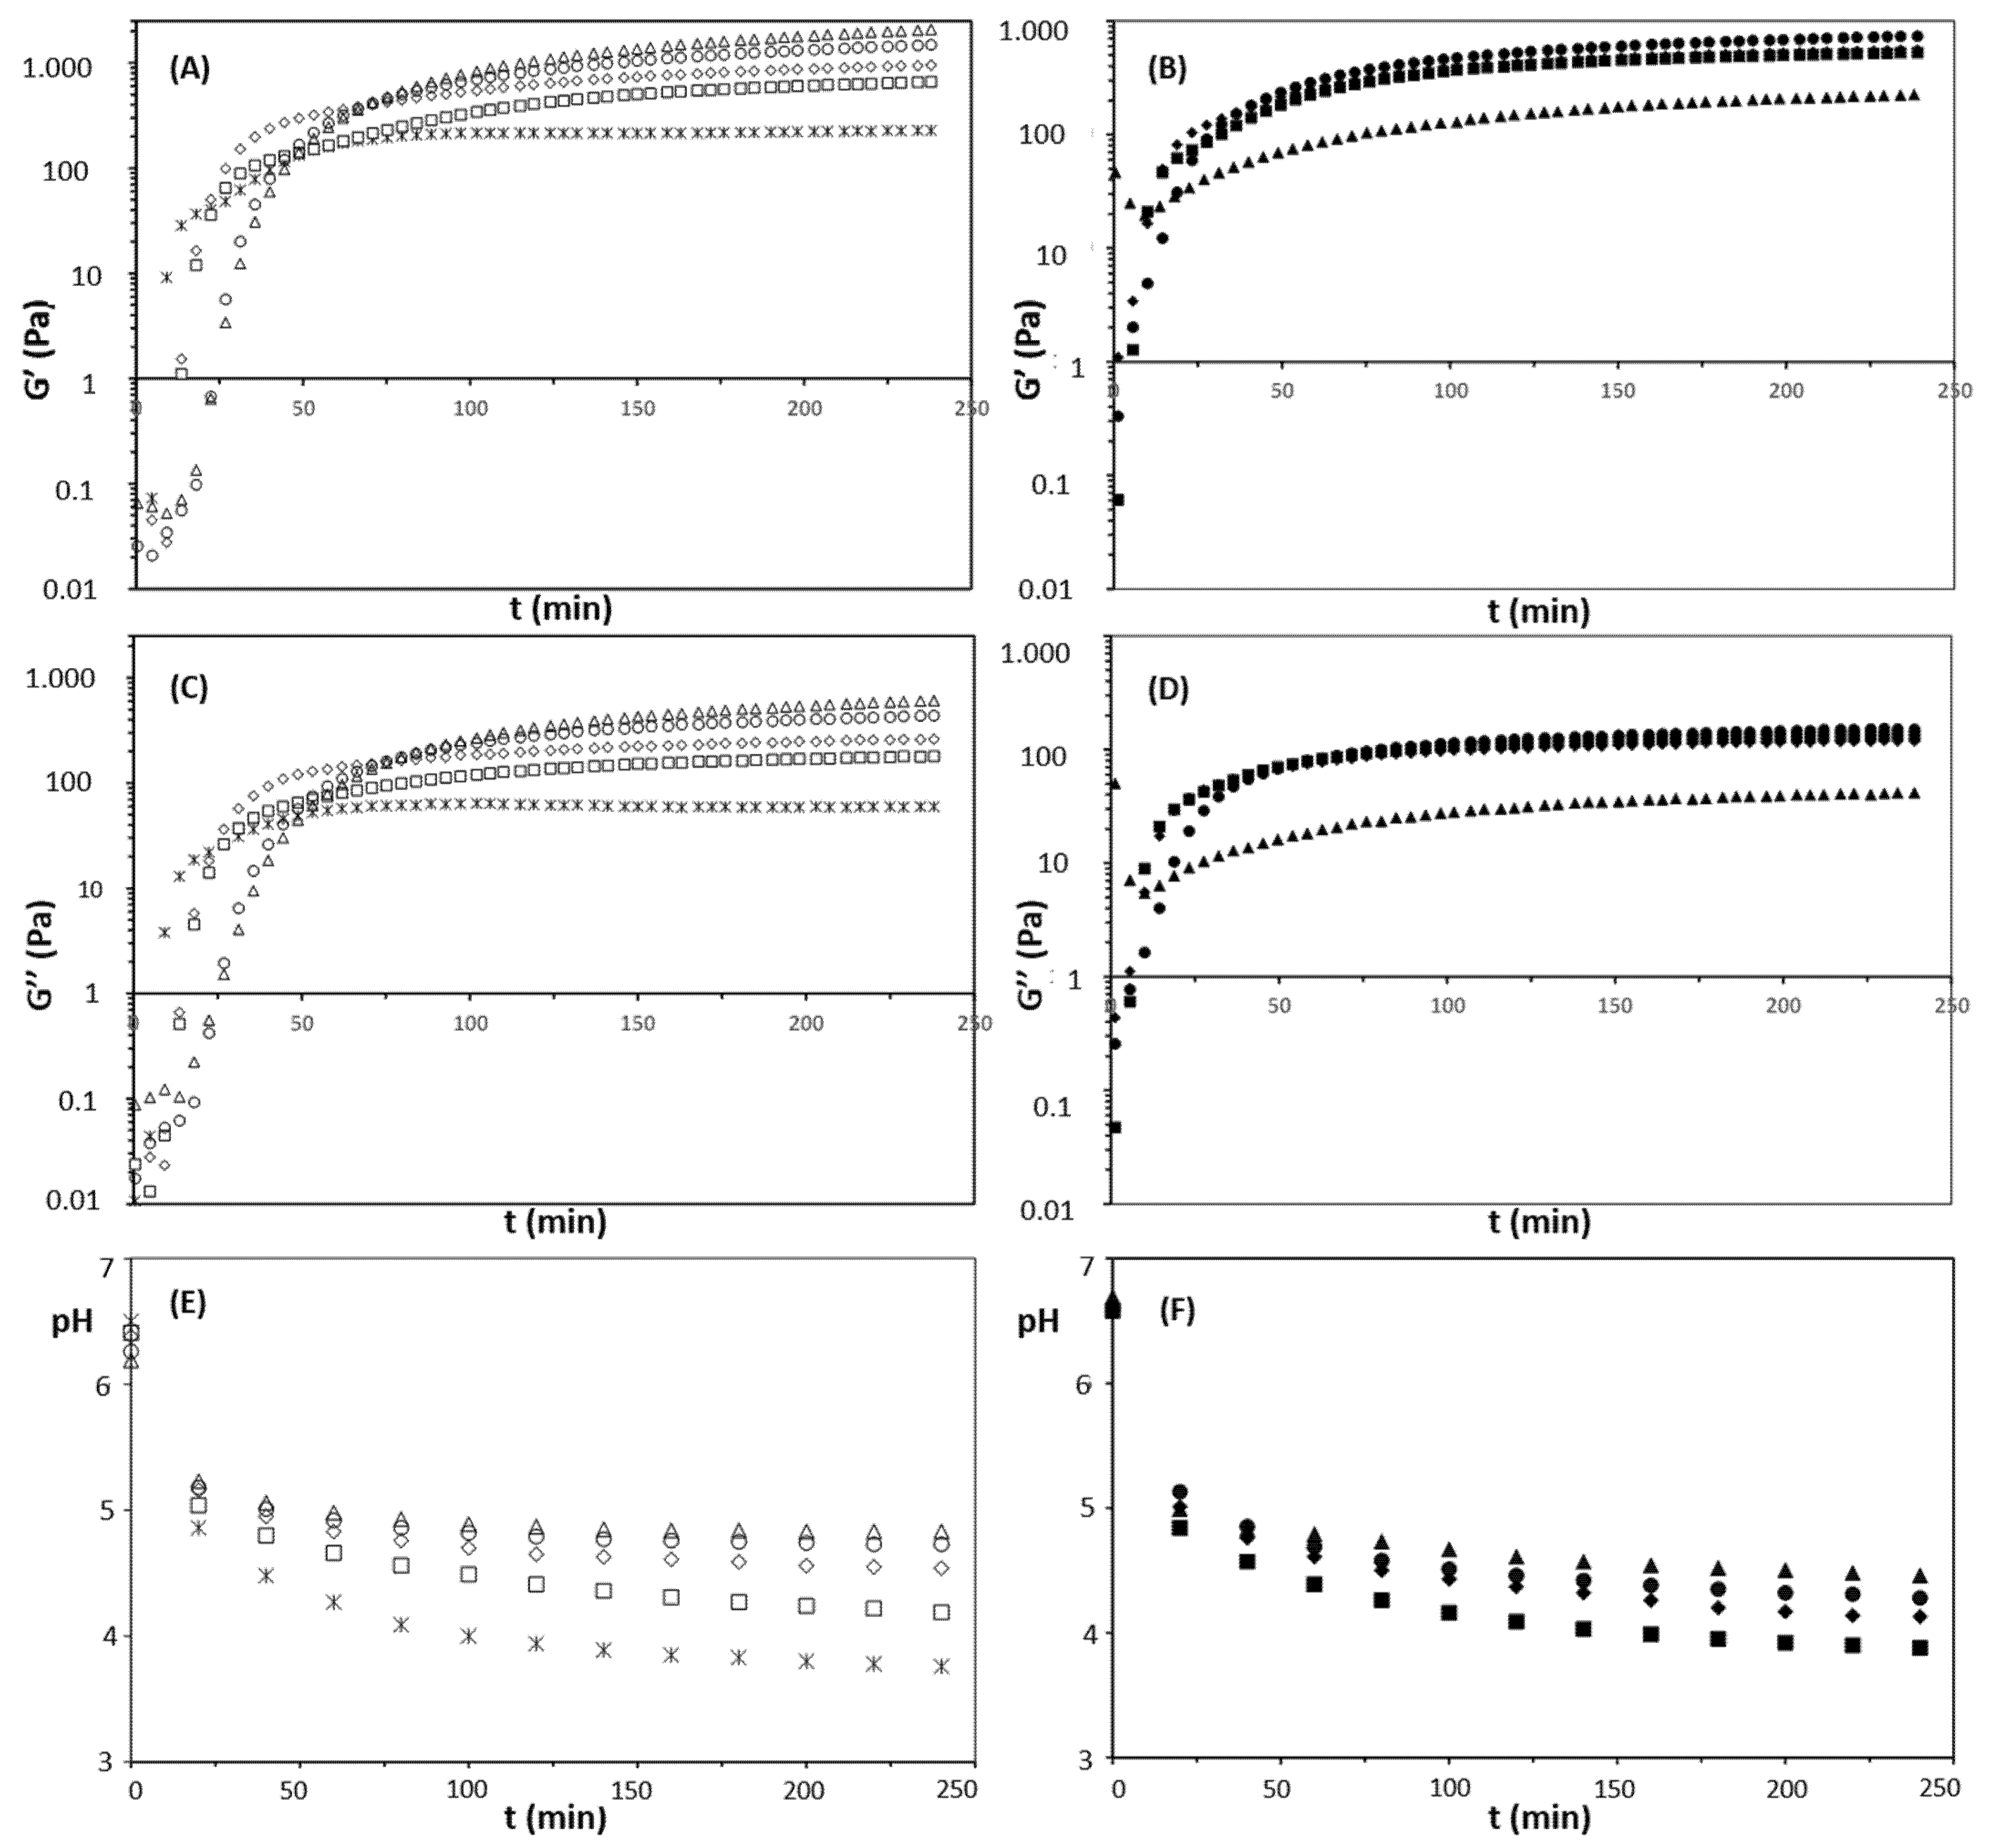
3.2.1. Initial Gelation Stage
3.2.2. Evolution of Gelling Properties
4. Conclusions
Supplementary Materials
Author Contributions
Funding
Informed Consent Statement
Data Availability Statement
Conflicts of Interest
References
- Searchinger, T.; Waite, R.; Hanson, C.; Ranganathan, J. Creating a sustainable food future a creating a sustainable food future world resources report. World Resour. Rep. 2019, 1, 558. [Google Scholar]
- Lu, Z.X.; He, J.F.; Zhang, Y.C.; Bing, D.J. Composition, physicochemical properties of pea protein and its application in functional foods. Crit. Rev. Food Sci. Nutr. 2020, 60, 2593–2605. [Google Scholar] [CrossRef] [PubMed]
- Tulbek, M.C.; Lam RS, H.; Wang, Y.C.; Asavajaru, P.; Lam, A. Pea: A Sustainable Vegetable Protein Crop. In Sustainable Protein Sources; Nadathur, S.R., Wanasundara, J.P.D., Scanlin, L., Eds.; Academic Press: Cambridge, MA, USA, 2016. [Google Scholar]
- Roland WS, U.; Pouvreau, L.; Curran, J.; Van De Velde, F.; De Kok, P.M.T. Flavor aspects of pulse ingredients. Cereal Chem. 2017, 94, 58–65. [Google Scholar] [CrossRef] [Green Version]
- Wang, Y.; Guldiken, B.; Tulbek, M.; House, J.D.; Nickerson, M. Impact of alcohol washing on the flavour profiles, functionality and protein quality of air classified pea protein enriched flour. Food Res. Int. 2020, 132, 109085. [Google Scholar] [CrossRef] [PubMed]
- Walstra, P.; Wouters, J.T.M.; Geurts, T.J. Dairy Science and Technology, 2nd ed.; Taylor & Francis: Boca Raton, FL, USA, 2006. [Google Scholar]
- Minj, S.; Anand, S. Whey proteins and its derivatives: Bioactivity, functionality, and current applications. Dairy 2020, 1, 233–258. [Google Scholar] [CrossRef]
- Ghanimah, M.A. Functional and technological aspects of whey powder and whey protein products. Int. J. Dairy Technol. 2018, 71, 454–459. [Google Scholar] [CrossRef]
- Ben-Harb, S.; Panouillé, M.; Huc-Mathis, D.; Moulin, G.; Saint-Eve, A.; Irlinger, F.; Bonnarme, P.; Michon, C.; Souchon, I. The rheological and microstructural properties of pea, milk, mixed pea/milk gels and gelled emulsions designed by thermal, acid, and enzyme treatments. Food Hydrocoll. 2018, 77, 75–84. [Google Scholar] [CrossRef]
- Kristensen, H.T.; Denon, Q.; Tavernier, I.; Gregersen, S.B.; Hammershøj, M.; Van Der Meeren, P.; Dewettinck, K.; Dalsgaard, T.K. Improved food functional properties of pea protein isolate in blends and co-precipitates with whey protein isolate. Food Hydrocoll. 2021, 113, 106556. [Google Scholar] [CrossRef]
- Grasberger, K.F.; Gregersen, S.B.; Jensen, H.B.; Sanggaard, K.W.; Corredig, M. Plant-dairy protein blends: Gelation behaviour in a filled particle matrix. Food Struct. 2021, 29, 100198. [Google Scholar] [CrossRef]
- Silva JV, C.; Cochereau, R.; Schmitt, C.; Chassenieux, C.; Nicolai, T. Heat-induced gelation of mixtures of micellar caseins and plant proteins in aqueous solution. Food Res. Int. 2019, 116, 1135–1143. [Google Scholar] [CrossRef]
- Mintel. Global Food and Drink Trends 2030. 2020. Available online: https://downloads.mintel.com/private/vKd7N/files/817369/ (accessed on 9 May 2022).
- Mession, J.L.; Roustel, S.; Saurel, R. Interactions in casein micelle—Pea protein system (Part II): Mixture acid gelation with glucono-δ-lactone. Food Hydrocoll. 2017, 73, 344–357. [Google Scholar] [CrossRef]
- Castro, W.F.; Cruz, A.G.; Bisinotto, M.S.; Guerreiro, L.M.R.; Faria, J.A.F.; Bolini, H.M.A.; Cunha, R.L. Development of probiotic dairy beverages: Rheological properties and application of mathematical models in sensory evaluation. J. Dairy Sci. 2013, 96, 16–25. [Google Scholar] [CrossRef] [Green Version]
- Silva, N.; Saint-Jalmes, A.; de Carvalho, A.F.; Gaucheron, F. Development of casein microgels from cross-linking of casein micelles by genipin. Langmuir 2014, 30, 10167–10175. [Google Scholar] [CrossRef]
- Rossini, K.; Noreña, C.P.; Brandelli, A. Changes in the color of white chocolate during storage: Potential roles of lipid oxidation and non-enzymatic browning reactions. J. Food Sci. Technol. 2011, 48, 305–311. [Google Scholar] [CrossRef] [Green Version]
- Casanova, F.; Nogueira Silva, N.F.; Gaucheron, F.; Nogueira, M.H.; Teixeira AV, N.C.; Perrone, I.T.; Alves, M.P.; Fidelis, P.C.; Carvalho, A.F.d. Stability of casein micelles cross-linked with genipin: A physicochemical study as a function of pH. Int. Dairy J. 2017, 68, 70–74. [Google Scholar] [CrossRef] [Green Version]
- Huppertz, T.; Grosman, S.; Fox, P.F.; Kelly, A.L. Heat and ethanol stabilities of high-pressure-treated bovine milk. Int. Dairy J. 2004, 14, 125–133. [Google Scholar] [CrossRef]
- Cavallieri AL, F.; da Cunha, R.L. The effects of acidification rate, pH and ageing time on the acidic cold set gelation of whey proteins. Food Hydrocoll. 2008, 22, 439–448. [Google Scholar] [CrossRef]
- Gilbert, A.; Rioux, L.E.; St-Gelais, D.; Turgeon, S.L. Studying stirred yogurt microstructure using optical microscopy: How smoothing temperature and storage time affect microgel size related to syneresis. J. Dairy Sci. 2020, 103, 2139–2152. [Google Scholar] [CrossRef] [Green Version]
- R Core Team. R: A Language and Environment for Statistical Computing (No. 2018). R Foundation for Statistical Computing. 2018. Available online: https://www.r-project.org/ (accessed on 9 May 2022).
- Oliveira, I.; Ferreira, I.; Silva, N. Colloidal Stability of Mixed Protein Systems—Milk and Isolated Pea Protein Suspensions. Version 1. 2020. Available online: https://data.mendeley.com/datasets/bw4sxsyg37/1 (accessed on 9 May 2022).
- Jiang, S.; Ding, J.; Andrade, J.; Rababah, T.M.; Almajwal, A.; Abulmeaty, M.M.; Feng, H. Modifying the physicochemical properties of pea protein by pH-shifting and ultrasound combined treatments. Ultrason. Sonochem. 2017, 38, 835–842. [Google Scholar] [CrossRef]
- Christiansen, M.V.; Dave, A.; Skibsted, L.H.; Ahrné, L. Functional properties of skim milk concentrates produced by reverse osmosis filtration and reconstituted commercial powders. Int. Dairy J. 2022, 126, 105225. [Google Scholar] [CrossRef]
- Štreimikytė, P.; Keršienė, M.; Eisinaitė, V.; Jasutienė, I.; Lesauskaitė, V.; Damulevičienė, G.; Knašienė, J.; Leskauskaitė, D. Formulating protein-based beverages for the dysphagia diets of the elderly: Viscosity, protein quality, in vitro digestion, and consumers acceptability. J. Sci. Food Agric. 2020, 100, 3895–3901. [Google Scholar] [CrossRef] [PubMed]
- Cheng, N.; Barbano, D.M.; Drake, M.A. Effect of pasteurization and fat, protein, casein to serum protein ratio, and milk temperature on milk beverage color and viscosity. J. Dairy Sci. 2019, 102, 2022–2043. [Google Scholar] [CrossRef] [PubMed]
- Mercan, E.; Sert, D.; Akın, N. Effect of high-pressure homogenisation on viscosity, particle size and microbiological characteristics of skim and whole milk concentrates. Int. Dairy J. 2018, 87, 93–99. [Google Scholar] [CrossRef]
- Bogahawaththa, D.; Chau, N.H.B.; Trivedi, J.; Dissanayake, M.; Vasiljevic, T. Impact of controlled shearing on solubility and heat stability of pea protein isolate dispersed in solutions with adjusted ionic strength. Food Res. Int. 2019, 125, 108522. [Google Scholar] [CrossRef]
- McPhie, M.G.; Daivis, P.J.; Snook, I.K. Viscosity of a binary mixture: Approach to the hydrodynamic limit. Phys. Rev. E Stat. Nonlinear Soft Matter Phys. 2006, 74, 031201. [Google Scholar] [CrossRef] [Green Version]
- Walstra, P. Physical Chemistry of Foods; CRC Press: New York, NY, USA, 2002. [Google Scholar]
- Lam, A.C.Y.; Can Karaca, A.; Tyler, R.T.; Nickerson, M.T. Pea protein isolates: Structure, extraction, and functionality. Food Rev. Int. 2018, 34, 126–147. [Google Scholar] [CrossRef]
- Saldanha do Carmo, C.; Silventoinen, P.; Nordgård, C.T.; Poudroux, C.; Dessev, T.; Zobel, H.; Holtekjølen, A.K.; Draget, K.I.; Holopainen-Mantila, U.; Knutsen, S.H.; et al. Is dehulling of peas and faba beans necessary prior to dry fractionation for the production of protein- and starch-rich fractions? Impact on physical properties, chemical composition and techno-functional properties. J. Food Eng. 2020, 278, 109937. [Google Scholar] [CrossRef]
- Mession, J.L.; Roustel, S.; Saurel, R. Interactions in casein micelle—Pea protein system (part I): Heat-induced denaturation and aggregation. Food Hydrocoll. 2017, 67, 229–242. [Google Scholar] [CrossRef]
- Dumpler, J.; Kulozik, U. Heat stability of concentrated skim milk as a function of heating time and temperature on a laboratory scale–Improved methodology and kinetic relationship. Int. Dairy J. 2015, 49, 111–117. [Google Scholar] [CrossRef]
- Holt, C.; Carver, J.A.; Ecroyd, H.; Thorn, D.C. Invited review: Caseins and the casein micelle: Their biological functions, structures, and behavior in foods. J. Dairy Sci. 2013, 96, 6127–6146. [Google Scholar] [CrossRef]
- De Kruif, C.G.; Holt, C. Casein micelle structure, functions and interactions. In Advanced Dairy Chemistry Volume 1 Proteins, 3rd ed.; Fox, P.F., McSweeney, P.L.H., Eds.; Springer: New York, NY, USA, 2003; pp. 233–276. [Google Scholar]
- Horne, D.S.; Muir, D.D. Alcohol and Heat Stability of Milk Protein. J. Dairy Sci. 1990, 73, 3613–3626. [Google Scholar] [CrossRef]
- Bogahawaththa, D.; Bao Chau, N.H.; Trivedi, J.; Dissanayake, M.; Vasiljevic, T. Impact of selected process parameters on solubility and heat stability of pea protein isolate. LWT 2019, 102, 246–253. [Google Scholar] [CrossRef]
- Schmitt, C.; Silva, J.V.; Amagliani, L.; Chassenieux, C.; Nicolai, T. Heat-induced and acid-induced gelation of dairy/plant protein dispersions and emulsions. Curr. Opin. Food Sci. 2019, 27, 43–48. [Google Scholar] [CrossRef]
- Gulati, A.; Hennessy, D.; O’Donovan, M.; McManus, J.J.; Fenelon, M.A.; Guinee, T.P. Dairy cow feeding system alters the characteristics of low-heat skim milk powder and processability of reconstituted skim milk. J. Dairy Sci. 2019, 102, 8630–8647. [Google Scholar] [CrossRef]
- Salaün, F.; Mietton, B.; Gaucheron, F. Buffering capacity of dairy products. Int. Dairy J. 2005, 15, 95–109. [Google Scholar] [CrossRef]
- Roesch, R.; Juneja, M.; Monagle, C.; Corredig, M. Aggregation of soy/milk mixes during acidification. Food Res. Int. 2004, 37, 209–215. [Google Scholar] [CrossRef]
- Anema, S.G. Effect of milk solids concentration on whey protein denaturation, particle size changes and solubilization of casein in high-pressure-treated skim milk. Int. Dairy J. 2008, 18, 228–235. [Google Scholar] [CrossRef]
- Mahomud, M.S.; Katsuno, N.; Zhang, L.; Nishizu, T. Physical, rheological, and microstructural properties of whey protein enriched yogurt influenced by heating the milk at different pH values. J. Food Process. Preserv. 2017, 41, e13236. [Google Scholar] [CrossRef]
- Li, Y.; Corredig, M. Acid induced gelation behavior of skim milk concentrated by membrane filtration. J. Texture Stud. 2020, 51, 101–110. [Google Scholar] [CrossRef]
- Wong, D.; Vasanthan, T.; Ozimek, L. Synergistic enhancement in the co-gelation of salt-soluble pea proteins and whey proteins. Food Chem. 2013, 141, 3913–3919. [Google Scholar] [CrossRef]
- Boye, J.I.; Aksay, S.; Roufik, S.; Ribéreau, S.; Mondor, M.; Farnworth, E.; Rajamohamed, S.H. Comparison of the functional properties of pea, chickpea and lentil protein concentrates processed using ultrafiltration and isoelectric precipitation techniques. Food Res. Int. 2010, 43, 537–546. [Google Scholar] [CrossRef]
- Meletharayil, G.H.; Patel, H.A.; Huppertz, T. Rheological properties and microstructure of high protein acid gels prepared from reconstituted milk protein concentrate powders of different protein contents. Int. Dairy J. 2015, 47, 64–71. [Google Scholar] [CrossRef]
- Yousseef, M.; Lafarge, C.; Valentin, D.; Lubbers, S.; Husson, F. Fermentation of cow milk and/or pea milk mixtures by different starter cultures: Physico-chemical and sensorial properties. LWT Food Sci. Technol. 2016, 69, 430–437. [Google Scholar] [CrossRef] [Green Version]


| Samples | Milk Protein (%) | Pea Protein (%) | Total Protein (%) |
|---|---|---|---|
| Control | 3 | - | 3 |
| Skimmed milk | 5 | - | 5 |
| 7 | - | 7 | |
| 9 | - | 9 | |
| 11 | - | 11 | |
| Mixed protein suspensions | 3 | 2 | 5 |
| 3 | 4 | 7 | |
| 3 | 6 | 9 | |
| 3 | 8 | 11 |
| Protein % (w/w) | Milk (sec.) | Mixed Suspensions (sec.) | t-Statistics | p-Values |
|---|---|---|---|---|
| 3 | 1314 ± 61 | -- | -- | |
| 5 | 506 ± 27 | 380 ± 25 | 3.44 | 0.026 * |
| 7 | 591 ± 5 | 284 ± 35 | 8.63 | 0.000 *** |
| 9 | 414 ± 5 | 178 ± 5 | 35.48 | 0.000 *** |
| 11 | 176 ± 6 | 144 ± 8 | 3.16 | 0.034 * |
| Protein Concentration % (w/w) | tg (sec.) | G* at tg (Pa) | Final G* (Pa) | Final pH | Induced Syneresis % (w/w) | |||||
|---|---|---|---|---|---|---|---|---|---|---|
| Milk | Mixed | Milk | Mixed | Milk | Mixed | Milk | Mixed | Milk | Mixed | |
| 3 | 240 ± 138 | - | 0.16 ± 0.18 | - | 227.6 ± 14.7 | - | 3.76 ± 0.04 | 72.1 ± 1.9 | - | |
| 5 | 642 ± 84 | 90 ± 48 | 0.27 ± 0.07 | 0.11 ± 0.03 | 688.5 ± 24.3 | 535.9 ± 23.7 | 4.19 ± 0.05 | 3.88 ± 0.04 | 62.0 ± 1.5 | 49.6 ± 6.7 |
| 7 | 834 ± 216 | 48 ± 6 | 0.32 ± 0.14 | 0.90 ± 0.12 | 954.6 ± 162.4 | 545.3 ± 34.9 | 4.54 ± 0.03 | 4.13 ± 0.05 | 32.9 ± 8.1 | 46.5 ± 0.45 |
| 9 | 1152 ± 126 | 54 ± 12 | 0.45 ± 0.16 | 2.77 ± 3.77 | 1054.8 ± 160.1 | 900.7 ± 298.4 | 4.73 ± 0.01 | 4.28 ± 0.04 | 2.3 ± 0.2 | 46.5 ± 8.7 |
| 11 | 1140 ± 288 | - | 0.60 ± 0.35 | - | 2076.9 ± 144.2 | 278.0 ± 68.4 | 4.83 ± 0.01 | 4.46 ± 0.03 | 1.5 ± 0.5 | 25.9 ± 1.1 |
Publisher’s Note: MDPI stays neutral with regard to jurisdictional claims in published maps and institutional affiliations. |
© 2022 by the authors. Licensee MDPI, Basel, Switzerland. This article is an open access article distributed under the terms and conditions of the Creative Commons Attribution (CC BY) license (https://creativecommons.org/licenses/by/4.0/).
Share and Cite
Oliveira, I.C.; de Paula Ferreira, I.E.; Casanova, F.; Cavallieri, A.L.F.; Lima Nascimento, L.G.; de Carvalho, A.F.; Nogueira Silva, N.F. Colloidal and Acid Gelling Properties of Mixed Milk and Pea Protein Suspensions. Foods 2022, 11, 1383. https://doi.org/10.3390/foods11101383
Oliveira IC, de Paula Ferreira IE, Casanova F, Cavallieri ALF, Lima Nascimento LG, de Carvalho AF, Nogueira Silva NF. Colloidal and Acid Gelling Properties of Mixed Milk and Pea Protein Suspensions. Foods. 2022; 11(10):1383. https://doi.org/10.3390/foods11101383
Chicago/Turabian StyleOliveira, Isabelle Carolina, Iuri Emmanuel de Paula Ferreira, Federico Casanova, Angelo Luiz Fazani Cavallieri, Luis Gustavo Lima Nascimento, Antônio Fernandes de Carvalho, and Naaman Francisco Nogueira Silva. 2022. "Colloidal and Acid Gelling Properties of Mixed Milk and Pea Protein Suspensions" Foods 11, no. 10: 1383. https://doi.org/10.3390/foods11101383