
Temporal Change in Iron Content of Vegetables and Legumes in Australia: A Scoping Review

 , , ,
, , ,
Abstract
:1. Introduction
2. Materials and Methods
2.1. Eligibility Criteria
2.2. Information Sources and Search
2.3. Selection of Sources of Evidence
2.4. Data Charting Process and Data Items
2.5. Synthesis of Results
3. Results
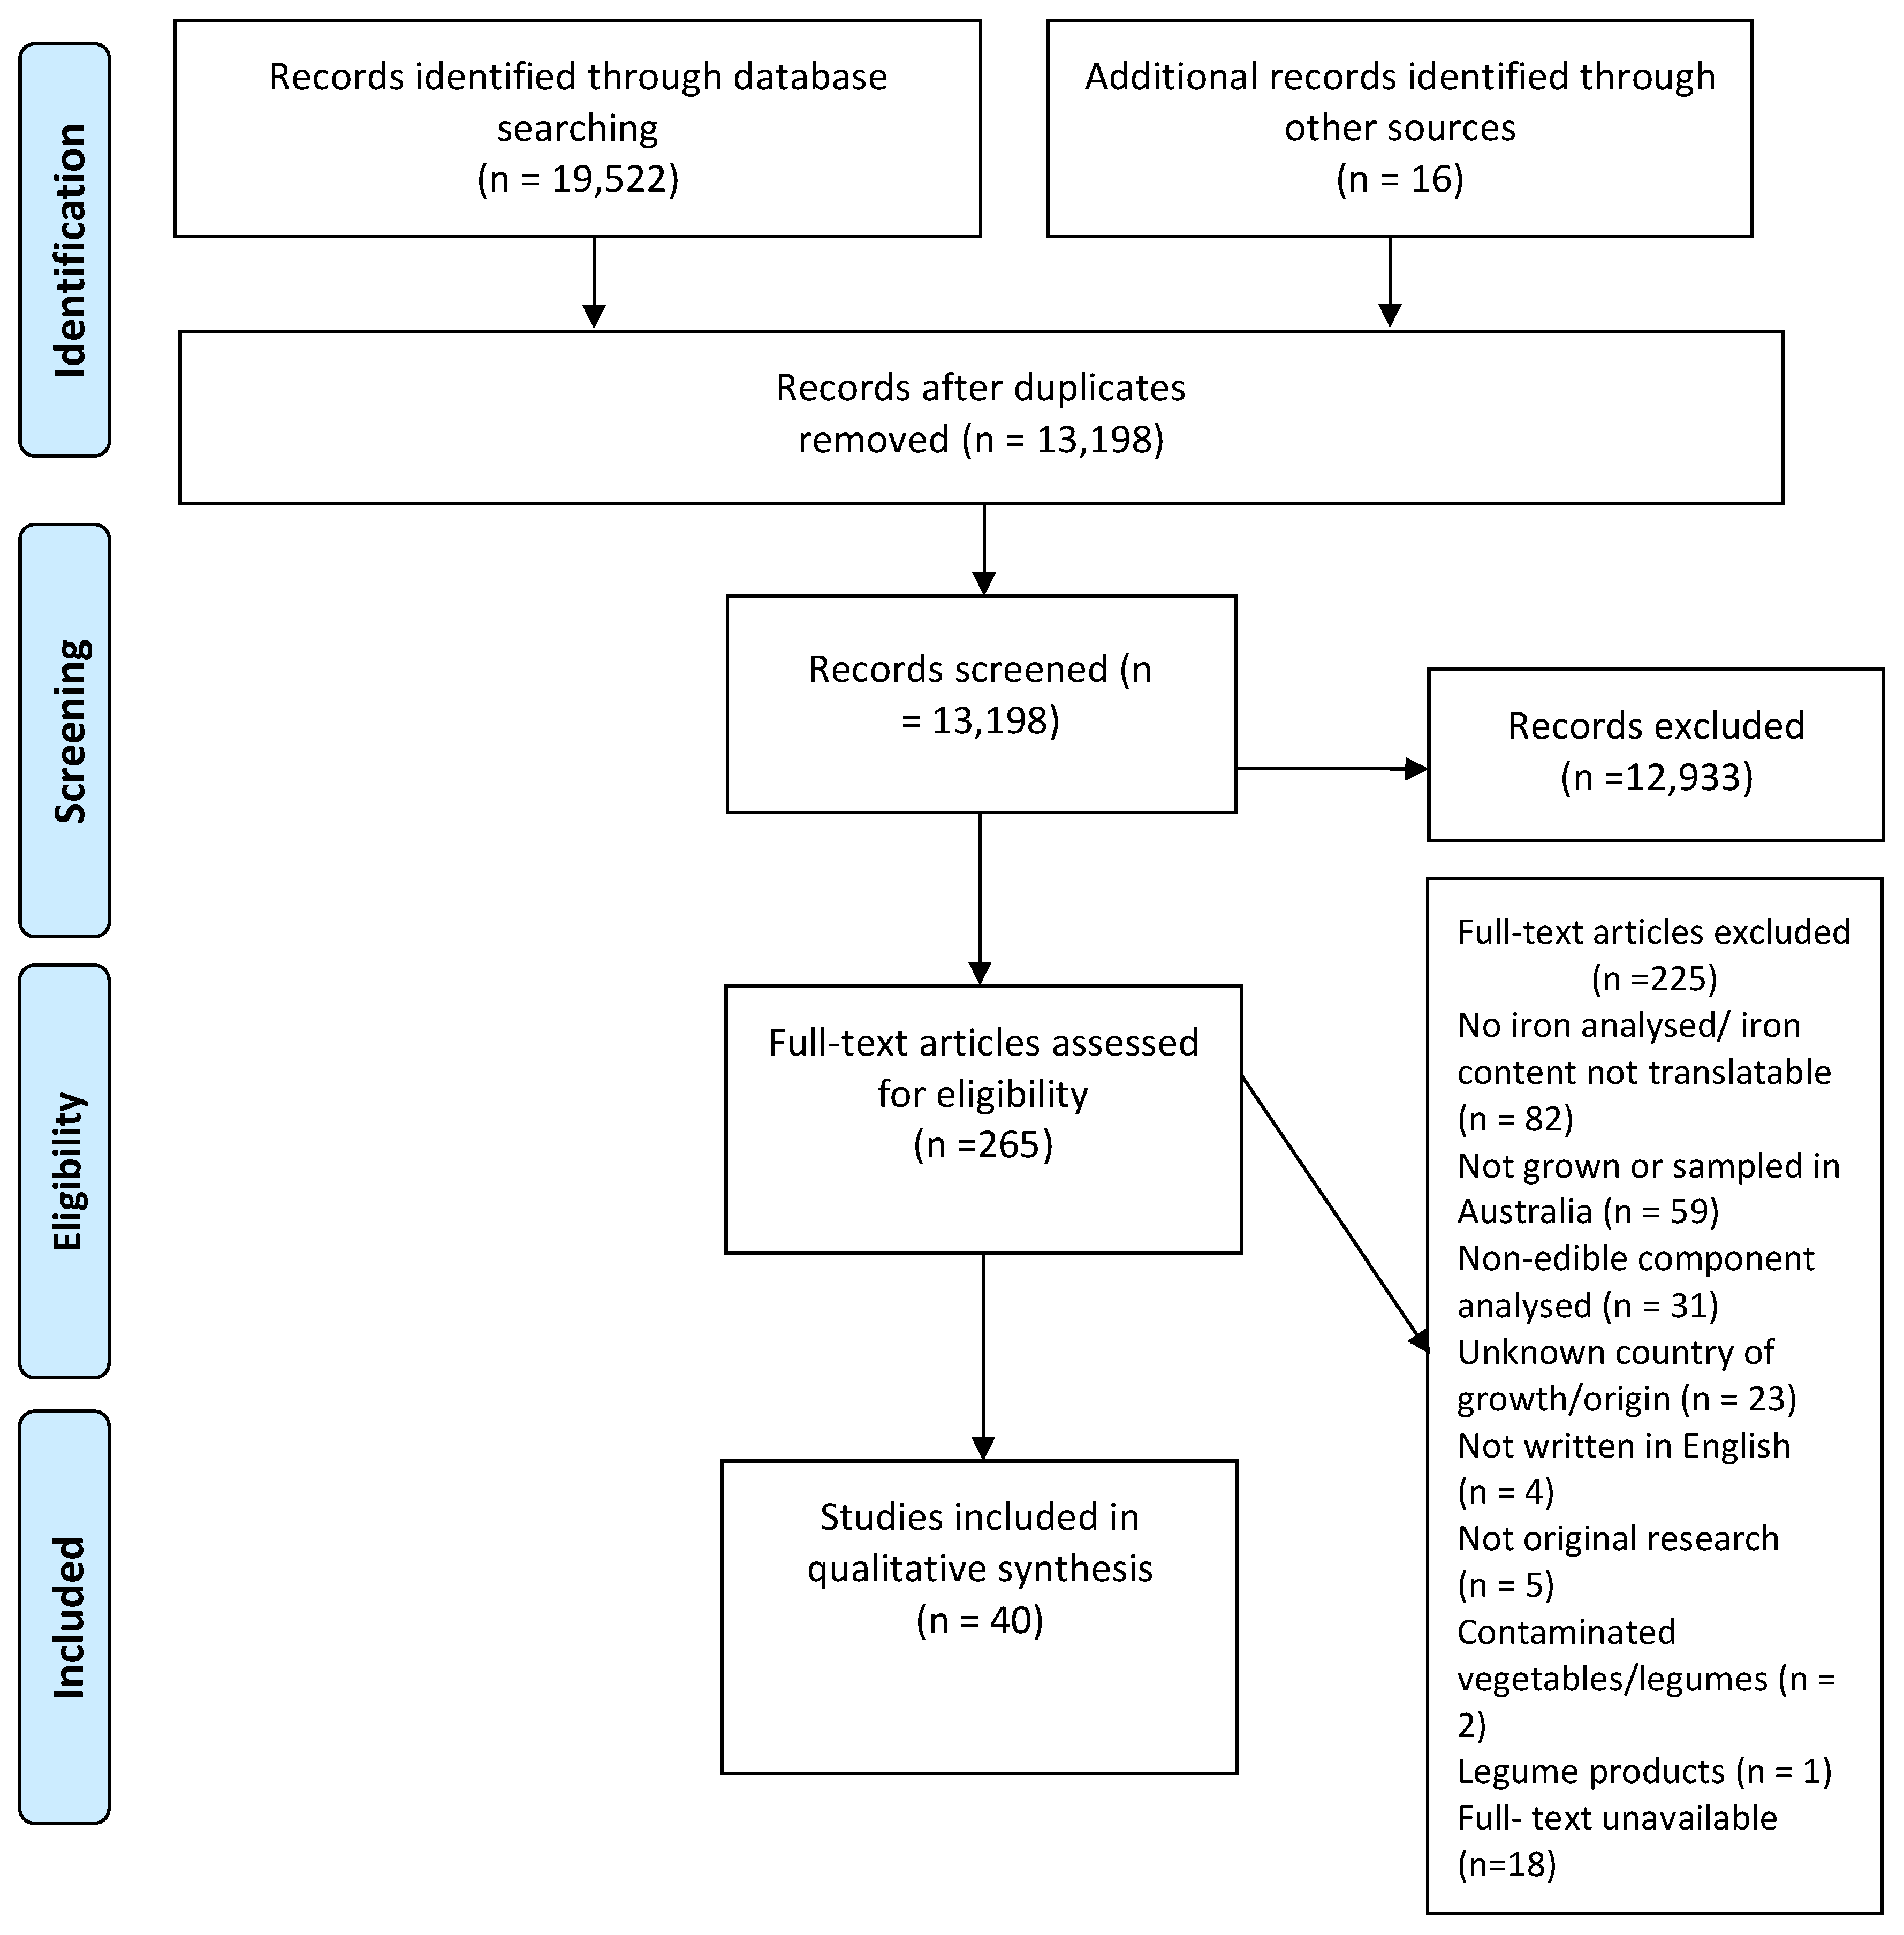
3.1. Study Selection
3.2. Study Characteristics
3.3. Changes in Iron Content Based on Scoping Review Data
3.3.1. Potatoes
3.3.2. Stem and Leafy Vegetables
3.3.3. Fruiting Vegetables
3.3.4. Brassica Vegetables
3.3.5. Beans and Peas (Green Beans and Peas)
3.3.6. Lentils (Dried)
3.3.7. Chickpeas (Dried)
3.3.8. Other Legumes (Dried) (Peas, Fava bean, Mung Bean, Lupin)
3.4. Changes in Iron content in Australian Food Composition Databases 1989–2019
4. Discussion
5. Conclusions
Supplementary Materials
Author Contributions
Funding
Institutional Review Board Statement
Informed Consent Statement
Data Availability Statement
Acknowledgments
Conflicts of Interest
References
- Craig, W.J.; Mangels, A.R. Position of the American Dietetic Association: Vegetarian diets. J. Am. Diet. Assoc. 2009, 109, 1266–31282. [Google Scholar] [CrossRef]
- Davey, G.K.; Spencer, E.A.; Appleby, P.N.; Allen, N.E.; Knox, K.H.; Key, T.J. EPIC-Oxford: Lifestyle characteristics and 396 nutrient intakes in a cohort of 33,883 meat-eaters and 31,546 non meat-eaters in the UK. Public Health Nutr. 2003, 6, 259–269. [Google Scholar] [CrossRef] [PubMed]
- Bowman, S.A. A Vegetarian-Style Dietary pattern is associated with lower energy, saturated fat, and sodium intakes; and higher whole grains, legumes, nuts, and soy intakes by adults: National Health and Nutrition Examination Surveys 2013–2016. Nutrients 2020, 12, 2668. [Google Scholar] [CrossRef] [PubMed]
- Worsley, A.; Skrzypiec, G. Teenage vegetarianism: Prevalence, social and cognitive contexts. Appetite 1998, 30, 151–170. [Google Scholar] [CrossRef] [PubMed] [Green Version]
- Hunt, J.R.; Roughead, Z.K. Nonheme-iron absorption, fecal ferritin excretion, and blood indexes of iron status in women consuming controlled lactoovovegetarian diets for 8 weeks. J. Am. Diet. Assoc. 1999, 69, 944–952. [Google Scholar] [CrossRef]
- Hunt, J.R. Bioavailability of iron, zinc, and other trace minerals from vegetarian diets. Am. J. Clin. Nutr. 2003, 78, 633s–639s. [Google Scholar] [CrossRef]
- Ahmed, F.; Coyne, T.; Dobson, A.; McClintock, C. Iron status among Australian adults: Findings of a population based study in Queensland, Australia. Asia Pac. J. Clin. Nutr. 2008, 17, 40–47. [Google Scholar]
- Pribis, P.; Pencak, R.C.; Grajales, T. Beliefs and attitudes toward vegetarian lifestyle across generations. Nutrients 2010, 2, 523–531. [Google Scholar] [CrossRef]
- Roy Morgan Research. The Slow but Steady Rise of Vegetarianism in Australia. Available online: http://www.roymorgan.com/findings/vegetarianisms-slow-but-steady-rise-in-australia-201608151105 (accessed on 4 November 2021).
- Australian Bureau of Statistics; Food Standards Australia New Zealand. Australian Health Survey: Usual Nutrient Intakes, 2011–2012; 4364.0.55.008; Australian Bureau of Statistics: Canberra, Australia, 2015.
- National Health and Medical Research Council; New Zealand Ministry of Health. Iron. In Nutrient Reference Values for Australia and New Zealand Including Recommended Dietary Intakes; National Health and Medical Research Council: Canberra, Australia, 2006; pp. 171–175. [Google Scholar]
- Mayer, A.-M. Historical changes in the mineral content of fruits and vegetables. Br. Food J. 1997, 99, 5. [Google Scholar] [CrossRef]
- Davis, D.R.; Epp, M.D.; Riordan, H.D. Changes in USDA Food Composition Data for 43 Garden Crops, 1950 to 1999. J. Am. Coll. Nutr. 2004, 23, 669–682. [Google Scholar] [CrossRef]
- Marles, R.J. Mineral nutrient composition of vegetables, fruits and grains: The context of reports of apparent historical declines. J. Food Compos. Anal. 2017, 56, 93–103. [Google Scholar] [CrossRef]
- Cunningham, J.H.; Milligan, G.; Trevisan, L. Minerals in Australian Fruits and Vegetables—A Comparison of Levels between the 1980s and 2000; Food Standards Australia New Zealand: Canberra, Australia, 2002.
- Arksey, H.; O’Malley, L. Scoping studies: Towards a methodological framework. Int. J. Soc. Res. Methodol. 2005, 8, 19–32. [Google Scholar] [CrossRef] [Green Version]
- Aromataris, E.; Munn, Z. (Eds.) JBI Manual for Evidence Synthesis; JBI: Adelaide, Australia, 2020. [Google Scholar] [CrossRef]
- Tricco, A.C.; Lillie, E.; Zarin, W.; O’Brien, K.K.; Colquhoun, H.; Levac, D.; Moher, D.; Peters, M.D.J.; Horsley, T.; Weeks, L.; et al. PRISMA Extension for Scoping Reviews (PRISMA-ScR): Checklist and Explanation. Ann. Int. Med. 2018, 169, 467–473. [Google Scholar] [CrossRef] [PubMed] [Green Version]
- Lee, D.H.K.; Robinson, K.; Newman, A.; Rheuben, R.P. Report of an Investigation of the Mineral Content of some Queensland Foods in Fifth Report of the Advisory Council on Nutrition; Commonwealth of Australia: Canberra, Australia, 1938; pp. 48–55. [Google Scholar]
- Hocking, P.J.; Pate, J.S. Mobilization of Minerals to Developing Seeds of Legumes. Ann. Bot. 1977, 41, 1259–1278. [Google Scholar] [CrossRef]
- Hocking, P.; Pate, J. Accumulation and distribution of mineral elements in the annual lupins Lupinus albus L. and Lupinus angustifolius L. Aust. J. Agric. Res. 1978, 29, 14. [Google Scholar] [CrossRef]
- Pate, J.S.; Hocking, P.J. Phloem and xylem transport in the supply of minerals to a developing legume (Lupinus albus L.) fruit. Ann. Bot. 1978, 42, 911–921. [Google Scholar] [CrossRef]
- Hocking, P.J. Redistribution of nutrient elements from cotyledons of two species of annual legumes during germination and seedling growth. Ann. Bot. 1980, 45, 383–396. [Google Scholar] [CrossRef]
- Sale, P.W.G.; Campbell, L.C. Patterns of mineral nutrient accumulation in soybean seed. J. Field Crops Res. 1980, 3, 157–163. [Google Scholar] [CrossRef]
- Wills, R.B.H.; Evans, T.J.; Lim, J.S.K.; Scriven, F.M.; Greenfield, H. Composition of Australian foods. 25. Peas and beans. Food Technol. Aust. 1984, 36, 512–514. [Google Scholar]
- Wills, R.B.H.; Lim, J.S.K.; Greenfield, H. Variation in nutrient composition of Australian retail potatoes over a 12-month period. J. Sci. Food Agric. 1984, 35, 1012–1017. [Google Scholar] [CrossRef]
- Wills, R.B.H.; Lim, J.S.K.; Greenfield, H. Composition of Australian foods. 23. Brassica vegetables. Food Technol. Austr. 1984, 36, 176–177. [Google Scholar]
- Wills, R.B.H.; Wong, A.; Scriven, F.M.; Greenfield, H. Nutrient composition of Chinese vegetables. J. Agric. Food Chem. 1984, 32, 413–416. [Google Scholar] [CrossRef]
- Wills, R.B.H.; Lim, J.S.K.; Greenfield, H. Composition of Australian foods. 31. Tropical and sub-tropical fruit. Food Technol. Austr. 1986, 38, 118–123. [Google Scholar]
- Wills, R.B.H.; Lim, J.S.K.; Greenfield, H. Composition of Australian foods. 32. Leafy, stem and other vegetables. Food Technol. Austr. 1986, 38, 416–417, 421. [Google Scholar]
- Wills, R.B.H.; Lim, J.S.K.; Greenfield, H. Composition of Australian foods. 39. Vegetable fruits. Food Technol. Austr. 1987, 39, 488–490. [Google Scholar]
- Hung, T.V.; Handson, P.D.; Amenta, V.C.; Kyle, W.S.A.; Yu, R.S.T. Mineral composition and distribution in lupin seeds and in flour, spray dried powder and protein isolate produced from the seeds. J. Sci. Food Agric. 1988, 45, 145–154. [Google Scholar] [CrossRef]
- Bolland, M.D.A.; Jarvis, R.J.; Coates, P.; Harris, D.J. Effect of phosphate fertilisers on the elemental composition of seed of wheat, lupin, and triticale. Comm. Soil. Sci. Plant Anal. 1993, 24, 1991–2014. [Google Scholar] [CrossRef]
- Petterson, D.S.; Sipsas, S.; Mackintosh, J.B. The Chemical Composition and Nutritive Value of Australian Pulses; Grains Research and Development Corporation: Kingston, Australia, 1997. [Google Scholar]
- Bolland, M.; Siddique, K.; Brennan, R. Grain yield responses of faba bean (Vicia faba L.) to applications of fertiliser phosphorus and zinc. Austr. J. Exp. Agric. 2000, 40, 849–857. [Google Scholar] [CrossRef]
- Cotching, W.; Coad, J. Metal element uptake in vegetables and wheat after biosolids application. J. Solid Waste Technol. Manag. 2011, 37, 75–82. [Google Scholar] [CrossRef]
- Koyyalamudi, S.R.; Jeong, S.-C.; Manavalan, S.; Vysetti, B.; Pang, G. Micronutrient mineral content of the fruiting bodies of Australian cultivated Agaricus bisporus white button mushrooms. J. Food Compos. Anal. 2013, 31, 109–114. [Google Scholar] [CrossRef]
- Wood, J.A.; Knights, E.J.; Campbell, G.M.; Choct, M. Differences between easy- and difficult-to-mill chickpea (Cicer arietinum L.) genotypes. Part II: Protein, lipid and mineral composition. J. Sci. Food Agric. 2014, 94, 1446–1453. [Google Scholar] [CrossRef]
- Broom, M.; Salman, H.; Aley, G. A Comprehensive Nutrient Content Database of Grains and Legumes Produced in Australia: Pilot Study Results; Grains and Legumes Nutrition Council and Grain Growers Limited: Canberra, Australia, 2014. [Google Scholar]
- Food Standards Australia New Zealand. Australian Sweet Lupin; Food Standards Australia New Zealand: Canberra, Australia, 2015.
- Food Standards Australia New Zealand. 2014–2015 Key Foods Program; Food Standards Australia New Zealand: Canberra, Australia, 2015.
- Food Standards Australia New Zealand. 2017 Key Foods Analytical Program; Food Standards Australia New Zealand: Canberra, Australia, 2017.
- Karnpanit, W.; Coorey, R.; Clements, J.; Benjapong, W.; Jayasena, V. Calcium, Iron and Zinc Bioaccessibilities of Australian Sweet Lupin (Lupinus angustifolius L.) Cultivars. J. Agric. Food Chem. 2017, 65, 4722–4727. [Google Scholar] [CrossRef]
- Food Standards Australia New Zealand. 2018 Food Composition Analytical Program; Food Standards Australia New Zealand: Canberra, Australia, 2018.
- Tan, G.Z.H.; Das Bhowmik, S.S.; Hoang, T.M.L.; Karbaschi, M.R.; Long, H.; Cheng, A.; Bonneau, J.P.; Beasley, J.T.; Johnson, A.A.T.; Williams, B.; et al. Investigation of baseline iron levels in Australian chickpea and evaluation of a transgenic biofortification approach. Front. Plant Sci. 2018, 9, 788. [Google Scholar] [CrossRef] [PubMed]
- Zhang, Y.Y.; Panozzo, J.; Hall, M.S.; Ajlouni, S. Bioaccessibility of some essential minerals in three selected Australian pulse varieties using an in vitro gastrointestinal digestion model. J. Food Sci. 2018, 83, 2873–2881. [Google Scholar] [CrossRef] [PubMed]
- Parvin, S.; Uddin, S.; Tausz-Posch, S.; Armstrong, R.; Fitzgerald, G.; Tausz, M. Grain mineral quality of dryland legumes as affected by elevated CO2 and drought: A FACE study on lentil (Lens culinaris) and faba bean (Vicia faba). Crop Pasture Sci. 2019, 70, 244–253. [Google Scholar] [CrossRef]
- Johnson, J.; Collins, T.; Power, A.; Chandra, S.; Skylas, D.; Portman, D.; Panozzo, J.; Blancard, C.; Naiker, M. Antioxidative properties and macrochemical composition of five commercial mungbean varieties in Australia. Legume Sci. 2020, 2, e27. [Google Scholar] [CrossRef]
- Perkins, M.; Usanase, D.; Zhang, B.; Joyce, D.; Coates, L. Impact injury at harvest promotes body rots in ‘Hass’ avocado fruit upon ripening. Horticulturae 2020, 6, 11. [Google Scholar] [CrossRef] [Green Version]
- Kämper, W.; Ogbourne, S.M.; Hawkes, D.; Trueman, S.J. SNP markers reveal relationships between fruit paternity, fruit quality and distance from a cross-pollen source in avocado orchards. Sci. Rep. 2021, 11, 20043. [Google Scholar] [CrossRef]
- Mazumder, K.; Biswas, B.; Kerr, P.G.; Blanchard, C.; Nabila, A.; Golder, M.; Aziz, M.G.; Farahnaky, A. Comparative assessment of nutritional, thermal, rheological and functional properties of nine Australian lupin cultivars. Sci. Rep. 2021, 11, 1–14. [Google Scholar] [CrossRef]
- Bear, F.E.; Toth, S.J.; Prince, A.L.P. Variation in Mineral Composition of Vegetables; The Soil Science Society of America: Madison, WI, USA, 1949; pp. 380–384. [Google Scholar]
- Tüzen, M.; Özdemir, M.; Demirbaş, A. Study of heavy metals in some cultivated and uncultivated mushrooms of Turkish origin. Food Chem. 1998, 63, 5. [Google Scholar] [CrossRef]
- Aghili, F.; Khoshgoftarmanesh, A.H.; Afyuni, M.; Mobli, M. Mineral and ascorbic acid concentrations of greenhouse- and field-grown vegetables: Implications for human health. Int. J. Veg. Sci. 2012, 18, 64–77. [Google Scholar] [CrossRef]
- Organization for Economic Cooperation and Development. Revised consensus document on compositional considerations for new varieties of soy bean [Glycine max (L.) Merr.]: Key food and feed nutrients, anti-nutrients, toxicants and allergens. In Proceedings of the Joint Meeting of the Chemicals Committee and the Working Party on Chemicals, Pesticides and Biotechnology, Paris, France, April 2012. [Google Scholar]
- Organization for Economic Cooperation and Development. Consensus document on compositional considerations for new varieties of common bean (Phaseolus vulgaris L.): Key food and feed nutrients, anti-nutrients and other constituents. In Proceedings of the Joint Meeting of the Chemicals Committee and the Working Party on Chemicals, Pesticides and Biotechnology, Paris, France, April 2012. [Google Scholar]
- White, P.J.; Broadley, M.R. Historical variation in the mineral composition of edible horticultural products. J. Horticult. Sci. Biotechnol. 2005, 80, 660–667. [Google Scholar] [CrossRef]
- Bruggraber, S.; Chapman, T.; Thane, C.; Olson, A.; Jugdaohsingh, R.; Powell, J. A re-analysis of the iron content of plant-based foods in the United Kingdom. Br. J. Nutr. 2012, 108, 1–8. [Google Scholar] [CrossRef] [PubMed] [Green Version]
- Australian Bureau of Statistics. Australian Health Survey: Nutrition First Results—Foods and Nutrients; ABS: Canberra, Australia, 2014.


| Reference | Food Type | Iron Content (mg/100 g) a | Sampling Details (Number, Location and Collection Date) | Analytical Method |
|---|---|---|---|---|
| Lee et al., 1938 [19] | Bean, green | 1.7 (AD 0.4) | 4–12 samples obtained in QLD (Tewantin, Kingaroy, Innisfail, Malanda, Mt. Isa, Longreach, Charleville); date collected unknown; field trial | Thiocyanate colorimetry |
| Cabbage | 0.5 (AD 0.1) | |||
| Lettuce | 1.0 (AD 0.4) | |||
| Pea, green | 2.8 (AD 0.1) | |||
| Pumpkin | 0.7 (AD 0.3) | |||
| Silverbeet | 1.9 (AD 0.8) | |||
| Hocking et al., 1977 [20] | Lupin, sweet, dried | 19.6 | Embryo component of 40–50 fruits across all three commodities; grown in Perth WA; greenhouse in sand culture; May-Nov, year unknown | AAS |
| Lupin, white, dried | 5.0 | |||
| Pea, green dried | 7.8 | |||
| Hocking et al., 1978 [21] | Lupin, sweet, dried | 9.1 | 12 samples from 36 plants across 12 plots; grown in Perth WA; greenhouse in sand culture; Jul-Nov, year unknown | AAS |
| Lupin, white, dried | 5.6 | |||
| Pate et al., 1978 [22] | Lupin, white, dried | 7.9 (95% CI 0.72) | 3 samples of 10 fruits harvested 8 weeks after antithesis (control group); grown in Perth WA; greenhouse in sand culture; Aug-Nov, year unknown | AAS |
| Hocking 1980 [23] | Lupin, sweet, dried | 6.0 | 3 samples of 100 seeds; grown in Perth WA, greenhouse in culture tanks, date collected unknown | AAS |
| Lupin, white, dried | 11.4 | |||
| Sale et al., 1980 [24] | Soya bean, dried | 1.8 | 4 replicate samples of 10 seeds of similar age, grown in Camden NSW; field grown; Dec, 1979 | AAS |
| Wills et al., 1984 [25] | Bean, green | 1.0 | Composite sample of produce purchased from 4 retail outlets in Sydney, grown in Australia b; 1982 | AAS |
| Pea, green | 1.8 | |||
| Wills et al., 1984 [26] | Potato, new | 0.6 | 2 composite samples, purchased from retail outlets in Sydney, grown in Australia b; 1982–1983 | AAS |
| Potato, Pontiac | 0.5 | |||
| Potato, Sebago | 0.6 | |||
| Wills et al., 1984 [27] | Broccoli | 1.0 | Samples of each food item or 1 kg of smaller produce were obtained from 5 different retail outlets in Sydney; grown in Australia b; 1982 | AAS |
| Brussels sprouts | 0.9 | |||
| Cabbage, red | 0.6 | |||
| Cabbage, savoy | 0.6 | |||
| Cabbage, white | 0.6 | |||
| Cauliflower | 0.6 | |||
| Kohlrabi | 0.7 | |||
| Wills et al., 1984 [28] | Bean sprouts | 0.4 | A composite of 2 samples; purchased at market garden in Sydney; grown in Australia b; 1982 | AAS |
| Bitter melon | 0.9 | |||
| Cabbage, Chinese | 0.3 | |||
| Cabbage, mustard | 0.7 | |||
| Choi sum | 1.7 | |||
| Hairy melon | 0.3 | |||
| Watercress | 3.0 | |||
| Wills et al., 1986 [29] | Avocado, Hass | 0.7 | A composite of 5 samples; purchased from retail outlets in Sydney; grown in Australia b; 1983 | AAS |
| Avocado, Fuerte | 0.6 | |||
| Wills et al., 1986 [30] | Artichoke, globe | 0.5 | Samples of each food item or 1 kg of smaller produce were obtained from 5 different retail outlets in Sydney; grown in Australia b; 1983 | AAS |
| Asparagus | 1.0 | |||
| Celery | 0.2 | |||
| Endive | 1.7 | |||
| Lettuce, common | 0.6 | |||
| Lettuce, cos | 0.7 | |||
| Lettuce, mignonette | 1.1 | |||
| Mushroom, button | 0.2 | |||
| Silverbeet | 2.3 | |||
| Spinach | 3.2 | |||
| Wills et al., 1987 [31] | Bean, broad (fava) | 1.9 | Samples of each food item or 1 kg of smaller produce were obtained from 5 different retail outlets in Sydney; grown in Australia b; 1983–1984 Samples of broad beans were fresh, not dried. | AAS |
| Bean, butter (lima) | 0.4 | |||
| Bean, purple | 1.2 | |||
| Bean red (kidney) | 2.4 | |||
| Capsicum, green | 0.7 | |||
| Capsicum, red | 0.3 | |||
| Choko | 0.3 | |||
| Cucumber, green | 0.1 | |||
| Cucumber, Lebanese | 0.3 | |||
| Cucumber, telegraph | 0.3 | |||
| Eggplant | 0.2 | |||
| Pea, snow | 0.9 | |||
| Pumpkin, Butternut | 0.4 | |||
| Pumpkin, Golden | 0.2 | |||
| Nugget | ||||
| Pumpkin, Qld Blue | 0.9 | |||
| Squash, Button | 0.3 | |||
| Squash, Scallopini | 0.8 | |||
| Sweet corn | 2.1 | |||
| Zucchini, Blackjack | 0.6 | |||
| Zucchini, Golden | 0.4 | |||
| Okra | 1.1 | |||
| Hung et al., 1988 [32] | Lupin, sweet, dried | 5.2 (R 2.6–7.6) | 22 samples of sweet lupin seeds and 11 samples of white lupin seeds collected from different locations in Victoria; field grown, date collected unknown | ICP-AES |
| Lupin, white, dried | 4.3 (R 3.0–4.6) | |||
| Bolland et al., 1993 [33] | Lupin, sweet, dried | 4.6 (SE 0.3) | 3 samples grown in South Carrabin WA; field grown, May 1987 3 samples grown in Badgingarra WA; field grown, May 1987 | ICP-AES |
| Lupin, sweet, dried | 5.3 (SE 0.9) | |||
| Petterson et al., 1997 [34] | Cowpea, dried Mung bean, green, dried Mung bean, black, dried Adzuki bean, dried Bean, fava, dried Pea, green dried Bean, navy, dried Bean, lima, dried Lupin, sweet, dried Lupin, white, dried Lentil, dried Chickpea, Kabuli, dried Chickpea, Desi, dried Pigeon pea, dried | 5.9 (R 5.2–6.4) 4.9 (R 4.8–5.2) 6.6 (R 4.3–9.2) 4.4 9.6 (R 4.0–16.9) 5.3 (R 3.5–9.0) 6.8 (R 5.6–9.3) 5.7 6.9 (R 3.1–15.0) 2.7 (R 2.1–4.4) 65.5 (R 4.3–341) 5.7 (R 3.2–12.5) 5.0 (R 3.5–12) 3.3 (R 2.9–4.0) | 1–535 samples collated from various sources, grown in Australia, date collected unknown | Various |
| Bolland et al., 2000 [35] | Bean, fava, dried | 5.4 (SE 0.06) 5.7 (SE 0.07) 6.1 (SE 0.08) | Unspecified sample size, grown in South Kukerin WA 1997, East Pingaring WA 1998, and West Pingaring WA 1998, respectively; field grown | ICP-AES |
| Cunningham et al., 2002 [15] | Avocado, Hass | 0.5 | 6–11 samples of each vegetable were purchased from different regions (VIC, SA, QLD, NSW, WA, TAS); 2000 | ICP-MS |
| Bean, green | 1.0 | |||
| Broccoli | 0.8 | |||
| Cabbage, green | 0.4 | |||
| Capsicum, green | 0.5 | |||
| Capsicum, red | 0.3 | |||
| Cauliflower | 0.4 | |||
| Celery | 0.3 | |||
| Cucumber, Greenridge | 0.3 | |||
| Lettuce, iceberg | 0.6 | |||
| Mushroom, button | 0.3 | |||
| Pea, green | 1.8 | |||
| Potato, Coliban | 0.5 | |||
| Potato, Desiree | 0.2 | |||
| Pumpkin, Butternut | 0.2 | |||
| Pumpkin, Jarrahdale | 0.3 | |||
| Sweet corn | 0.5 | |||
| Zucchini, green | 0.4 | |||
| Cotching et al., 2011 [36] | Potato, Shepody | 0.7 | 4 replicate samples, grown in Tasmania; 2007–2008; greenhouse | ICP-AES |
| Silverbeet | 3.0 | |||
| Koyyalamudi et al., 2013 [37] | Mushroom, button | 0.9 (R 0.6–1.0) | 6 samples; grown in Australia; field trial, date collected unknown, | ICP-MS |
| Wood et al., 2014 [38] | Chickpea, Desi, dried | 5.4 (R 3.7–7.0) | Sample size not specified; grown in Breeza NSW; field grown, 2001 | ICP-AES |
| Chickpea, Kabuli, dried | 3.8 | |||
| Broom et al., 2014 [39] | Chickpea, Desi, dried | 4.6 | 1 sample for each food type, grown in GRDC classified Northern and Southern regions; field grown, 2012 | ICP-AES/ICP-MS |
| Chickpea, Kabuli, dried | 4.1 | |||
| Bean, fava, dried | 3.7 | |||
| Lentil, French, dried | 5.4 | |||
| Lentil, green, dried | 5.6 | |||
| Lentil, red, dried | 9.1 | |||
| Lupin, sweet, dried | 4.0 | |||
| Mung bean, green, dried | 4.0 | |||
| Pea, green, dried | 5.9 | |||
| Pea, yellow, dried | 4.8 | |||
| FSANZ, 2015 [40] | Lupin, sweet, dried | 3.9 4.3 | 1 sample, (with and without hull, respectively); grown in WA; field grown, 2014 | ICP-AES/ICP-MS |
| FSANZ, 2015 [41] | Avocado, Hass | 0.5 | A composite of 8 samples of each vegetable; purchased from retail outlets in Australia, date purchased unknown | ICP-MS/ICP-AES |
| Bean, green | 0.7 | |||
| Cucumber, Lebanese | 0.3 | |||
| Rocket | 1.6 (R: 1.0–2.2) | |||
| Spinach, baby | 1.8 (R: 1.0–2.7) | |||
| FSANZ, 2017 [42] | Cauliflower | 0.3 | A composite of 8 samples; purchased from retail outlets in Australia, date purchased unknown | ICP-MS/ICP-AES |
| Corn | 1.2 | |||
| Karnpanit et al., 2017 [43] | Lupin, sweet, dried | 2.7 (SD 0.70) 3.2 (SD 0.93) | 10 samples of 10 different cultivars (with and without hull, respectively); grown in Wongan Hills Research Centre WA; field grown, 2011–2013 | AAS |
| FSANZ, 2018 [44] | Kale | 1.6 | A composite of 8 samples; purchased from retail outlets in Australia, date purchased unknown | ICP-MS/ICP-AES |
| Tan et al., 2018 [45] | Chickpea, Desi, dried | 4.2 (R 4.0–4.5) | 3–5 samples each of 3 different cultivars; grown in Billa Billa Qld, Roma Qld, Warra Qld and Kingaroy Qld, respectively; field grown, Jun-Aug 2014 3–5 samples each of 3 different cultivars; grown in Billa Billa Qld, Roma Qld, and Warra Qld, respectively; field grown, Jun–Aug 2014 | ICP-AES |
| 4.5 (R 4.1–4.9) | ||||
| 4.5 (R 4.2–4.7) | ||||
| 3.6 (R 3.3–4.2) | ||||
| Chickpea, Kabuli, dried | 4.4 (R 4.1–4.7) | |||
| 4.9 (R 4.4–5.2) | ||||
| 4.6 (R 4.1–5.5) | ||||
| Zhang et al., 2018 [46] | Lentil, dried Lupin, sweet, dried Pea, green, dried | 5.5 (SD 0.50) 5.4 (SD 0.55) 5.7 (SD 0.99) | 3 samples for lentil and lupin; grown in Ouyen VIC; 2016; field trial 3 samples for pea; grown in Rokewood VIC; field trial, 2016 | ICP-AES |
| Parvin et al., 2019 [47] | Bean, fava, dried | 13.0 (SE 0.44) | 4 samples for fava beans; grown in Horsham VIC in dry and wet conditions, respectively; experimental condition in growth chamber, May 2016 8 samples for lentils; grown in Horsham VIC; experimental in open top chamber; dry condition May 2015, and wet condition June 2016, respectively | ICP-AES |
| 10.5 (SE 0.18) | ||||
| Lentil, dried | 9.0 (SE 0.52) | |||
| 6.2 (SE 0.28) | ||||
| Johnson et al., 2020 [48] | Mung beans, green, dried | 5.3 (SD 0.1) 4.1 (SD 0.4) | 2 brands (Pattu and Katoomba, respectively), 3 replicates from 2 digests each; grown in Australia; purchased from 2 Australian supermarkets, date purchased unknown | ICP-MS |
| Perkins et al., 2020 [49] | Avocado, Hass | 2.0 | A composite sample; grown in Adare, Queensland; commercial orchard, 2018 | ICP-AES |
| Kämper et al., 2021 [50] | Avocado, Hass | 1.0 (SD 0.5) | 95 samples, Childers, Queensland; commercial orchard, April-May 2018 | ICP-AES |
| Mazumder et al., 2021 [51] | Lupin, sweet, dried | 2.8 (SD 3.4) | Mean of 6 cultivars, 3 replicates each, grown in Wagga Wagga, New South Wales; year collected unknown Mean of 3 cultivars, 3 replicates each, grown in Wagga Wagga, New South Wales; year collected unknown | ICP-OES |
| Lupin, white, dried | 2.5 (SD 4.2) |
| Figure A1989. | Processing | CoFA1989 | NUTTAB1991–2 | NUTTAB1995 | NUTTAB2006 | NUTTAB2010 | AFCD2019 |
|---|---|---|---|---|---|---|---|
| Potatoes | |||||||
| Potato, new | Raw | 0.6 | 0.6 | 0.6 | 0.6 | 0.6 | 0.6 |
| Potato, Coliban (pale skin) | Raw | na | na | na | 0.4 | 0.5 | 0.5 |
| Potato, Sebago (pale skin) | Raw | 0.6 | na | na | 0.6 | 0.6 | 0.6 |
| Potato, pale skin (unspec) | Raw | 0.6 | 0.6 | 0.6 | 0.6 | 0.5 a | 0.5 |
| Potato, Desiree (red skin) | Raw | na | na | na | 0.2 | 0.2 | 0.2 |
| Potato, Pontiac (red skin) | Raw | 0.5 | na | na | na | 0.5 | 0.5 |
| Potato, red skin (unspec) | Raw | 0.5 | 0.5 | 0.5 | 0.3 | 0.2 a | 0.2 |
| Stem and leafy vegetables | |||||||
| Artichoke, globe | Raw | 0.5 | 0.5 | 0.5 | 0.5 | 0.5 | 0.5 |
| Asparagus | Raw | 1.0 | 1.0 | 1.0 | 1.0 | 1.0 | 1.0 |
| Celery | Raw | 0.2 | 0.2 | 0.2 | 0.2 | 0.3 a | 0.3 |
| Endive | Raw | 1.7 | 1.7 | 1.7 | 1.7 | 1.7 | 1.7 |
| Lettuce, cos | Raw | 0.7 | 0.7 | 0.7 | 0.7 | 0.7 | 0.7 |
| Lettuce, iceberg | Raw | 0.6 | 0.6 | 0.6 | 0.6 a | 0.6 | 0.6 |
| Lettuce, mignonette | Raw | 1.1 | 1.1 | 1.1 | 1.1 | 1.1 | 1.1 |
| Silverbeet | Raw | 2.3 | 2.3 | 2.3 | 2.5 | 2.3 | 2.3 |
| Spinach, English | Raw | 3.2 | 3.2 | 3.2 | 3.5 | 3.2 | 3.2 |
| Spinach, water | Raw | 2.4 | 2.4 | 2.4 | 2.4 | 2.4 | 2.4 |
| Watercress | Raw | 3.0 | 3.0 | 3.0 | 3.0 | 3.0 | 3.0 |
| Fruiting vegetables | |||||||
| Avocado | Raw | 0.7 | 0.7 | 0.7 | 0.6 a | 0.5 | 0.5 a |
| Capsicum, green | Raw | 0.7 | 0.7 | 0.7 | 0.6 | 0.6 a | 0.5 a |
| Capsicum, red | Raw | 0.3 | 0.3 | 0.3 | 0.3 | 0.3 a | 0.3 |
| Choko | Raw | 0.3 | 0.3 | 0.3 | 0.3 | 0.3 | 0.3 |
| Cucumber, common | Raw | 0.1 | 0.1 | 0.1 | 0.2 a | 0.2 | 0.2 |
| Cucumber, Lebanese | Raw | 0.3 | 0.3 | 0.3 | 0.3 | 0.3 | 0.3 a |
| Cucumber, telegraph | Raw | 0.3 | 0.3 | 0.3 | 0.3 | 0.3 | 0.3 |
| Eggplant | Raw | 0.2 | 0.2 | 0.2 | 0.2 | 0.2 | 0.2 |
| Melon, bitter | Raw | 0.9 | 0.9 | 0.9 | 0.9 | 0.9 | 0.9 |
| Melon, hairy | Raw | 0.3 | 0.3 | 0.3 | 0.3 | 0.3 | 0.3 |
| Mushroom | Raw | 0.2 | 0.2 | 0.2 | 0.3 a | 0.3 | 0.45 a |
| Okra | Raw | 1.1 | 1.1 | 1.1 | na | 1.1 | 1.1 |
| Pumpkin, Butternut | Raw | 0.4 | 0.4 | 0.4 | 0.3 a | 0.3 | 0.3 |
| Pumpkin, Golden Nugget | Raw | 0.2 | 0.2 | 0.2 | 0.2 | 0.2 | 0.2 |
| Pumpkin, Jarrahdale | Raw | na | na | na | 0.1 | 0.1 | 0.1 |
| Pumpkin, Queensland Blue | Raw | 0.9 | 0.9 | 0.9 | 0.9 | 0.9 | 0.9 |
| Pumpkin, unspec | Raw | 0.5 | 0.5 | 0.5 | 0.2 | 0.4 | 0.4 |
| Squash, button, yellow | Raw | 0.3 | 0.3 | 0.3 | 0.3 | 0.3 | 0.3 |
| Squash, scallopini, green | Raw | 0.8 | 0.8 | 0.8 | 0.8 | 0.8 | 0.8 |
| Sweet corn | Raw | 2.1 | 2.1 | 2.1 | 1.0 a | 1.0 | 1.2 a |
| Zucchini, green | Raw | 0.6 | 0.6 | 0.6 | 0.5 a | 0.5 | 0.5 |
| Zucchini, golden | Raw | 0.4 | 0.4 | 0.4 | 0.4 | 0.4 | 0.4 |
| Brassica vegetables | |||||||
| Broccoli | Raw | 1.0 | 1.0 | 1.0 | 0.9 a | 0.8 | 0.8 |
| Brussels sprout | Raw | 0.9 | 0.9 | 0.9 | 0.9 | 0.9 | 0.9 |
| Cabbage, Chinese | Raw | 0.3 | 0.3 | 0.3 | 0.3 | 0.3 | 0.3 |
| Cabbage, Chinese flowering | Raw | 1.7 | 1.7 | 1.7 | 1.7 | 1.7 | 1.7 |
| Cabbage, mustard | Raw | 0.7 | 0.7 | 0.7 | 0.7 | 0.7 | 0.7 |
| Cabbage, red | Raw | 0.6 | 0.6 | 0.6 | 0.6 | 0.6 | 0.6 |
| Cabbage, savoy | Raw | 0.6 | 0.6 | 0.6 | 0.6 | 0.6 | 0.6 |
| Cabbage, white/common | Raw | 0.6 | 0.6 | 0.6 | 0.5 a | 0.5 | 0.5 |
| Cauliflower | Raw | 0.6 | 0.6 | 0.6 | 0.5 a | 0.5 | 0.3 a |
| Kohlrabi | Raw | 0.7 | 0.7 | 0.7 | 0.7 | 0.7 | 0.7 |
| Beans and peas (green) | |||||||
| Bean, green | Raw | 1.0 | 1.0 | 1.0 | 1.1 a | 1.1 | 0.7 a |
| Bean sprouts | Raw | 0.4 | 0.4 | 0.4 | 0.4 | 0.4 | 0.4 |
| Pea, green | Raw | 1.8 | 1.8 | 1.8 | 1.8 a | 1.8 | 1.8 |
| Pea, snow | Raw | 0.9 | 0.9 | 0.9 | 0.9 | 0.9 | 0.9 |
| Legumes | |||||||
| Bean, fava | Raw (fresh) | 1.9 | 1.9 | 1.9 | 1.9 | 1.9 | 1.9 |
| Bean, haricot | Dried | na | 6.4 | 6.4 | 6.4 | 6.4 | 6.4 |
| Bean, kidney | Dried | na | 5.6 | 5.6 | 5.6 | 5.6 | 5.6 |
| Bean, lima | Dried | na | 5.7 | 5.7 | 5.7 | 5.7 | 5.7 |
| Lentil, red, brown, green | Dried | na | 7.5 | 7.5 | 7.5 | 6.7 | 6.7 |
| Pea, split | Dried | na | 3.8 | 3.8 | 3.8 | 3.8 | 3.8 |
| Soya bean | Dried | na | 9.5 | 9.5 | 9.5 | 9.5 | na |
Publisher’s Note: MDPI stays neutral with regard to jurisdictional claims in published maps and institutional affiliations. |
© 2021 by the authors. Licensee MDPI, Basel, Switzerland. This article is an open access article distributed under the terms and conditions of the Creative Commons Attribution (CC BY) license (https://creativecommons.org/licenses/by/4.0/).
Share and Cite
Eberl, E.; Li, A.S.; Zheng, Z.Y.J.; Cunningham, J.; Rangan, A. Temporal Change in Iron Content of Vegetables and Legumes in Australia: A Scoping Review. Foods 2022, 11, 56. https://doi.org/10.3390/foods11010056
Eberl E, Li AS, Zheng ZYJ, Cunningham J, Rangan A. Temporal Change in Iron Content of Vegetables and Legumes in Australia: A Scoping Review. Foods. 2022; 11(1):56. https://doi.org/10.3390/foods11010056
Chicago/Turabian StyleEberl, Erica, Alice Shimin Li, Zi Yin Joanne Zheng, Judy Cunningham, and Anna Rangan. 2022. "Temporal Change in Iron Content of Vegetables and Legumes in Australia: A Scoping Review" Foods 11, no. 1: 56. https://doi.org/10.3390/foods11010056