Article

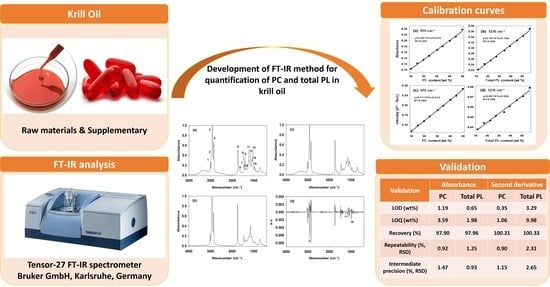
Development and Validation of a Simple Method to Quantify Contents of Phospholipids in Krill Oil by Fourier-Transform Infrared Spectroscopy

Department of Chemistry, Chung-Ang University, Seoul 06974, Korea
*
Author to whom correspondence should be addressed.
These authors contributed equally to this work.
Foods 2022, 11(1), 41; https://doi.org/10.3390/foods11010041
Submission received: 25 November 2021 / Revised: 21 December 2021 / Accepted: 21 December 2021 / Published: 24 December 2021

Abstract

:
This study focuses on developing a quantification method for phosphatidylcholine (PC) and total phospholipid (PL) in krill oil using Fourier-transform infrared (FT-IR) spectroscopy. Signals derived from the choline and phosphate groups were selected as indicator variables for determining PC and total PL content; calibration curves with a correlation coefficient of >0.988 were constructed with calibration samples prepared by mixing krill oil raw material and fish oil in different ratios. The limit of detection (LOD, 0.35–3.29%) of the method was suitable for the designed assay with good accuracy (97.90–100.33%). The relative standard deviations for repeatability (0.90–2.31%) were acceptable. Therefore, both the methods using absorbance and that using second-derivative were confirmed to be suitable for quantitative analysis. When applying this method to test samples, including supplements, the PC content and total PL content were in good agreement with an average difference of 2–3% compared to the 31P NMR method. These results confirmed that the FT-IR method can be used as a convenient and rapid alternative to the 31P NMR method for quantifying PLs in krill oil.

Graphical Abstract

1. Introduction

Omega-3 polyunsaturated fatty acids play an important role in human physiology; therefore, they are widely used as health supplements [1,2,3]. Recently, krill oil extracted from Antarctic krill (Euphausia Superba) has attracted attention as a source of long-chain omega-3 fatty acids, eicosapentaenoic acid (EPA), and docosahexaenoic acid (DHA) [4]. Unlike in other marine fish oils, most EPA and DHA of krill oil exist in the form of phospholipids (PLs) rather than in the form of triglycerides (TGAs) [5,6,7,8]. The bioavailability of omega-3 fatty acids in krill oil is expected to be higher than that in other fish oils because PLs are relatively soluble in water [6]. The PL content of krill oil, which varies depending on various factors, such as species and age, usually ranges from 30% to 80% (w/w). It is also known that 60–96% (w/w) of the total PL is in the form of phosphatidylcholine (PC) and a relatively small amount of phosphatidylethanolamine (PE) is present [3,7]. Therefore, PL content and composition are important characteristics of krill oil.
The PL content of krill oil should be at least 30% (w/w) according to the Codex Alimentarius Commission (Codex) [9]; furthermore, phosphorous-31 nuclear magnetic resonance (31P NMR) spectroscopy is used as the official content analysis method [10]. 31P NMR spectroscopy is a very useful technique for quantifying PLs because it can simultaneously perform qualitative and quantitative analyses [11,12,13]. This is because the NMR signal is quantitative in nature, as it is directly proportional to the number of corresponding resonant nuclei [14]; however, modern high-field NMR spectrometers are rarely used as routine equipment in common laboratories for detecting 31P signals because they are expensive and require expensive maintenance, such as cryogenic cooling [15]. Chromatographic methods, such as thin-layer chromatography and high-performance liquid chromatography, have been used as routine techniques in the analysis of the PL composition of foods because they can also perform qualitative and quantitative analyses and are not as expensive to operate in a laboratory [16,17]. However, they have limitations in that it takes huge time and effort to develop an analytical method and requires a large amount of solvent and individual standards for all analytes.
Recently, Fourier-transform infrared (FT-IR) spectroscopy has been widely used as a rapid food analysis method due to its simple preparation and fast measurement [18]. Particularly, FT-IR spectroscopy is a simple yet effective technique in the field related to the authenticity and quality control of edible fats and oils [19,20,21,22,23,24,25]. For example, a method is officially used to determine the trans-fat content in edible oils and fats by FT-IR signals of trans-alkene double bonds [26]. Additionally, second-derivative FT-IR spectroscopy was used to discriminate the authenticity of perilla oil [27]. Very recently, a study was conducted to analyze the composition of EPA, DHA, and astaxanthin in krill oil by combining FT-IR and Raman spectroscopy [1].
Several studies have also reported on the quantification of PLs in foods using FT-IR spectroscopy [28,29,30]. Proctor et al. showed that the FT-IR method is applicable to PL quantitative analysis by comparing it with the phosphorus content analysis method to quantify the PL of soy lecithin [28,29,30]. However, they generated a calibration curve by diluting a PL standard in chloroform solvent, which was used for quantitative analysis of the diluted PL samples in the same way. Therefore, its application to real samples such as krill oil having complex matrix structures is limited.
The goal of the present study was to develop and validate a simple and rapid quantification method to determine the total PL content and PC content in krill oil samples using FT-IR spectroscopy as an alternative to the 31P NMR method. The second-derivative FT-IR spectrum was also used to enhance the apparent resolution of overlapping absorbance peaks and improve their quantification. Furthermore, the results were compared with those of the absorption spectrum. Calibration curves for quantitative analysis were prepared using samples in which krill oil raw materials and fish oil were mixed. The proposed FT-IR method was validated in terms of specificity, linearity, accuracy, precision, the limit of detection (LOD), and the limit of quantification (LOQ). Additionally, the developed method was applied to analyze various krill oil test samples; the results were compared with those of 31P NMR analysis to verify the applicability and appropriateness of the proposed method.

2. Materials and Methods

2.1. Materials

The United States Pharmacopeia (USP) reference standard of krill oil and European Pharmacopoeia reference standard PLs (PC and PE) were purchased from MERCK Korea (Seoul, Korea). The krill oil raw material used in producing supplements was acquired from Pulses (Gyeonggi-do, Korea). Additionally, seven krill oil supplements (soft capsules) were purchased from different retailers in Korea. Fish oil (from Menhaden, a crude source of omega-3 fatty acids) used to dilute krill oil samples was purchased from MERCK Korea. qNMR standard grade triphenyl phosphate (TPP) for a 31P NMR internal standard (ISD) was purchased from MERCK Korea. Most of the reagents were also purchased from MERCK: chloroform (HPLC grade), cesium carbonate (CsCO3, 99.9% trace metals basis), and ethylenedinitrilotetraacetic acid (EDTA, 99.995% trace metals basis). Chloroform-d (CDCl3, 99.8 atom% D, contains 0.03% (v/v) TMS) and methanol-d4 (≥99.8 atom% D) for 31P NMR measurement were purchased from BK Instruments (Daejeon, Korea).

2.2. Sample Preparation

Nine calibration standard samples were prepared in a range of 20 to 100 wt% of the krill oil raw material mixed with fish oil (PL free) in different ratios (20/80, 30/70, 40/60, 50/50, 60/40, 70/30, 80/20, 90/10, and 100/0 w/w) to generate the calibration curves to quantify PC and total PL content. The krill oil raw material was analyzed by the 31P NMR method specified in Codex to determine the PC and total PL content of each calibration sample [10]. As a result, they were found to be 49.86 and 56.55 wt%, respectively (Figure S1).
A total of 12 test samples were prepared, including five mixtures of the krill oil raw material and fish oil in arbitrary ratios and seven different krill oil supplement capsules, to verify the applicability of the developed FT-IR method. The supplement samples were diluted with fish oil in a 1:1 ratio and then used for analysis to ensure uniform measurement conditions.

2.3. FT-IR Spectroscopy

All spectra were measured by an FT-IR spectrometer (TENSOR-27; Bruker Optics GmbH, Karlsruhe, Germany) equipped with a diamond ATR system (A225/Q Platinum ATR; Bruker Optics GmbH). The spectra were obtained in absorbance units, in the wavelength range of 4000–400 cm−1, with 16 scans and a resolution of 4 cm−1. Measurements were repeated three times for each sample and averaged with OMNIC software (version 8.2, ThermoFisher Scientific Inc., Waltham, MA, USA) to ensure the reproducibility and representativeness of the obtained FT-IR spectra. Spectral data are often derivatized by the Savitzky-Golay (SG) numerical algorithm as a pre-processing step to resolve overlapping signals, enhance the significant spectral difference, and subdue unnecessary spectral characteristics caused by unusual equipment and sample properties. A second-derivative spectrum was calculated for each measured pixel using the SG numerical algorithm at the third-degree polynomial at seven points [31,32]. The derivative values were used for quantitative measurement and data processing using the peak height of the second-order spectra of the major spectral band.

2.4. Validation of Analytical Method

Validation of the proposed FT-IR method was performed according to the ICH guidelines. The specificity of the assay was confirmed by comparing the spectrum of a mixture of krill oil raw material and fish oil with those produced after adding PC and PE standards to that mixture. The linearity of the calibration curves prepared at nine different concentrations was evaluated by linear regression analysis. The accuracy was assessed with a spike and recovery method, which confirmed the recovery by spiking krill oil whose total PL content and PC content had been confirmed by the 31P NMR method, into a mixture of USP krill oil reference material with fish oil. Three repeated measurements were performed for three concentrations within the calibration curves for total PL and PC. The precision was assessed for repeatability and intermediate precision using the krill oil raw material. The repeatability was evaluated by six replicated measurements in same day, and the intermediate precision was determined by the variability of independent results obtained on three different days. The LOD and LOQ values for PC and total PL quantification were estimated using the equation based on the standard deviation of the response (σ) and the slope of the calibration curve (S): LOD = 3.3 × σ/S and LOQ = 10 × σ/S.

2.5. 31P NMR Spectroscopy

The quantitative analysis of PLs in krill oil samples by 31P NMR spectroscopy was conducted by referring to the USP monograph for krill oil [33] and previous studies [34]. Furthermore, 300–350 mg of krill oil and 20–25 mg of TPP (as an ISD) were precisely weighed and placed into a vial for measurements of 31P NMR; after that, 1 mL each of CDCl3, methanol-d4, and EDTA solution was added. The EDTA solution was prepared by dropping 1 M CsCO3 solution into 0.2 M EDTA and adjusting the PH to 7.2–7.5. The sample solution of krill oil was thoroughly mixed for 30 min and centrifuged to obtain the lower organic solvent layer in a 5-mm o.d. NMR tube. NMR measurements were performed using a 600-MHz NMR (242.9 MHz for 31P) spectrometer (VNS-600, Varian, Palo Alto, CA, USA). 31P NMR spectra were acquired by 1H decoupling with an inverse-gated pulse sequence for accurate quantitation. The NMR experimental conditions were as follows: 25 °C temperature, 45° pulse angle, 5.2 s acquisition time, and 128 scan averages with a 10 s relaxation delay. The chemical shifts of PL peaks were allocated relative to the TPP signal (−17.8 ppm). The qNMR equation (Equation (1)) was used for PC and total PL quantification from the 31P NMR spectrum [35].
C P L ( w t % ) = I P L I I S D × M W P L M W I S D × w I S D w s a m p l e × P I S D × 100 ,
where I, MW, and w correspond to the integral value, molecular weight (g mol−1), and weight (g), respectively. PISD and CPL denote the purity of ISD and content of the PL in terms of weight percentage (wt %), respectively.

3. Results and Discussion

3.1. FT-IR Spectrum of Krill Oil

The representative FT-IR spectra of krill oil and fish oil samples are shown in Figure 1 within the range of 4000–400 cm−1 [3,5]. Table 1 summarizes the assignment of significant FT-IR signals based on the previously reported literature [1,36,37].
In the FT-IR spectrum of the standard krill oil sample, characteristic signals derived from PL were identified along with typical fatty acid signals: symmetric/asymmetric phosphate diester stretch in PO2 (1090 cm−1 and 1236 cm−1), symmetric/asymmetric ester stretch in –C–O–P (1060 cm−1 and 1167 cm−1), and asymmetric stretch in –N–(CH3)3 (970 cm−1) [36]. In the FT-IR spectrum of the fish oil sample (Figure 1b), although not derived from PL, vibration signals by various functional groups in other fatty acids also appeared in the region of 1100–1200 cm−1. Note that the fish oil used to control the concentration of krill oil samples did not contain PL, which was verified by 31P NMR spectroscopy (see Figure S2). The intensities of the absorption signals were normalized with that of the asymmetric stretching CH3 signal (I3, 2924 cm−1) [3,38,39]. The signal was suitable as a reference because it not only was the largest signal for both krill oil and fish oil samples, but also appeared almost constant regardless of the PL content.

3.2. Development of FT-IR Quantification Method

3.2.1. Calibration Curves

Among the signals derived from PL functional groups, the signals that were well separated and less disturbed by fish oil signals were carefully selected to determine the total PL content and PC content in krill oil samples: I11 and I15 for total PL and PC quantification, respectively. As indicated in Table 1, I11 is a signal related to the PO2 group in the PL head, and I15 is a unique signal of the choline group in PC. Figure 2 shows that these two signals, which are relatively well separated from other signals, increase proportionally with increasing krill oil raw material ratio.
As shown in Figure 3, calibration curves for the PC and total PL content analyses in krill oil samples were constructed using two methods: using the absorbance of the indicator signals (I15 and I11) and using the second-derivative of these signals. The ranges of PC and total PL content in nine calibration samples corresponded to 10.16–49.86 wt% and 11.52–56.55 wt%, respectively.
The correlation coefficient (R2) of the calibration curves for the quantification of PC content (Figure 3a,c) showed a value greater than 0.99 in both the method—using absorbance and that using the second-derivative. This is because the -N-(CH3)3 asymmetric stretching signal (970 cm−1) used in the calibration curve is unique, derived from the choline group in PC, and very well separated from other signals; however, the correlation coefficient of the calibration curve for the total PL content in the absorbance method was 0.996 (Figure 3b), while it was 0.988—a relatively low value—in the method using the second-derivative (Figure 3d). This is considered because the characteristic signal for PL (PO2 asymmetric stretching, 1236 cm−1) is broad; therefore, it becomes a small second-derivative peak (see Figure 3d) that can cause a relatively large error compared to the absorbance. It was confirmed that the error becomes larger when the calibration curve is constructed with PL characteristic signals (I12, I13, and I14) having a large degree of overlap with other signals; however, it was confirmed that both the absorbance and second-derivative methods are suitable for determining PC and total PL content in krill oil, considering the general experimental error level of FT-IR spectroscopy.
Please note that the indicator signals contained a significant amount of background, as can be seen in Figure 2 and Figure 3. Therefore, it is recommended to dilute the sample with fish oil used to prepare the calibration curve at a certain ratio to create a similar matrix environment when the calibration curve for analysis of other types of test samples is used. This can reduce the difference in the background signal. Additionally, the impact of the background was significantly reduced using the second-derivative method, as shown in Figure 3.

3.2.2. Method Validation

The FT-IR method developed in this study was validated in terms of specificity, linearity, LOD, LOQ, accuracy, and precision based on the ICH guidelines. The detailed procedures for method validation were appropriately adjusted for FT-IR. First, the specificity was verified by confirming that the FT-IR spectrum pattern of USP krill oil reference material and those of raw materials and/or supplements were the same [28,36,40,41]. The specificity of the assay was demonstrated by comparing the spectrum of a 1:1 mixture of krill oil raw material and fish oil with those produced after adding PC and PE standards to that mixture. It was verified that when the PC standard was added, the PC indicator signal (I15) increased along with the total PL indicator signal (I11); whereas, when the PE standard was added, the total PL indicator signal (I11) increased, but the PC indicator signal remained unchanged (Figure S3).
The linearity of the proposed FT-IR method was confirmed through the correlation coefficient of calibration curves (R2 > 0.988) within the measurement ranges (Figure 3). This level of acceptability is similar to that of other quantitative analysis studies using FT-IR spectroscopy [42].
Table 2 lists the LOD and LOQ of the developed method for quantifying PC and total PL. The LOD and LOQ for the total PL assay by the second-derivative method were higher than the others due to the broadness of the indicator signal. However, considering the Codex standards that stipulate a total PL content of 30 wt% or more [9], the sensitivity of the proposed FT-IR method is suitable for determining the PC and total PL content of krill oil.
The recovery tests were performed in triplicate for three different content levels of PC and total PL to verify the accuracy of the proposed method. The 1:1 mixture sample (200 mg) was spiked with 100, 200, and 400 mg of the krill oil raw material. The average recovery results of PC and total PL using absorbance were 97.90% (96.34–99.70%) and 97.96% (95.45–101.07%), respectively. Relatively accurate results of 100.21% (98.58–101.94%) and 100.33% (96.42–104.18%) were obtained, respectively, when the second-derivative was used (see Table 2 and Tables S1 and S2 for details).
The precision of the developed FT-IR method was evaluated in terms of repeatability (intra-day) and intermediate precision (inter-day) expressed as the relative standard deviation (RSD). The RSDs of the repeatability and intermediate precision were 0.90–2.65% for PC and total PL assays (Table 2). Additionally, it was confirmed that the absolute SDs were at an appropriate level of 0.46–1.58 wt% (Tables S3 and S4). Therefore, the precision of the method was confirmed.

3.3. Application of Proposed FT-IR Method

The developed FT-IR method was applied to analyze 12 krill oil test samples: 5 mixture samples of krill oil raw material and fish oil with arbitrary ratios and 7 commercial supplement samples. The PC content and total PL content in the test samples analyzed through absorbance and second-derivative are summarized in Table 3 (Figure S4). Moreover, the analysis results by 31P NMR, an official method, are also presented for comparison.
The analysis of the mixture test samples showed very consistent results, with only a 0.20–1.38 wt% difference in the PC or total PL content compared to the 31P NMR results. This is because the krill oil raw material used to develop the FT-IR analysis method was also used in the newly prepared mixture test samples; however, it showed the consistency of the developed method.
The FT-IR analysis results of the supplement capsule samples in which different krill oil raw materials were used for production showed a difference of 0.21–6.21 wt% compared to the 31P NMR results, indicating a variation depending on the sample. Compared to the mixture test sample, the relatively large error in some supplement samples was likely due to the different profiles of PLs or other lipids or both in krill oil depending on the raw material, which affected the FT-IR spectrum. Characteristically, the average differences in content obtained by the second-derivative method in the supplement capsule samples were 0.81 wt% for PC and 1.83 wt% for total PL, which were smaller than the differences obtained when the absorbance method was used (3.09 and 2.25 wt% for PC and total PL, respectively). These results show that the second-derivative effectively reduces the influence of background signals according to the difference in raw materials.
As shown in Table 3, the total PL content in the krill oil supplements used in this study was analyzed at a level of 35–56 wt%, meeting the minimum 30 wt% specified in Codex. Additionally, the relative content of PC among total PL was at the level of 87–92% [34], which also meets the standard of 60–96% [33]. The application to the test samples confirmed that both FT-IR methods, that utilizing absorbance and that utilizing the second-derivative, can be easily applied to the analysis of krill oil samples having a PL content of approximately 20–56 wt%.

4. Conclusions

An FT-IR method using absorbance and the second-derivative was developed and validated for quantifying PC and total PL in krill oil samples. The signals of asymmetric stretch in –N–(CH3)3 (970 cm−1) and asymmetric phosphate diester stretch in PO2 (1236 cm−1) were selected as indicator variables to determine PC and total PL content, respectively, and used to construct calibration curves. The developed FT-IR method was validated in terms of specificity, linearity, LOD, LOQ, accuracy, and precision according to the ICH guidelines. Furthermore, both the absorbance and second-derivative methods were confirmed to be suitable for PC and PL quantification. The developed FT-IR method was applied to the analysis of 12 test samples, and the results were found to agree with those obtained by the 31P NMR method within an average difference of 3 wt%. By validating the developed analytical method and confirming its applicability to general samples, it was confirmed that the FT-IR method can be used as a convenient and inexpensive alternative to 31P NMR techniques in analyzing the PL content of krill oil.

Supplementary Materials

The following are available online at https://www.mdpi.com/article/10.3390/foods11010041/s1, Figure S1: 31P NMR spectrum of USP standard of krill oil, Figure S2: 31P NMR spectrum of fish oil (PL free), Figure S3: Comparison of FT-IR spectra of a 1:1 mixture of krill oil raw material and fish oil with those produced after adding (a) PE and (b) PC standards to that mixture, Figure S4: Comparison of PC and total PL contents in krill oil test samples obtained from the FT-IR and 31P NMR methods, Table S1: Accuracy of the FT-IR method for PC with absorbance and second derivative, Table S2: Accuracy of the FT-IR method for total PL with absorbance and second derivative, Table S3: Repeatability of the FT-IR method for PC and total PL with absorbance and second derivative, Table S4: Intermediate precision of the FT-IR method for PC and total PL with absorbance and second derivative.

Author Contributions

Conceptualization, S.-E.P. and S.A.; methodology, H.-Y.Y. and S.A.; validation, S.-E.P., H.-Y.Y. and S.A.; formal analysis, S.-E.P. and H.-Y.Y.; investigation, S.-E.P., H.-Y.Y. and S.A.; resources, S.A.; data curation, S.-E.P. and H.-Y.Y.; writing—original draft preparation, S.-E.P. and H.-Y.Y.; writing—review and editing, S.A.; visualization, S.-E.P. and H.-Y.Y.; supervision, S.A.; project administration, S.A.; funding acquisition, S.A. All authors have read and agreed to the published version of the manuscript.

Funding

This research was supported by the Chung-Ang University Graduate Research Scholarship in 2020 and by a grant (20162MFDS038) from the Ministry of Food and Drug Safety, Korea, in 2020.

Institutional Review Board Statement

Not applicable.

Informed Consent Statement

Not applicable.

Data Availability Statement

Not available.

Conflicts of Interest

The authors declare no conflict of interest.

References

  1. Ahmmed, F.; Fuller, I.D.; Killeen, D.P.; Fraser-Miller, S.J.; Gordon, K.C. Raman and Infrared Spectroscopic Data Fusion Strategies for Rapid, Multicomponent Quantitation of Krill Oil Compositions. J. Food Sci. Technol. 2021, 1, 570–578. [Google Scholar] [CrossRef]
  2. Sahena, F.; Zaidul, I.; Jinap, S.; Saari, N.; Jahurul, H.; Abbas, K.; Norulaini, N. PUFAs in fish: Extraction, fractionation, importance in health. Compr. Rev. Food Sci. Food Saf. 2009, 8, 59–74. [Google Scholar] [CrossRef]
  3. Xie, D.; Gong, M.; Wei, W.; Jin, J.; Wang, X.; Wang, X.; Jin, Q. Antarctic Krill (Euphausia superba) Oil: A Comprehensive Review of Chemical Composition, Extraction Technologies, Health Benefits, and Current Applications. Compr. Rev. Food Sci. Food Saf. 2019, 18, 514–534. [Google Scholar] [CrossRef] [PubMed] [Green Version]
  4. Xie, D.; He, F.; Wang, X.; Wang, X.; Jin, Q.; Jin, J. Diverse Krill Lipid Fractions Differentially Reduce LPS-Induced Inflammatory Markers in RAW264.7 Macrophages In Vitro. Foods 2021, 10, 2887. [Google Scholar] [CrossRef]
  5. Araujo, P.; Zhu, H.; Breivik, J.F.; Hjelle, J.I.; Zeng, Y. Determination and structural elucidation of triacylglycerols in krill oil by chromatographic techniques. Lipids 2014, 49, 163–172. [Google Scholar] [CrossRef] [PubMed]
  6. Kohler, A.; Sarkkinen, E.; Tapola, N.; Niskanen, T.; Bruheim, I. Bioavailability of fatty acids from krill oil, krill meal and fish oil in healthy subjects--a randomized, single-dose, cross-over trial. Lipids Health Dis. 2015, 14, 19–28. [Google Scholar] [CrossRef] [Green Version]
  7. Kwantes, J.M.; Grundmann, O. A brief review of krill oil history, research, and the commercial market. J. Diet. Suppl. 2015, 12, 23–35. [Google Scholar] [CrossRef]
  8. Schuchardt, J.P.; Schneider, I.; Meyer, H.; Neubronner, J.; von Schacky, C.; Hahn, A. Incorporation of EPA and DHA into plasma phospholipids in response to different omega-3 fatty acid formulations—A comparative bioavailability study of fish oil vs. krill oil. Lipids Health Dis. 2011, 10, 145–151. [Google Scholar] [CrossRef] [Green Version]
  9. Commission, C.A. Codex329-2017; Standard for Fish Oils., Codex Alimentarius Commission: Rome, Italy, 2017. [Google Scholar]
  10. Commission, C.A. Codex234-1999; Recommended Methods of Analysis and Sampling., Codex Alimentarius Commission: Rome, Italy, 1999. [Google Scholar]
  11. Schiller, J.; Muller, M.; Fuchs, B.; Arnold, K.; Huster, D. 31P NMR spectroscopy of phospholipids: From micelles to membranes. Curr. Anal. Chem. 2007, 3, 283–301. [Google Scholar] [CrossRef]
  12. He, Y.; Shim, Y.Y.; Shen, J.; Kim, J.H.; Cho, J.Y.; Hong, W.S.; Meda, V.; Reaney, M.J.T. Aquafaba from Korean Soybean II: Physicochemical Properties and Composition Characterized by NMR Analysis. Foods 2021, 10, 2589. [Google Scholar] [CrossRef]
  13. Pironti, C.; Ricciardi, M.; Motta, O.; Camin, F.; Bontempo, L.; Proto, A. Application of 13C Quantitative NMR Spectroscopy to Isotopic Analyses for Vanillin Authentication Source. Foods 2021, 10, 2635. [Google Scholar] [CrossRef] [PubMed]
  14. Choi, K.; Myoung, S.; Seo, Y.; Ahn, S. Quantitative NMR as a Versatile Tool for the Reference Material Preparation. Magnetochemistry 2021, 7, 15. [Google Scholar] [CrossRef]
  15. Meng, X.; Sedman, J.; van de Voort, F.R. Improving the determination of moisture in edible oils by FTIR spectroscopy using acetonitrile extraction. Food Chem. 2012, 135, 722–729. [Google Scholar] [CrossRef] [PubMed]
  16. Peterson, B.L.; Cummings, B.S. A review of chromatographic methods for the assessment of phospholipids in biological samples. Biomed. Chromatogr. 2006, 20, 227–243. [Google Scholar] [CrossRef] [PubMed]
  17. Restuccia, D.; Spizzirri, U.G.; Puoci, F.; Cirillo, G.; Vinci, G.; Picci, N. Determination of Phospholipids in Food Samples. Food Rev. Int. 2012, 28, 1–46. [Google Scholar] [CrossRef]
  18. Van de Voort, F. Fourier transform infrared spectroscopy applied to food analysis. Food Res. Int. 1992, 25, 397–403. [Google Scholar] [CrossRef]
  19. Al-Alawi, A.; van de Voort, F.R.; Sedman, J.; Ghetler, A. Automated FTIR Analysis of Free Fatty Acids or Moisture in Edible Oils. J. Lab. Autom. 2016, 11, 23–29. [Google Scholar] [CrossRef] [Green Version]
  20. Cesa, S.; Casadei, M.A.; Cerreto, F.; Paolicelli, P. Influence of fat extraction methods on the peroxide value in infant formulas. Food Res. Int. 2012, 48, 584–591. [Google Scholar] [CrossRef]
  21. Oussama, A.; Elabadi, F.; Devos, O. Analysis of Argan Oil Adulteration Using Infrared Spectroscopy. Spectrosc. Lett 2012, 45, 458–463. [Google Scholar] [CrossRef]
  22. Rohman, A.; Man, Y.B.C. Fourier transform infrared (FTIR) spectroscopy for analysis of extra virgin olive oil adulterated with palm oil. Food Res. Int. 2010, 43, 886–892. [Google Scholar] [CrossRef]
  23. Sherazi, S.T.H.; Kandhro, A.; Mahesar, S.A.; Bhanger, M.I.; Talpur, M.Y.; Arain, S. Application of transmission FT-IR spectroscopy for the trans fat determination in the industrially processed edible oils. Food Chem. 2009, 114, 323–327. [Google Scholar] [CrossRef]
  24. Yu, X.; Du, S.; van de VOORT, F.R.; Yue, T.; Li, Z. Automated and simultaneous determination of free fatty acids and peroxide values in edible oils by FTIR spectroscopy using spectral reconstitution. Anal. Sci. 2009, 25, 627–632. [Google Scholar] [CrossRef] [Green Version]
  25. Spyrelli, E.D.; Papachristou, C.K.; Nychas, G.-J.E.; Panagou, E.Z. Microbiological Quality Assessment of Chicken Thigh Fillets Using Spectroscopic Sensors and Multivariate Data Analysis. Foods 2021, 10, 2723. [Google Scholar] [CrossRef]
  26. AOCS, F.D. Official methods and recommended practices of the American Oil Chemists’ Society. J. Am. Oil. Chem. Soc. 1998, 5, 2–93. [Google Scholar]
  27. Park, S.M.; Yu, H.Y.; Chun, H.S.; Kim, B.H.; Ahn, S. A Second Derivative Fourier-Transform Infrared Spectroscopy Method to Discriminate Perilla Oil Authenticity. J. Oleo Sci. 2019, 68, 389–398. [Google Scholar] [CrossRef] [Green Version]
  28. Nzai, J.; Proctor, A. Soy lecithin phospholipid determination by fourier transform infrared spectroscopy and the acid digest/arseno-molybdate method: A comparative study. J. Am. Oil Chem. Soc. 1999, 76, 61–66. [Google Scholar] [CrossRef]
  29. Szłyk, E.; Szydłowska-Czerniak, A.; Kowalczyk-Marzec, A. NIR spectroscopy and partial least-squares regression for determination of natural α-tocopherol in vegetable oils. J. Agric. Food Chem. 2005, 53, 6980–6987. [Google Scholar] [CrossRef] [PubMed]
  30. Whittinghill, J.; Norton, J.; Proctor, A. Stability determination of soy lecithin-based emulsions by Fourier transform infrared spectroscopy. J. Am. Oil Chem. Soc. 2000, 77, 37–42. [Google Scholar] [CrossRef]
  31. Rieppo, L.; Saarakkala, S.; Narhi, T.; Helminen, H.J.; Jurvelin, J.S.; Rieppo, J. Application of second derivative spectroscopy for increasing molecular specificity of Fourier transform infrared spectroscopic imaging of articular cartilage. Osteoarthr. Cartil. 2012, 20, 451–459. [Google Scholar] [CrossRef] [PubMed] [Green Version]
  32. Zimmermann, B.; Kohler, A. Optimizing Savitzky-Golay parameters for improving spectral resolution and quantification in infrared spectroscopy. Appl. Spectrosc. 2013, 67, 892–902. [Google Scholar] [CrossRef] [Green Version]
  33. USP-NF(43) Krill Oil Monograph, 38th ed.; The United States Pharmacopeial Convention, USP 43-NF38; The United States Parmacopeial Convention, Inc.: North Bethesda, MD, USA, 2020; Volume 3, pp. 5100–5111.
  34. Burri, L.; Hoem, N.; Monakhova, Y.B.; Diehl, B.W.K. Fingerprinting Krill Oil by 31P, 1H and 13C NMR Spectroscopies. J. Am. Oil. Chem. Soc. 2016, 93, 1037–1049. [Google Scholar] [CrossRef]
  35. Monakhova, Y.B.; Diehl, B.W.K. Automated multicomponent phospholipid analysis using 31P NMR spectroscopy: Example of vegetable lecithin and krill oil. Anal. Biochem. 2018, 410, 7891–7900. [Google Scholar] [CrossRef] [PubMed]
  36. Szydlowskaczerniak, A. MIR spectroscopy and partial least-squares regression for determination of phospholipids in rapeseed oils at various stages of technological process. Food Chem. 2007, 105, 1179–1187. [Google Scholar] [CrossRef]
  37. Vongsvivut, J.; Heraud, P.; Zhang, W.; Kralovec, J.A.; McNaughton, D.; Barrow, C.J. Quantitative determination of fatty acid compositions in micro-encapsulated fish-oil supplements using Fourier transform infrared (FTIR) spectroscopy. Food Chem. 2012, 135, 603–609. [Google Scholar] [CrossRef]
  38. Haider, J.; Majeed, H.; Williams, P.A.; Safdar, W.; Zhong, F. Formation of chitosan nanoparticles to encapsulate krill oil (Euphausia superba) for application as a dietary supplement. Food Hydrocoll. 2017, 63, 27–34. [Google Scholar] [CrossRef]
  39. Yan, C.; Huang, W.; Xu, J.; Yang, H.; Zhang, Y.; Bahia, H.U. Quantification of re-refined engine oil bottoms (REOB) in asphalt binder using ATR-FTIR spectroscopy associated with partial least squares (PLS) regression. Road Mater. Pavement Des. 2020, 1–15. [Google Scholar] [CrossRef]
  40. Kuligowski, J.; Quintas, G.; Esteve-Turrillas, F.A.; Garrigues, S.; de la Guardia, M. On-line gel permeation chromatography-attenuated total reflectance-Fourier transform infrared determination of lecithin and soybean oil in dietary supplements. J. Chromatogr. A 2008, 1185, 71–77. [Google Scholar] [CrossRef] [PubMed]
  41. Meng, X.; Pan, Q.; Ding, Y.; Jiang, L. Rapid determination of phospholipid content of vegetable oils by FTIR spectroscopy combined with partial least-square regression. Food Chem. 2014, 147, 272–278. [Google Scholar] [CrossRef]
  42. Schulz, H.; Schrader, B.; Quilitzsch, R.; Steuer, B. Quantitative analysis of various citrus oils by ATR/FT-IR and NIR-FT Raman spectroscopy. Appl. Spectrosc. 2002, 56, 117–124. [Google Scholar] [CrossRef]
Figure 1. FT-IR absorption spectra of (a) USP reference standard krill oil sample, (b) fish oil, and (c) mixture sample of krill oil raw material and fish oil (50/50, w/w%). (d) Second-derivative FT-IR spectrum of (c). See Table 1 for each peak assignment.
Foods 11 00041 g001
Figure 2. FT-IR spectra of mixed samples of krill oil raw material and fish oil with a ratio of krill oil/fish oil from 20/80 to 100/0 (w/w%) in the region of 1500–900 cm−1.
Foods 11 00041 g002
Figure 3. Calibration curves for PC and total PL content: absorbance and its second-derivative of (a,c) (CH3)3-N-asymmetric stretching (970 cm−1) signal and (b,d) -P=O asymmetric stretching (1236 cm−1) signal.
Foods 11 00041 g003
Table 1. Assignment of absorption signals in FT-IR spectrum of krill oil reference sample [1,36,37].
Peak
Variable
Wavenumber (cm−1)Functional GroupMode of Vibration
I13010=C–H (cis-)Stretching
I22958–C–H (CH3)Stretching (asym)
I32924–C–H (CH2)Stretching (asym)
I42853–C–H (CH2)Stretching (sym)
I51745–C=O (ester)Stretching
I61654–C=C– (cis-)Stretching
I71466–C–H (CH2, CH3)Bending (scissoring)
I81419=C–H (cis-)Bending (rocking)
I91395=C–H (cis-)Bending
I101377–C–H (CH3)Bending (sym)
I111236PO2 (diester)Stretching (asym)
I121167–C–O–P (ester)Stretching (sym)
I131090PO2 (diester)Stretching (sym)
I141060–C–O–P (ester)Stretching (asym)
I15970–N–(CH3)3Stretching (asym)
Table 2. LOD, LOQ, recovery, repeatability, and intermediate precision of FT-IR method.
KERRYPNXAbsorbanceSecond-Derivative
PCTotal PLPCTotal PL
LOD (wt%)1.190.650.353.29
LOQ (wt%)3.591.981.069.98
Recovery (%)97.9097.96100.21100.33
Repeatability (%, RSD)0.921.250.902.31
Intermediate precision (%, RSD)1.470.931.152.65
Table 3. PC and total PL contents in krill oil test samples obtained from the FT-IR and 31P NMR methods.
Test
Sample
PL Contents (wt%) ± Standard Deviation
FT-IR Method31P NMR Method
AbsorbanceSecond-Derivative
PCTotal PLPCTotal PLPCTotal PL
Mixture 119.25 ± 0.3122.00 ± 0.4219.66 ± 0.0622.89 ± 0.6520.02 ± 0.0222.68 ± 0.01
Mixture 222.44 ± 0.1925.76 ± 0.1023.14 ± 0.0625.39 ± 0.8122.04 ± 0.3125.10 ± 0.24
Mixture 333.03 ± 0.5637.92 ± 0.6333.56 ± 0.2837.89 ± 0.1932.18 ± 1.0836.56 ± 1.22
Mixture 436.10 ± 0.6541.11 ± 0.7236.83 ± 0.6141.90 ± 0.4136.71 ± 0.3341.84 ± 0.33
Mixture 543.78 ± 0.4449.99 ± 0.4343.96 ± 0.0350.54 ± 1.2044.46 ± 0.1150.74 ± 0.07
Supplement 150.95 ± 0.6455.29 ± 0.6950.01 ± 0.1956.41 ± 1.2949.39 ± 0.6956.12 ± 0.78
Supplement 253.38 ± 0.3754.30 ± 0.5447.10 ± 0.6952.58 ± 0.9648.05 ± 1.5352.14 ± 1.66
Supplement 335.89 ± 0.2638.82 ± 1.0334.95 ± 0.7735.89 ± 1.1735.21 ± 1.5539.59 ± 1.74
Supplement 433.82 ± 1.3538.39 ± 1.5032.25 ± 0.7734.12 ± 0.6731.13 ± 1.8535.50 ± 2.11
Supplement 537.94 ± 2.2441.43 ± 2.1234.94 ± 0.5237.70 ± 0.3734.06 ± 0.9638.71 ± 1.09
Supplement 641.75 ± 0.5842.64 ± 0.5840.28 ± 0.7744.33 ± 0.8540.49 ± 0.1045.23 ± 0.11
Supplement 744.94 ± 1.3248.05 ± 1.2737.13 ± 1.1339.17 ± 0.7938.73 ± 1.1044.31 ± 1.26
Publisher’s Note: MDPI stays neutral with regard to jurisdictional claims in published maps and institutional affiliations.

