
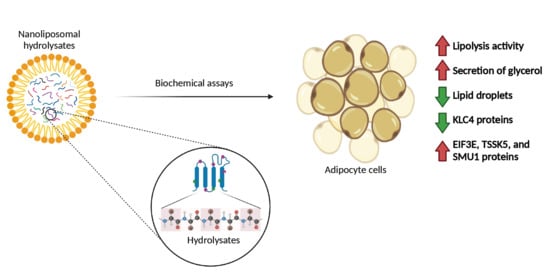
Study of the Lipolysis Effect of Nanoliposome-Encapsulated Ganoderma lucidum Protein Hydrolysates on Adipocyte Cells Using Proteomics Approach

 , ,
, ,
Abstract
:
1. Introduction
2. Materials and Methods
2.1. Ganoderma Lucidum Hydrolysate Preparation
2.2. Lingzhi Protein Hydrolysate Optimization by Response Surface Methodology (RSM)
2.3. Nano-Liposome Carrier Preparation and Characterization
2.4. Effect of Loaded Nanoliposomes on 3T3-L1 Adipocyte Cells
2.5. Proteomic Analysis and Data Processing
2.6. Statistical Analysis
3. Results
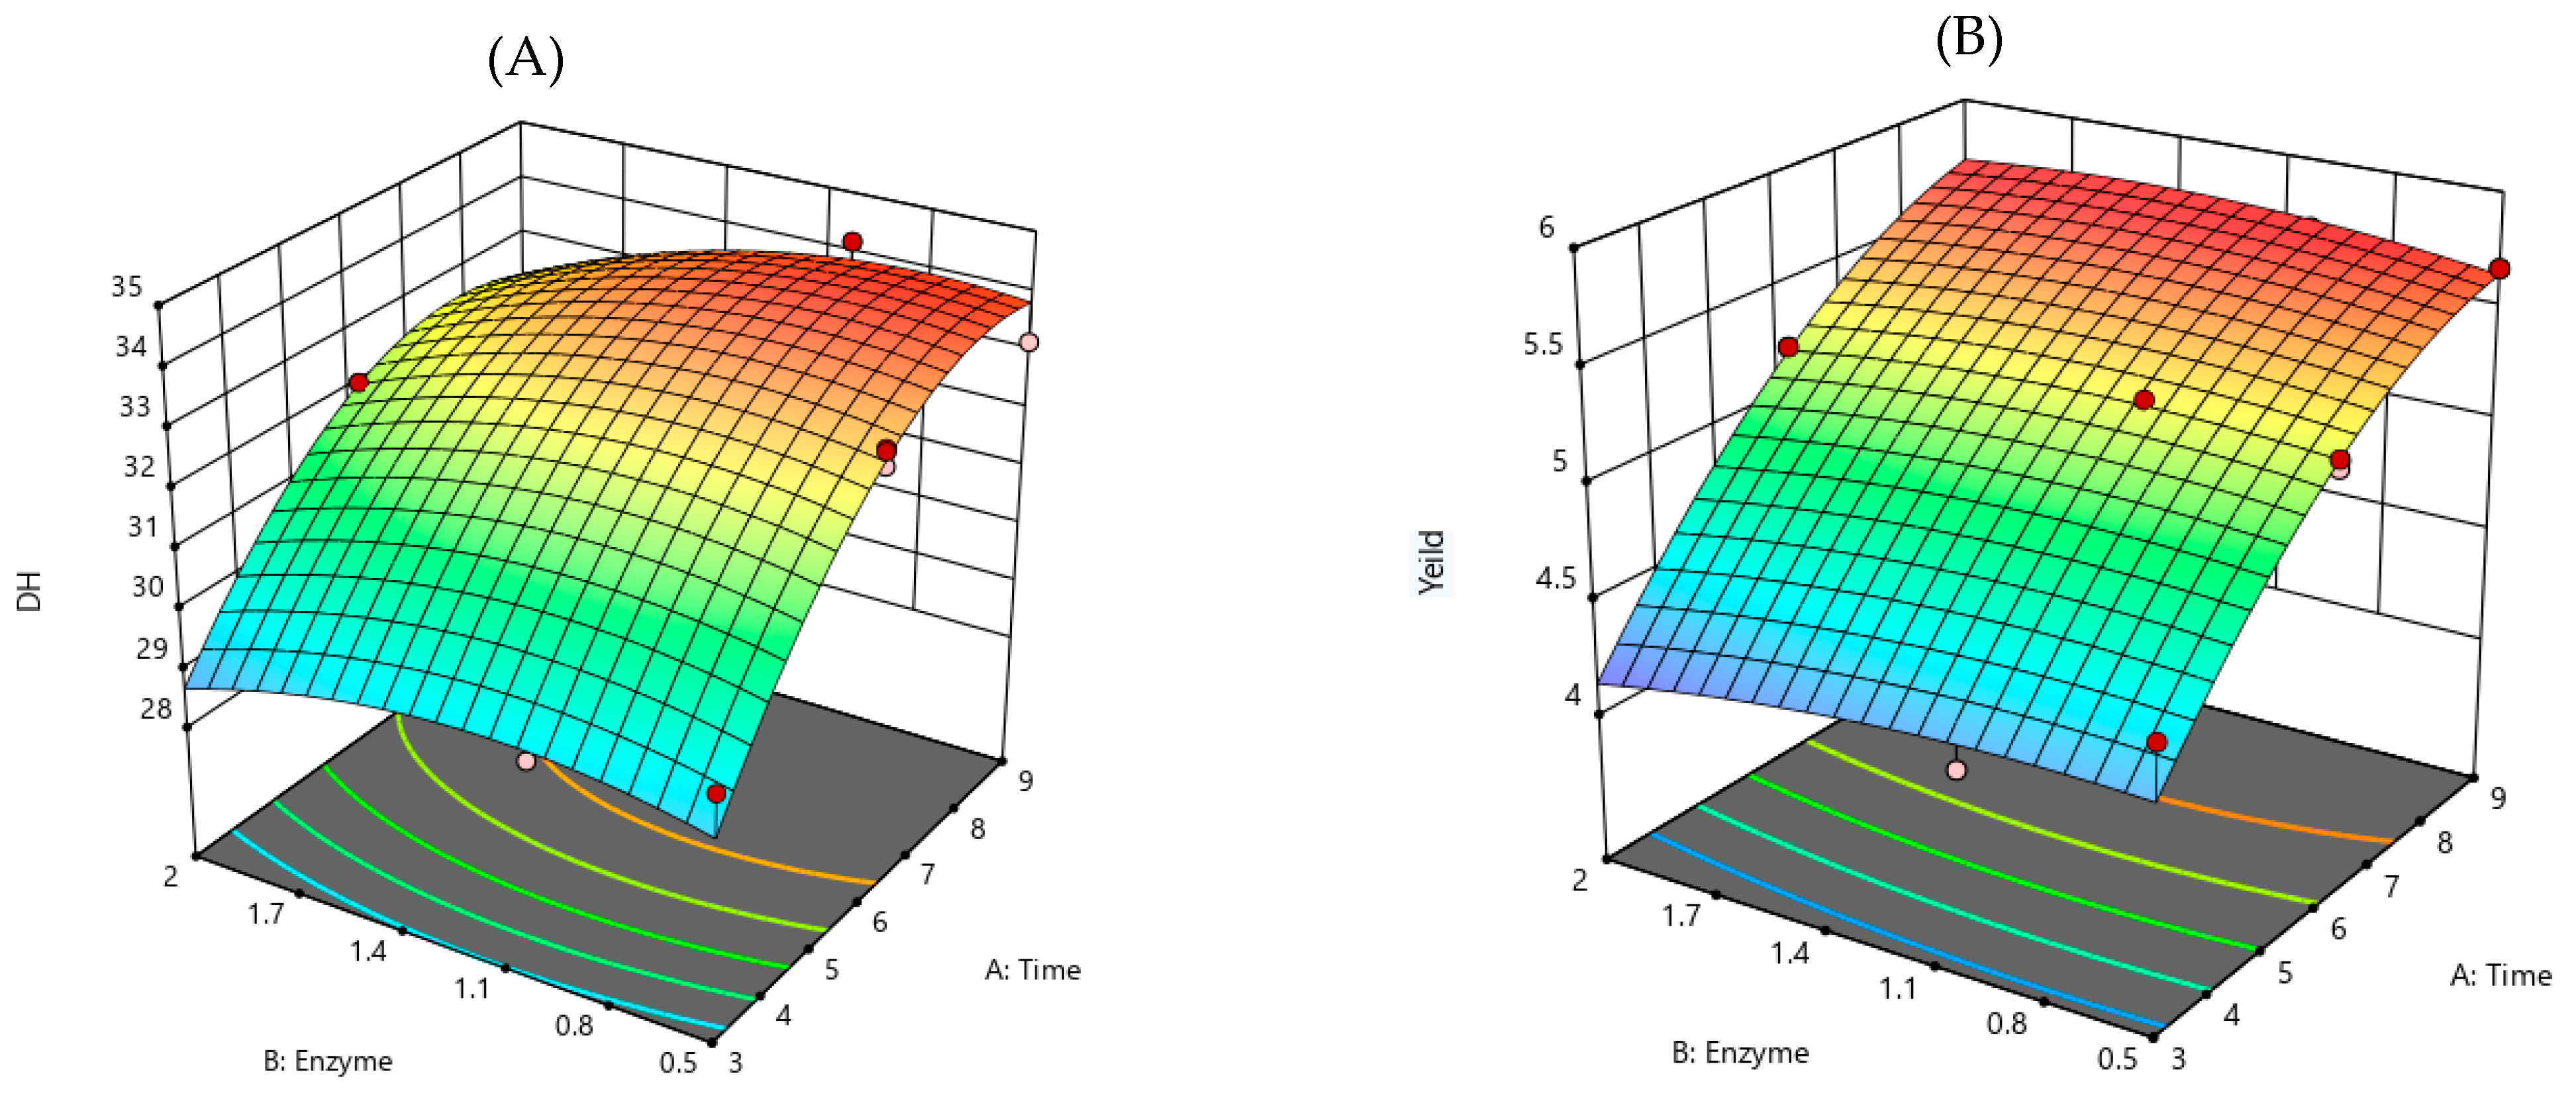
3.1. Lingzhi-Derived Protein Hydrolysate Optimization
3.2. Encapsulation Efficiency and Loaded Liposome Size, Polydispersity Index, and Zeta Potential
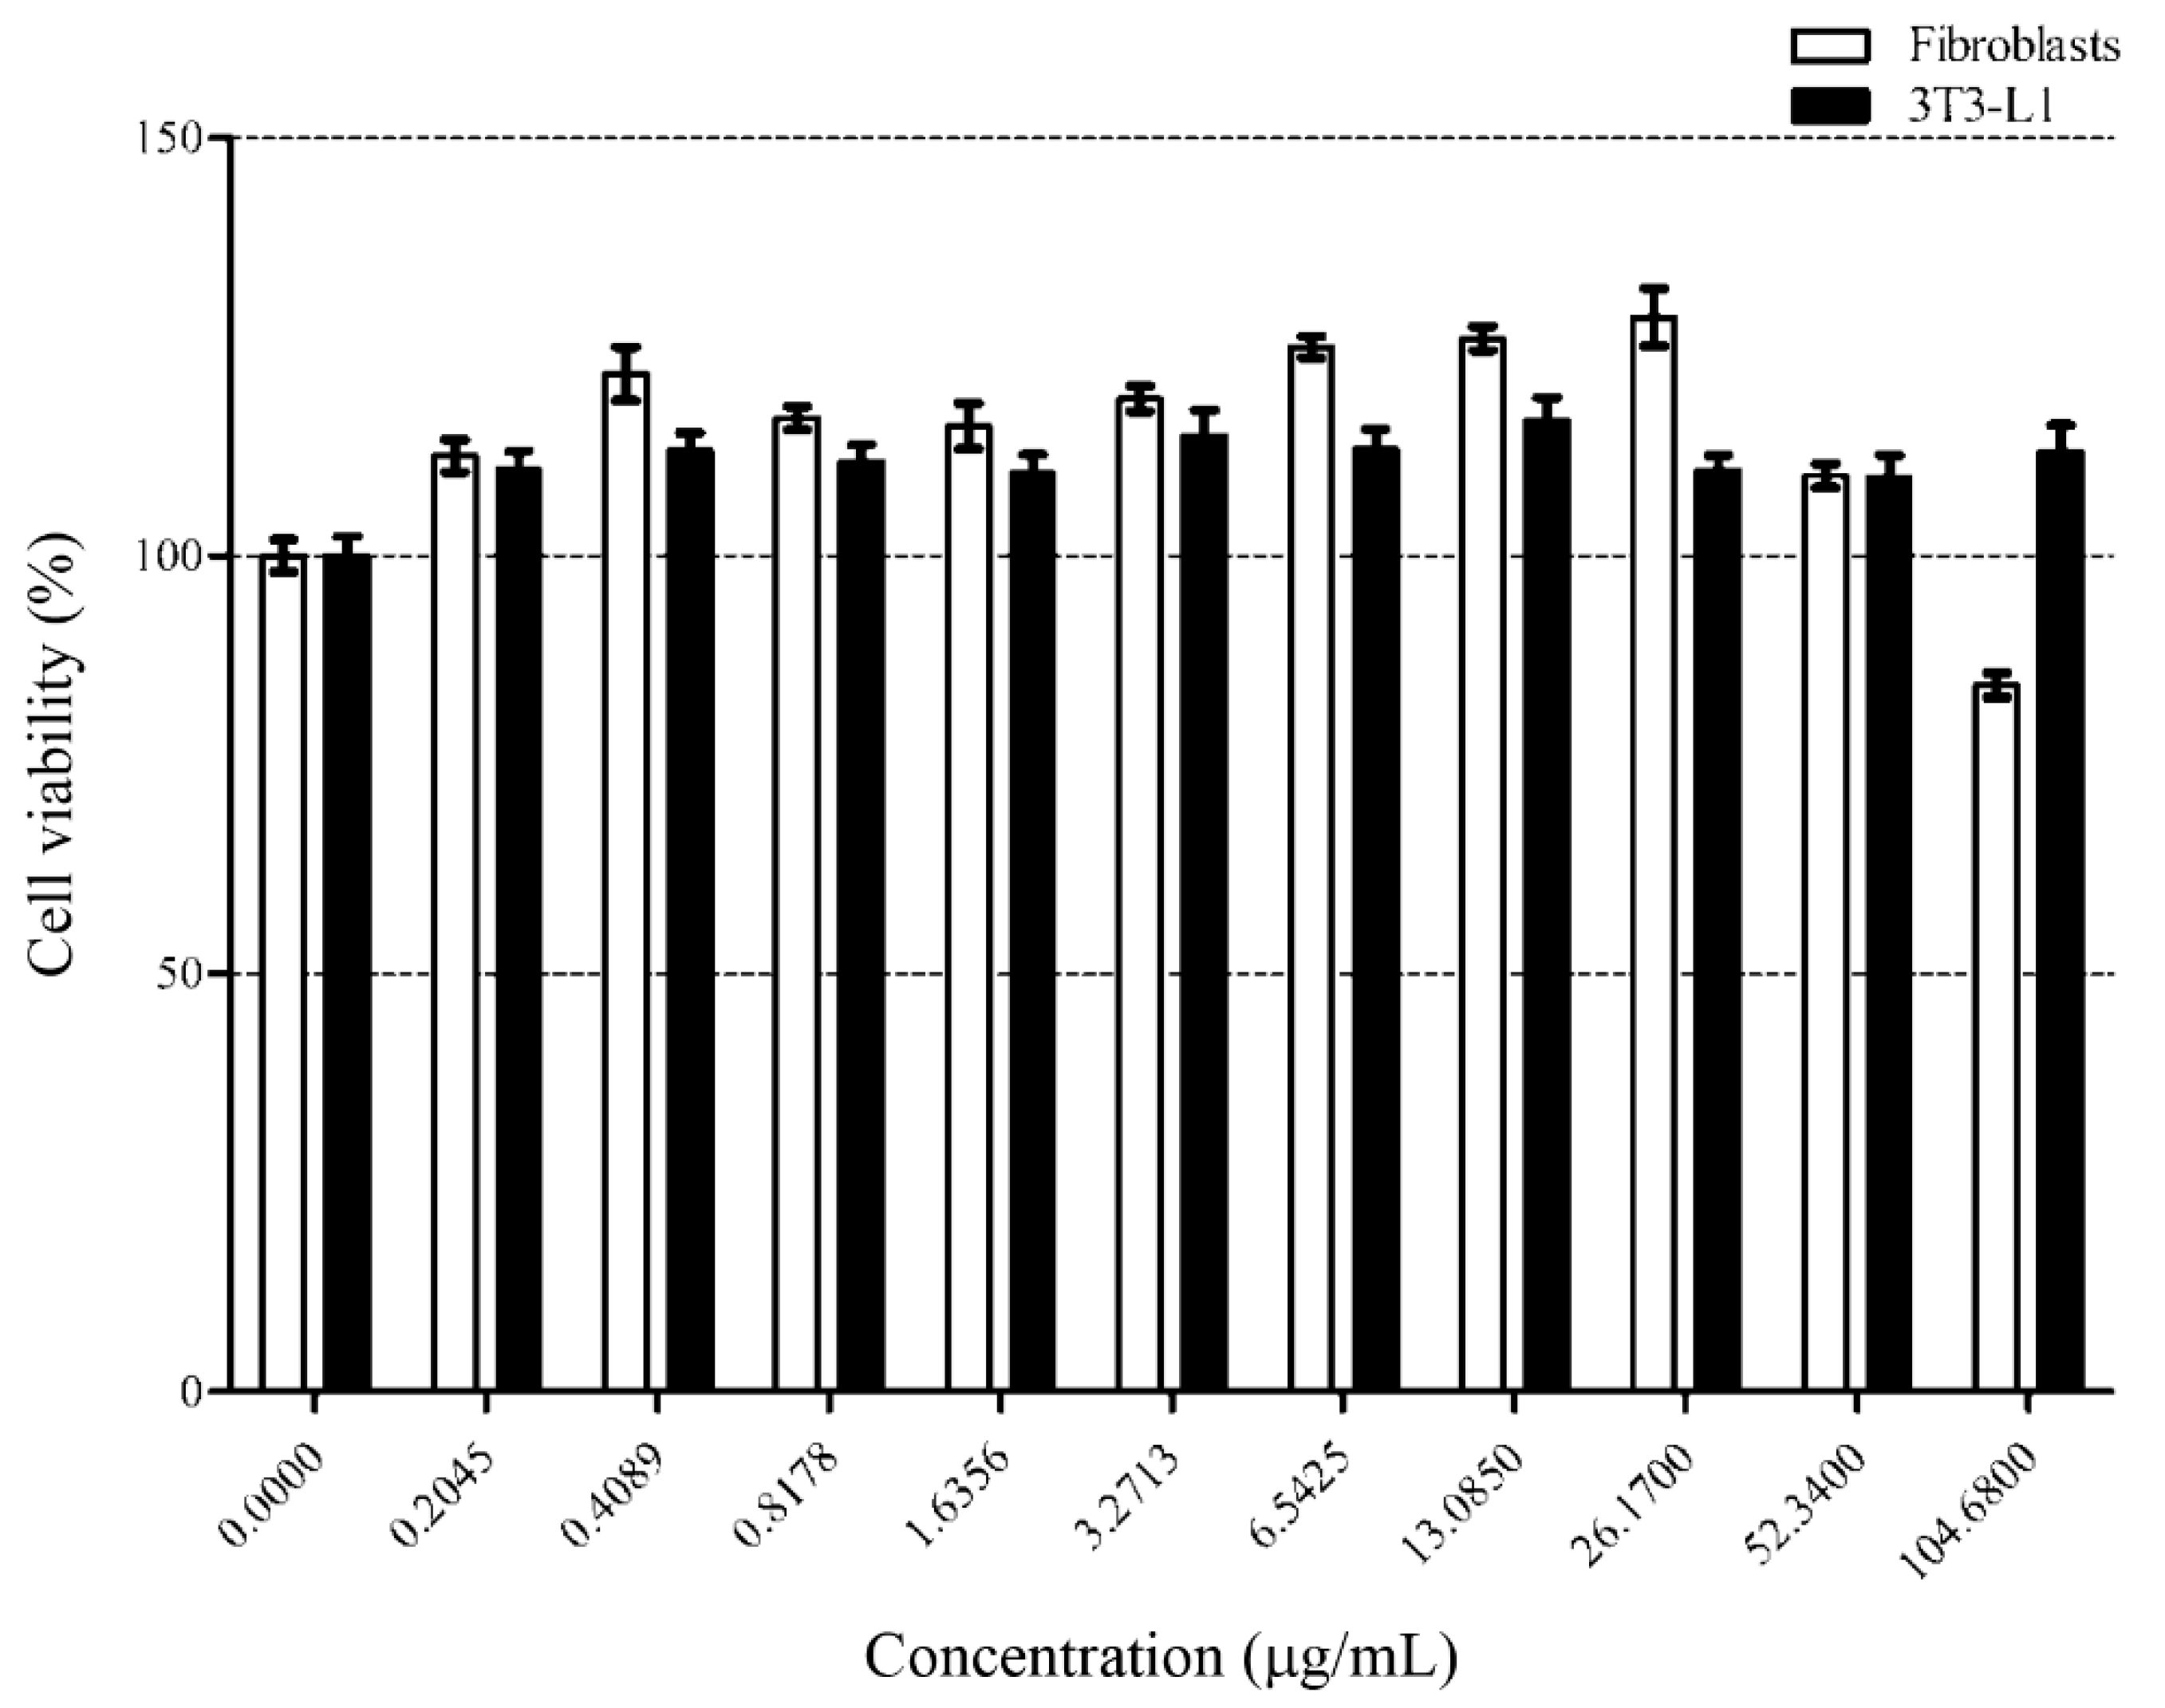
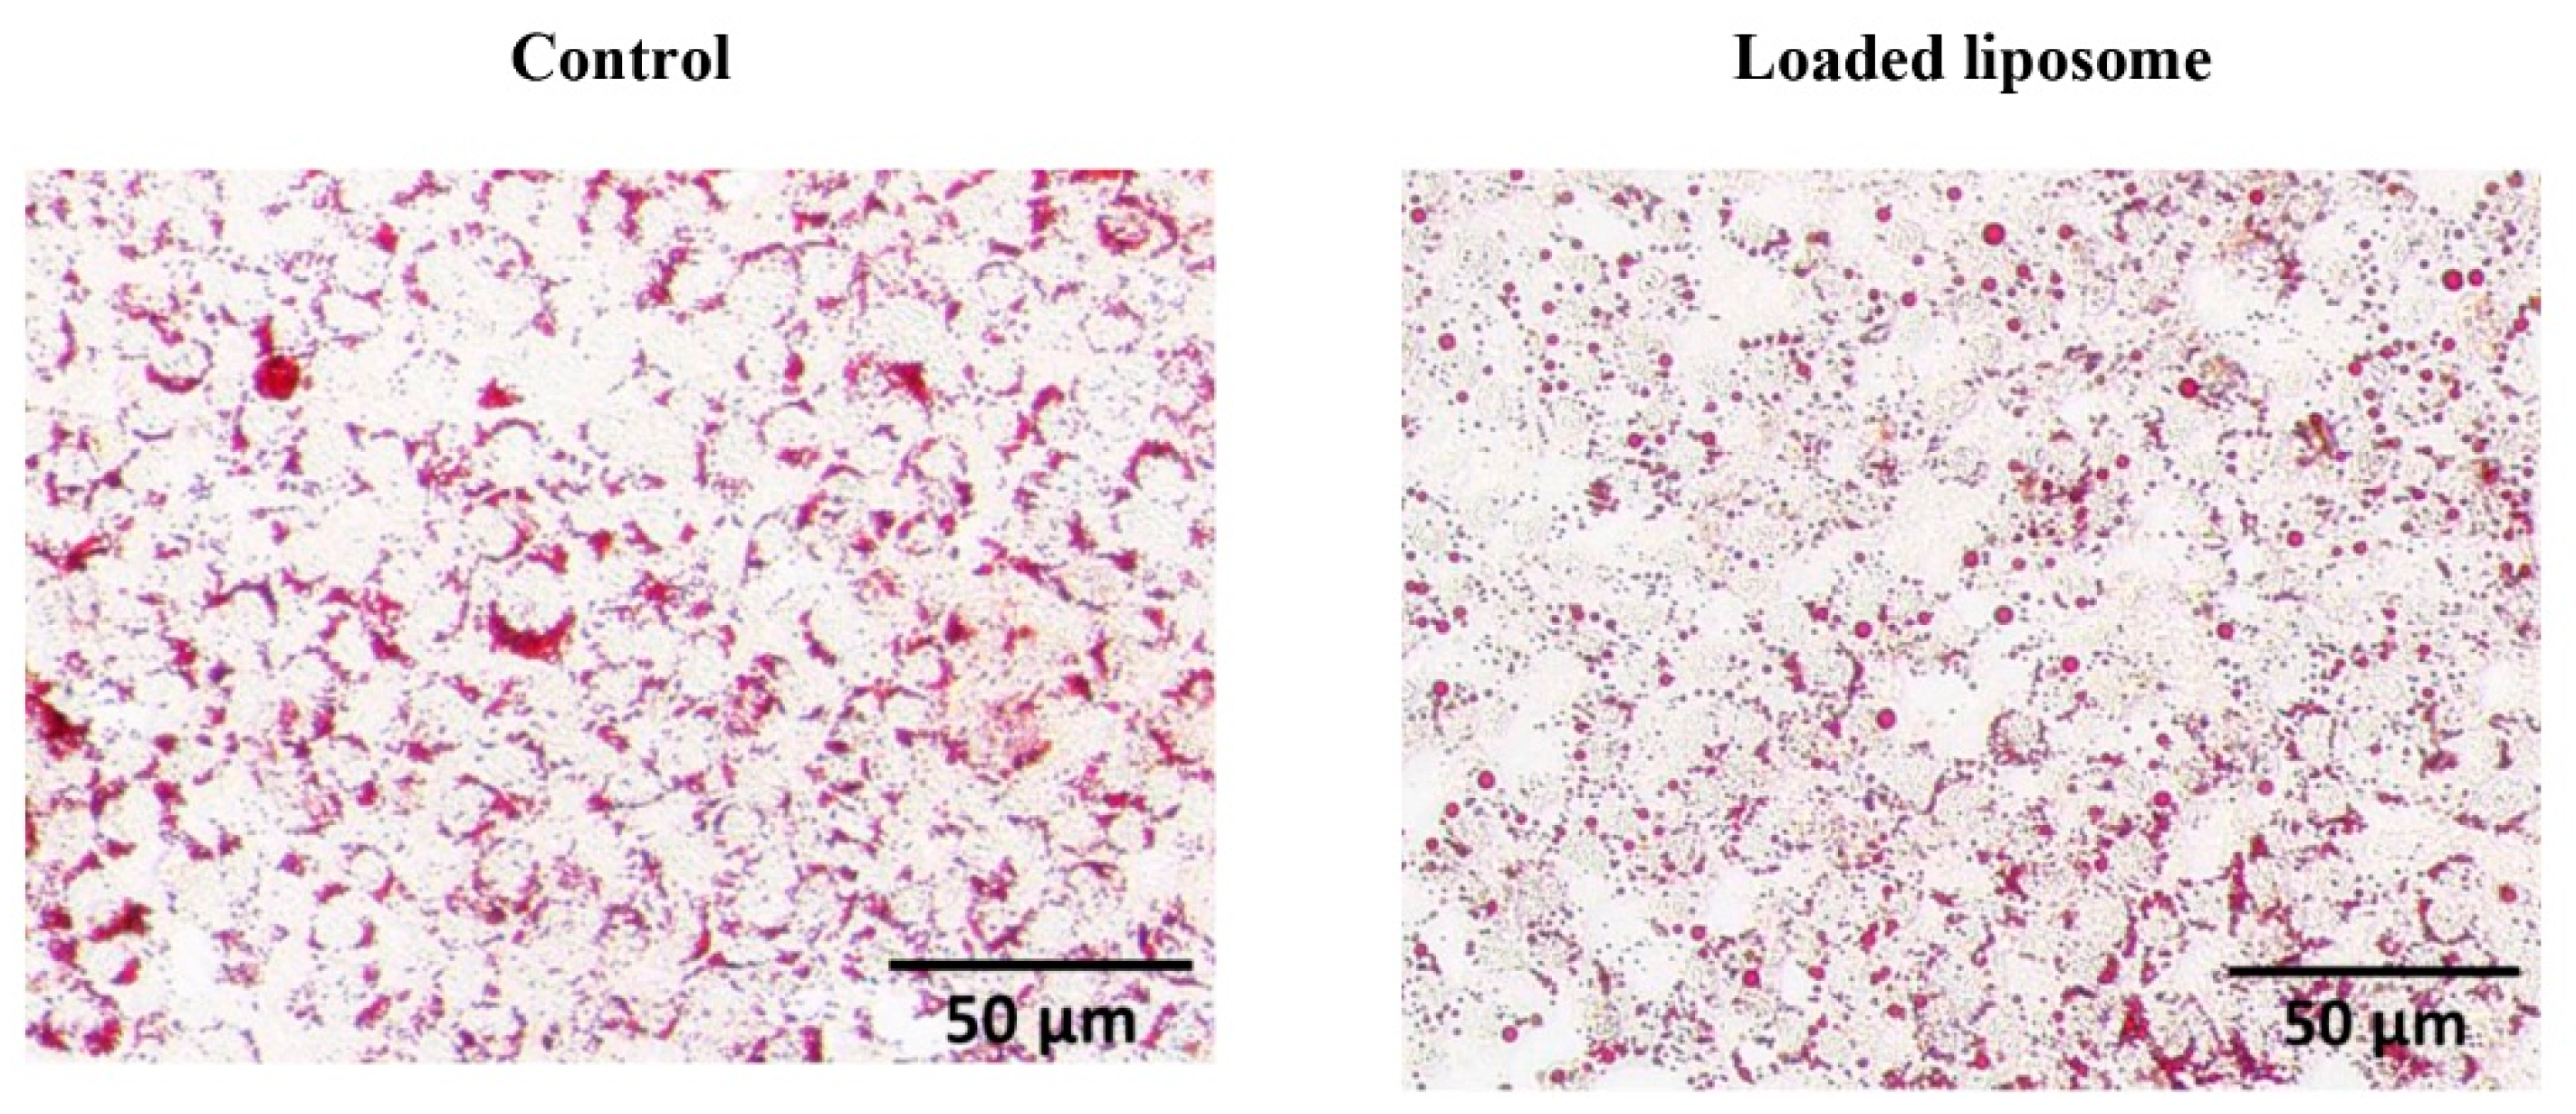
3.3. Effect of Loaded Nanoliposome on 3T3-L1 Adipocyte Cells
3.4. Quantitative Proteomic Analysis
4. Conclusions
Supplementary Materials
Author Contributions
Funding
Institutional Review Board Statement
Informed Consent Statement
Data Availability Statement
Acknowledgments
Conflicts of Interest
Appendix A

| 1. DH | ||||||
| Model | 39.47 | 5 | 7.89 | 22.9 | 0.0019 | significant |
| A-Time | 4.68 | 1 | 4.68 | 13.56 | 0.0143 | |
| B-Enzyme | 0.769 | 1 | 0.769 | 2.23 | 0.1955 | |
| AB | 0.083 | 1 | 0.083 | 0.2407 | 0.6445 | |
| A² | 5.7 | 1 | 5.7 | 16.54 | 0.0097 | |
| B² | 1.06 | 1 | 1.06 | 3.06 | 0.1405 | |
| Residual | 1.72 | 5 | 0.3447 | |||
| Lack of Fit | 1.68 | 3 | 0.5585 | 23.24 | 0.0415 | significant |
| Pure Error | 0.0481 | 2 | 0.024 | |||
| Cor Total | 41.19 | 10 | ||||
| Std. Dev. | 0.5871 | R² | 0.9582 | |||
| Mean | 32.08 | Adjusted R² | 0.9163 | |||
| C.V. % | 1.83 | Predicted R² | 0.4581 | |||
| Adeq Precision | 11.99244 | |||||
| 2. Yield | ||||||
| Model | 2.87 | 5 | 0.5747 | 30.13 | 0.001 | significant |
| A-Time | 0.5672 | 1 | 0.5672 | 29.74 | 0.0028 | |
| B-Enzyme | 0.0023 | 1 | 0.0023 | 0.1184 | 0.7448 | |
| AB | 0.0046 | 1 | 0.0046 | 0.2399 | 0.645 | |
| A² | 0.1691 | 1 | 0.1691 | 8.87 | 0.0309 | |
| B² | 0.0139 | 1 | 0.0139 | 0.7302 | 0.4318 | |
| Residual | 0.0954 | 5 | 0.0191 | |||
| Lack of Fit | 0.0945 | 3 | 0.0315 | 72.69 | 0.0136 | significant |
| Pure Error | 0.0009 | 2 | 0.0004 | |||
| Cor Total | 2.97 | 10 | ||||
| Std. Dev. | 0.1381 | R² | 0.9679 | |||
| Mean | 5.1 | Adjusted R² | 0.9358 | |||
| C.V. % | 2.71 | Predicted R² | −0.5277 | |||
| Adeq Precision | 14.0722 | |||||
Appendix B
| Protein Name | p-Value | Log2 Intensity | ||||||
|---|---|---|---|---|---|---|---|---|
| Control01 | Control02 | Control03 | Liposome01 | Liposome02 | Liposome03 | log(p-Value) | ||
| HNRH1_MOUSE | 3.65 × 10⁻⁶ | 16.58 | 16.46 | 16.41 | 14.17 | 14.23 | 14.26 | 5.44 |
| VIME_MOUSE | 9.17 × 10⁻⁶ | 19.58 | 19.48 | 19.52 | 17.64 | 17.55 | 17.70 | 5.04 |
| TBA8_MOUSE | 1.06 × 10⁻⁵ | 19.94 | 19.82 | 19.70 | 17.87 | 17.87 | 17.90 | 4.98 |
| HIG1A_MOUSE | 1.72 × 10⁻⁵ | 13.17 | 13.12 | 12.98 | 11.23 | 11.27 | 11.04 | 4.76 |
| UBA1_MOUSE | 1.80 × 10⁻⁵ | 17.44 | 17.45 | 17.35 | 15.74 | 15.70 | 15.54 | 4.75 |
| IF4A1_MOUSE | 1.96 × 10⁻⁵ | 16.22 | 16.32 | 16.30 | 14.65 | 14.57 | 14.71 | 4.71 |
| KPYM_MOUSE | 2.20 × 10⁻⁵ | 20.80 | 21.00 | 20.79 | 18.90 | 19.10 | 18.83 | 4.66 |
| PSMD2_MOUSE | 2.24 × 10⁻⁵ | 15.41 | 15.44 | 15.06 | 12.99 | 13.21 | 13.17 | 4.65 |
| TBA4A_MOUSE | 2.42 × 10⁻⁵ | 20.35 | 20.20 | 20.09 | 18.36 | 18.42 | 18.53 | 4.62 |
| ATPA_MOUSE | 3.24 × 10⁻⁵ | 18.45 | 18.15 | 18.20 | 16.13 | 16.46 | 16.29 | 4.49 |
| IPO5_MOUSE | 3.30 × 10⁻⁵ | 15.47 | 15.28 | 15.53 | 13.84 | 13.79 | 13.80 | 4.48 |
| RAN_MOUSE | 3.41 × 10⁻⁵ | 18.54 | 18.40 | 18.76 | 16.53 | 16.64 | 16.78 | 4.47 |
| RANT_MOUSE | 3.41 × 10⁻⁵ | 18.54 | 18.40 | 18.76 | 16.53 | 16.64 | 16.78 | 4.47 |
| RGL2_MOUSE | 3.44 × 10⁻⁵ | 15.83 | 15.62 | 15.75 | 13.64 | 13.99 | 13.91 | 4.46 |
| MYH9_MOUSE | 3.81 × 10⁻⁵ | 17.63 | 17.64 | 17.86 | 15.73 | 15.94 | 16.04 | 4.42 |
| ADT2_MOUSE | 4.25 × 10⁻⁵ | 18.79 | 19.10 | 18.81 | 16.78 | 17.10 | 16.74 | 4.37 |
| ADT1_MOUSE | 4.37 × 10⁻⁵ | 18.12 | 18.30 | 18.16 | 16.21 | 16.60 | 16.37 | 4.36 |
| RHOA_MOUSE | 4.43 × 10⁻⁵ | 15.32 | 15.23 | 15.38 | 13.93 | 13.79 | 13.77 | 4.35 |
| GLRX3_MOUSE | 4.53 × 10⁻⁵ | 16.10 | 16.22 | 15.99 | 14.55 | 14.36 | 14.56 | 4.34 |
| FLNA_MOUSE | 4.90 × 10⁻⁵ | 17.85 | 18.20 | 18.00 | 16.40 | 16.38 | 16.38 | 4.31 |
| SYSC_MOUSE | 4.95 × 10⁻⁵ | 12.81 | 13.18 | 12.30 | 9.98 | 10.00 | 9.94 | 4.31 |
| SDHA_MOUSE | 5.34 × 10⁻⁵ | 15.09 | 14.78 | 15.07 | 13.39 | 13.18 | 13.18 | 4.27 |
| PRS6B_MOUSE | 5.61 × 10⁻⁵ | 15.29 | 15.71 | 15.39 | 13.70 | 13.69 | 13.52 | 4.25 |
| CAN2_MOUSE | 5.62 × 10⁻⁵ | 12.78 | 13.08 | 12.52 | 10.78 | 10.59 | 10.80 | 4.25 |
| ATAD1_MOUSE | 5.75 × 10⁻⁵ | 16.37 | 16.22 | 15.98 | 14.27 | 14.20 | 13.83 | 4.24 |
| RS2_MOUSE | 6.36 × 10⁻⁵ | 16.51 | 16.43 | 16.18 | 14.73 | 14.83 | 14.62 | 4.20 |
| NONO_MOUSE | 6.55 × 10⁻⁵ | 15.03 | 15.20 | 15.10 | 13.09 | 12.32 | 12.58 | 4.18 |
| PGM1_MOUSE | 6.58 × 10⁻⁵ | 15.08 | 15.23 | 15.20 | 13.77 | 13.89 | 13.85 | 4.18 |
| EF2_MOUSE | 6.83 × 10⁻⁵ | 19.20 | 19.04 | 19.08 | 17.60 | 17.80 | 17.57 | 4.17 |
| FINC_MOUSE | 6.87 × 10⁻⁵ | 16.44 | 16.08 | 16.53 | 14.48 | 14.55 | 14.63 | 4.16 |
| K22O_MOUSE | 7.50 × 10⁻⁵ | 15.65 | 15.76 | 14.98 | 18.79 | 19.12 | 18.30 | 4.13 |
| TCPB_MOUSE | 8.00 × 10⁻⁵ | 15.64 | 15.75 | 15.50 | 14.27 | 14.01 | 14.12 | 4.10 |
| SYVC_MOUSE | 8.03 × 10⁻⁵ | 13.57 | 14.21 | 13.62 | 11.53 | 11.61 | 11.32 | 4.10 |
| PRDX2_MOUSE | 8.32 × 10⁻⁵ | 16.59 | 16.25 | 16.50 | 14.71 | 14.65 | 14.95 | 4.08 |
| SERPH_MOUSE | 8.67 × 10⁻⁵ | 17.83 | 18.03 | 17.99 | 16.55 | 16.70 | 16.54 | 4.06 |
| APT_MOUSE | 8.76 × 10⁻⁵ | 13.68 | 13.87 | 14.07 | 11.55 | 12.03 | 11.42 | 4.06 |
| MYH10_MOUSE | 8.77 × 10⁻⁵ | 14.63 | 14.66 | 14.52 | 11.93 | 12.05 | 12.69 | 4.06 |
| HS90A_MOUSE | 9.32 × 10⁻⁵ | 19.67 | 19.82 | 19.74 | 18.19 | 18.48 | 18.32 | 4.03 |
| EIF3E_MOUSE | 0.000109 | 12.02 | 13.07 | 13.27 | 8.21 | 9.18 | 8.62 | 3.96 |
| COF1_MOUSE | 0.000111 | 20.53 | 20.48 | 20.50 | 19.26 | 19.40 | 19.20 | 3.95 |
| TBB5_MOUSE | 0.000112 | 18.99 | 18.79 | 18.92 | 17.67 | 17.69 | 17.69 | 3.95 |
| TBA1C_MOUSE | 0.000112 | 21.61 | 21.08 | 21.35 | 19.63 | 19.46 | 19.68 | 3.95 |
| RL6_MOUSE | 0.000116 | 14.96 | 14.92 | 14.97 | 13.88 | 13.76 | 13.76 | 3.94 |
| TBA1B_MOUSE | 0.000118 | 21.62 | 21.10 | 21.37 | 19.64 | 19.50 | 19.72 | 3.93 |
| TBB4B_MOUSE | 0.000118 | 18.99 | 18.77 | 18.91 | 17.62 | 17.68 | 17.68 | 3.93 |
| TBA1A_MOUSE | 0.000122 | 21.32 | 20.84 | 21.12 | 19.51 | 19.37 | 19.53 | 3.91 |
| TERA_MOUSE | 0.000125 | 19.24 | 19.22 | 19.26 | 18.07 | 18.18 | 18.12 | 3.90 |
| PP1B_MOUSE | 0.000129 | 16.74 | 16.73 | 16.63 | 15.62 | 15.53 | 15.55 | 3.89 |
| K1C15_MOUSE | 0.000132 | 15.09 | 14.81 | 14.93 | 16.24 | 16.17 | 16.23 | 3.88 |
| K1C17_MOUSE | 0.000132 | 15.09 | 14.81 | 14.93 | 16.24 | 16.17 | 16.23 | 3.88 |
| ATPB_MOUSE | 0.000137 | 19.50 | 19.44 | 19.37 | 18.08 | 18.18 | 18.33 | 3.86 |
| HS90B_MOUSE | 0.000139 | 20.21 | 20.04 | 20.30 | 18.75 | 18.97 | 18.77 | 3.86 |
| IF4G1_MOUSE | 0.000144 | 13.62 | 13.50 | 13.27 | 11.78 | 11.10 | 11.33 | 3.84 |
| CPSF5_MOUSE | 0.000148 | 14.38 | 14.59 | 14.62 | 13.23 | 13.35 | 13.31 | 3.83 |
| MYADM_MOUSE | 0.000151 | 13.23 | 13.16 | 13.01 | 11.29 | 10.72 | 10.41 | 3.82 |
| S35E3_MOUSE | 0.000152 | 12.63 | 13.06 | 12.52 | 11.02 | 11.11 | 11.07 | 3.82 |
| PUR6_MOUSE | 0.000153 | 18.17 | 17.71 | 17.96 | 15.97 | 16.31 | 15.75 | 3.82 |
| ANXA2_MOUSE | 0.000156 | 20.59 | 20.84 | 20.61 | 19.12 | 19.44 | 19.25 | 3.81 |
| RS3_MOUSE | 0.000157 | 18.82 | 18.55 | 18.71 | 16.61 | 16.87 | 16.09 | 3.81 |
| PDIA1_MOUSE | 0.000158 | 20.30 | 20.30 | 20.23 | 18.96 | 19.21 | 19.09 | 3.80 |
| HNRPF_MOUSE | 0.00016 | 16.04 | 15.88 | 16.21 | 14.59 | 14.28 | 14.65 | 3.79 |
| FLNB_MOUSE | 0.000165 | 16.61 | 16.89 | 16.76 | 15.53 | 15.25 | 15.21 | 3.78 |
| LDHA_MOUSE | 0.000169 | 19.05 | 19.17 | 19.18 | 17.69 | 18.00 | 17.67 | 3.77 |
| RL11_MOUSE | 0.000175 | 17.54 | 17.32 | 17.35 | 15.90 | 16.21 | 15.90 | 3.76 |
| FLNC_MOUSE | 0.000184 | 16.60 | 16.87 | 16.57 | 15.41 | 15.23 | 15.42 | 3.74 |
| MVP_MOUSE | 0.000184 | 15.70 | 15.74 | 15.43 | 13.92 | 13.14 | 13.40 | 3.73 |
| HSP7C_MOUSE | 0.000191 | 19.22 | 19.02 | 18.99 | 17.98 | 17.88 | 17.86 | 3.72 |
| ALDOA_MOUSE | 0.000206 | 18.40 | 18.48 | 18.51 | 17.48 | 17.40 | 17.39 | 3.69 |
| PP1G_MOUSE | 0.000222 | 16.26 | 16.32 | 16.27 | 15.30 | 15.05 | 15.16 | 3.65 |
| PP1A_MOUSE | 0.000222 | 16.26 | 16.32 | 16.27 | 15.30 | 15.05 | 15.16 | 3.65 |
| PSMD5_MOUSE | 0.000233 | 15.59 | 15.92 | 15.73 | 14.00 | 14.46 | 14.11 | 3.63 |
| PROF1_MOUSE | 0.000243 | 20.22 | 19.93 | 19.78 | 18.46 | 18.31 | 18.66 | 3.61 |
| XPO2_MOUSE | 0.000262 | 12.68 | 12.49 | 12.25 | 10.12 | 10.52 | 9.52 | 3.58 |
| LMNA_MOUSE | 0.00027 | 16.59 | 16.69 | 16.44 | 15.47 | 15.54 | 15.47 | 3.57 |
| TDRD1_MOUSE | 0.000295 | 13.59 | 13.62 | 13.36 | 15.73 | 15.45 | 14.98 | 3.53 |
| TIF1B_MOUSE | 0.000299 | 16.56 | 16.31 | 16.41 | 15.27 | 15.25 | 14.94 | 3.52 |
| RPN2_MOUSE | 0.000314 | 15.97 | 16.00 | 16.01 | 13.80 | 12.59 | 13.57 | 3.50 |
| HNRPU_MOUSE | 0.000319 | 17.21 | 17.24 | 17.36 | 14.85 | 15.72 | 15.38 | 3.50 |
| RL18A_MOUSE | 0.000329 | 14.71 | 14.44 | 14.93 | 13.18 | 12.89 | 13.32 | 3.48 |
| ERO1A_MOUSE | 0.000386 | 15.67 | 15.38 | 15.62 | 14.37 | 14.48 | 14.54 | 3.41 |
| TCPZ_MOUSE | 0.000399 | 16.61 | 16.71 | 16.55 | 14.43 | 14.60 | 13.47 | 3.40 |
| SCMC1_MOUSE | 0.00041 | 14.28 | 14.38 | 14.72 | 13.11 | 13.18 | 12.81 | 3.39 |
| TM183_MOUSE | 0.00044 | 15.32 | 15.38 | 15.66 | 16.48 | 16.56 | 16.60 | 3.36 |
| HSP74_MOUSE | 0.000448 | 15.18 | 15.18 | 15.29 | 13.44 | 13.68 | 14.09 | 3.35 |
| SMD1_MOUSE | 0.000461 | 16.87 | 16.91 | 17.00 | 15.65 | 15.81 | 16.02 | 3.34 |
| CH10_MOUSE | 0.000468 | 16.69 | 16.69 | 16.73 | 15.41 | 15.80 | 15.57 | 3.33 |
| UGDH_MOUSE | 0.000477 | 14.07 | 14.57 | 13.84 | 11.66 | 10.55 | 11.72 | 3.32 |
| CAP1_MOUSE | 0.000498 | 16.30 | 16.31 | 16.47 | 14.58 | 15.23 | 14.87 | 3.30 |
| ENPL_MOUSE | 0.000579 | 18.40 | 18.37 | 18.66 | 17.38 | 17.53 | 17.48 | 3.24 |
| K1C10_MOUSE | 0.000616 | 19.19 | 18.83 | 19.03 | 19.97 | 20.10 | 20.12 | 3.21 |
| 2AAB_MOUSE | 0.000622 | 16.25 | 16.35 | 16.31 | 15.06 | 15.08 | 15.45 | 3.21 |
| IF5A1_MOUSE | 0.000629 | 19.07 | 18.46 | 18.51 | 17.27 | 17.30 | 17.22 | 3.20 |
| GDIR1_MOUSE | 0.000645 | 18.34 | 18.29 | 18.31 | 17.37 | 17.53 | 17.51 | 3.19 |
| AATM_MOUSE | 0.000648 | 17.71 | 17.39 | 17.46 | 16.14 | 16.46 | 16.46 | 3.19 |
| RTN4_MOUSE | 0.000686 | 18.65 | 18.56 | 18.47 | 17.45 | 17.67 | 17.70 | 3.16 |
| IMA3_MOUSE | 0.000702 | 14.57 | 14.31 | 14.34 | 13.11 | 12.85 | 13.40 | 3.15 |
| VINC_MOUSE | 0.000715 | 15.15 | 15.11 | 15.34 | 14.37 | 14.18 | 14.12 | 3.15 |
| IPO9_MOUSE | 0.000716 | 13.49 | 13.79 | 13.48 | 9.63 | 10.70 | 11.33 | 3.15 |
| PTBP1_MOUSE | 0.000751 | 16.80 | 16.77 | 16.35 | 15.15 | 15.03 | 14.37 | 3.12 |
| TCPE_MOUSE | 0.000793 | 15.29 | 15.48 | 15.26 | 12.43 | 13.52 | 13.49 | 3.10 |
| ROA2_MOUSE | 0.000823 | 17.53 | 17.74 | 17.68 | 16.65 | 16.82 | 16.47 | 3.08 |
| DYH17_MOUSE | 0.000832 | 15.79 | 15.55 | 16.03 | 16.81 | 17.02 | 17.08 | 3.08 |
| CLH1_MOUSE | 0.000871 | 16.53 | 16.87 | 16.48 | 15.33 | 15.18 | 14.61 | 3.06 |
| PDIA6_MOUSE | 0.0009 | 17.40 | 17.61 | 17.45 | 16.51 | 16.69 | 16.65 | 3.05 |
| TCPH_MOUSE | 0.000902 | 15.71 | 15.81 | 15.83 | 14.01 | 14.55 | 14.69 | 3.04 |
| TSN_MOUSE | 0.000904 | 13.78 | 14.16 | 13.83 | 12.71 | 12.19 | 11.89 | 3.04 |
| BIP_MOUSE | 0.000924 | 19.73 | 19.42 | 19.53 | 18.43 | 18.63 | 18.67 | 3.03 |
| ARP2_MOUSE | 0.000936 | 13.07 | 13.22 | 12.74 | 11.18 | 9.70 | 10.44 | 3.03 |
| AP2B1_MOUSE | 0.000944 | 13.83 | 13.51 | 14.01 | 12.35 | 11.43 | 11.32 | 3.02 |
| DDX3X_MOUSE | 0.001 | 14.39 | 14.57 | 14.65 | 13.03 | 11.91 | 12.73 | 3.00 |
| ALBU_MOUSE | 0.001032 | 17.91 | 17.81 | 17.73 | 16.88 | 17.06 | 17.03 | 2.99 |
| RSSA_MOUSE | 0.001081 | 18.25 | 18.16 | 18.23 | 17.10 | 17.49 | 17.15 | 2.97 |
| 2AAA_MOUSE | 0.001131 | 16.75 | 16.82 | 16.86 | 15.95 | 16.02 | 16.14 | 2.95 |
| CATB_MOUSE | 0.001131 | 15.43 | 15.32 | 15.81 | 14.43 | 14.49 | 14.20 | 2.95 |
| NNRE_MOUSE | 0.001157 | 11.06 | 10.70 | 11.31 | 9.55 | 9.59 | 9.94 | 2.94 |
| TBB2B_MOUSE | 0.001168 | 18.07 | 17.91 | 18.20 | 17.23 | 17.25 | 17.22 | 2.93 |
| TBB2A_MOUSE | 0.001168 | 18.07 | 17.91 | 18.20 | 17.23 | 17.25 | 17.22 | 2.93 |
| ACTN4_MOUSE | 0.001328 | 17.08 | 16.94 | 17.30 | 16.31 | 16.09 | 16.14 | 2.88 |
| ERO1B_MOUSE | 0.001349 | 14.30 | 13.93 | 14.27 | 12.28 | 12.63 | 13.09 | 2.87 |
| 6PGL_MOUSE | 0.001531 | 15.37 | 15.81 | 15.86 | 14.54 | 14.71 | 14.65 | 2.81 |
| RAP1B_MOUSE | 0.001542 | 15.48 | 15.07 | 15.33 | 14.30 | 13.64 | 14.04 | 2.81 |
| RAP1A_MOUSE | 0.001542 | 15.48 | 15.07 | 15.33 | 14.30 | 13.64 | 14.04 | 2.81 |
| ANXA6_MOUSE | 0.001692 | 16.80 | 16.23 | 16.23 | 15.02 | 15.16 | 15.38 | 2.77 |
| S10AB_MOUSE | 0.001703 | 13.22 | 13.31 | 14.28 | 15.26 | 15.56 | 15.45 | 2.77 |
| PPIB_MOUSE | 0.001762 | 15.44 | 15.65 | 15.39 | 14.45 | 14.78 | 14.62 | 2.75 |
| H14_MOUSE | 0.00179 | 17.02 | 16.91 | 17.20 | 17.87 | 18.00 | 17.75 | 2.75 |
| API5_MOUSE | 0.001801 | 14.71 | 14.07 | 14.21 | 12.94 | 13.28 | 13.09 | 2.74 |
| MDGA1_MOUSE | 0.001891 | 19.07 | 18.32 | 17.69 | 16.43 | 15.32 | 15.80 | 2.72 |
| SRPRA_MOUSE | 0.001922 | 13.29 | 12.49 | 12.48 | 10.53 | 11.16 | 9.90 | 2.72 |
| FKB1A_MOUSE | 0.001939 | 13.86 | 13.87 | 14.02 | 13.22 | 12.72 | 12.76 | 2.71 |
| CDC42_MOUSE | 0.001946 | 17.24 | 17.13 | 17.09 | 14.77 | 15.74 | 15.80 | 2.71 |
| FAS_MOUSE | 0.002116 | 13.77 | 13.67 | 14.08 | 10.58 | 12.16 | 11.74 | 2.67 |
| PLAK_MOUSE | 0.002129 | 14.54 | 14.51 | 14.25 | 13.56 | 13.25 | 12.85 | 2.67 |
| MDHM_MOUSE | 0.002326 | 20.02 | 20.21 | 20.00 | 19.18 | 19.44 | 19.34 | 2.63 |
| ANXA1_MOUSE | 0.002341 | 16.96 | 16.78 | 17.14 | 15.77 | 16.14 | 16.13 | 2.63 |
| PLCB1_MOUSE | 0.002343 | 17.38 | 17.61 | 17.54 | 16.79 | 16.68 | 16.88 | 2.63 |
| KAP0_MOUSE | 0.002469 | 13.88 | 14.01 | 13.80 | 12.76 | 11.66 | 12.46 | 2.61 |
| RAGP1_MOUSE | 0.00262 | 14.51 | 14.81 | 14.25 | 13.50 | 12.75 | 12.53 | 2.58 |
| BIRC2_MOUSE | 0.002678 | 16.61 | 15.81 | 16.19 | 17.24 | 17.66 | 17.66 | 2.57 |
| MOES_MOUSE | 0.002759 | 15.45 | 15.26 | 15.56 | 13.43 | 14.44 | 13.37 | 2.56 |
| KAD2_MOUSE | 0.003069 | 13.79 | 14.07 | 13.67 | 12.41 | 12.90 | 11.92 | 2.51 |
| R51A1_MOUSE | 0.0031 | 12.95 | 13.00 | 13.56 | 11.02 | 12.05 | 11.58 | 2.51 |
| RS7_MOUSE | 0.003174 | 17.66 | 16.56 | 16.77 | 15.44 | 15.54 | 15.31 | 2.50 |
| RLA0_MOUSE | 0.0033 | 18.50 | 18.44 | 17.93 | 16.74 | 17.30 | 17.22 | 2.48 |
| K2C1_MOUSE | 0.003341 | 18.33 | 18.24 | 18.33 | 17.56 | 17.78 | 17.46 | 2.48 |
| SF3B1_MOUSE | 0.003346 | 12.56 | 13.20 | 12.99 | 10.58 | 9.66 | 11.43 | 2.48 |
| SON_MOUSE | 0.003363 | 15.63 | 16.38 | 16.05 | 14.59 | 15.01 | 14.28 | 2.47 |
| USO1_MOUSE | 0.003429 | 12.17 | 12.17 | 12.45 | 9.20 | 10.95 | 9.98 | 2.46 |
| IMB1_MOUSE | 0.003496 | 17.29 | 17.51 | 16.97 | 16.38 | 16.41 | 16.06 | 2.46 |
| S10A6_MOUSE | 0.003578 | 20.89 | 21.05 | 20.66 | 19.87 | 19.80 | 19.06 | 2.45 |
| PPIA_MOUSE | 0.003862 | 20.57 | 20.18 | 20.41 | 19.71 | 19.67 | 19.62 | 2.41 |
| RL14_MOUSE | 0.003872 | 16.09 | 15.94 | 15.68 | 14.82 | 14.68 | 15.23 | 2.41 |
| RS8_MOUSE | 0.003989 | 15.56 | 15.41 | 15.45 | 13.37 | 14.24 | 14.45 | 2.40 |
| PRDX1_MOUSE | 0.003992 | 18.09 | 18.49 | 18.10 | 17.08 | 17.53 | 16.93 | 2.40 |
| MBB1A_MOUSE | 0.00401 | 13.93 | 13.88 | 13.57 | 12.52 | 12.26 | 11.16 | 2.40 |
| EF1A1_MOUSE | 0.004196 | 18.52 | 18.47 | 18.60 | 17.73 | 18.02 | 17.90 | 2.38 |
| SEPT2_MOUSE | 0.004277 | 15.38 | 14.98 | 15.32 | 14.00 | 13.59 | 14.44 | 2.37 |
| ARF1_MOUSE | 0.004524 | 16.52 | 16.29 | 16.32 | 13.92 | 15.25 | 14.93 | 2.34 |
| ADK_MOUSE | 0.004525 | 14.30 | 14.42 | 14.35 | 12.92 | 13.04 | 13.73 | 2.34 |
| ATPK_MOUSE | 0.004911 | 16.16 | 15.57 | 14.97 | 13.98 | 14.08 | 14.28 | 2.31 |
| VDAC3_MOUSE | 0.004948 | 15.00 | 15.20 | 14.34 | 13.66 | 13.76 | 13.72 | 2.31 |
| RACK1_MOUSE | 0.005006 | 15.85 | 16.09 | 16.52 | 14.62 | 13.34 | 14.72 | 2.30 |
| VATL_MOUSE | 0.005044 | 14.01 | 14.17 | 13.35 | 12.02 | 11.46 | 9.83 | 2.30 |
| PRDX4_MOUSE | 0.005054 | 17.40 | 17.89 | 17.57 | 16.65 | 16.98 | 16.66 | 2.30 |
| NUCL_MOUSE | 0.005137 | 19.18 | 18.99 | 18.89 | 18.37 | 18.33 | 18.48 | 2.29 |
| SRP68_MOUSE | 0.00519 | 13.00 | 13.38 | 13.26 | 11.72 | 10.03 | 11.51 | 2.28 |
| 4F2_MOUSE | 0.005313 | 14.17 | 13.88 | 13.85 | 12.39 | 13.22 | 12.15 | 2.27 |
| RIC8B_MOUSE | 0.005318 | 14.21 | 14.14 | 14.62 | 10.00 | 12.37 | 11.96 | 2.27 |
| K1C14_MOUSE | 0.005548 | 14.01 | 14.36 | 12.72 | 15.38 | 16.00 | 15.93 | 2.26 |
| UBA6_MOUSE | 0.005564 | 11.49 | 11.66 | 10.14 | 9.14 | 9.39 | 9.00 | 2.25 |
| RL7A_MOUSE | 0.005709 | 15.36 | 15.63 | 14.99 | 14.33 | 14.52 | 14.49 | 2.24 |
| SAP_MOUSE | 0.006308 | 18.39 | 18.62 | 18.60 | 19.01 | 19.41 | 19.32 | 2.20 |
| MYL6_MOUSE | 0.006405 | 15.38 | 15.40 | 16.33 | 16.91 | 16.93 | 17.00 | 2.19 |
| GTR1_MOUSE | 0.006448 | 14.20 | 13.70 | 14.27 | 10.09 | 12.49 | 11.59 | 2.19 |
| CSN4_MOUSE | 0.006496 | 11.88 | 11.84 | 12.08 | 9.60 | 10.34 | 11.04 | 2.19 |
| UGGG1_MOUSE | 0.006589 | 12.08 | 13.06 | 13.32 | 10.28 | 11.08 | 11.42 | 2.18 |
| TCPD_MOUSE | 0.006742 | 14.59 | 14.85 | 14.80 | 14.23 | 13.67 | 13.94 | 2.17 |
| IMA7_MOUSE | 0.007097 | 12.27 | 12.58 | 12.13 | 9.33 | 11.25 | 10.13 | 2.15 |
| K1C13_MOUSE | 0.007257 | 17.30 | 16.66 | 16.85 | 17.75 | 17.99 | 17.70 | 2.14 |
| VDAC2_MOUSE | 0.007331 | 15.12 | 15.16 | 15.24 | 14.16 | 13.27 | 14.32 | 2.13 |
| GRP75_MOUSE | 0.007397 | 18.49 | 18.38 | 18.09 | 17.63 | 17.72 | 17.69 | 2.13 |
| HEAT3_MOUSE | 0.007572 | 12.46 | 11.35 | 12.59 | 10.59 | 10.68 | 10.72 | 2.12 |
| SMRC1_MOUSE | 0.007688 | 11.23 | 11.33 | 11.38 | 9.91 | 10.38 | 8.91 | 2.11 |
| CDK1_MOUSE | 0.007805 | 9.17 | 10.81 | 10.28 | 7.99 | 8.33 | 8.49 | 2.11 |
| AL7A1_MOUSE | 0.008283 | 14.00 | 13.86 | 13.60 | 10.32 | 12.37 | 12.01 | 2.08 |
| PGAM1_MOUSE | 0.008302 | 20.10 | 19.97 | 20.04 | 19.21 | 19.51 | 19.57 | 2.08 |
| ACON_MOUSE | 0.008378 | 14.44 | 14.12 | 13.91 | 11.95 | 10.17 | 12.61 | 2.08 |
| UB2D2_MOUSE | 0.008403 | 13.84 | 14.98 | 14.95 | 12.17 | 12.82 | 13.37 | 2.08 |
| UB2D3_MOUSE | 0.008403 | 13.84 | 14.98 | 14.95 | 12.17 | 12.82 | 13.37 | 2.08 |
| K1C42_MOUSE | 0.008429 | 15.76 | 16.13 | 15.29 | 16.58 | 17.00 | 17.44 | 2.07 |
| K22E_MOUSE | 0.008676 | 17.43 | 17.32 | 17.02 | 17.85 | 18.75 | 18.42 | 2.06 |
| DPY30_MOUSE | 0.009099 | 14.38 | 14.41 | 14.24 | 13.73 | 13.58 | 13.94 | 2.04 |
| CAND1_MOUSE | 0.009439 | 13.46 | 14.71 | 15.00 | 12.52 | 12.57 | 11.02 | 2.03 |
| PYRG1_MOUSE | 0.00988 | 13.91 | 14.16 | 13.52 | 11.86 | 10.76 | 12.78 | 2.01 |
| AT5G1_MOUSE | 0.010402 | 14.30 | 14.61 | 14.59 | 13.56 | 13.68 | 12.63 | 1.98 |
| AT5G3_MOUSE | 0.010402 | 14.30 | 14.61 | 14.59 | 13.56 | 13.68 | 12.63 | 1.98 |
| AT5G2_MOUSE | 0.010402 | 14.30 | 14.61 | 14.59 | 13.56 | 13.68 | 12.63 | 1.98 |
| TLN1_MOUSE | 0.010823 | 12.88 | 13.67 | 13.19 | 11.53 | 12.54 | 11.78 | 1.97 |
| HNRPL_MOUSE | 0.011041 | 14.09 | 14.70 | 14.00 | 12.95 | 13.54 | 12.50 | 1.96 |
| CKAP4_MOUSE | 0.011183 | 15.39 | 15.64 | 15.70 | 14.98 | 14.96 | 15.14 | 1.95 |
| RPN1_MOUSE | 0.011709 | 13.95 | 13.88 | 14.23 | 12.28 | 12.69 | 10.48 | 1.93 |
| PFKAL_MOUSE | 0.01242 | 14.66 | 15.33 | 14.61 | 13.56 | 12.54 | 13.92 | 1.91 |
| H13_MOUSE | 0.01257 | 17.64 | 17.48 | 17.53 | 18.10 | 18.20 | 17.90 | 1.90 |
| CSN7A_MOUSE | 0.012775 | 13.73 | 13.81 | 13.95 | 13.46 | 13.15 | 12.94 | 1.89 |
| LKHA4_MOUSE | 0.012846 | 12.57 | 12.89 | 11.55 | 9.83 | 11.25 | 9.36 | 1.89 |
| RLA2_MOUSE | 0.013592 | 19.15 | 19.23 | 19.07 | 18.41 | 18.77 | 18.66 | 1.87 |
| EIF3F_MOUSE | 0.01375 | 13.49 | 13.62 | 13.54 | 11.75 | 12.62 | 10.47 | 1.86 |
| C1QBP_MOUSE | 0.01467 | 15.43 | 15.09 | 15.42 | 14.74 | 13.61 | 13.23 | 1.83 |
| TAGL2_MOUSE | 0.0152 | 14.60 | 14.88 | 15.73 | 16.05 | 16.15 | 16.36 | 1.82 |
| DESP_MOUSE | 0.015762 | 13.61 | 12.78 | 12.85 | 11.29 | 12.42 | 11.54 | 1.80 |
| OTUB1_MOUSE | 0.019088 | 14.60 | 14.23 | 13.91 | 12.65 | 11.96 | 13.63 | 1.72 |
| CALX_MOUSE | 0.020499 | 16.20 | 15.75 | 16.00 | 15.51 | 15.44 | 15.45 | 1.69 |
| H12_MOUSE | 0.021046 | 16.68 | 16.42 | 16.57 | 16.88 | 17.14 | 17.05 | 1.68 |
| ATPG_MOUSE | 0.02109 | 14.11 | 13.07 | 13.84 | 10.70 | 12.56 | 9.07 | 1.68 |
| LAMP2_MOUSE | 0.021862 | 16.01 | 15.97 | 15.44 | 14.86 | 15.13 | 15.31 | 1.66 |
| PSA5_MOUSE | 0.022314 | 15.01 | 15.16 | 15.13 | 14.48 | 14.81 | 14.20 | 1.65 |
| TRY2_MOUSE | 0.022394 | 23.38 | 23.70 | 23.06 | 24.10 | 24.78 | 23.98 | 1.65 |
| TCPA_MOUSE | 0.023869 | 14.28 | 14.09 | 14.44 | 8.73 | 12.79 | 11.64 | 1.62 |
| RL12_MOUSE | 0.024021 | 15.04 | 14.26 | 14.99 | 14.18 | 13.84 | 13.44 | 1.62 |
| BASP1_MOUSE | 0.024344 | 14.75 | 14.62 | 14.68 | 14.39 | 14.03 | 14.27 | 1.61 |
| K1C19_MOUSE | 0.024816 | 20.16 | 20.03 | 20.09 | 20.34 | 20.63 | 20.70 | 1.61 |
| EF1D_MOUSE | 0.026795 | 15.14 | 15.40 | 15.53 | 13.81 | 14.69 | 14.81 | 1.57 |
| K2C4_MOUSE | 0.026904 | 16.58 | 16.50 | 16.10 | 17.07 | 20.58 | 20.30 | 1.57 |
| PRDX5_MOUSE | 0.028629 | 15.67 | 14.57 | 15.15 | 14.44 | 14.17 | 13.68 | 1.54 |
| THIO_MOUSE | 0.029175 | 17.68 | 17.83 | 17.73 | 17.41 | 17.43 | 17.31 | 1.53 |
| YBOX2_MOUSE | 0.029181 | 16.07 | 15.87 | 16.09 | 15.42 | 15.41 | 15.77 | 1.53 |
| YBOX3_MOUSE | 0.029181 | 16.07 | 15.87 | 16.09 | 15.42 | 15.41 | 15.77 | 1.53 |
| TOM20_MOUSE | 0.030869 | 13.51 | 12.89 | 13.21 | 12.85 | 12.20 | 11.86 | 1.51 |
| CH60_MOUSE | 0.031589 | 18.43 | 18.23 | 18.18 | 17.81 | 17.99 | 17.84 | 1.50 |
| CD63_MOUSE | 0.03168 | 13.65 | 13.30 | 13.68 | 13.86 | 14.66 | 15.15 | 1.50 |
| K2C8_MOUSE | 0.03168 | 17.18 | 16.87 | 17.34 | 16.74 | 16.58 | 16.62 | 1.50 |
| TPIS_MOUSE | 0.031746 | 18.13 | 18.18 | 18.42 | 18.56 | 18.80 | 18.66 | 1.50 |
| SODC_MOUSE | 0.033924 | 16.50 | 16.81 | 17.01 | 16.47 | 15.51 | 15.88 | 1.47 |
| SYAC_MOUSE | 0.034719 | 14.61 | 14.49 | 14.41 | 14.20 | 12.04 | 12.45 | 1.46 |
| SMU1_MOUSE | 0.036374 | 12.11 | 11.53 | 11.24 | 0.00 | 10.41 | 0.00 | 1.44 |
| C1TM_MOUSE | 0.036422 | 12.82 | 13.00 | 13.37 | 11.36 | 8.63 | 11.91 | 1.44 |
| ARF4_MOUSE | 0.036656 | 16.11 | 15.77 | 15.77 | 11.12 | 14.59 | 14.17 | 1.44 |
| ANXA5_MOUSE | 0.036715 | 19.32 | 19.28 | 19.18 | 18.85 | 18.98 | 18.45 | 1.44 |
| PARK7_MOUSE | 0.037258 | 13.64 | 14.02 | 13.39 | 12.77 | 13.09 | 11.55 | 1.43 |
| P4HA1_MOUSE | 0.037299 | 14.18 | 14.14 | 14.57 | 13.57 | 14.02 | 13.65 | 1.43 |
| THIKA_MOUSE | 0.037977 | 13.61 | 13.17 | 13.46 | 12.23 | 8.06 | 11.17 | 1.42 |
| MTAP_MOUSE | 0.038542 | 15.04 | 14.85 | 14.92 | 14.72 | 14.39 | 14.51 | 1.41 |
| THIC_MOUSE | 0.038635 | 10.87 | 11.76 | 11.13 | 10.35 | 10.69 | 10.57 | 1.41 |
| LAP2B_MOUSE | 0.039043 | 14.57 | 14.75 | 14.52 | 14.24 | 14.14 | 14.35 | 1.41 |
| NU155_MOUSE | 0.039897 | 12.47 | 11.90 | 10.75 | 10.88 | 10.26 | 9.88 | 1.40 |
| TKT_MOUSE | 0.039985 | 13.72 | 14.07 | 13.84 | 12.88 | 10.86 | 13.00 | 1.40 |
| CO1A1_MOUSE | 0.040121 | 13.56 | 13.79 | 12.40 | 11.31 | 12.66 | 11.63 | 1.40 |
| CAPZB_MOUSE | 0.040224 | 14.17 | 14.21 | 13.87 | 10.09 | 13.29 | 12.32 | 1.40 |
| VDAC1_MOUSE | 0.042968 | 17.38 | 16.30 | 17.24 | 16.26 | 16.19 | 15.97 | 1.37 |
| NP1L1_MOUSE | 0.043459 | 16.89 | 17.08 | 17.00 | 16.56 | 16.77 | 16.57 | 1.36 |
| TSSK5_MOUSE | 0.044033 | 16.69 | 16.56 | 16.64 | 0.00 | 11.28 | 12.35 | 1.36 |
| PEBP1_MOUSE | 0.044407 | 16.86 | 16.87 | 17.32 | 16.39 | 16.63 | 16.60 | 1.35 |
| H4_MOUSE | 0.044792 | 18.83 | 19.42 | 18.62 | 17.86 | 18.65 | 17.62 | 1.35 |
| NPM_MOUSE | 0.049164 | 16.09 | 15.74 | 16.14 | 16.16 | 16.87 | 17.01 | 1.31 |
| EF1B_MOUSE | 0.04968 | 16.12 | 16.36 | 16.28 | 15.74 | 15.48 | 16.08 | 1.30 |
| PSD13_MOUSE | 0.051249 | 11.93 | 11.08 | 11.28 | 10.38 | 11.13 | 10.10 | 1.29 |
| PAIRB_MOUSE | 0.05299 | 15.41 | 15.12 | 15.11 | 15.45 | 15.65 | 15.68 | 1.28 |
| PLEC_MOUSE | 0.05689 | 13.93 | 14.45 | 14.22 | 13.50 | 12.90 | 10.57 | 1.24 |
| H2B1K_MOUSE | 0.058515 | 12.26 | 12.50 | 13.57 | 10.16 | 12.41 | 11.01 | 1.23 |
| H2B1C_MOUSE | 0.058515 | 12.26 | 12.50 | 13.57 | 10.16 | 12.41 | 11.01 | 1.23 |
| H2B1H_MOUSE | 0.058515 | 12.26 | 12.50 | 13.57 | 10.16 | 12.41 | 11.01 | 1.23 |
| H2B1F_MOUSE | 0.058515 | 12.26 | 12.50 | 13.57 | 10.16 | 12.41 | 11.01 | 1.23 |
| H2B3B_MOUSE | 0.058515 | 12.26 | 12.50 | 13.57 | 10.16 | 12.41 | 11.01 | 1.23 |
| H2B3A_MOUSE | 0.058515 | 12.26 | 12.50 | 13.57 | 10.16 | 12.41 | 11.01 | 1.23 |
| H2B1P_MOUSE | 0.058515 | 12.26 | 12.50 | 13.57 | 10.16 | 12.41 | 11.01 | 1.23 |
| H2B2B_MOUSE | 0.058515 | 12.26 | 12.50 | 13.57 | 10.16 | 12.41 | 11.01 | 1.23 |
| H2B2E_MOUSE | 0.058515 | 12.26 | 12.50 | 13.57 | 10.16 | 12.41 | 11.01 | 1.23 |
| H2B1B_MOUSE | 0.058515 | 12.26 | 12.50 | 13.57 | 10.16 | 12.41 | 11.01 | 1.23 |
| H2B1M_MOUSE | 0.058515 | 12.26 | 12.50 | 13.57 | 10.16 | 12.41 | 11.01 | 1.23 |
| HNRPK_MOUSE | 0.060011 | 18.52 | 18.54 | 18.47 | 17.59 | 18.44 | 17.70 | 1.22 |
| KLC4_MOUSE | 0.060749 | 12.56 | 0.00 | 14.57 | 17.84 | 17.96 | 18.79 | 1.22 |
| 1433Z_MOUSE | 0.061261 | 18.97 | 19.31 | 19.48 | 18.83 | 18.90 | 18.83 | 1.21 |
| GSHR_MOUSE | 0.067255 | 11.26 | 11.97 | 11.15 | 11.44 | 8.39 | 8.57 | 1.17 |
| RS23_MOUSE | 0.067883 | 14.28 | 13.20 | 14.33 | 13.23 | 12.76 | 13.34 | 1.17 |
| IF4B_MOUSE | 0.069049 | 14.02 | 14.03 | 13.57 | 13.24 | 13.33 | 11.59 | 1.16 |
| CALM3_MOUSE | 0.069229 | 18.81 | 18.84 | 18.56 | 18.90 | 19.25 | 19.72 | 1.16 |
| CALM2_MOUSE | 0.069229 | 18.81 | 18.84 | 18.56 | 18.90 | 19.25 | 19.72 | 1.16 |
| CALM1_MOUSE | 0.069229 | 18.81 | 18.84 | 18.56 | 18.90 | 19.25 | 19.72 | 1.16 |
| ATP5J_MOUSE | 0.072899 | 13.97 | 14.29 | 14.26 | 13.62 | 13.68 | 14.03 | 1.14 |
| COPG1_MOUSE | 0.074631 | 14.63 | 14.90 | 14.06 | 12.58 | 14.17 | 13.74 | 1.13 |
| CPNE1_MOUSE | 0.07629 | 9.39 | 10.50 | 11.33 | 9.91 | 8.84 | 8.39 | 1.12 |
| RAB1B_MOUSE | 0.077103 | 15.28 | 14.29 | 14.56 | 13.56 | 14.43 | 13.86 | 1.11 |
| RAB1A_MOUSE | 0.077103 | 15.28 | 14.29 | 14.56 | 13.56 | 14.43 | 13.86 | 1.11 |
| PCNA_MOUSE | 0.077431 | 14.30 | 12.74 | 13.33 | 12.28 | 11.76 | 13.01 | 1.11 |
| RBBP7_MOUSE | 0.077454 | 13.35 | 15.62 | 15.59 | 15.96 | 16.83 | 16.23 | 1.11 |
| RBBP4_MOUSE | 0.077454 | 13.35 | 15.62 | 15.59 | 15.96 | 16.83 | 16.23 | 1.11 |
| H2AV_MOUSE | 0.07878 | 18.16 | 18.27 | 18.00 | 17.72 | 17.79 | 17.97 | 1.10 |
| H2AZ_MOUSE | 0.07878 | 18.16 | 18.27 | 18.00 | 17.72 | 17.79 | 17.97 | 1.10 |
| AN32A_MOUSE | 0.09057 | 19.92 | 19.71 | 19.91 | 20.11 | 20.81 | 20.08 | 1.04 |
| K2C5_MOUSE | 0.090801 | 18.63 | 18.91 | 18.73 | 17.67 | 18.00 | 18.75 | 1.04 |
| TEBP_MOUSE | 0.092832 | 14.31 | 14.27 | 14.67 | 14.25 | 13.87 | 14.03 | 1.03 |
| AN32B_MOUSE | 0.094555 | 19.89 | 19.70 | 19.87 | 20.08 | 20.79 | 20.05 | 1.02 |
| G3P_MOUSE | 0.097292 | 19.35 | 19.40 | 19.66 | 17.89 | 19.16 | 19.09 | 1.01 |
| LRC59_MOUSE | 0.097584 | 14.27 | 15.08 | 14.15 | 14.70 | 15.56 | 15.31 | 1.01 |
| XPO1_MOUSE | 0.099533 | 13.56 | 13.24 | 13.89 | 13.07 | 13.38 | 12.77 | 1.00 |
| UBE2N_MOUSE | 0.100923 | 15.22 | 14.93 | 14.57 | 14.29 | 13.85 | 14.79 | 1.00 |
| RS3A_MOUSE | 0.103532 | 16.06 | 15.61 | 15.98 | 11.72 | 15.25 | 14.96 | 0.98 |
| CNBP_MOUSE | 0.103689 | 12.35 | 14.37 | 14.12 | 15.04 | 14.54 | 14.59 | 0.98 |
| PHB2_MOUSE | 0.104427 | 14.67 | 14.13 | 13.97 | 13.95 | 13.60 | 12.01 | 0.98 |
| SC61B_MOUSE | 0.106335 | 13.45 | 13.48 | 12.63 | 13.93 | 14.12 | 13.38 | 0.97 |
| P5CS_MOUSE | 0.108547 | 9.54 | 10.84 | 10.65 | 9.90 | 9.66 | 8.91 | 0.96 |
| LBH_MOUSE | 0.116272 | 14.11 | 13.63 | 12.91 | 13.96 | 14.14 | 14.49 | 0.93 |
| ML12B_MOUSE | 0.118359 | 17.10 | 16.86 | 16.90 | 17.04 | 17.58 | 17.28 | 0.93 |
| ENOA_MOUSE | 0.119211 | 19.91 | 19.66 | 19.75 | 19.97 | 20.15 | 19.97 | 0.92 |
| RTRAF_MOUSE | 0.120351 | 9.09 | 10.08 | 9.42 | 9.90 | 10.19 | 10.06 | 0.92 |
| PLBL2_MOUSE | 0.125355 | 10.46 | 9.89 | 10.73 | 9.65 | 0.00 | 7.75 | 0.90 |
| K2C6B_MOUSE | 0.134139 | 18.83 | 19.04 | 18.86 | 17.95 | 18.42 | 18.93 | 0.87 |
| K2C6A_MOUSE | 0.134139 | 18.83 | 19.04 | 18.86 | 17.95 | 18.42 | 18.93 | 0.87 |
| K2C75_MOUSE | 0.134139 | 18.83 | 19.04 | 18.86 | 17.95 | 18.42 | 18.93 | 0.87 |
| RINI_MOUSE | 0.135641 | 10.54 | 13.30 | 12.66 | 8.46 | 11.63 | 10.75 | 0.87 |
| TOM70_MOUSE | 0.136482 | 8.39 | 10.68 | 11.45 | 12.25 | 12.00 | 10.84 | 0.86 |
| NDKA_MOUSE | 0.137404 | 15.14 | 15.82 | 16.17 | 16.20 | 16.09 | 16.32 | 0.86 |
| K1C12_MOUSE | 0.138179 | 14.33 | 12.40 | 13.09 | 11.04 | 9.90 | 13.51 | 0.86 |
| GRM7_MOUSE | 0.144146 | 11.24 | 12.54 | 12.50 | 9.36 | 11.47 | 0.00 | 0.84 |
| RL40_MOUSE | 0.147393 | 19.31 | 18.88 | 18.98 | 18.04 | 18.14 | 19.20 | 0.83 |
| RS27A_MOUSE | 0.147393 | 19.31 | 18.88 | 18.98 | 18.04 | 18.14 | 19.20 | 0.83 |
| UBC_MOUSE | 0.147393 | 19.31 | 18.88 | 18.98 | 18.04 | 18.14 | 19.20 | 0.83 |
| UBB_MOUSE | 0.147393 | 19.31 | 18.88 | 18.98 | 18.04 | 18.14 | 19.20 | 0.83 |
| M21_MPV15 | 0.148508 | 8.24 | 15.22 | 15.12 | 16.19 | 16.17 | 16.15 | 0.83 |
| NAA15_MOUSE | 0.150828 | 13.48 | 13.36 | 12.60 | 13.06 | 12.46 | 11.03 | 0.82 |
| RS14_MOUSE | 0.151861 | 14.26 | 15.89 | 16.28 | 14.67 | 14.50 | 14.57 | 0.82 |
| PDIA3_MOUSE | 0.153504 | 15.84 | 16.03 | 15.35 | 15.16 | 15.70 | 14.97 | 0.81 |
| EF1G_MOUSE | 0.156411 | 13.27 | 13.92 | 13.27 | 13.39 | 13.03 | 12.04 | 0.81 |
| LEG1_MOUSE | 0.1623 | 18.70 | 18.71 | 18.85 | 18.59 | 19.60 | 19.56 | 0.79 |
| PGRC1_MOUSE | 0.163353 | 14.32 | 14.37 | 13.93 | 14.08 | 13.96 | 13.18 | 0.79 |
| ECI1_MOUSE | 0.163424 | 11.09 | 12.41 | 11.78 | 11.44 | 10.80 | 11.21 | 0.79 |
| YBOX1_MOUSE | 0.164124 | 16.68 | 15.95 | 16.70 | 15.46 | 16.04 | 16.29 | 0.78 |
| NACA_MOUSE | 0.164437 | 14.53 | 14.47 | 14.50 | 14.01 | 13.06 | 14.55 | 0.78 |
| NACAM_MOUSE | 0.164437 | 14.53 | 14.47 | 14.50 | 14.01 | 13.06 | 14.55 | 0.78 |
| CNPY2_MOUSE | 0.17626 | 12.46 | 12.99 | 10.04 | 13.61 | 13.63 | 12.29 | 0.75 |
| RS25_MOUSE | 0.183649 | 14.17 | 15.71 | 15.46 | 15.74 | 16.79 | 15.35 | 0.74 |
| ERD21_MOUSE | 0.186208 | 13.46 | 13.59 | 12.78 | 14.44 | 13.81 | 13.28 | 0.73 |
| PSMD7_MOUSE | 0.187718 | 12.96 | 13.17 | 10.64 | 11.64 | 9.38 | 11.52 | 0.73 |
| 1433T_MOUSE | 0.192931 | 14.35 | 17.16 | 17.25 | 17.07 | 17.93 | 17.52 | 0.71 |
| AIMP2_MOUSE | 0.19423 | 10.62 | 11.43 | 10.63 | 10.92 | 9.42 | 10.34 | 0.71 |
| 1433F_MOUSE | 0.201946 | 10.88 | 16.87 | 16.97 | 16.94 | 17.85 | 17.47 | 0.69 |
| SCOT1_MOUSE | 0.206602 | 13.33 | 15.39 | 15.53 | 13.71 | 12.49 | 14.59 | 0.68 |
| 1433B_MOUSE | 0.2371 | 15.42 | 17.34 | 17.39 | 17.11 | 17.88 | 17.52 | 0.63 |
| NPHP3_MOUSE | 0.243422 | 15.80 | 15.77 | 14.74 | 13.76 | 15.10 | 15.37 | 0.61 |
| RL30_MOUSE | 0.247419 | 17.16 | 15.05 | 17.18 | 15.81 | 15.95 | 15.10 | 0.61 |
| ELOV5_MOUSE | 0.258405 | 13.97 | 13.78 | 13.99 | 13.88 | 13.83 | 12.76 | 0.59 |
| NPC2_MOUSE | 0.259318 | 11.08 | 11.64 | 12.19 | 11.76 | 10.87 | 10.79 | 0.59 |
| DNPEP_MOUSE | 0.264156 | 13.89 | 11.40 | 13.97 | 13.04 | 9.50 | 12.33 | 0.58 |
| ARSA_MOUSE | 0.264454 | 13.47 | 10.82 | 11.47 | 10.86 | 11.57 | 10.60 | 0.58 |
| TPM3_MOUSE | 0.266344 | 17.81 | 17.98 | 17.64 | 18.06 | 18.04 | 17.89 | 0.57 |
| RS5_MOUSE | 0.266611 | 17.31 | 17.41 | 17.23 | 17.32 | 17.65 | 17.53 | 0.57 |
| RS13_MOUSE | 0.285418 | 13.47 | 14.36 | 13.52 | 12.41 | 13.83 | 13.49 | 0.54 |
| PUR9_MOUSE | 0.285772 | 10.00 | 8.60 | 10.64 | 9.62 | 8.78 | 8.79 | 0.54 |
| PTK6_MOUSE | 0.28915 | 0.00 | 0.00 | 0.00 | 0.00 | 0.00 | 9.70 | 0.54 |
| K2C79_MOUSE | 0.289352 | 18.86 | 19.12 | 18.84 | 18.83 | 19.52 | 19.25 | 0.54 |
| K2C7_MOUSE | 0.292854 | 15.60 | 15.21 | 15.45 | 15.42 | 15.55 | 16.08 | 0.53 |
| GFAP_MOUSE | 0.292854 | 15.60 | 15.21 | 15.45 | 15.42 | 15.55 | 16.08 | 0.53 |
| KRT85_MOUSE | 0.292854 | 15.60 | 15.21 | 15.45 | 15.42 | 15.55 | 16.08 | 0.53 |
| VATE1_MOUSE | 0.298284 | 12.38 | 12.47 | 12.01 | 12.23 | 12.30 | 10.48 | 0.53 |
| UNC79_MOUSE | 0.301243 | 9.70 | 11.27 | 0.00 | 10.56 | 10.17 | 10.54 | 0.52 |
| TPM1_MOUSE | 0.310726 | 17.63 | 17.77 | 17.32 | 17.80 | 17.70 | 17.76 | 0.51 |
| ROAA_MOUSE | 0.312399 | 17.53 | 17.26 | 17.46 | 17.13 | 17.28 | 17.35 | 0.51 |
| TCPQ_MOUSE | 0.328145 | 14.84 | 13.00 | 14.61 | 12.67 | 13.87 | 13.94 | 0.48 |
| IPO4_MOUSE | 0.330746 | 10.94 | 12.57 | 12.78 | 11.74 | 11.10 | 11.72 | 0.48 |
| RB11A_MOUSE | 0.332879 | 12.52 | 12.83 | 10.92 | 11.77 | 11.88 | 10.66 | 0.48 |
| FUS_MOUSE | 0.334276 | 14.99 | 14.25 | 14.38 | 14.36 | 14.39 | 14.12 | 0.48 |
| RL9_MOUSE | 0.335137 | 11.52 | 14.10 | 14.36 | 11.45 | 12.84 | 12.90 | 0.47 |
| PSME2_MOUSE | 0.345432 | 10.59 | 12.14 | 12.92 | 12.12 | 12.94 | 12.54 | 0.46 |
| RL22_MOUSE | 0.356258 | 14.62 | 15.45 | 14.44 | 14.52 | 14.64 | 14.47 | 0.45 |
| H2AX_MOUSE | 0.363435 | 19.34 | 19.36 | 18.97 | 19.20 | 19.02 | 18.95 | 0.44 |
| PGK1_MOUSE | 0.365098 | 17.57 | 17.47 | 17.76 | 17.39 | 17.38 | 17.60 | 0.44 |
| ACTB_MOUSE | 0.372193 | 16.23 | 17.58 | 17.39 | 16.60 | 17.10 | 16.23 | 0.43 |
| RS15_MOUSE | 0.373532 | 8.56 | 11.70 | 9.45 | 11.67 | 9.21 | 12.03 | 0.43 |
| H2A2B_MOUSE | 0.375984 | 19.31 | 19.32 | 18.93 | 19.14 | 18.99 | 18.94 | 0.42 |
| TCTP_MOUSE | 0.389556 | 15.70 | 16.11 | 16.01 | 16.15 | 15.85 | 16.41 | 0.41 |
| K2C73_MOUSE | 0.394735 | 17.48 | 17.28 | 17.24 | 17.18 | 16.86 | 17.43 | 0.40 |
| 1433G_MOUSE | 0.397852 | 16.37 | 17.70 | 17.82 | 17.36 | 18.05 | 17.71 | 0.40 |
| NDKB_MOUSE | 0.400574 | 15.12 | 15.57 | 15.59 | 15.81 | 15.35 | 15.69 | 0.40 |
| RLA1_MOUSE | 0.409863 | 18.51 | 18.47 | 18.84 | 18.63 | 18.76 | 18.85 | 0.39 |
| ABCE1_MOUSE | 0.411465 | 14.21 | 12.17 | 14.39 | 13.79 | 11.70 | 13.11 | 0.39 |
| PUR4_MOUSE | 0.415174 | 13.27 | 13.77 | 12.35 | 13.18 | 13.17 | 11.32 | 0.38 |
| H2AJ_MOUSE | 0.419493 | 19.30 | 19.32 | 18.91 | 19.17 | 18.99 | 18.92 | 0.38 |
| H2A1K_MOUSE | 0.419493 | 19.30 | 19.32 | 18.91 | 19.17 | 18.99 | 18.92 | 0.38 |
| H2A1H_MOUSE | 0.419493 | 19.30 | 19.32 | 18.91 | 19.17 | 18.99 | 18.92 | 0.38 |
| H2A1F_MOUSE | 0.419493 | 19.30 | 19.32 | 18.91 | 19.17 | 18.99 | 18.92 | 0.38 |
| H2A3_MOUSE | 0.419493 | 19.30 | 19.32 | 18.91 | 19.17 | 18.99 | 18.92 | 0.38 |
| H2A1P_MOUSE | 0.419493 | 19.30 | 19.32 | 18.91 | 19.17 | 18.99 | 18.92 | 0.38 |
| H2A1O_MOUSE | 0.419493 | 19.30 | 19.32 | 18.91 | 19.17 | 18.99 | 18.92 | 0.38 |
| H2A1N_MOUSE | 0.419493 | 19.30 | 19.32 | 18.91 | 19.17 | 18.99 | 18.92 | 0.38 |
| H2A1I_MOUSE | 0.419493 | 19.30 | 19.32 | 18.91 | 19.17 | 18.99 | 18.92 | 0.38 |
| H2A1G_MOUSE | 0.419493 | 19.30 | 19.32 | 18.91 | 19.17 | 18.99 | 18.92 | 0.38 |
| H2A1E_MOUSE | 0.419493 | 19.30 | 19.32 | 18.91 | 19.17 | 18.99 | 18.92 | 0.38 |
| H2A1D_MOUSE | 0.419493 | 19.30 | 19.32 | 18.91 | 19.17 | 18.99 | 18.92 | 0.38 |
| H2A1C_MOUSE | 0.419493 | 19.30 | 19.32 | 18.91 | 19.17 | 18.99 | 18.92 | 0.38 |
| H2A1B_MOUSE | 0.419493 | 19.30 | 19.32 | 18.91 | 19.17 | 18.99 | 18.92 | 0.38 |
| H2A2A_MOUSE | 0.436243 | 19.27 | 19.28 | 18.86 | 19.11 | 18.96 | 18.91 | 0.36 |
| H2A2C_MOUSE | 0.436243 | 19.27 | 19.28 | 18.86 | 19.11 | 18.96 | 18.91 | 0.36 |
| RS17_MOUSE | 0.439512 | 13.88 | 10.54 | 13.59 | 13.79 | 12.66 | 14.01 | 0.36 |
| LYAG_MOUSE | 0.450325 | 12.54 | 9.97 | 11.66 | 10.70 | 10.94 | 10.93 | 0.35 |
| THOC4_MOUSE | 0.462349 | 14.38 | 14.69 | 14.65 | 14.27 | 14.65 | 14.39 | 0.34 |
| ALRF2_MOUSE | 0.462349 | 14.38 | 14.69 | 14.65 | 14.27 | 14.65 | 14.39 | 0.34 |
| NDUA4_MOUSE | 0.471139 | 13.69 | 12.04 | 13.71 | 12.39 | 12.33 | 13.40 | 0.33 |
| AT5F1_MOUSE | 0.482549 | 16.29 | 12.89 | 14.77 | 12.77 | 14.33 | 14.64 | 0.32 |
| RM12_MOUSE | 0.506745 | 13.70 | 13.65 | 12.79 | 13.52 | 13.33 | 12.46 | 0.30 |
| RCN2_MOUSE | 0.518016 | 14.14 | 13.87 | 13.66 | 13.93 | 13.85 | 14.32 | 0.29 |
| RS10_MOUSE | 0.52846 | 11.58 | 14.25 | 14.08 | 12.52 | 13.43 | 12.35 | 0.28 |
| RL31_MOUSE | 0.540627 | 16.99 | 16.90 | 15.24 | 15.88 | 16.37 | 15.86 | 0.27 |
| RS18_MOUSE | 0.556426 | 12.92 | 12.59 | 12.58 | 12.37 | 12.42 | 12.91 | 0.25 |
| TCEA1_MOUSE | 0.565193 | 12.59 | 14.22 | 13.07 | 13.90 | 10.80 | 13.47 | 0.25 |
| TMED9_MOUSE | 0.58254 | 12.07 | 12.94 | 9.11 | 13.17 | 11.80 | 11.11 | 0.23 |
| GSTP2_MOUSE | 0.589048 | 16.49 | 14.57 | 15.66 | 15.38 | 15.37 | 15.13 | 0.23 |
| GSTP1_MOUSE | 0.589048 | 16.49 | 14.57 | 15.66 | 15.38 | 15.37 | 15.13 | 0.23 |
| SKP1_MOUSE | 0.610602 | 12.96 | 15.48 | 15.74 | 15.01 | 15.06 | 15.35 | 0.21 |
| QCR2_MOUSE | 0.618647 | 10.32 | 9.89 | 11.16 | 11.05 | 9.97 | 9.53 | 0.21 |
| AQP1_MOUSE | 0.642568 | 8.72 | 9.75 | 11.31 | 9.64 | 11.31 | 9.98 | 0.19 |
| MTPN_MOUSE | 0.674227 | 13.79 | 14.86 | 14.62 | 14.51 | 14.60 | 13.64 | 0.17 |
| ARL1_MOUSE | 0.677382 | 14.41 | 13.58 | 14.00 | 14.95 | 14.22 | 13.41 | 0.17 |
| SCRB2_MOUSE | 0.678152 | 12.27 | 11.87 | 11.01 | 11.23 | 12.12 | 11.24 | 0.17 |
| K2C1B_MOUSE | 0.689647 | 18.32 | 18.49 | 18.36 | 18.23 | 18.37 | 18.80 | 0.16 |
| PTMA_MOUSE | 0.696432 | 21.09 | 21.06 | 21.09 | 21.06 | 21.37 | 20.99 | 0.16 |
| 1433E_MOUSE | 0.697313 | 18.88 | 19.57 | 19.80 | 19.17 | 19.76 | 18.90 | 0.16 |
| TPM4_MOUSE | 0.7118 | 19.25 | 19.19 | 18.96 | 18.93 | 19.47 | 19.23 | 0.15 |
| S10AA_MOUSE | 0.715815 | 12.43 | 14.11 | 14.26 | 13.96 | 13.71 | 13.74 | 0.15 |
| MARCS_MOUSE | 0.726697 | 14.39 | 14.24 | 13.95 | 14.54 | 14.64 | 13.72 | 0.14 |
| CAPR1_MOUSE | 0.731991 | 12.49 | 13.16 | 13.04 | 12.61 | 12.96 | 13.42 | 0.14 |
| SET_MOUSE | 0.745103 | 17.88 | 18.09 | 18.00 | 17.96 | 18.02 | 17.86 | 0.13 |
| PLP2_MOUSE | 0.748147 | 11.74 | 13.38 | 12.77 | 13.13 | 12.22 | 12.02 | 0.13 |
| ATPD_MOUSE | 0.758636 | 11.61 | 12.28 | 12.48 | 11.64 | 13.01 | 11.20 | 0.12 |
| PUSL1_MOUSE | 0.767776 | 10.10 | 12.69 | 12.69 | 9.81 | 11.75 | 12.92 | 0.11 |
| ACTY_MOUSE | 0.782008 | 11.23 | 13.96 | 14.26 | 13.44 | 13.43 | 13.30 | 0.11 |
| ACTZ_MOUSE | 0.782008 | 11.23 | 13.96 | 14.26 | 13.44 | 13.43 | 13.30 | 0.11 |
| DBF4A_MOUSE | 0.788214 | 12.57 | 0.00 | 0.00 | 0.00 | 0.00 | 17.81 | 0.10 |
| GPM6A_MOUSE | 0.809664 | 18.65 | 18.79 | 18.22 | 19.09 | 18.01 | 18.80 | 0.09 |
| PSME1_MOUSE | 0.842895 | 12.30 | 13.00 | 13.15 | 12.88 | 13.04 | 12.70 | 0.07 |
| COX41_MOUSE | 0.930115 | 11.07 | 14.37 | 14.74 | 12.28 | 13.97 | 13.62 | 0.03 |
| PP14B_MOUSE | 0.932589 | 12.48 | 12.62 | 12.40 | 12.41 | 12.79 | 12.25 | 0.03 |
| CO6A1_MOUSE | 0.945765 | 9.84 | 11.39 | 10.75 | 12.41 | 9.66 | 9.73 | 0.02 |
| CO1A2_MOUSE | 0.94961 | 11.48 | 14.35 | 13.89 | 12.85 | 13.72 | 13.31 | 0.02 |
| HARS1_MOUSE | 0.960346 | 9.84 | 10.24 | 11.74 | 11.12 | 10.46 | 10.32 | 0.02 |
| CALR_MOUSE | 0.967791 | 16.10 | 16.32 | 16.31 | 16.07 | 15.89 | 16.80 | 0.01 |
| BAP31_MOUSE | 0.973337 | 10.98 | 13.81 | 13.19 | 12.35 | 13.30 | 12.25 | 0.01 |
| EI3JB_MOUSE | 0.97778 | 12.28 | 12.65 | 11.10 | 10.89 | 12.88 | 12.31 | 0.01 |
| EI3JA_MOUSE | 0.97778 | 12.28 | 12.65 | 11.10 | 10.89 | 12.88 | 12.31 | 0.01 |
| MIF_MOUSE | 0.98048 | 18.20 | 18.05 | 18.36 | 17.61 | 19.16 | 17.87 | 0.01 |
References
- Udenigwe, C.C.; Aluko, R.E. Food protein-derived bioactive peptides: Production, processing, and potential health benefits. J. Food Sci. 2012, 77, R11–R24. [Google Scholar] [CrossRef] [PubMed]
- Aoyama, T.; Fukui, K.; Takamatsu, K.; Hashimoto, Y.; Yamamoto, T. Soy protein isolate and its hydrolysate reduce body fat of dietary obese rats and genetically obese mice (yellow KK). Nutrition 2000, 16, 349–354. [Google Scholar] [CrossRef]
- Bruno, B.J.; Miller, G.D.; Lim, C.S. Basics and recent advances in peptide and protein drug delivery. Ther. Deliv. 2013, 4, 1443–1467. [Google Scholar] [CrossRef] [Green Version]
- Jo Feeney, M.; Miller, A.M.; Roupas, P. Mushrooms-biologically distinct and nutritionally unique: Exploring a “third food kingdom”. Nutr. Today 2014, 49, 301–307. [Google Scholar] [CrossRef] [PubMed] [Green Version]
- Mendoza, G.; Suarez-Medellin, J.; Espinoza, C.; Ramos-Ligonio, A.; Fernandez, J.J.; Norte, M.; Trigos, A. Isolation and characterization of bioactive metabolites from fruiting bodies and mycelial culture of ganoderma oerstedii (higher basidiomycetes) from Mexico. Int. J. Med. Mushrooms 2015, 17, 501–509. [Google Scholar] [CrossRef]
- Cao, Q.Z.; Lin, Z.B. Ganoderma lucidum polysaccharides peptide inhibits the growth of vascular endothelial cell and the induction of VEGF in human lung cancer cell. Life Sci. 2006, 78, 1457–1463. [Google Scholar] [CrossRef]
- Sanodiya, B.S.; Thakur, G.S.; Baghel, R.K.; Prasad, G.B.; Bisen, P.S. Ganoderma lucidum: A potent pharmacological macrofungus. Curr. Pharm. Biotechnol. 2009, 10, 717–742. [Google Scholar] [CrossRef]
- Yoon, H.M.; Jang, K.J.; Han, M.S.; Jeong, J.W.; Kim, G.Y.; Lee, J.H.; Choi, Y.H. Ganoderma lucidum ethanol extract inhibits the inflammatory response by suppressing the NF-kappaB and toll-like receptor pathways in lipopolysaccharide-stimulated BV2 microglial cells. Exp. Ther. Med. 2013, 5, 957–963. [Google Scholar] [CrossRef] [Green Version]
- Krobthong, S.; Choowongkomon, K.; Suphakun, P.; Kuaprasert, B.; Samutrtai, P.; Yingchutrakul, Y. The anti-oxidative effect of Lingzhi protein hydrolysates on lipopolysaccharide-stimulated A549 cells. Food Biosci. 2021, 41, 101093. [Google Scholar] [CrossRef]
- Hayes, M. Food proteins and bioactive peptides: New and novel sources, characterisation strategies and applications. Foods 2018, 7, 38. [Google Scholar] [CrossRef] [Green Version]
- Udenigwe, C.C.; Mohan, A.; Wu, S. Peptide aggregation during plastein reaction enhanced bile acid-binding capacity of enzymatic chicken meat hydrolysates. J. Food Biochem. 2015, 39, 344–348. [Google Scholar] [CrossRef]
- Segura-Campos, M.; Chel-Guerrero, L.; Betancur-Ancona, D.; Hernandez-Escalante, V.M. Bioavailability of bioactive peptides. Food Rev. Int. 2011, 27, 213–226. [Google Scholar] [CrossRef]
- McClements, D.J. Nanoparticle and Microparticle-based Delivery Systems: Encapsulation, Protection and Release of Active Compounds; Taylor & Francis: Oxfordshire, UK, 2014. [Google Scholar]
- Allen, T.M.; Cullis, P.R. Liposomal drug delivery systems: From concept to clinical applications. Adv. Drug. Deliv. Rev. 2013, 65, 36–48. [Google Scholar] [CrossRef] [PubMed]
- Moeller, E.H.; Holst, B.; Nielsen, L.H.; Pedersen, P.S.; Ostergaard, J. Stability, liposome interaction, and in vivo pharmacology of ghrelin in liposomal suspensions. Int. J. Pharm. 2010, 390, 13–18. [Google Scholar] [CrossRef] [PubMed]
- Pisal, D.S.; Kosloski, M.P.; Balu-Iyer, S.V. Delivery of therapeutic proteins. J. Pharm. Sci. 2010, 99, 2557–2575. [Google Scholar] [CrossRef] [PubMed] [Green Version]
- Malam, Y.; Loizidou, M.; Seifalian, A.M. Liposomes and nanoparticles: Nanosized vehicles for drug delivery in cancer. Trends Pharmacol. Sci. 2009, 30, 592–599. [Google Scholar] [CrossRef] [PubMed]
- Sereewatthanawut, I.; Prapintip, S.; Watchiraruji, K.; Goto, M.; Sasaki, M.; Shotipruk, A. Extraction of protein and amino acids from deoiled rice bran by subcritical water hydrolysis. Bioresour. Technol. 2008, 99, 555–561. [Google Scholar] [CrossRef] [PubMed]
- Nielsen, P.M.; Petersen, D.; Dambmann, C. Improved method for determining food protein degree of hydrolysis. J. Food Sci. 2001, 66, 642–646. [Google Scholar] [CrossRef]
- Riss, T.L.; Moravec, R.A.; Niles, A.L.; Duellman, S.; Benink, H.A.; Worzella, T.J.; Minor, L. Cell viability assays. In Assay Guidance Manual; Sittampalam, G.S., Grossman, A., Brimacombe, K., Arkin, M., Auld, D., Austin, C.P., Baell, J., Bejcek, B., Caaveiro, J.M.M., Chung, T.D.Y., et al., Eds.; Assay Guidance Manual. Eli Lilly & Company and the National Center for Advancing Translational Sciences: Bethesda, MD, USA, 2004. [Google Scholar]
- Shilov, I.V.; Seymour, S.L.; Patel, A.A.; Loboda, A.; Tang, W.H.; Keating, S.P.; Hunter, C.L.; Nuwaysir, L.M.; Schaeffer, D.A. The paragon algorithm, a next generation search engine that uses sequence temperature values and feature probabilities to identify peptides from tandem mass spectra. Mol. Cell. Proteom. 2007, 6, 1638–1655. [Google Scholar] [CrossRef] [Green Version]
- Willforss, J.; Chawade, A.; Levander, F. NormalyzerDE: Online tool for improved normalization of omics expression data and high-sensitivity differential expression analysis. J. Proteome. Res. 2019, 18, 732–740. [Google Scholar] [CrossRef] [PubMed]
- DeFelice, S.L. The nutraceutical revolution: Its impact on food industry R&D. Trends Food Sci. Technol. 1995, 6, 59–61. [Google Scholar] [CrossRef]
- Rebeca, B.D.; Peña-Vera, M.T.; Díaz-Castañeda, M. Production of fish protein hydrolysates with bacterial proteases; yield and nutritional value. J. Food Sci. 1991, 56, 309–314. [Google Scholar] [CrossRef]
- Ruderman, G.; Grigera, J.R. Effect of Triton X-100 on the physical properties of liposomes. Biochim. Biophys. Acta 1986, 863, 277–281. [Google Scholar] [CrossRef]
- Gupta, K.; Jang, H.; Harlen, K.; Puri, A.; Nussinov, R.; Schneider, J.P.; Blumenthal, R. Mechanism of membrane permeation induced by synthetic beta-hairpin peptides. Biophys. J. 2013, 105, 2093–2103. [Google Scholar] [CrossRef] [PubMed] [Green Version]
- Smith, M.C.; Crist, R.M.; Clogston, J.D.; McNeil, S.E. Zeta potential: A case study of cationic, anionic, and neutral liposomes. Anal. Bioanal. Chem. 2017, 409, 5779–5787. [Google Scholar] [CrossRef] [PubMed]
- Andar, A.U.; Hood, R.R.; Vreeland, W.N.; Devoe, D.L.; Swaan, P.W. Microfluidic preparation of liposomes to determine particle size influence on cellular uptake mechanisms. Pharm. Res. 2014, 31, 401–413. [Google Scholar] [CrossRef] [PubMed]
- Sheng, Y.; Chang, L.; Kuang, T.; Hu, J. PEG/heparin-decorated lipid–polymer hybrid nanoparticles for long-circulating drug delivery. RSC Adv. 2016, 6, 23279–23287. [Google Scholar] [CrossRef]
- Taira, M.C.; Chiaramoni, N.S.; Pecuch, K.M.; Alonso-Romanowski, S. Stability of liposomal formulations in physiological conditions for oral drug delivery. Drug Deliv. 2004, 11, 123–128. [Google Scholar] [CrossRef]
- Kim, J.; Jang, D.S.; Kim, H.; Kim, J.S. Anti-lipase and lipolytic activities of ursolic acid isolated from the roots of Actinidia arguta. Arch. Pharmacal Res. 2009, 32, 983–987. [Google Scholar] [CrossRef]
- Fernandez-Galilea, M.; Perez-Matute, P.; Prieto-Hontoria, P.L.; Martinez, J.A.; Moreno-Aliaga, M.J. Effects of lipoic acid on lipolysis in 3T3-L1 adipocytes. J. Lipid Res. 2012, 53, 2296–2306. [Google Scholar] [CrossRef] [Green Version]
- Valikangas, T.; Suomi, T.; Elo, L.L. A systematic evaluation of normalization methods in quantitative label-free proteomics. Brief Bioinform. 2018, 19, 1–11. [Google Scholar] [CrossRef]
- Wang, Y.; Botolin, D.; Xu, J.; Christian, B.; Mitchell, E.; Jayaprakasam, B.; Nair, M.G.; Peters, J.M.; Busik, J.V.; Olson, L.K.; et al. Regulation of hepatic fatty acid elongase and desaturase expression in diabetes and obesity. J. Lipid Res. 2006, 47, 2028–2041. [Google Scholar] [CrossRef] [PubMed] [Green Version]


| Experiment No. | Independent Factors | Experimental Outputs | ||
|---|---|---|---|---|
| x1; Time (Hour) | x2; Enzyme (%) | y1; DH (%) | y2; Yield (%) | |
| 1 | 3 | 0.25 | 28.11 ± 1.03 | 4.16 ± 0.13 |
| 2 | 3 | 0.50 | 29.83 ± 1.30 | 4.57 ± 0.17 |
| 3 | 3 | 1.00 | 29.36 ± 1.28 | 4.22 ± 0.15 |
| 4 | 6 | 0.50 | 33.21 ± 1.03 | 5.25 ± 0.12 |
| 5 | 6 | 1.00 | 32.91 ± 1.37 | 5.32 ± 0.14 |
| 6 | 6 | 2.00 | 32.03 ± 0.76 | 5.21 ± 0.22 |
| 7 | 9 | 0.25 | 33.96 ± 1.14 | 5.58 ± 0.16 |
| 8 | 9 | 0.50 | 33.17 ± 1.29 | 5.67 ± 0.09 |
| 9 | 9 | 1.00 | 34.18 ± 1.12 | 5.70 ± 0.20 |
| 10 | 6 | 0.50 | 33.16 ± 0.58 | 5.24 ± 0.09 |
| 11 | 6 | 0.50 | 32.92 ± 0.32 | 5.21 ± 0.13 |
| Responding | Quadratic Model | R2 | p-Value |
|---|---|---|---|
| y1 | y1 = 33.14 + 2.08x1 − 0.497x2 − 0.283x1x2 − 1.53x12 − 0.635x22 | 0.96 | 0.0019 |
| y2 | y2 = 5.293 + 0.726x1 − 0.027x2 − 0.066x1x2 − 0.264x12 − 0.073x22 | 0.97 | 0.0010 |
| Accession | Protein Name | Biological Process |
|---|---|---|
| TSSK5_MOUSE | Testis-specific serine/threonine-protein kinase 5 | Cell differentiation, intracellular signal transduction, multicellular organism development, protein phosphorylation, and spermatogenesis |
| SMU1_MOUSE | WD40 repeat-containing protein SMU1 | mRNA splicing, via spliceosome, regulation of alternative mRNA splicing, via spliceosome, and RNA splicing |
| GRM7_MOUSE | Metabotropic glutamate receptor 7 | adenylate cyclase-inhibiting G protein-coupled glutamate receptor signaling pathway, chemical synaptic transmission, and regulation of neuron death |
| KLC4_MOUSE | Kinesin light chain 4 | - |
Publisher’s Note: MDPI stays neutral with regard to jurisdictional claims in published maps and institutional affiliations. |
© 2021 by the authors. Licensee MDPI, Basel, Switzerland. This article is an open access article distributed under the terms and conditions of the Creative Commons Attribution (CC BY) license (https://creativecommons.org/licenses/by/4.0/).
Share and Cite
Krobthong, S.; Yingchutrakul, Y.; Visessanguan, W.; Mahatnirunkul, T.; Samutrtai, P.; Chaichana, C.; Papan, P.; Choowongkomon, K. Study of the Lipolysis Effect of Nanoliposome-Encapsulated Ganoderma lucidum Protein Hydrolysates on Adipocyte Cells Using Proteomics Approach. Foods 2021, 10, 2157. https://doi.org/10.3390/foods10092157
Krobthong S, Yingchutrakul Y, Visessanguan W, Mahatnirunkul T, Samutrtai P, Chaichana C, Papan P, Choowongkomon K. Study of the Lipolysis Effect of Nanoliposome-Encapsulated Ganoderma lucidum Protein Hydrolysates on Adipocyte Cells Using Proteomics Approach. Foods. 2021; 10(9):2157. https://doi.org/10.3390/foods10092157
Chicago/Turabian StyleKrobthong, Sucheewin, Yodying Yingchutrakul, Wonnop Visessanguan, Thanisorn Mahatnirunkul, Pawitrabhorn Samutrtai, Chartchai Chaichana, Phakorn Papan, and Kiattawee Choowongkomon. 2021. "Study of the Lipolysis Effect of Nanoliposome-Encapsulated Ganoderma lucidum Protein Hydrolysates on Adipocyte Cells Using Proteomics Approach" Foods 10, no. 9: 2157. https://doi.org/10.3390/foods10092157