
Kinetic, Thermodynamic, Physicochemical, and Economical Characterization of Pectin from Mangifera indica L. cv. Haden Residues

 , , , and
Abstract
:1. Introduction
2. Materials and Methods
2.1. Materials
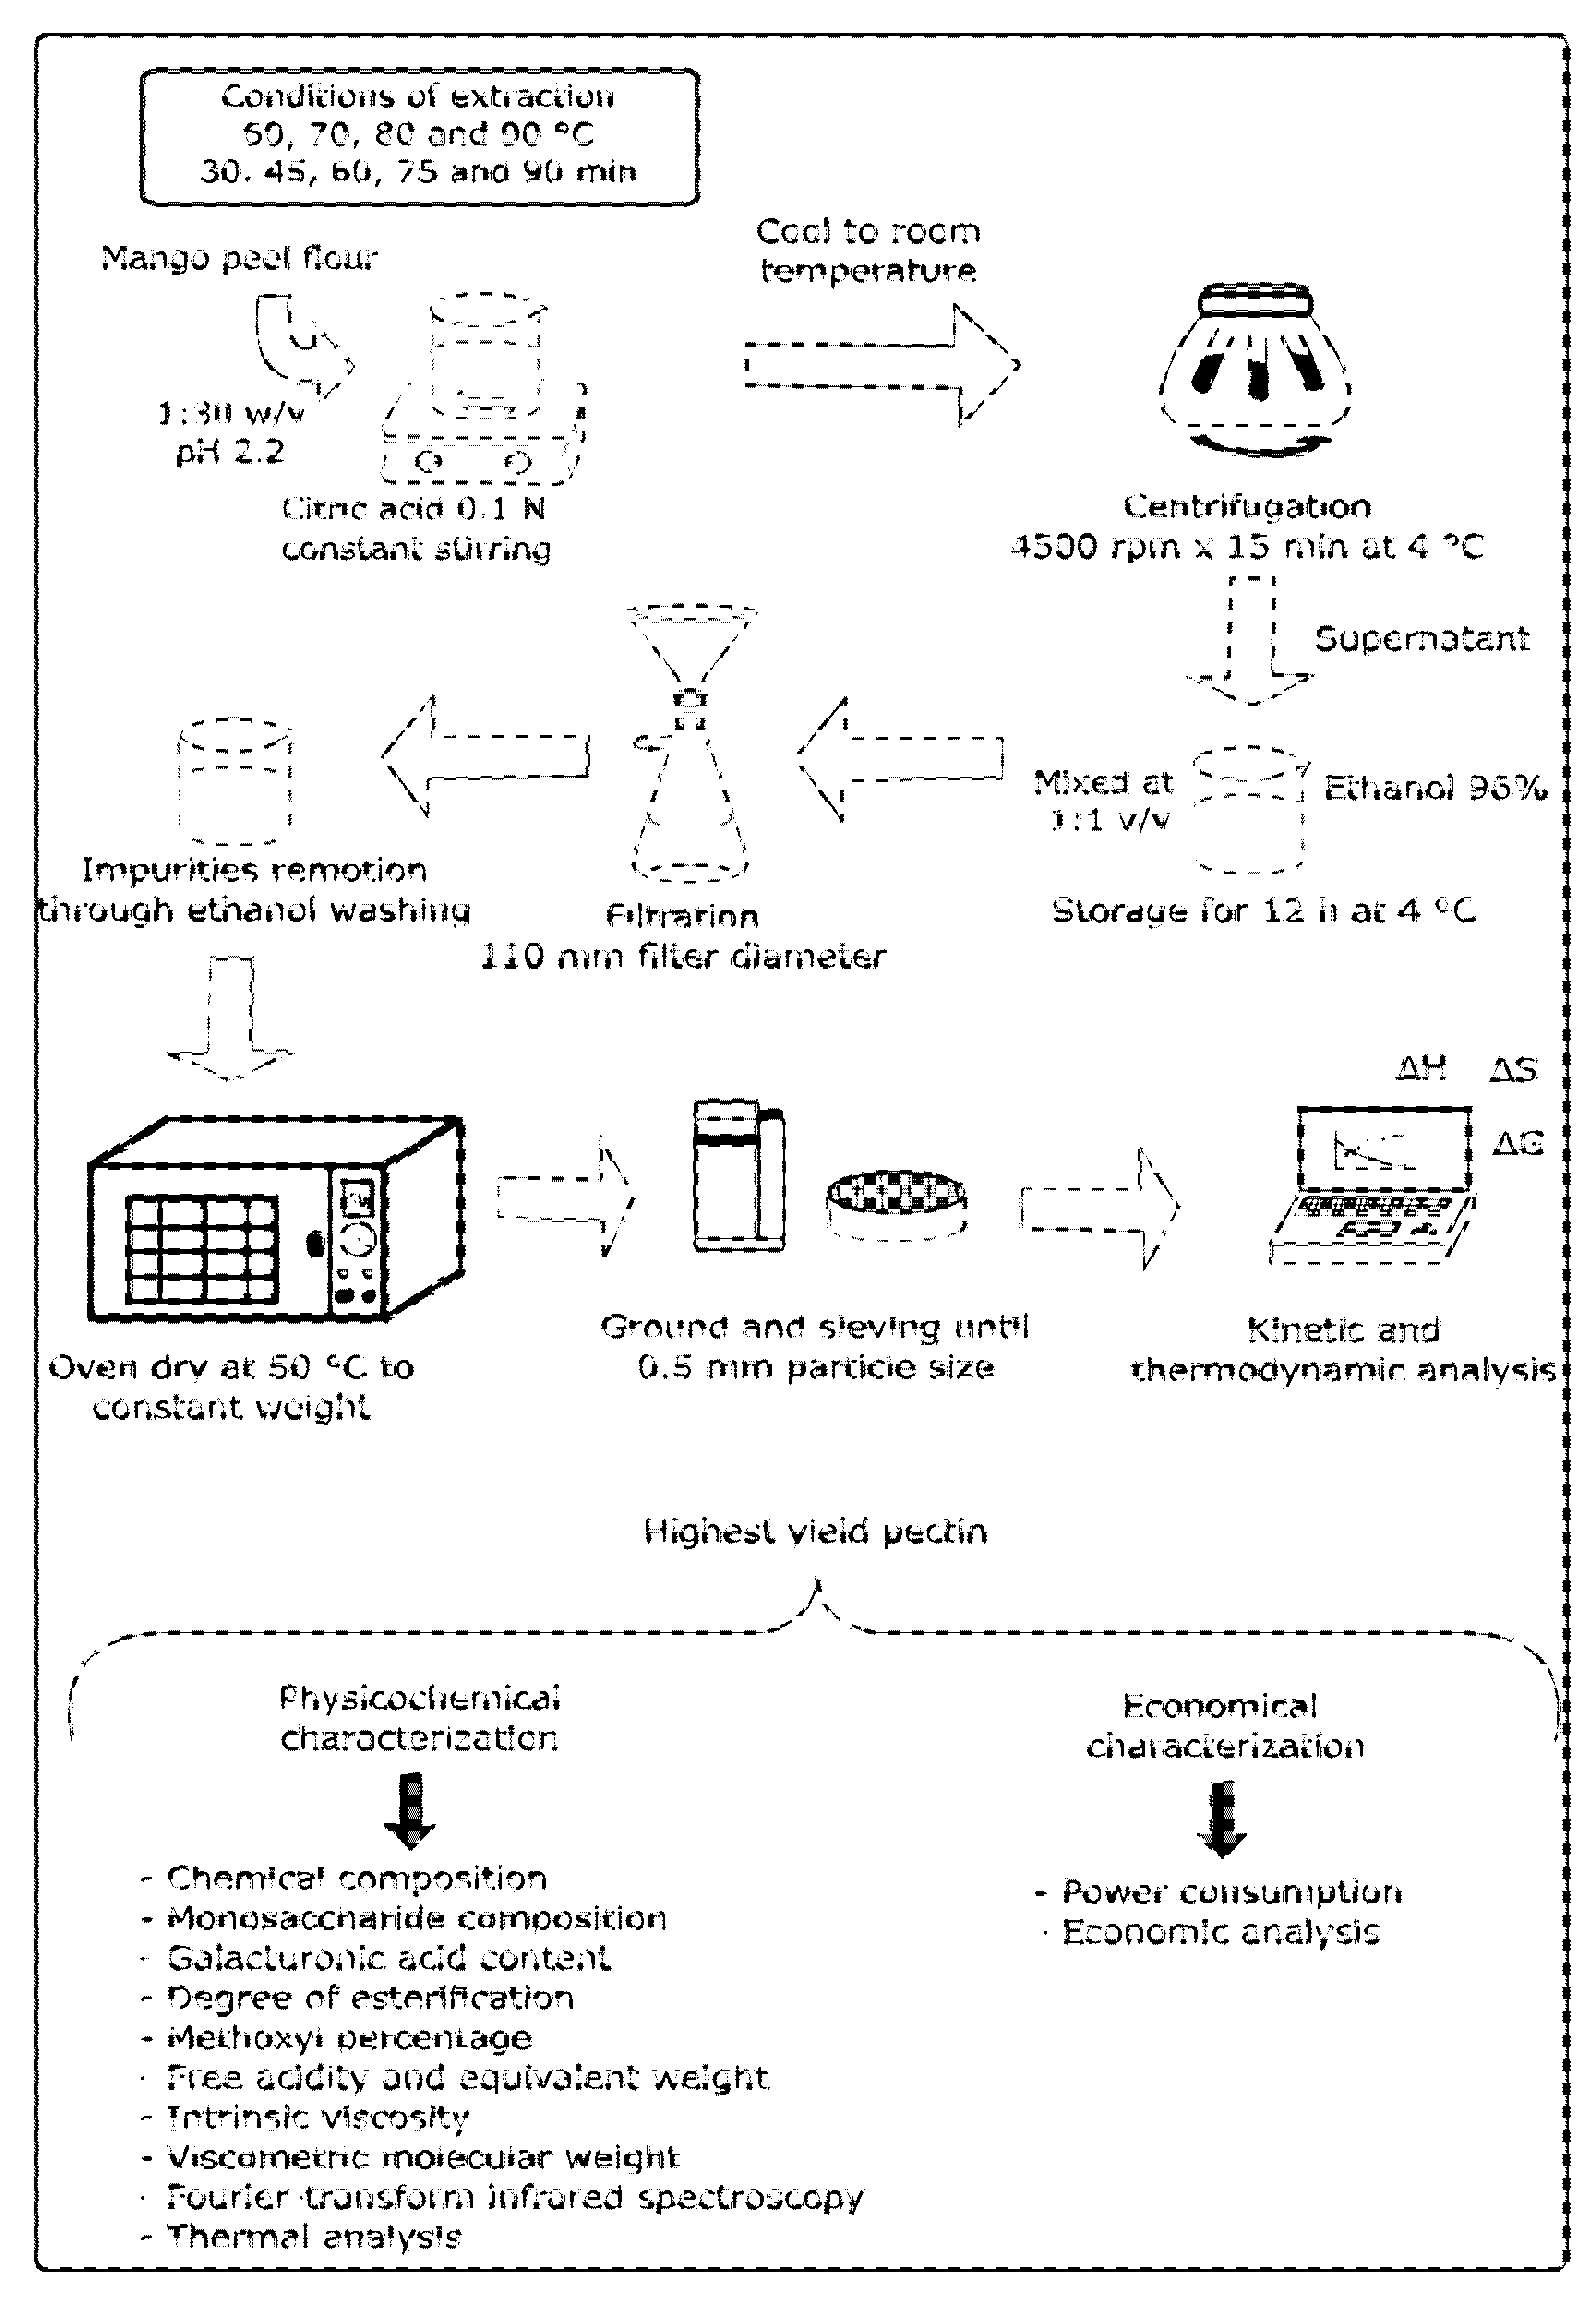
2.2. Obtaining Haden Mango Peel Flour
2.3. Pectin Extraction
Statistical Analysis
2.4. Kinetic Characterization
2.5. Thermodynamic Characterization
2.6. Physicochemical Characterization
2.6.1. Chemical Composition
2.6.2. Monosaccharide Composition
2.6.3. Galacturonic Acid Content
2.6.4. Degree of Esterification
2.6.5. Methoxyl Percentage
2.6.6. Free Acidity and Equivalent Weight
2.6.7. Intrinsic Viscosity and Viscometric Molecular Weight
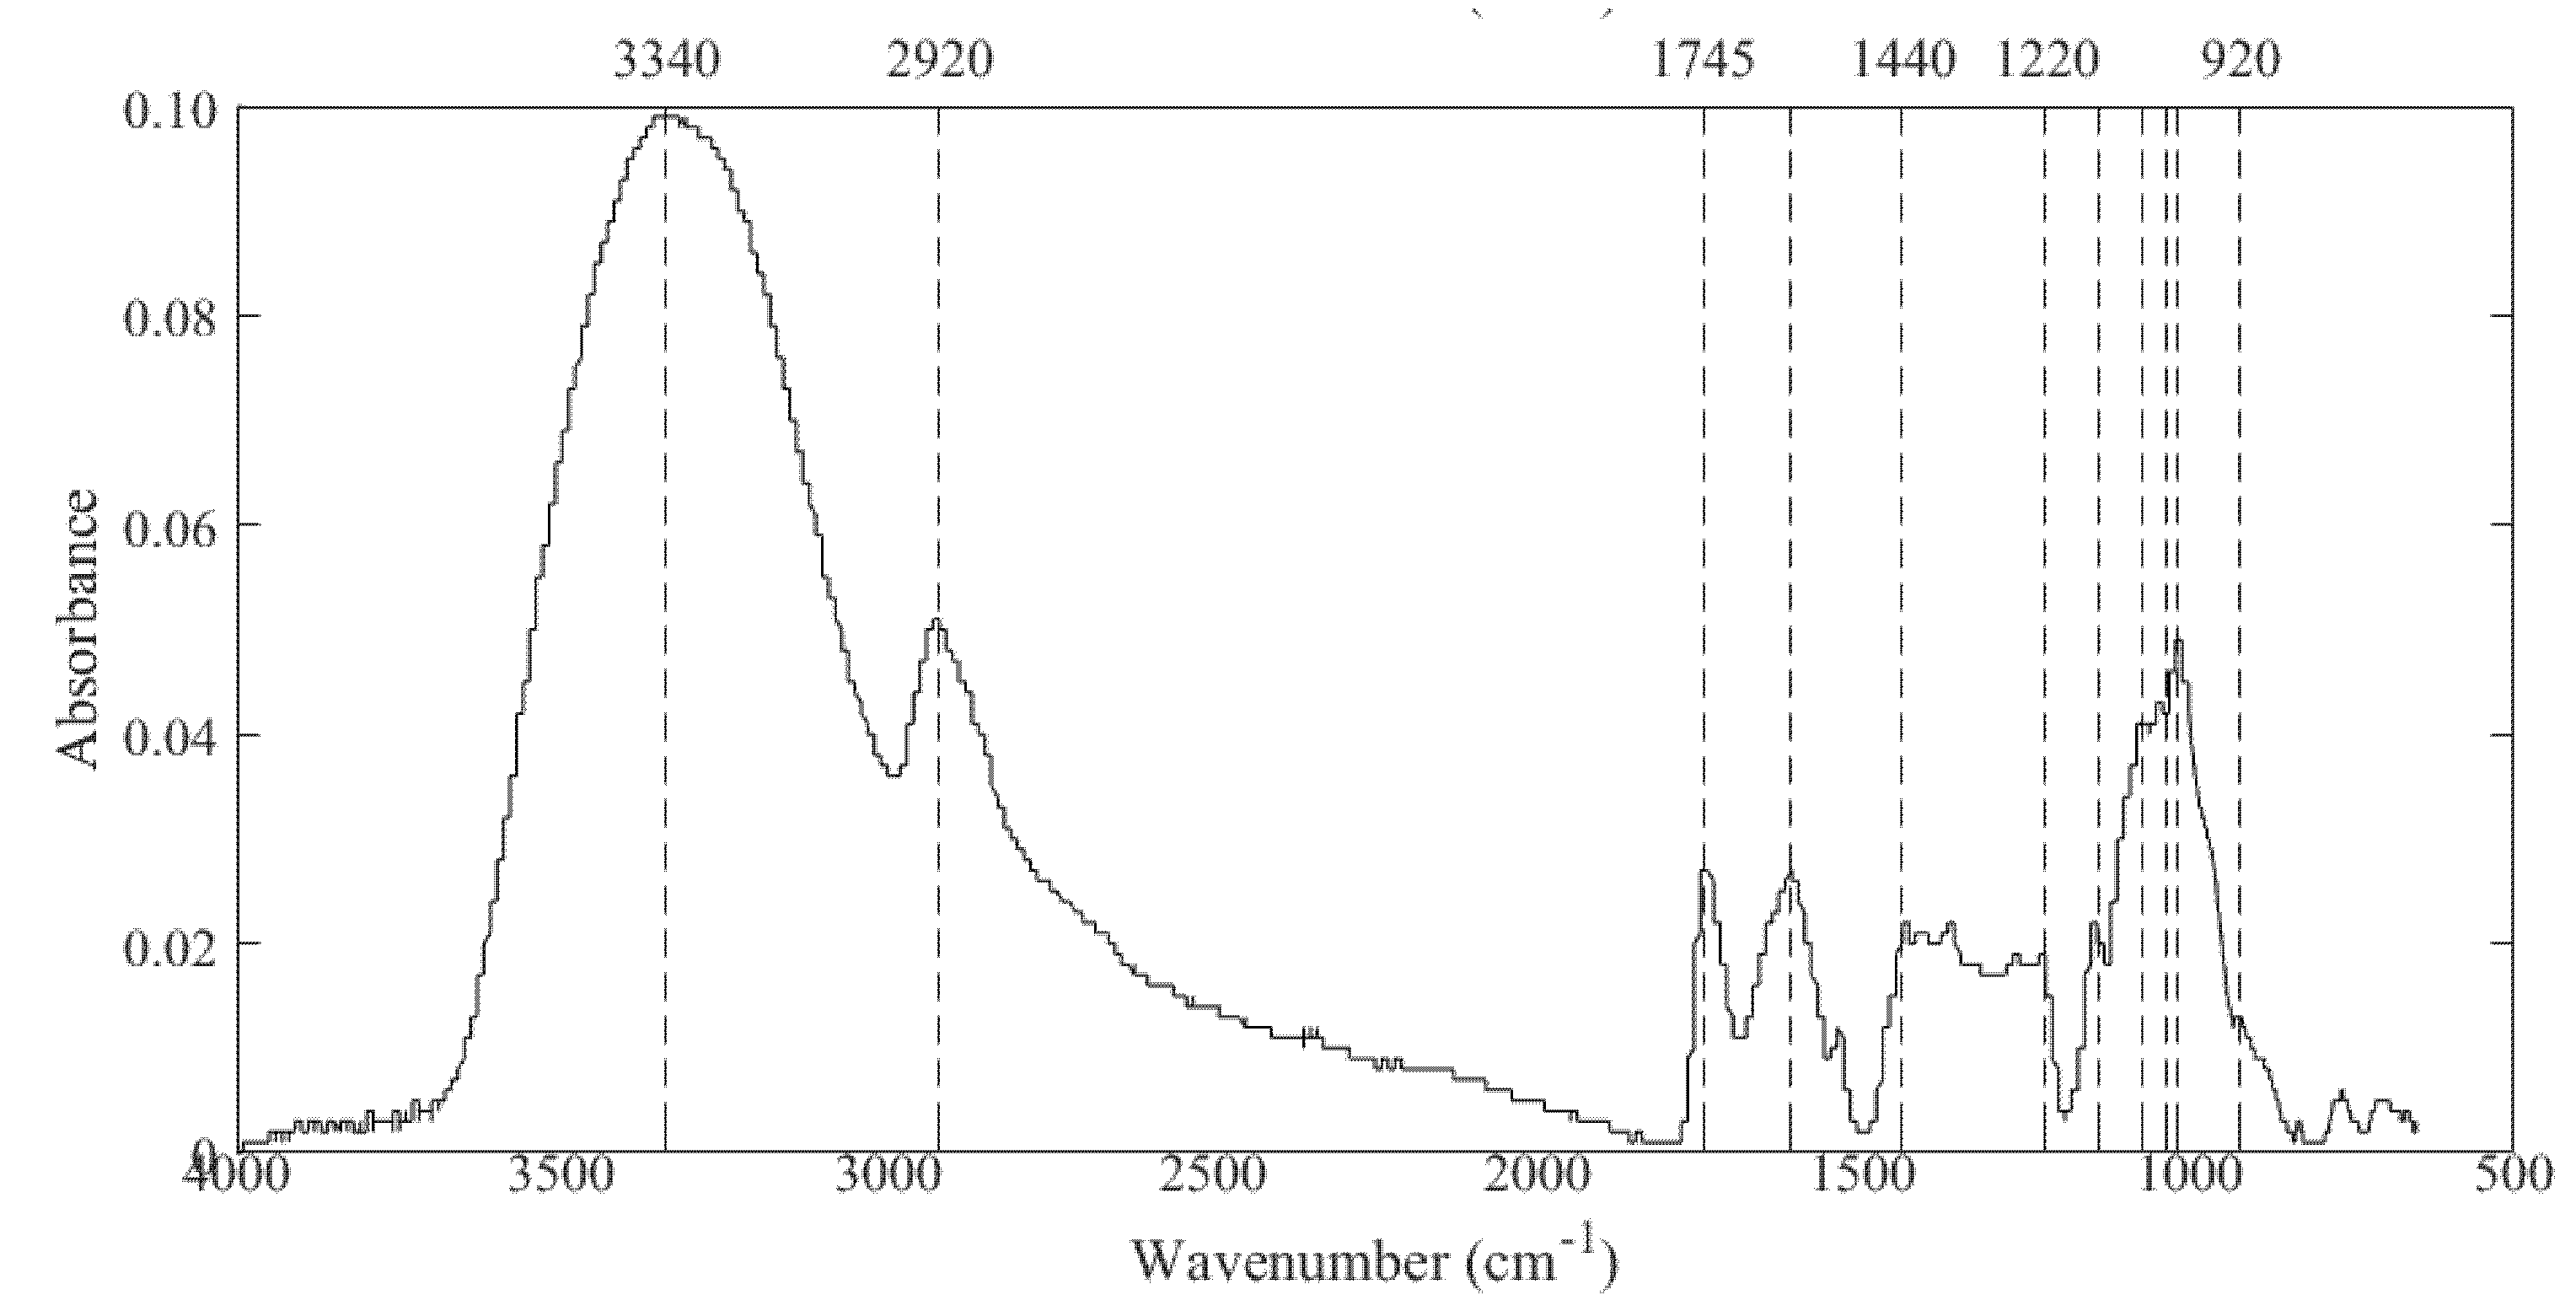
2.6.8. Fourier-Transform Infrared Spectroscopy
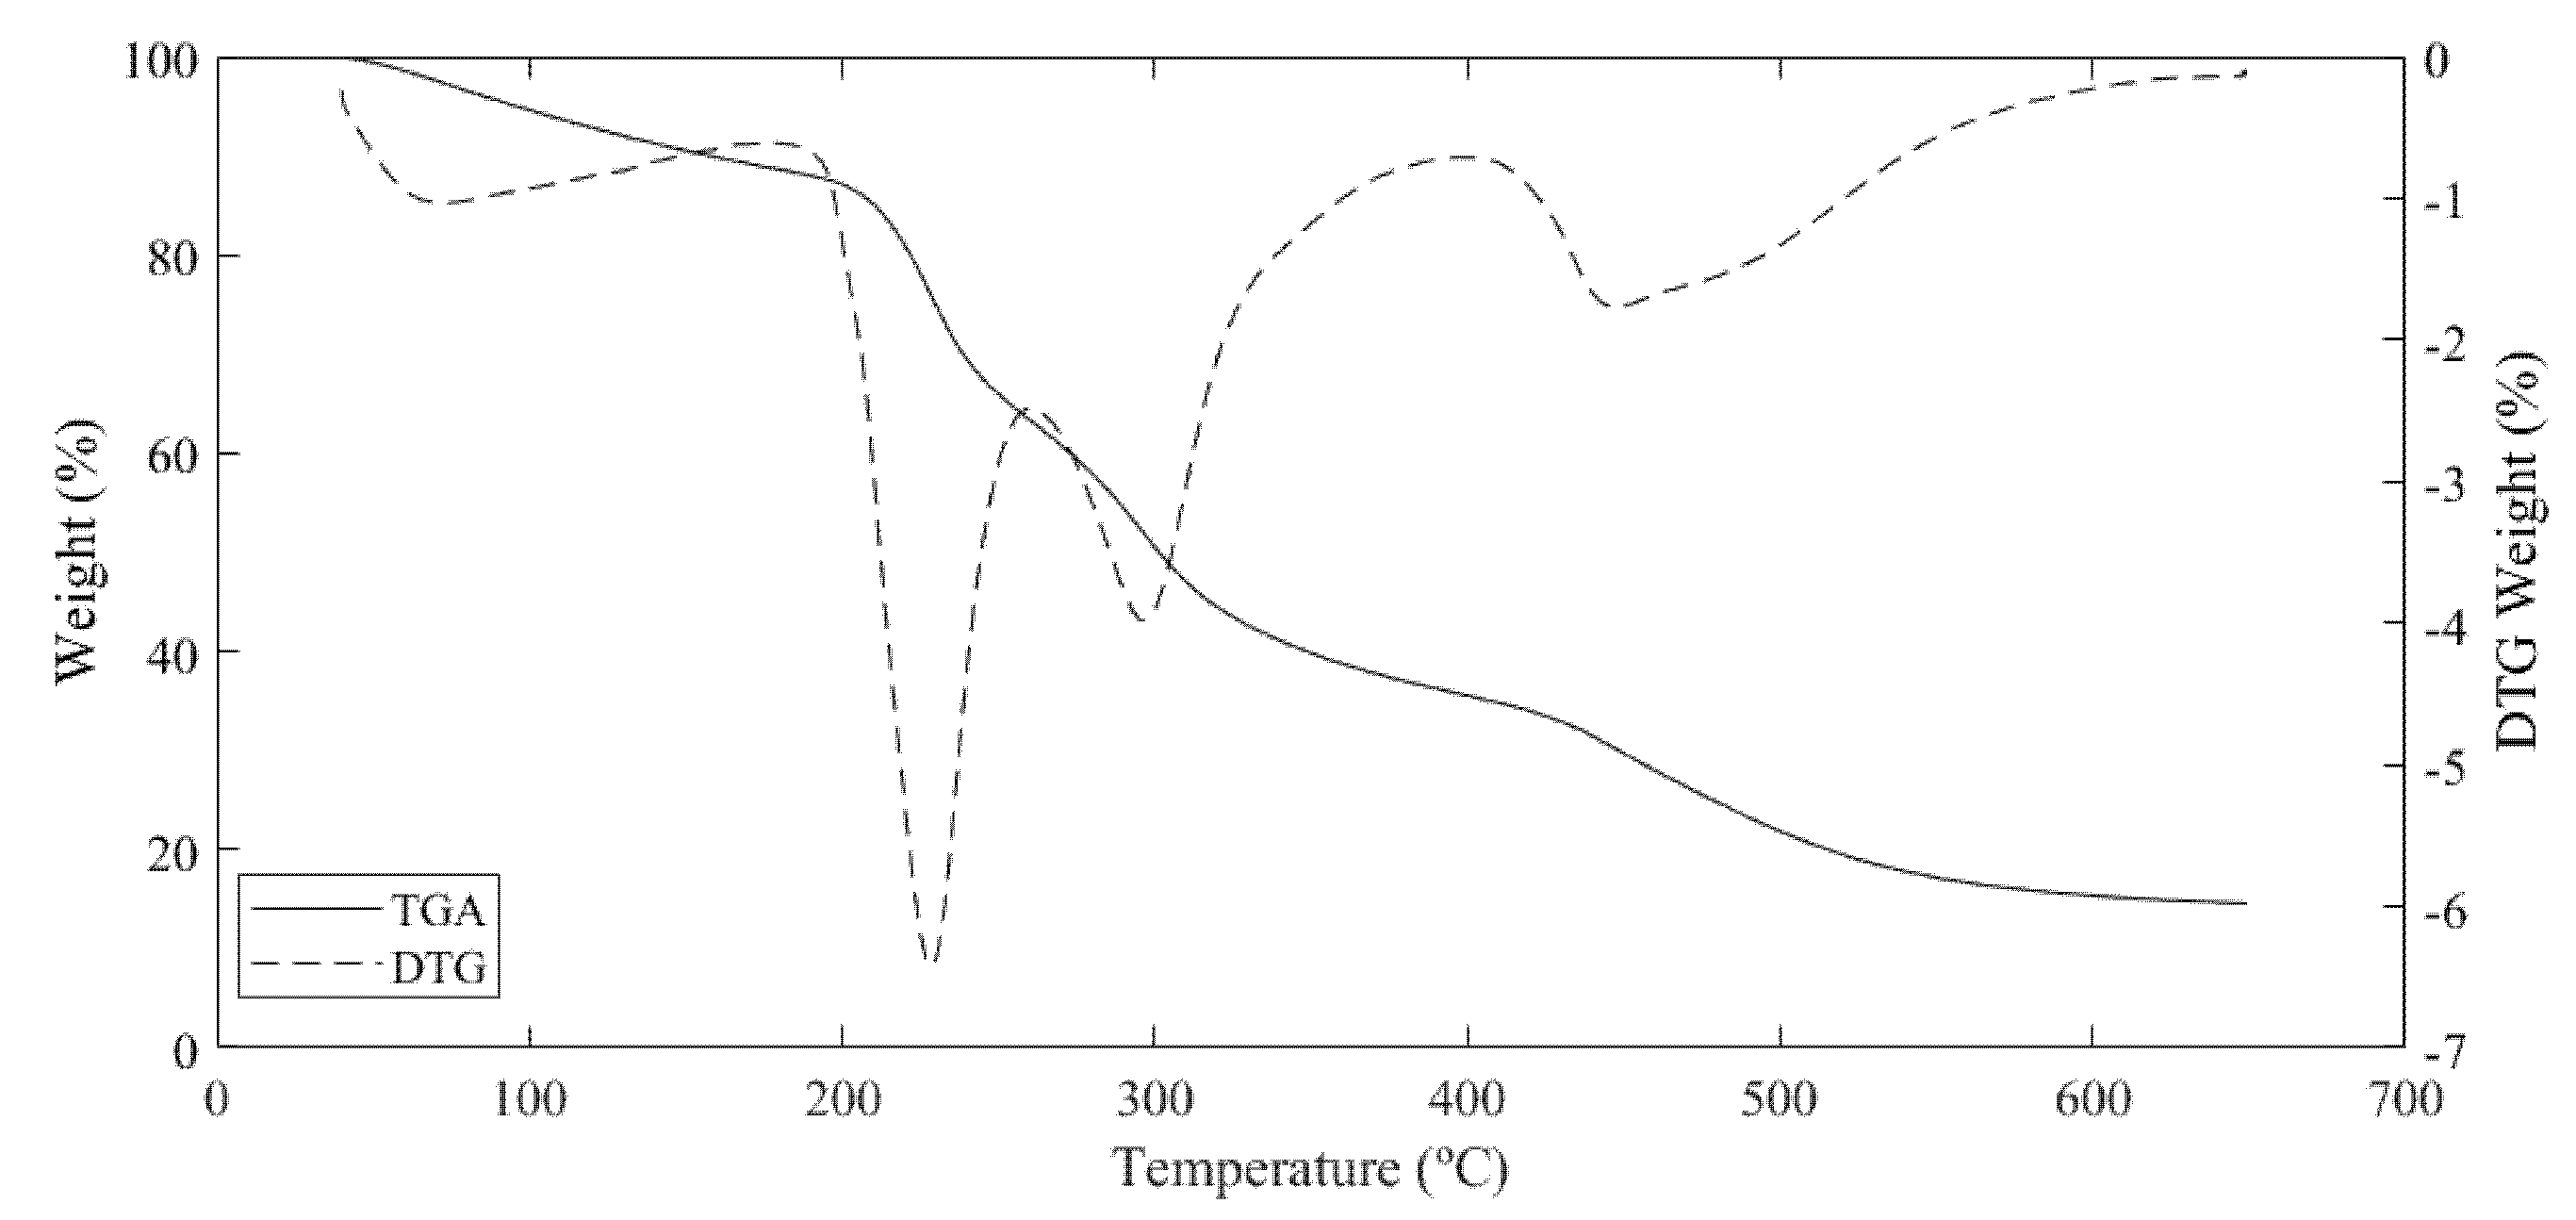
2.6.9. Thermal Analysis
2.7. Power Consumption and Economic Analysis
3. Results and Discussion
3.1. Pectin Extraction Yield
3.2. Time and Temperature Effect on Extraction Yield
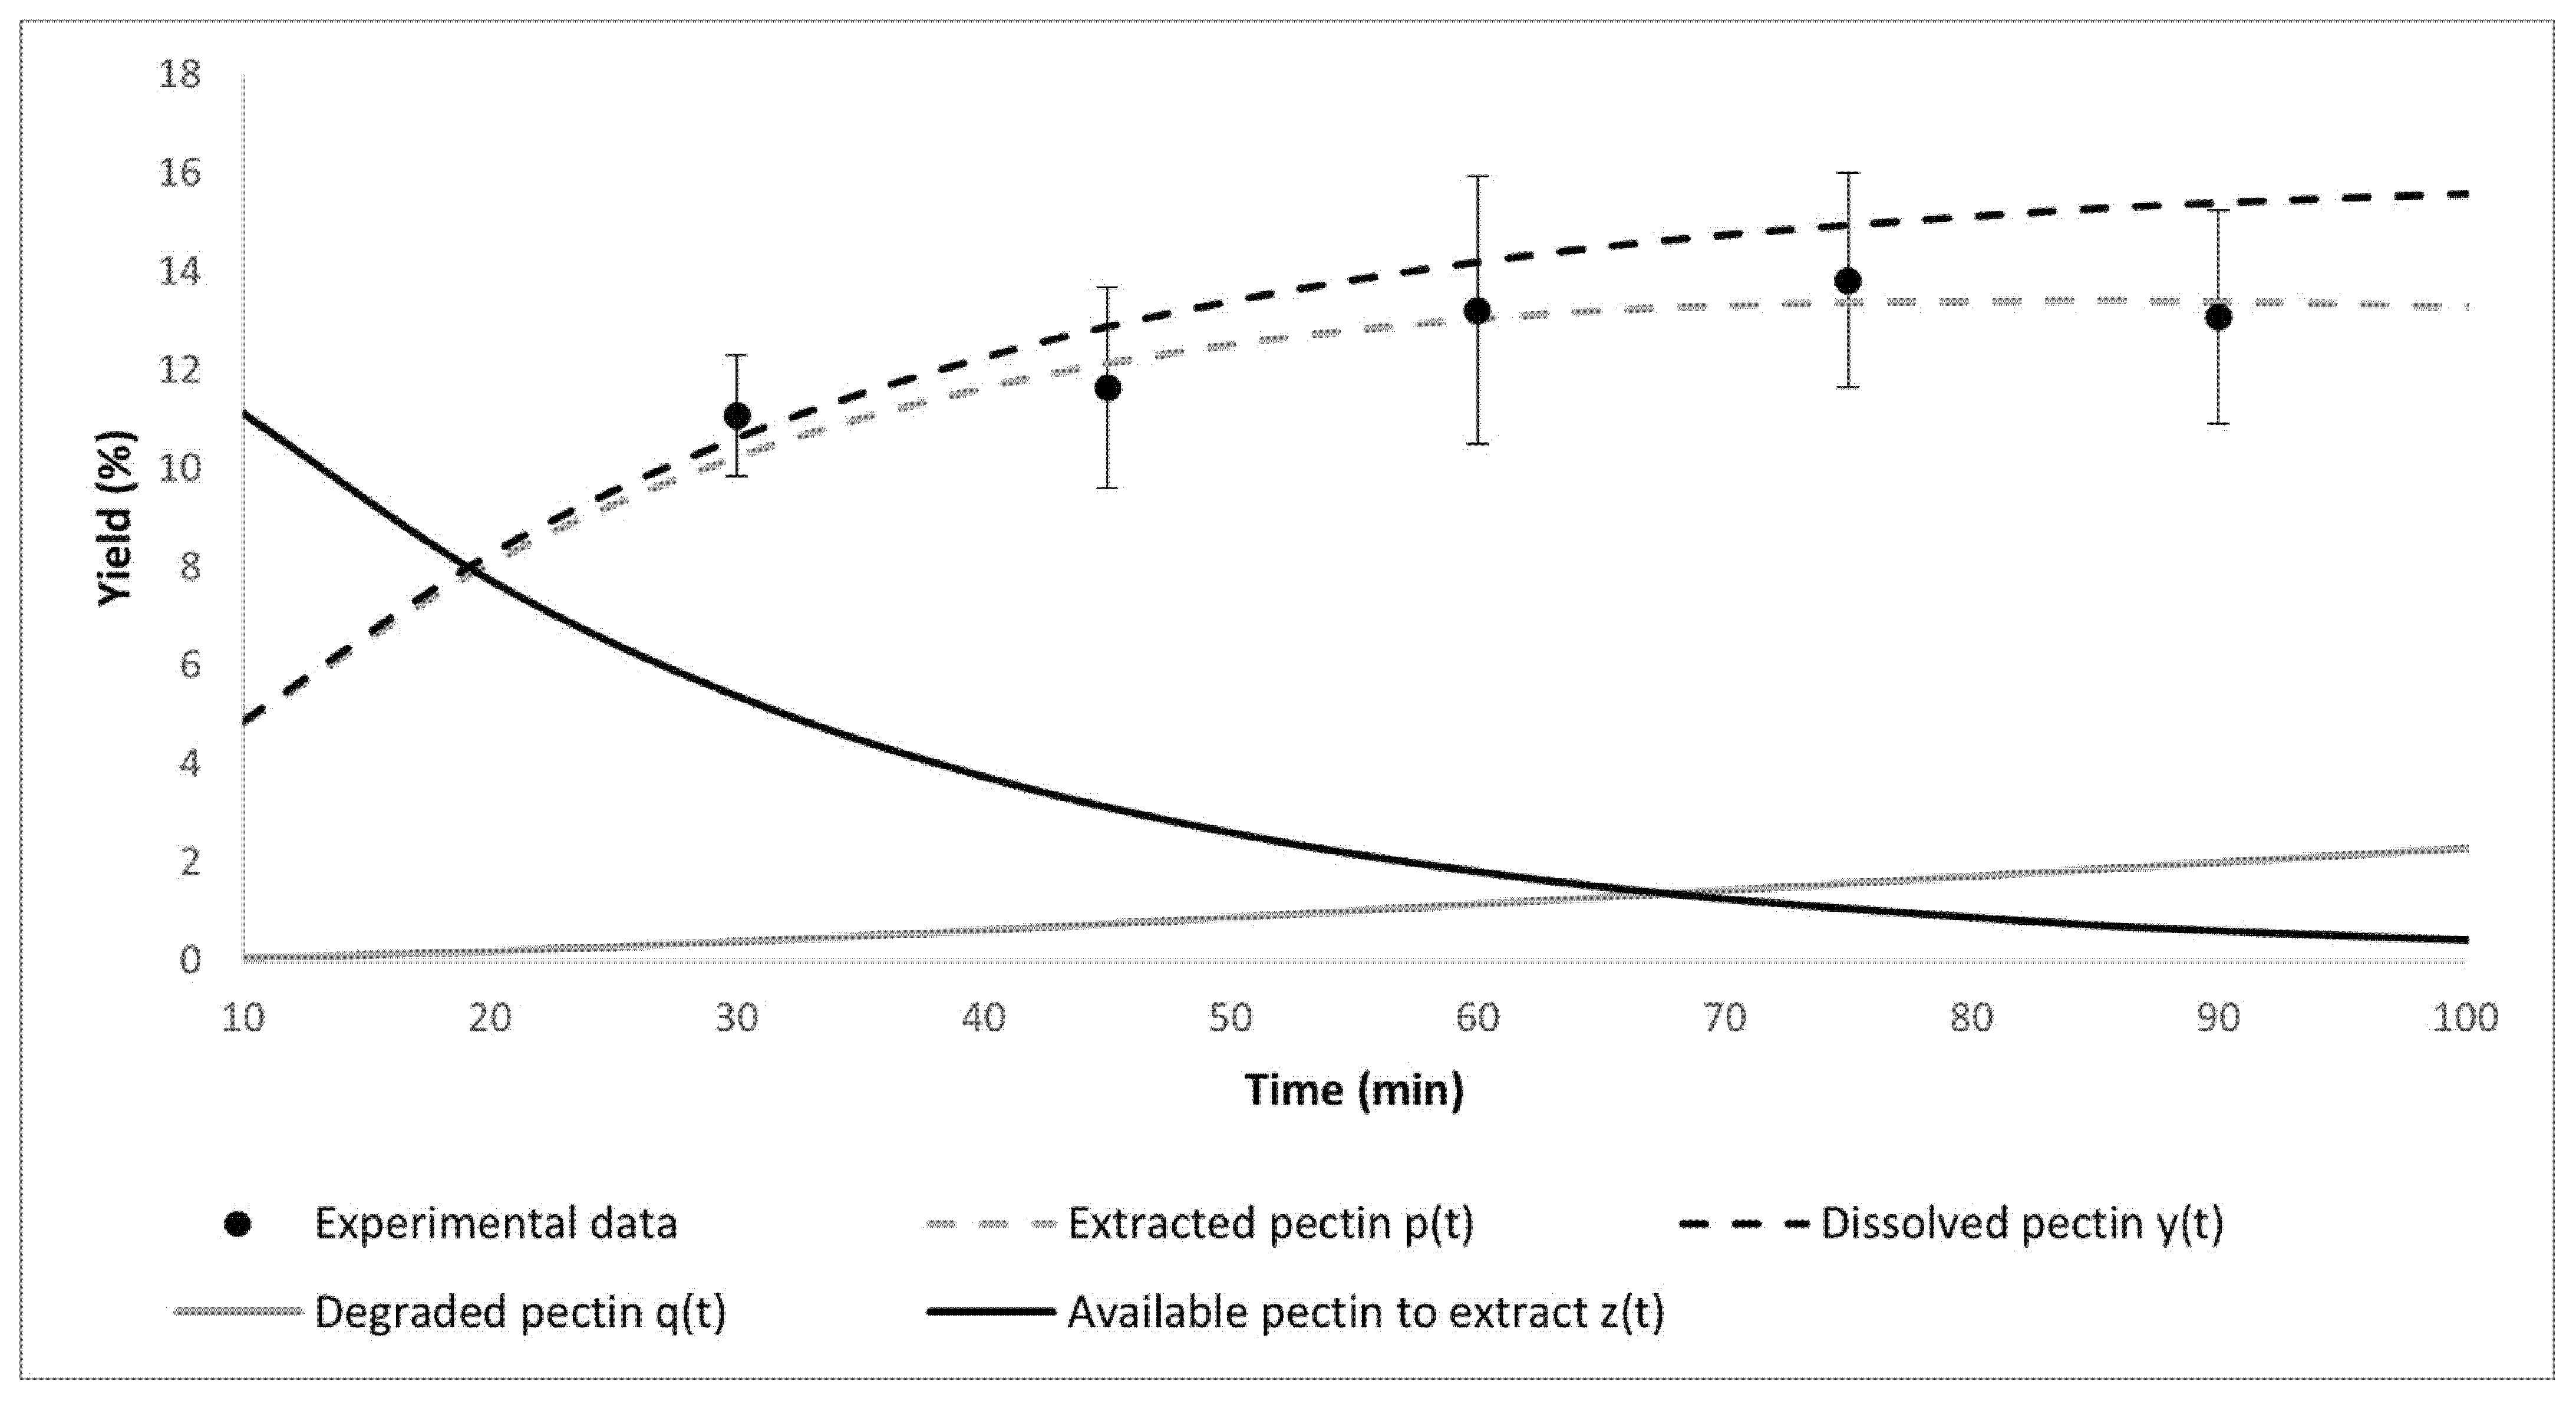
3.3. Kinetic and Thermodynamic Characterization
3.4. Physicochemical Characterization
3.4.1. Chemical and Physicochemical Parameters
3.4.2. Monosaccharide Composition
3.4.3. Intrinsic Viscosity and Viscometric Molecular Weight
3.4.4. FT-IR
3.4.5. Thermal Analysis
3.5. Power Consumption and Economic Analysis
4. Conclusions
Author Contributions
Funding
Data Availability Statement
Acknowledgments
Conflicts of Interest
Appendix A

| ANOVA | |||||
|---|---|---|---|---|---|
| Sum of Squares | df | Mean Square | F | p | |
| Time | 54.49 | 4 | 13.623 | 2.139 | 0.088 |
| Temperature | 362.18 | 3 | 120.727 | 18.957 | <0.001 |
| Time*Temperature | 9.77 | 12 | 0.814 | 0.128 | 1 |
| Residuals | 356.64 | 56 | 6.369 | ||
| Post Hoc Comparisons—Temperature | |||||||
|---|---|---|---|---|---|---|---|
| Comparison | |||||||
| Temperature | Temperature | Mean Difference | SE | df | t | ptukey | |
| 60 | - | 70 | −1.68 | 0.787 | 56 | −2.13 | 0.155 |
| - | 80 | −2.86 | 0.842 | 56 | −3.4 | 0.007 | |
| - | 90 | −6.36 | 0.867 | 56 | −7.34 | <0.001 | |
| 70 | - | 80 | −1.18 | 0.822 | 56 | −1.44 | 0.482 |
| - | 90 | −4.68 | 0.847 | 56 | −5.53 | <0.001 | |
| 80 | - | 90 | −3.5 | 0.898 | 56 | −3.9 | 0.001 |
| Post Hoc Comparisons—Time | |||||||
|---|---|---|---|---|---|---|---|
| Comparison | |||||||
| Time | Time | Mean Difference | SE | df | t | ptukey | |
| 30 | - | 45 | −0.881 | 0.929 | 56 | −0.948 | 0.877 |
| - | 60 | −2.009 | 0.953 | 56 | −2.108 | 0.231 | |
| - | 75 | −2.51 | 0.977 | 56 | −2.568 | 0.09 | |
| - | 90 | −1.77 | 0.946 | 56 | −1.87 | 0.345 | |
| 45 | - | 60 | −1.129 | 0.918 | 56 | −1.229 | 0.734 |
| - | 75 | −1.629 | 0.943 | 56 | −1.728 | 0.426 | |
| - | 90 | −0.889 | 0.911 | 56 | −0.977 | 0.865 | |
| 60 | - | 75 | −0.5 | 0.967 | 56 | −0.517 | 0.985 |
| - | 90 | 0.239 | 0.936 | 56 | 0.256 | 0.999 | |
| 75 | - | 90 | 0.74 | 0.96 | 56 | 0.77 | 0.938 |
| Post Hoc Comparisons—Time*Temperature | |||||||||
|---|---|---|---|---|---|---|---|---|---|
| Comparison | |||||||||
| Time | Temperature | Time | Temperature | Mean Difference | SE | df | t | ptukey | |
| 30 | 60 | - | 30 | 70 | −2.2583 | 1.93 | 56 | −1.1717 | 1 |
| - | 30 | 80 | −2.7259 | 1.78 | 56 | −1.5276 | 0.991 | ||
| - | 30 | 90 | −6.439 | 1.93 | 56 | −3.3407 | 0.129 | ||
| - | 45 | 60 | −1.5414 | 1.78 | 56 | −0.8638 | 1 | ||
| - | 45 | 70 | −3.1124 | 1.63 | 56 | −1.9106 | 0.922 | ||
| - | 45 | 80 | −3.2832 | 1.93 | 56 | −1.7034 | 0.972 | ||
| - | 45 | 90 | −7.0087 | 1.78 | 56 | −3.9277 | 0.028 | ||
| - | 60 | 60 | −2.1547 | 1.78 | 56 | −1.2075 | 0.999 | ||
| - | 60 | 70 | −3.9649 | 1.69 | 56 | −2.3421 | 0.698 | ||
| - | 60 | 80 | −4.7648 | 1.93 | 56 | −2.4721 | 0.608 | ||
| - | 60 | 90 | −8.5755 | 1.93 | 56 | −4.4492 | 0.006 | ||
| - | 75 | 60 | −2.3884 | 1.69 | 56 | −1.4108 | 0.996 | ||
| - | 75 | 70 | −3.9249 | 1.69 | 56 | −2.3185 | 0.714 | ||
| - | 75 | 80 | −5.9718 | 1.93 | 56 | −3.0983 | 0.22 | ||
| - | 75 | 90 | −9.1766 | 2.19 | 56 | −4.1988 | 0.013 | ||
| - | 90 | 60 | −1.7338 | 1.93 | 56 | −0.8996 | 1 | ||
| - | 90 | 70 | −2.962 | 1.78 | 56 | −1.6599 | 0.978 | ||
| - | 90 | 80 | −5.3775 | 1.78 | 56 | −3.0135 | 0.261 | ||
| - | 90 | 90 | −8.4299 | 1.78 | 56 | −4.7241 | 0.002 | ||
| 70 | - | 30 | 80 | −0.4676 | 1.93 | 56 | −0.2426 | 1 | |
| - | 30 | 90 | −4.1807 | 2.06 | 56 | −2.029 | 0.876 | ||
| - | 45 | 60 | 0.7169 | 1.93 | 56 | 0.3719 | 1 | ||
| - | 45 | 70 | −0.8541 | 1.78 | 56 | −0.4786 | 1 | ||
| - | 45 | 80 | −1.0249 | 2.06 | 56 | −0.4974 | 1 | ||
| - | 45 | 90 | −4.7504 | 1.93 | 56 | −2.4646 | 0.614 | ||
| - | 60 | 60 | 0.1037 | 1.93 | 56 | 0.0538 | 1 | ||
| - | 60 | 70 | −1.7066 | 1.84 | 56 | −0.926 | 1 | ||
| - | 60 | 80 | −2.5065 | 2.06 | 56 | −1.2164 | 0.999 | ||
| - | 60 | 90 | −6.3172 | 2.06 | 56 | −3.0659 | 0.235 | ||
| - | 75 | 60 | −0.1301 | 1.84 | 56 | −0.0706 | 1 | ||
| - | 75 | 70 | −1.6666 | 1.84 | 56 | −0.9043 | 1 | ||
| - | 75 | 80 | −3.7135 | 2.06 | 56 | −1.8022 | 0.952 | ||
| - | 75 | 90 | −6.9183 | 2.3 | 56 | −3.0031 | 0.266 | ||
| - | 90 | 60 | 0.5245 | 2.06 | 56 | 0.2545 | 1 | ||
| - | 90 | 70 | −0.7036 | 1.93 | 56 | −0.3651 | 1 | ||
| - | 90 | 80 | −3.1192 | 1.93 | 56 | −1.6183 | 0.983 | ||
| - | 90 | 90 | −6.1716 | 1.93 | 56 | −3.202 | 0.177 | ||
| 80 | - | 30 | 90 | −3.7132 | 1.93 | 56 | −1.9265 | 0.917 | |
| - | 45 | 60 | 1.1844 | 1.78 | 56 | 0.6638 | 1 | ||
| - | 45 | 70 | −0.3865 | 1.63 | 56 | −0.2373 | 1 | ||
| - | 45 | 80 | −0.5574 | 1.93 | 56 | −0.2892 | 1 | ||
| - | 45 | 90 | −4.2829 | 1.78 | 56 | −2.4001 | 0.659 | ||
| - | 60 | 60 | 0.5712 | 1.78 | 56 | 0.3201 | 1 | ||
| - | 60 | 70 | −1.2391 | 1.69 | 56 | −0.7319 | 1 | ||
| - | 60 | 80 | −2.0389 | 1.93 | 56 | −1.0578 | 1 | ||
| - | 60 | 90 | −5.8497 | 1.93 | 56 | −3.035 | 0.25 | ||
| - | 75 | 60 | 0.3375 | 1.69 | 56 | 0.1994 | 1 | ||
| - | 75 | 70 | −1.199 | 1.69 | 56 | −0.7083 | 1 | ||
| - | 75 | 80 | −3.246 | 1.93 | 56 | −1.6841 | 0.975 | ||
| - | 75 | 90 | −6.4507 | 2.19 | 56 | −2.9516 | 0.293 | ||
| - | 90 | 60 | 0.992 | 1.93 | 56 | 0.5147 | 1 | ||
| - | 90 | 70 | −0.2361 | 1.78 | 56 | −0.1323 | 1 | ||
| - | 90 | 80 | −2.6516 | 1.78 | 56 | −1.486 | 0.993 | ||
| - | 90 | 90 | −5.704 | 1.78 | 56 | −3.1965 | 0.179 | ||
| 90 | - | 45 | 60 | 4.8976 | 1.93 | 56 | 2.541 | 0.56 | |
| - | 45 | 70 | 3.3266 | 1.78 | 56 | 1.8642 | 0.936 | ||
| - | 45 | 80 | 3.1558 | 2.06 | 56 | 1.5316 | 0.99 | ||
| - | 45 | 90 | −0.5697 | 1.93 | 56 | −0.2956 | 1 | ||
| - | 60 | 60 | 4.2844 | 1.93 | 56 | 2.2228 | 0.775 | ||
| - | 60 | 70 | 2.4741 | 1.84 | 56 | 1.3425 | 0.998 | ||
| - | 60 | 80 | 1.6742 | 2.06 | 56 | 0.8125 | 1 | ||
| - | 60 | 90 | −2.1365 | 2.06 | 56 | −1.0369 | 1 | ||
| - | 75 | 60 | 4.0507 | 1.84 | 56 | 2.1979 | 0.789 | ||
| - | 75 | 70 | 2.5142 | 1.84 | 56 | 1.3642 | 0.998 | ||
| - | 75 | 80 | 0.4672 | 2.06 | 56 | 0.2267 | 1 | ||
| - | 75 | 90 | −2.7375 | 2.3 | 56 | −1.1883 | 1 | ||
| - | 90 | 60 | 4.7052 | 2.06 | 56 | 2.2835 | 0.737 | ||
| - | 90 | 70 | 3.4771 | 1.93 | 56 | 1.804 | 0.952 | ||
| - | 90 | 80 | 1.0615 | 1.93 | 56 | 0.5507 | 1 | ||
| - | 90 | 90 | −1.9908 | 1.93 | 56 | −1.0329 | 1 | ||
| 45 | 60 | - | 45 | 70 | −1.571 | 1.63 | 56 | −0.9644 | 1 |
| - | 45 | 80 | −1.7418 | 1.93 | 56 | −0.9037 | 1 | ||
| - | 45 | 90 | −5.4673 | 1.78 | 56 | −3.0639 | 0.236 | ||
| - | 60 | 60 | −0.6132 | 1.78 | 56 | −0.3437 | 1 | ||
| - | 60 | 70 | −2.4235 | 1.69 | 56 | −1.4316 | 0.996 | ||
| - | 60 | 80 | −3.2234 | 1.93 | 56 | −1.6724 | 0.976 | ||
| - | 60 | 90 | −7.0341 | 1.93 | 56 | −3.6495 | 0.06 | ||
| - | 75 | 60 | −0.8469 | 1.69 | 56 | −0.5003 | 1 | ||
| - | 75 | 70 | −2.3834 | 1.69 | 56 | −1.4079 | 0.996 | ||
| - | 75 | 80 | −4.4304 | 1.93 | 56 | −2.2986 | 0.727 | ||
| - | 75 | 90 | −7.6351 | 2.19 | 56 | −3.4935 | 0.089 | ||
| - | 90 | 60 | −0.1924 | 1.93 | 56 | −0.0998 | 1 | ||
| - | 90 | 70 | −1.4205 | 1.78 | 56 | −0.7961 | 1 | ||
| - | 90 | 80 | −3.8361 | 1.78 | 56 | −2.1497 | 0.817 | ||
| - | 90 | 90 | −6.8884 | 1.78 | 56 | −3.8603 | 0.034 | ||
| 70 | - | 45 | 80 | −0.1708 | 1.78 | 56 | −0.0957 | 1 | |
| - | 45 | 90 | −3.8963 | 1.63 | 56 | −2.3919 | 0.665 | ||
| - | 60 | 60 | 0.9577 | 1.63 | 56 | 0.5879 | 1 | ||
| - | 60 | 70 | −0.8525 | 1.53 | 56 | −0.5579 | 1 | ||
| - | 60 | 80 | −1.6524 | 1.78 | 56 | −0.926 | 1 | ||
| - | 60 | 90 | −5.4631 | 1.78 | 56 | −3.0615 | 0.237 | ||
| - | 75 | 60 | 0.724 | 1.53 | 56 | 0.4738 | 1 | ||
| - | 75 | 70 | −0.8125 | 1.53 | 56 | −0.5317 | 1 | ||
| - | 75 | 80 | −2.8594 | 1.78 | 56 | −1.6024 | 0.985 | ||
| - | 75 | 90 | −6.0642 | 2.06 | 56 | −2.943 | 0.298 | ||
| - | 90 | 60 | 1.3786 | 1.78 | 56 | 0.7725 | 1 | ||
| - | 90 | 70 | 0.1504 | 1.63 | 56 | 0.0924 | 1 | ||
| - | 90 | 80 | −2.2651 | 1.63 | 56 | −1.3905 | 0.997 | ||
| - | 90 | 90 | −5.3175 | 1.63 | 56 | −3.2643 | 0.154 | ||
| 80 | - | 45 | 90 | −3.7255 | 1.93 | 56 | −1.9329 | 0.914 | |
| - | 60 | 60 | 1.1286 | 1.93 | 56 | 0.5855 | 1 | ||
| - | 60 | 70 | −0.6817 | 1.84 | 56 | −0.3699 | 1 | ||
| - | 60 | 80 | −1.4816 | 2.06 | 56 | −0.719 | 1 | ||
| - | 60 | 90 | −5.2923 | 2.06 | 56 | −2.5684 | 0.54 | ||
| - | 75 | 60 | 0.8949 | 1.84 | 56 | 0.4855 | 1 | ||
| - | 75 | 70 | −0.6416 | 1.84 | 56 | −0.3482 | 1 | ||
| - | 75 | 80 | −2.6886 | 2.06 | 56 | −1.3048 | 0.999 | ||
| - | 75 | 90 | −5.8933 | 2.3 | 56 | −2.5582 | 0.547 | ||
| - | 90 | 60 | 1.5494 | 2.06 | 56 | 0.752 | 1 | ||
| - | 90 | 70 | 0.3213 | 1.93 | 56 | 0.1667 | 1 | ||
| - | 90 | 80 | −2.0943 | 1.93 | 56 | −1.0866 | 1 | ||
| - | 90 | 90 | −5.1466 | 1.93 | 56 | −2.6702 | 0.469 | ||
| 90 | - | 60 | 60 | 4.8541 | 1.78 | 56 | 2.7202 | 0.435 | |
| - | 60 | 70 | 3.0438 | 1.69 | 56 | 1.798 | 0.953 | ||
| - | 60 | 80 | 2.2439 | 1.93 | 56 | 1.1642 | 1 | ||
| - | 60 | 90 | −1.5668 | 1.93 | 56 | −0.8129 | 1 | ||
| - | 75 | 60 | 4.6204 | 1.69 | 56 | 2.7293 | 0.429 | ||
| - | 75 | 70 | 3.0839 | 1.69 | 56 | 1.8217 | 0.948 | ||
| - | 75 | 80 | 1.0369 | 1.93 | 56 | 0.538 | 1 | ||
| - | 75 | 90 | −2.1678 | 2.19 | 56 | −0.9919 | 1 | ||
| - | 90 | 60 | 5.2749 | 1.93 | 56 | 2.7368 | 0.424 | ||
| - | 90 | 70 | 4.0468 | 1.78 | 56 | 2.2678 | 0.747 | ||
| - | 90 | 80 | 1.6312 | 1.78 | 56 | 0.9141 | 1 | ||
| - | 90 | 90 | −1.4211 | 1.78 | 56 | −0.7964 | 1 | ||
| 60 | 60 | - | 60 | 70 | −1.8103 | 1.69 | 56 | −1.0693 | 1 |
| - | 60 | 80 | −2.6101 | 1.93 | 56 | −1.3542 | 0.998 | ||
| - | 60 | 90 | −6.4209 | 1.93 | 56 | −3.3313 | 0.132 | ||
| - | 75 | 60 | −0.2337 | 1.69 | 56 | −0.1381 | 1 | ||
| - | 75 | 70 | −1.7702 | 1.69 | 56 | −1.0457 | 1 | ||
| - | 75 | 80 | −3.8172 | 1.93 | 56 | −1.9805 | 0.897 | ||
| - | 75 | 90 | −7.0219 | 2.19 | 56 | −3.213 | 0.173 | ||
| - | 90 | 60 | 0.4208 | 1.93 | 56 | 0.2183 | 1 | ||
| - | 90 | 70 | −0.8073 | 1.78 | 56 | −0.4524 | 1 | ||
| - | 90 | 80 | −3.2229 | 1.78 | 56 | −1.8061 | 0.951 | ||
| - | 90 | 90 | −6.2752 | 1.78 | 56 | −3.5166 | 0.084 | ||
| 70 | - | 60 | 80 | −0.7999 | 1.84 | 56 | −0.434 | 1 | |
| - | 60 | 90 | −4.6106 | 1.84 | 56 | −2.5017 | 0.587 | ||
| - | 75 | 60 | 1.5765 | 1.6 | 56 | 0.9878 | 1 | ||
| - | 75 | 70 | 0.0401 | 1.6 | 56 | 0.0251 | 1 | ||
| - | 75 | 80 | −2.0069 | 1.84 | 56 | −1.089 | 1 | ||
| - | 75 | 90 | −5.2117 | 2.11 | 56 | −2.4683 | 0.611 | ||
| - | 90 | 60 | 2.2311 | 1.84 | 56 | 1.2106 | 0.999 | ||
| - | 90 | 70 | 1.003 | 1.69 | 56 | 0.5925 | 1 | ||
| - | 90 | 80 | −1.4126 | 1.69 | 56 | −0.8344 | 1 | ||
| - | 90 | 90 | −4.4649 | 1.69 | 56 | −2.6375 | 0.492 | ||
| 80 | - | 60 | 90 | −3.8107 | 2.06 | 56 | −1.8494 | 0.94 | |
| - | 75 | 60 | 2.3764 | 1.84 | 56 | 1.2895 | 0.999 | ||
| - | 75 | 70 | 0.8399 | 1.84 | 56 | 0.4557 | 1 | ||
| - | 75 | 80 | −1.207 | 2.06 | 56 | −0.5858 | 1 | ||
| - | 75 | 90 | −4.4118 | 2.3 | 56 | −1.9151 | 0.92 | ||
| - | 90 | 60 | 3.031 | 2.06 | 56 | 1.471 | 0.994 | ||
| - | 90 | 70 | 1.8028 | 1.93 | 56 | 0.9354 | 1 | ||
| - | 90 | 80 | −0.6127 | 1.93 | 56 | −0.3179 | 1 | ||
| - | 90 | 90 | −3.6651 | 1.93 | 56 | −1.9015 | 0.925 | ||
| 90 | - | 75 | 60 | 6.1872 | 1.84 | 56 | 3.3572 | 0.124 | |
| - | 75 | 70 | 4.6507 | 1.84 | 56 | 2.5235 | 0.572 | ||
| - | 75 | 80 | 2.6037 | 2.06 | 56 | 1.2636 | 0.999 | ||
| - | 75 | 90 | −0.601 | 2.3 | 56 | −0.2609 | 1 | ||
| - | 90 | 60 | 6.8417 | 2.06 | 56 | 3.3204 | 0.135 | ||
| - | 90 | 70 | 5.6136 | 1.93 | 56 | 2.9125 | 0.315 | ||
| - | 90 | 80 | 3.198 | 1.93 | 56 | 1.6592 | 0.978 | ||
| - | 90 | 90 | 0.1457 | 1.93 | 56 | 0.0756 | 1 | ||
| 75 | 60 | - | 75 | 70 | −1.5365 | 1.6 | 56 | −0.9627 | 1 |
| - | 75 | 80 | −3.5835 | 1.84 | 56 | −1.9444 | 0.91 | ||
| - | 75 | 90 | −6.7882 | 2.11 | 56 | −3.215 | 0.172 | ||
| - | 90 | 60 | 0.6545 | 1.84 | 56 | 0.3552 | 1 | ||
| - | 90 | 70 | −0.5736 | 1.69 | 56 | −0.3388 | 1 | ||
| - | 90 | 80 | −2.9891 | 1.69 | 56 | −1.7657 | 0.96 | ||
| - | 90 | 90 | −6.0415 | 1.69 | 56 | −3.5688 | 0.074 | ||
| 70 | - | 75 | 80 | −2.047 | 1.84 | 56 | −1.1107 | 1 | |
| - | 75 | 90 | −5.2517 | 2.11 | 56 | −2.4873 | 0.598 | ||
| - | 90 | 60 | 2.191 | 1.84 | 56 | 1.1889 | 1 | ||
| - | 90 | 70 | 0.9629 | 1.69 | 56 | 0.5688 | 1 | ||
| - | 90 | 80 | −1.4527 | 1.69 | 56 | −0.8581 | 1 | ||
| - | 90 | 90 | −4.505 | 1.69 | 56 | −2.6611 | 0.475 | ||
| 80 | - | 75 | 90 | −3.2047 | 2.3 | 56 | −1.3911 | 0.997 | |
| - | 90 | 60 | 4.238 | 2.06 | 56 | 2.0568 | 0.864 | ||
| - | 90 | 70 | 3.0099 | 1.93 | 56 | 1.5616 | 0.988 | ||
| - | 90 | 80 | 0.5943 | 1.93 | 56 | 0.3083 | 1 | ||
| - | 90 | 90 | −2.458 | 1.93 | 56 | −1.2753 | 0.999 | ||
| 90 | - | 90 | 60 | 7.4427 | 2.3 | 56 | 3.2308 | 0.166 | |
| - | 90 | 70 | 6.2146 | 2.19 | 56 | 2.8436 | 0.356 | ||
| - | 90 | 80 | 3.7991 | 2.19 | 56 | 1.7383 | 0.966 | ||
| - | 90 | 90 | 0.7467 | 2.19 | 56 | 0.3417 | 1 | ||
| 90 | 60 | - | 90 | 70 | −1.2281 | 1.93 | 56 | −0.6372 | 1 |
| - | 90 | 80 | −3.6437 | 1.93 | 56 | −1.8904 | 0.928 | ||
| - | 90 | 90 | −6.696 | 1.93 | 56 | −3.4741 | 0.094 | ||
| 70 | - | 90 | 80 | −2.4156 | 1.78 | 56 | −1.3537 | 0.998 | |
| - | 90 | 90 | −5.4679 | 1.78 | 56 | −3.0642 | 0.236 | ||
| 80 | - | 90 | 90 | −3.0524 | 1.78 | 56 | −1.7105 | 0.971 | |

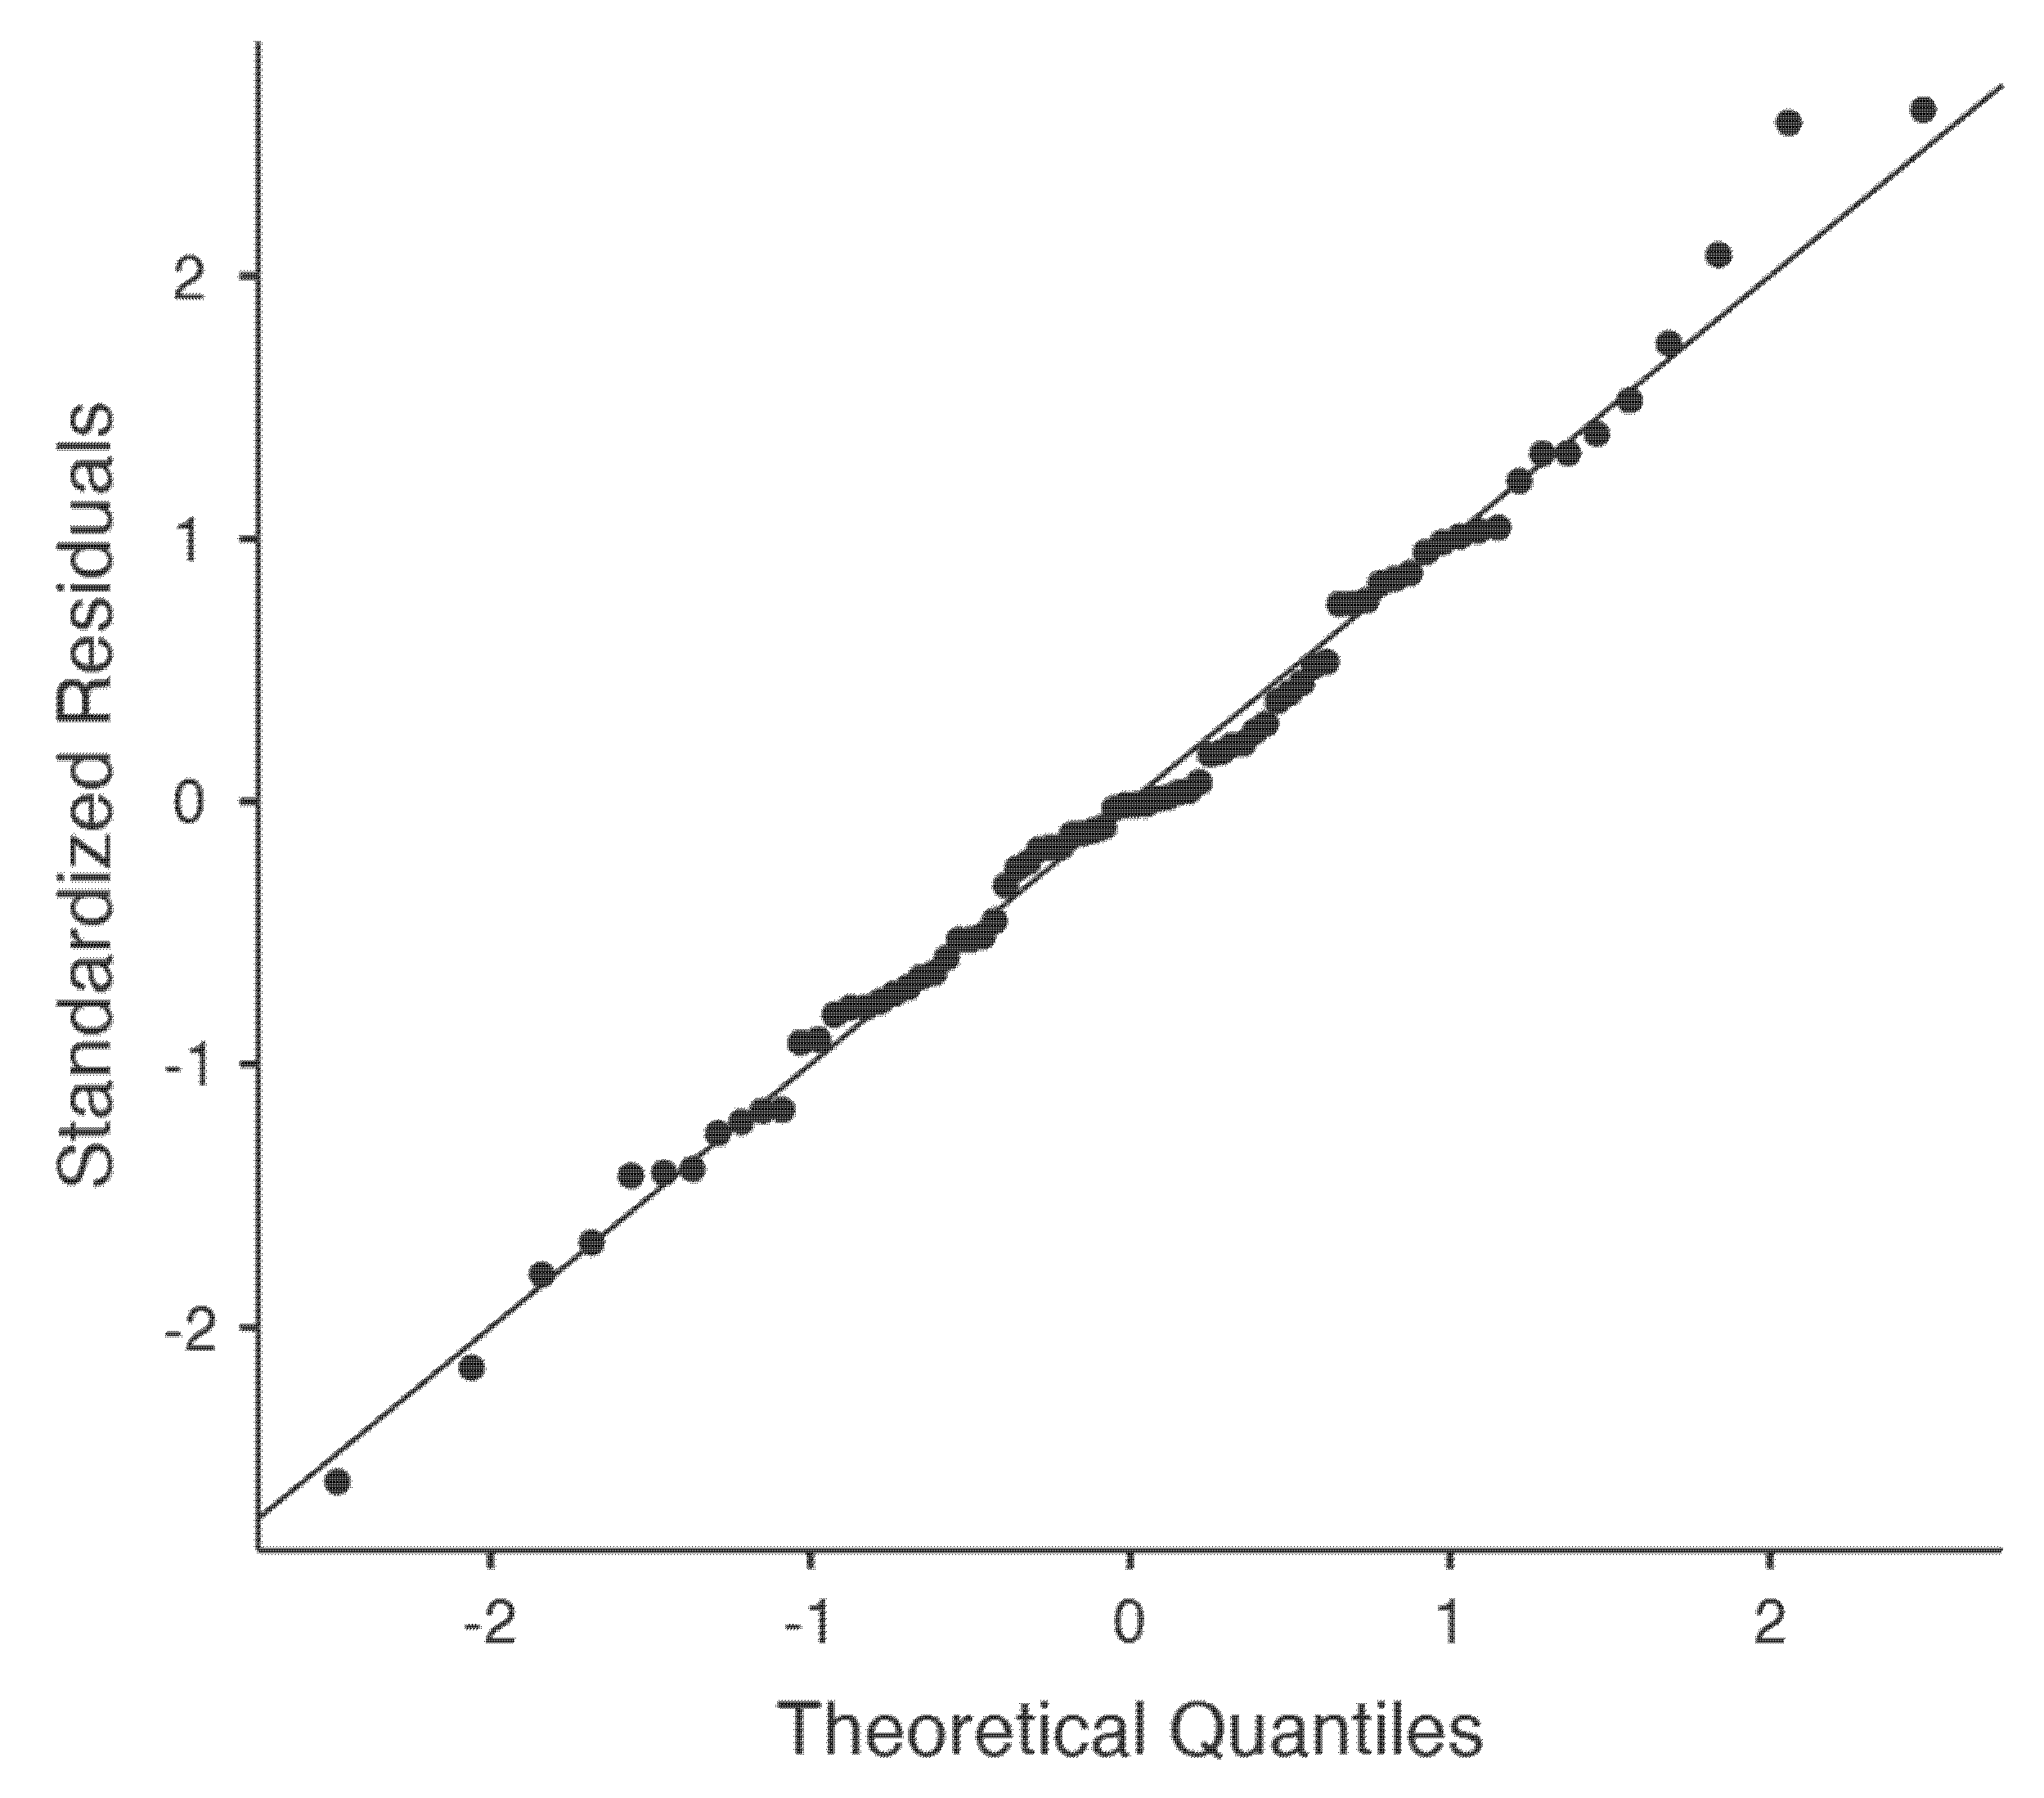
| Normality Test (Shapiro-Wilk) | |
|---|---|
| Statistic | p |
| 0.991 | 0.88 |
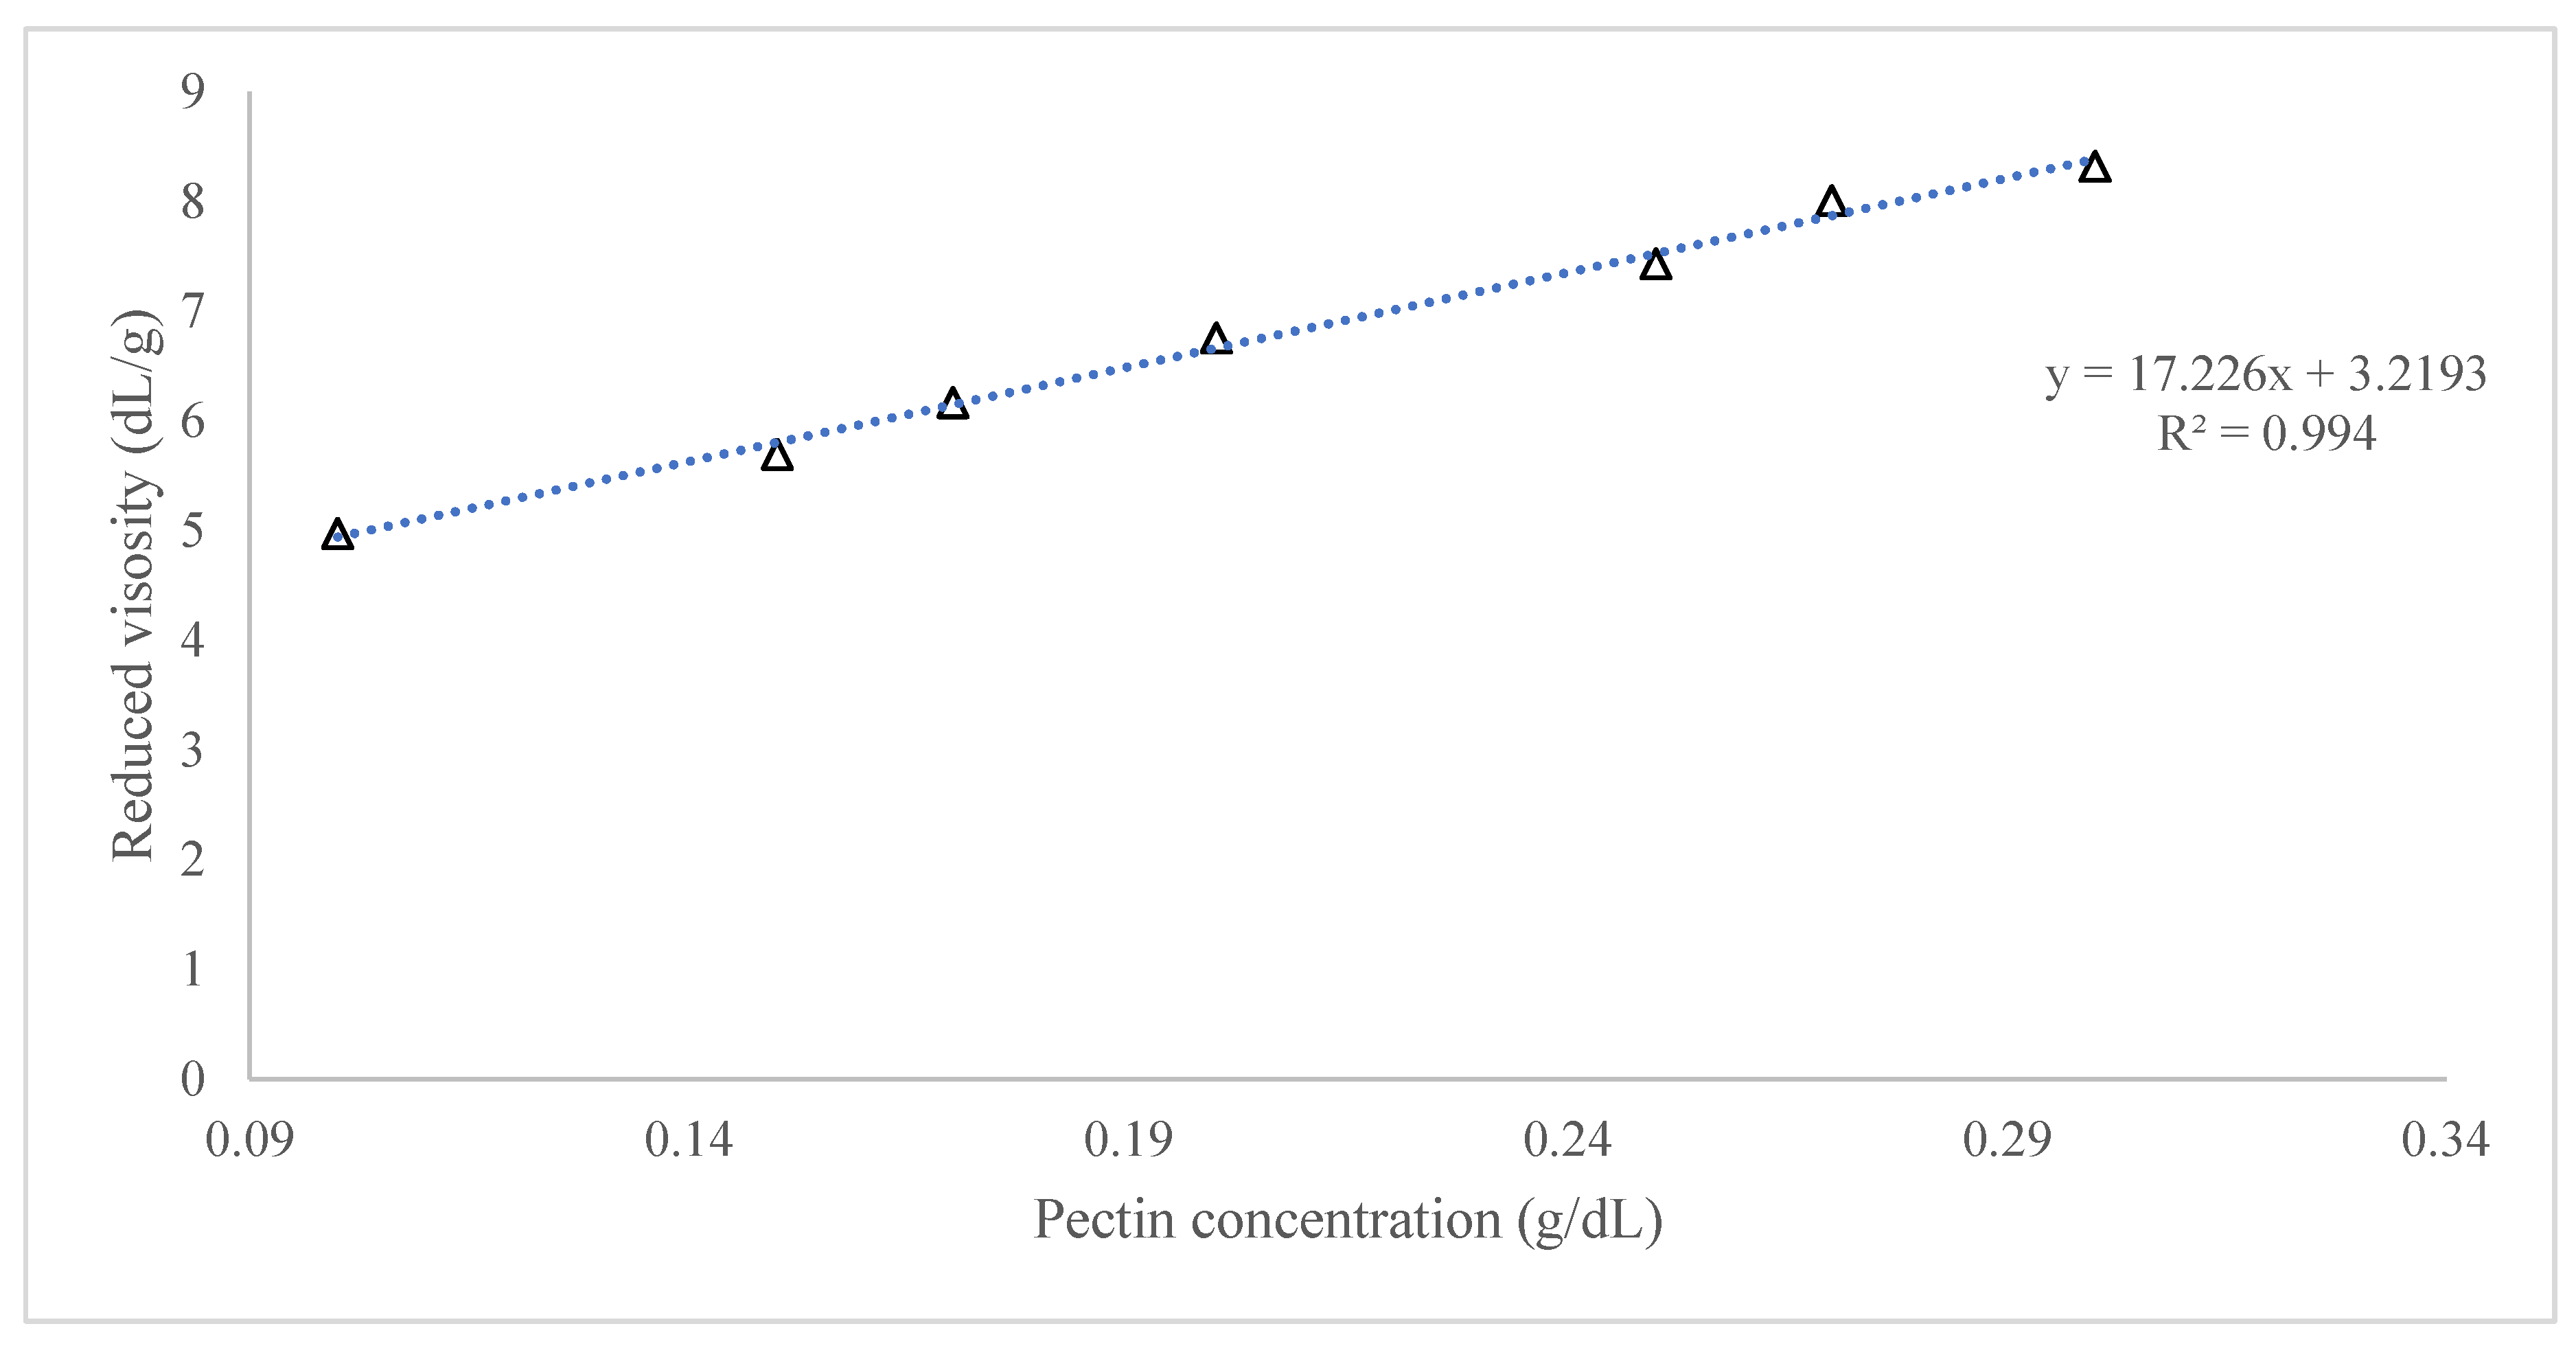
| Solution | Viscosity (Pa.s) | Relative Viscosity | Specific Viscosity | Reduced Viscosity |
|---|---|---|---|---|
| Solvente NaCl (0.1 M) | 8.05750 × 10⁻⁴ | - | - | - |
| 0.1% | 1.20634 × 10⁻³ | 1.49717 | 4.97167 × 10⁻¹ | 4.971668981 |
| 0.15% | 1.49367 × 10⁻³ | 1.85376 | 8.53758 × 10⁻¹ | 5.691721544 |
| 0.17% | 1.65053 × 10⁻³ | 2.048441847 | 1.04844 | 6.167304982 |
| 0.20% | 1.89412 × 10⁻³ | 2.35076 | 1.35076 | 6.753783007 |
| 0.25% | 2.30238 × 10⁻³ | 2.857433846 | 1.85743 | 7.429735385 |
| 0.27% | 2.54787 × 10⁻³ | 3.162115961 | 2.16212 | 8.007836894 |
| 0.30% | 2.81661 × 10⁻³ | 3.49564 | 2.49564 | 8.318812952 |

References
- Perez, S.C.; Chanona-Pérez, J.; Vera, N.G.; Cybulska, J.; Szymanska-Chargot, M.; Chylinska, M.; Kozioł, A.; Gawkowska, D.; Pieczywek, P.; Zdunek, A. Structural, mechanical and enzymatic study of pectin and cellulose during mango ripening. Carbohydr. Polym. 2018, 196, 313–321. [Google Scholar] [CrossRef]
- SAGARPA Atlas Agroalimentario 2012–2018. 2018, Volume 1. Available online: https://nube.siap.gob.mx/gobmx_publicaciones_siap/pag/2018/Atlas-Agroalimentario-2018 (accessed on 3 September 2021).
- Arun, K.B.; Madhavan, A.; Sindhu, R.; Binod, P.; Pandey, A.; R, R.; Sirohi, R. Remodeling agro-industrial and food wastes into value-added bioactives and biopolymers. Ind. Crops Prod. 2020, 154, 112621. [Google Scholar] [CrossRef]
- Patrón-Vázquez, J.; Baas-Dzul, L.; Medina-Torres, N.; Ayora-Talavera, T.; Sánchez-Contreras, Á.; García-Cruz, U.; Pacheco, N. The Effect of Drying Temperature on the Phenolic Content and Functional Behavior of Flours Obtained from Lemon Wastes. Agronomy 2019, 9, 474. [Google Scholar] [CrossRef] [Green Version]
- Arora, A.; Banerjee, J.; Vijayaraghavan, R.; MacFarlane, D.; Patti, A. Process design and techno-economic analysis of an integrated mango processing waste biorefinery. Ind. Crops Prod. 2018, 116, 24–34. [Google Scholar] [CrossRef]
- Khotimchenko, M. Pectin polymers for colon-targeted antitumor drug delivery. Int. J. Biol. Macromol. 2020, 158, 1110–1124. [Google Scholar] [CrossRef] [PubMed]
- Baldino, N.; Mileti, O.; Lupi, F.R.; Gabriele, D. Rheological surface properties of commercial citrus pectins at different pH and concentration. LWT-Food Sci. Technol. 2018, 93, 124–130. [Google Scholar] [CrossRef]
- Picot-Allain, M.C.N.; Ramasawmy, B.; Emmambux, M.N. Extraction, Characterisation, and Application of Pectin from Tropical and Sub-Tropical Fruits: A Review. Food Rev. Int. 2020, 1, 1–31. [Google Scholar] [CrossRef]
- Senit, J.J.; Velasco, D.; Manrique, A.G.; Sanchez-Barba, M.; Toledo, J.M.; Santos, V.E.; Garcia-Ochoa, F.; Yustos, P.; Ladero, M. Orange peel waste upstream integrated processing to terpenes, phenolics, pectin and monosaccharides: Optimization approaches. Ind. Crops Prod. 2019, 134, 370–381. [Google Scholar] [CrossRef]
- Mellinas, C.; Ramos, M.; Jiménez, A.; Garrigós, M.C. Recent Trends in the Use of Pectin from Agro-Waste Residues as a Natural-Based Biopolymer for Food Packaging Applications. Materials 2020, 13, 673. [Google Scholar] [CrossRef] [PubMed] [Green Version]
- Mudgil, D. The Interaction Between Insoluble and Soluble Fiber. In Dietary Fiber for the Prevention of Cardiovascular Disease; Samaan, R., Ed.; Elsevier: Amsterdam, The Netherlands, 2017; pp. 35–59. ISBN 9780128052754. [Google Scholar]
- Polanco-Lugo, E.; Martínez-Castillo, J.I.; Cuevas-Bernardino, J.C.; González-Flores, T.; Valdez-Ojeda, R.; Pacheco, N.; Ayora-Talavera, T. Citrus pectin obtained by ultrasound-assisted extraction: Physicochemical, structural, rheological and functional properties. CyTA-J. Food 2019, 17, 463–471. [Google Scholar] [CrossRef]
- Khademian, E.; Salehi, E.; Sanaeepur, H.; Galiano, F.; Figoli, A. A systematic review on carbohydrate biopolymers for adsorptive remediation of copper ions from aqueous environments-part A: Classification and modification strategies. Sci. Total Environ. 2020, 738, 139829. [Google Scholar] [CrossRef]
- Caroço, R.F.; Kim, B.; Santacoloma, P.A.; Abildskov, J.; Lee, J.H.; Huusom, J.K. Analysis and model-based optimization of a pectin extraction process. J. Food Eng. 2019, 244, 159–169. [Google Scholar] [CrossRef] [Green Version]
- Morris, G.A.; de la Torre, J.G.; Ortega, A.; Castile, J.; Smith, A.; Harding, S.E. Molecular flexibility of citrus pectins by combined sedimentation and viscosity analysis. Food Hydrocoll. 2008, 22, 1435–1442. [Google Scholar] [CrossRef] [Green Version]
- Chan, S.Y.; Choo, W.S.; Young, D.J.; Loh, X.J. Pectin as a rheology modifier: Origin, structure, commercial production and rheology. Carbohydr. Polym. 2017, 161, 118–139. [Google Scholar] [CrossRef]
- Dranca, F.; Oroian, M. Extraction, purification and characterization of pectin from alternative sources with potential technological applications. Food Res. Int. 2018, 113, 327–350. [Google Scholar] [CrossRef]
- Wang, M.; Huang, B.; Fan, C.; Zhao, K.; Hu, H.; Xu, X.; Pan, S.; Liu, F. Characterization and functional properties of mango peel pectin extracted by ultrasound assisted citric acid. Int. J. Biol. Macromol. 2016, 91, 794–803. [Google Scholar] [CrossRef]
- Santos, E.E.; Amaro, R.C.; Bustamante, C.C.C.; Guerra, M.H.A.; Soares, L.C.; Froes, R.E.S. Extraction of pectin from agroindustrial residue with an ecofriendly solvent: Use of FTIR and chemometrics to differentiate pectins according to degree of methyl esterification. Food Hydrocoll. 2020, 107, 105921. [Google Scholar] [CrossRef]
- Cho, E.-H.; Jung, H.-T.; Lee, B.-H.; Kim, H.-S.; Rhee, J.-K.; Yoo, S.-H. Green process development for apple-peel pectin production by organic acid extraction. Carbohydr. Polym. 2019, 204, 97–103. [Google Scholar] [CrossRef]
- Sun, D.; Chen, X.; Zhu, C. Physicochemical properties and antioxidant activity of pectin from hawthorn wine pomace: A comparison of different extraction methods. Int. J. Biol. Macromol. 2020, 158, 1239–1247. [Google Scholar] [CrossRef] [PubMed]
- Dranca, F.; Vargas, M.; Oroian, M. Physicochemical properties of pectin from Malus domestica ‘Fălticeni’ apple pomace as affected by non-conventional extraction techniques. Food Hydrocoll. 2020, 100, 105383. [Google Scholar] [CrossRef]
- Kermani, Z.J.; Shpigelman, A.; Pham, T.T.H.; Van Loey, A.; Hendrickx, M.E. Functional properties of citric acid extracted mango peel pectin as related to its chemical structure. Food Hydrocoll. 2015, 44, 424–434. [Google Scholar] [CrossRef]
- Sengar, A.S.; Rawson, A.; Muthiah, M.; Kalakandan, S.K. Comparison of different ultrasound assisted extraction techniques for pectin from tomato processing waste. Ultrason. Sonochem. 2020, 61, 104812. [Google Scholar] [CrossRef] [PubMed]
- Zaid, R.M.; Mishra, P.; Tabassum, S.; Ab Wahid, Z.; Sakinah, A.M. High methoxyl pectin extracts from Hylocereus polyrhizus’s peels: Extraction kinetics and thermodynamic studies. Int. J. Biol. Macromol. 2019, 141, 1147–1157. [Google Scholar] [CrossRef]
- Panchev, I.; Kirtchev, N.; Kratchanov, C. Kinetic model of pectin extraction. Carbohydr. Polym. 1989, 11, 193–204. [Google Scholar] [CrossRef]
- Castañeda-Valbuena, D.; Ayora-Talavera, T.; Luján-Hidalgo, C.; Álvarez-Gutiérrez, P.; Martínez-Galero, N.; Meza-Gordillo, R. Ultrasound extraction conditions effect on antioxidant capacity of mango by-product extracts. Food Bioprod. Process. 2021, 127, 212–224. [Google Scholar] [CrossRef]
- Amin, S.K.; Hawash, S.; Diwani, G.E.; Rafei, S.E. Kinetics and Thermodynamics of Oil Extraction from Jatropha Curcas in Aqueous Kinetics and Thermodynamics of Oil Extraction from Jatropha Curcas in Aqueous Acidic Hexane Solutions. J. Am. Sci. 2010, 6, 11. [Google Scholar]
- AOAC Official Methods of Analysis, 18th ed.; AOAC: Gaithersburg, MD, USA, 2005.
- Strydom, D.J. Chromatographic separation of 1-phenyl-3-methyl-5-pyrazolone-derivatized neutral, acidic and basic aldoses. J. Chromatogr. A 1994, 678, 17–23. [Google Scholar] [CrossRef]
- Chen, J.; Cheng, H.; Zhi, Z.; Zhang, H.; Linhardt, R.J.; Zhang, F.; Chen, S.; Ye, X. Extraction temperature is a decisive factor for the properties of pectin. Food Hydrocoll. 2021, 112, 106160. [Google Scholar] [CrossRef]
- Kazemi, M.; Khodaiyan, F.; Hosseini, S.S. Utilization of food processing wastes of eggplant as a high potential pectin source and characterization of extracted pectin. Food Chem. 2019, 294, 339–346. [Google Scholar] [CrossRef]
- Trujillo-Ramírez, D.; Lobato-Calleros, C.; Román-Guerrero, A.; Hernández-Rodríguez, L.; Alvarez-Ramirez, J.; Vernon-Carter, E.J. Complexation with whey protein hydrolysate improves cacao pods husk pectin surface active and emulsifying properties. React. Funct. Polym. 2018, 123, 61–69. [Google Scholar] [CrossRef]
- Reichembach, L.H.; Petkowicz, C.L.D.O. Extraction and characterization of a pectin from coffee (Coffea arabica L.) pulp with gelling properties. Carbohydr. Polym. 2020, 245, 116473. [Google Scholar] [CrossRef]
- Liu, L.; Cao, J.; Huang, J.; Cai, Y.; Yao, J. Extraction of pectins with different degrees of esterification from mulberry branch bark. Bioresour. Technol. 2010, 101, 3268–3273. [Google Scholar] [CrossRef]
- Ayora-Talavera, T.D.R.; Ramos-Chan, C.A.; Covarrubias-Cárdenas, A.G.; Sánchez-Contreras, A.; García-Cruz, U.; Pacheco L, N.A. Evaluation of Pectin Extraction Conditions and Polyphenol Profile from Citrus x lantifolia Waste: Potential Application as Functional Ingredients. Agriculture 2017, 7, 28. [Google Scholar] [CrossRef] [Green Version]
- Nguyen, H.H.D.; Nguyen, H.V.H.; Savage, G.P.; Nguyen; Nguyen, H.D.H. Properties of Pectin Extracted from Vietnamese Mango Peels. Foods 2019, 8, 629. [Google Scholar] [CrossRef] [PubMed] [Green Version]
- Reyna-Urrutia, V.A.; Mata-Haro, V.; Cauich-Rodriguez, J.V.; Herrera-Kao, W.A.; Cervantes-Uc, J.M. Effect of two crosslinking methods on the physicochemical and biological properties of the collagen-chitosan scaffolds. Eur. Polym. J. 2019, 117, 424–433. [Google Scholar] [CrossRef]
- Pappas, C.S.; Malovikova, A.; Hromadkova, Z.; Tarantilis, P.; Ebringerova, A.; Polissiou, M.G. Determination of the degree of esterification of pectinates with decyl and benzyl ester groups by diffuse reflectance infrared Fourier transform spectroscopy (DRIFTS) and curve-fitting deconvolution method. Carbohydr. Polym. 2004, 56, 465–469. [Google Scholar] [CrossRef]
- Güzel, M. Akpınar, Özlem Valorisation of fruit by-products: Production characterization of pectins from fruit peels. Food Bioprod. Process. 2019, 115, 126–133. [Google Scholar] [CrossRef]
- Chuc-Gamboa, M.G.; Vargas-Coronado, R.F.; Cervantes-Uc, J.M.; Cauich-Rodríguez, J.V.; Escobar-García, D.M.; Pozos-Guillén, A.; Del Barrio, J.S.R. The Effect of PEGDE Concentration and Temperature on Physicochemical and Biological Properties of Chitosan. Polymers 2019, 11, 1830. [Google Scholar] [CrossRef] [Green Version]
- Sucheta; Misra, N.; Yadav, S.K. Extraction of pectin from black carrot pomace using intermittent microwave, ultrasound and conventional heating: Kinetics, characterization and process economics. Food Hydrocoll. 2020, 102, 105592. [Google Scholar] [CrossRef]
- Matharu, A.S.; Houghton, J.A.; Lucas-Torres, C.; Moreno, A. Acid-free microwave-assisted hydrothermal extraction of pectin and porous cellulose from mango peel waste—Towards a zero waste mango biorefinery. Green Chem. 2016, 18, 5280–5287. [Google Scholar] [CrossRef] [Green Version]
- Mugwagwa, L.; Chimphango, A. Box-Behnken design based multi-objective optimisation of sequential extraction of pectin and anthocyanins from mango peels. Carbohydr. Polym. 2019, 219, 29–38. [Google Scholar] [CrossRef] [PubMed]
- Kermani, Z.J.; Shpigelman, A.; Kyomugasho, C.; Van Buggenhout, S.; Ramezani, M.; Van Loey, A.; Hendrickx, M.E. The impact of extraction with a chelating agent under acidic conditions on the cell wall polymers of mango peel. Food Chem. 2014, 161, 199–207. [Google Scholar] [CrossRef] [PubMed]
- Einhorn-Stoll, U.; Kastner, H.; Fatouros, A.; Krähmer, A.; Kroh, L.W.; Drusch, S. Thermal degradation of citrus pectin in low-moisture environment – Investigation of backbone depolymerisation. Food Hydrocoll. 2020, 107, 105937. [Google Scholar] [CrossRef]
- Yang, X.; Nisar, T.; Hou, Y.; Gou, X.; Sun, L.; Guo, Y. Pomegranate peel pectin can be used as an effective emulsifier. Food Hydrocoll. 2018, 85, 30–38. [Google Scholar] [CrossRef]
- Revell, L.E.; Williamson, B.E. Why Are Some Reactions Slower at Higher Temperatures? J. Chem. Educ. 2013, 90, 1024–1027. [Google Scholar] [CrossRef]
- Wusigale; Liang, L.; Luo, Y. Casein and pectin: Structures, interactions, and applications. Trends Food Sci. Technol. 2020, 97, 391–403. [Google Scholar] [CrossRef]
- Cuevas-Bernardino, J.C.; Lobato-Calleros, C.; Román-Guerrero, A.; Alvarez-Ramirez, J.; Vernon-Carter, E. Physicochemical characterisation of hawthorn pectins and their performing in stabilising oil-in-water emulsions. React. Funct. Polym. 2016, 103, 63–71. [Google Scholar] [CrossRef]
- Humerez-Flores, J.N.; Kyomugasho, C.; Gutiérrez-Ortiz, A.A.; De Bie, M.; Panozzo, A.; Van Loey, A.M.; Moldenaers, P.; Hendrickx, M.E. Production and molecular characterization of tailored citrus pectin-derived compounds. Food Chem. 2021, 367, 130635. [Google Scholar] [CrossRef]
- Maldonado-Celis, M.E.; Yahia, E.M.; Bedoya, R.; Landázuri, P.; Loango, N.; Aguillón, J.; Restrepo, B.; Ospina, J.C.G. Chemical Composition of Mango (Mangifera indica L.) Fruit: Nutritional and Phytochemical Compounds. Front. Plant Sci. 2019, 10, 1073. [Google Scholar] [CrossRef]
- Hosseini, S.S.; Khodaiyan, F.; Kazemi, M.; Najari, Z. Optimization and characterization of pectin extracted from sour orange peel by ultrasound assisted method. Int. J. Biol. Macromol. 2019, 125, 621–629. [Google Scholar] [CrossRef]
- May, C.D. Industrial pectins: Sources, production and applications. Carbohydr. Polym. 1990, 12, 79–99. [Google Scholar] [CrossRef]
- Kute, A.B.; Mohapatra, D.; Kotwaliwale, N.; Giri, S.K.; Sawant, B.P. Characterization of Pectin Extracted from Orange Peel Powder using Microwave-Assisted and Acid Extraction Methods. Agric. Res. 2020, 9, 241–248. [Google Scholar] [CrossRef]
- Kamal, M.; Ali, R.; Hossain, A.; Shishir, M.R.I. Optimization of microwave-assisted extraction of pectin from Dillenia indica fruit and its preliminary characterization. J. Food Process. Preserv. 2020, 44, 1–11. [Google Scholar] [CrossRef]
- Wongkaew, M.; Sommano, S.R.; Tangpao, T.; Rachtanapun, P.; Jantanasakulwong, K. Mango Peel Pectin by Microwave-Assisted Extraction and Its Use as Fat Replacement in Dried Chinese Sausage. Foods 2020, 9, 450. [Google Scholar] [CrossRef] [Green Version]
- Ramli, N. Effect of ammonium oxalate and acetic acid at several extraction time and pH on some physicochemical properties of pectin from cocoa husks (Theobroma cacao). Afr. J. Food Sci. 2011, 5, 790–798. [Google Scholar] [CrossRef]
- Wongkaew, M.; Kittiwachana, S.; Phuangsaijai, N.; Tinpovong, B.; Tiyayon, C.; Sommano, S.R.; Cheewangkoon, R. Relationships with Mango Peel Pectin Quality. Sustain. Recover. Bio-Active Compd. from Fruits Veg. 2021, 10, 1–20. [Google Scholar]
- Hernández-Martínez, R.; Valdivia-Rivera, S.; Betto-Sagahon, J.; Coreño-Alonso, A.; Tzintzun-Camacho, O.; Lizardi-Jiménez, M.A. Solubilization and Removal of Petroleum Hydrocarbons by a Native Microbial Biomas in a Bubble Column Reactor. Rev. Mex. Ing. Qum. 2019, 18, 181–189. [Google Scholar] [CrossRef]
- Muhoza, B.; Xia, S.; Cai, J.; Zhang, X.; Duhoranimana, E.; Su, J. Gelatin and pectin complex coacervates as carriers for cinnamaldehyde: Effect of pectin esterification degree on coacervate formation, and enhanced thermal stability. Food Hydrocoll. 2019, 87, 712–722. [Google Scholar] [CrossRef]
- Wang, W.; Chen, F.; Wang, Y.; Wang, L.; Fu, H.; Zheng, F.; Beecher, L. Optimization of reactions between reducing sugars and 1-phenyl-3-methyl-5-pyrazolone (PMP) by response surface methodology. Food Chem. 2018, 254, 158–164. [Google Scholar] [CrossRef]
- Nahar, K.; Haque, M.; Nada, K.; Uddin, M.; Al Mansur, M.A.; Khatun, N.; Jabin, S. Pectin from ripe peels of mango cultivars. Bangladesh J. Sci. Ind. Res. 2017, 52, 229–238. [Google Scholar] [CrossRef]
- Wathoni, N.; Shan, C.Y.; Shan, W.Y.; Rostinawati, T.; Indradi, R.B.; Pratiwi, R.; Muchtaridi, M. Characterization and antioxidant activity of pectin from Indonesian mangosteen (Garcinia mangostana L.) rind. Heliyon 2019, 5, e02299. [Google Scholar] [CrossRef] [PubMed]
- Moreira, R.; Teixeira, J.A.; Furuyama-Lima, A.; de Souza, N.; Siqueira, A. Preparation, characterization and evaluation of drug-delivery systems: Pectin and mefenamic acid films. Thermochim. Acta 2014, 590, 100–106. [Google Scholar] [CrossRef]
- IMARC Pectin Market: Global Industry Trends, Share, Size, Growth, Opportunity and Forecast 2020–2025. Available online: https://www.imarcgroup.com/pectin-technical-material-market-report (accessed on 30 November 2020).
- Markets and Markets Pectin Market by Type (HM Pectin, LM Pectin), Raw Material (Citrus fruits, Apples, Sugar beet), Function, Application (Food & beverages, Pharmaceutical & Personal Care Products, Industrial Applications), and Region-Global Forecast to 2025. Available online: https://www.marketsandmarkets.com/Market-Reports/pectin-market-139129149.html (accessed on 30 November 2020).


| Time (min) | A (%) | B (%) |
|---|---|---|
| 0 | 100 | 0 |
| 5 | 80 | 20 |
| 27 | 55 | 45 |
| 30 | 90 | 10 |
| Temperature (°C) | Time (min) | Yield (%) |
|---|---|---|
| 60 (a) | 30 | 4.64 ± 0.62 |
| 45 | 6.19 ± 0.84 | |
| 60 | 6.80 ± 0.40 | |
| 75 | 7.03 ± 0.77 | |
| 90 | 6.38 ± 0.21 | |
| 70 (ab) | 30 | 6.90 ± 0.73 |
| 45 | 7.76 ± 0.47 | |
| 60 | 8.61 ± 1.09 | |
| 75 | 8.57 ± 0.93 | |
| 90 | 7.61 ± 0.80 | |
| 80 (b) | 30 | 7.37 ± 1.82 |
| 45 | 7.93 ± 2.19 | |
| 60 | 9.41 ± 0.62 | |
| 75 | 10.62 ± 1.62 | |
| 90 | 10.02 ± 1.08 | |
| 90 (c) | 30 | 11.08 ± 1.23 |
| 45 | 11.65 ± 2.04 | |
| 60 | 13.22 ± 2.73 | |
| 75 | 13.82 ± 2.18 | |
| 90 | 13.07 ± 2.17 |
| Temperature (°C) | PE (%) | k1 (min−1) | k2 (min−1) | tmax (min) | Ymax (%) | R2 | Ea1 (kJ/mol) | Ea2 (kJ/mol) |
|---|---|---|---|---|---|---|---|---|
| 60 | 9.00 | 0.02958 | 0.00349 | 81.89 | 7.93 | 0.8778 | 5.53 | −29.13 |
| 70 | 11.00 | 0.03333 | 0.00397 | 72.45 | 9.69 | 0.8234 | ||
| 80 | 11.66 | 0.03118 | 0.00100 | 113.97 | 10.79 | 0.8688 | ||
| 90 | 16.00 | 0.03635 | 0.00213 | 82.89 | 14.39 | 0.9213 |
| Temperature (°C) | ΔH#1 (kJ/mol) | ΔH#2 (kJ/mol) | ΔS#1 (kJ/mol) | ΔS#2 (kJ/mol) | ΔG#1 (kJ/mol) | ΔG#2 (kJ/mol) | F | ΔH (kJ/mol) | ΔS (kJ/mol) | ΔG (kJ/mol) |
|---|---|---|---|---|---|---|---|---|---|---|
| 60 | 2.64 | −32.02 | −0.07 | −0.19 | 25.83 | 31.67 | 8.47 | 34.66 | 0.12 | −5.84 |
| 70 | 26.52 | 33.58 | 8.39 | −7.06 | ||||||
| 80 | 27.22 | 35.49 | 31.18 | −8.28 | ||||||
| 90 | 27.92 | 37.41 | 17.05 | −9.49 |
| Variable | Pectin Source | |||||||
|---|---|---|---|---|---|---|---|---|
| Haden Mango (Mangifera indica L.) Peel | Commercial | Commercial | Hawthorn (Crataegus spp.) | Eggplant (Solanum melongena) Peel | Black Carrot (Daucus carota L.) Pomace | Sour Orange (Citrus aurantium L.) Peel | Nam Dok Mai Mango (Mangifera indica L.) Peel | |
| Moisture (%) | 11.76 ± 0.09 | 10.49 ± 0.04 | 7.10 ± 1.90 | 4.50 ± 0.80 | 5.85 ± 0.27 | 5.90 ± 1.30 | 8.81 ± 0.68 | NR |
| Ash (%) | 3.53 ± 0.02 | NR | 0.80 ± 0.10 | 0.20 ± 0.00 | 9.03 ± 1.09 | 2.80 ± 0.40 | 1.89 ± 0.51 | NR |
| Protein (%) | 0.83 ± 0.05 | NR | 2.50 ± 0.10 | 3.50 ± 0.10 | 9.13 ± 0.17 | NR | 1.45 ± 0.23 | NR |
| Degree of esterification (%) | 81.81 ± 0.00 | 82.29 ± 0.16 | 72.5 ± 0.20 | 78.20 ± 0.60 | 68.18 ±1.19 | 45.20 ± 5.00 | 6.77 ± 0.43 | 77.19 ± 0.72 |
| Methoxyl percentage (%) | 13.35 ± 0.00 | 13.42 * | 11.8 ± 0.00 | 12.70 ± 0.10 | 11.13 * | 7.38 * | NR | 12.59 * |
| Galacturonic acid (%) | 71.57 ± 1.26 | NR | 71.2 ± 1.30 | 86.70 ± 6.90 | 67.40 | DU | 65.30 | NR |
| Free acidity (mEq carboxyl free/g) | 0.27 ± 0.00 | 0.733 ± 0.00 | NR | NR | NR | NR | NR | NR |
| Equivalent weight (mg) | 3657.55 ± 8.41 | 1364.63 ± 0.00 | NR | NR | NR | NR | NR | 1485.78 ± 0.74 |
| Reference | Present work | Ayora-Talavera et al., 2017 | Cuevas-Bernardino et al., 2016 | Kazemi et al., 2019 | Sucheta et al., 2020 | Hosseini et al., 2019 | Wongkaew et al., 2020 | |
| Parameter | Value | |
|---|---|---|
| Yield (%) | 11.08 | |
| Power consumption (W) | Tray dehydrator | 120 |
| Hammer grill | 2800 | |
| Heating plate | 120 | |
| Centrifuge | 1400 | |
| Refrigerator | 150 | |
| Vacuum oven | 1400 | |
| Coffee mill | 110 | |
| Time (s) | Tray dehydrator | 28,800 |
| Hammer grill | 3600 | |
| Heating plate | 1800 | |
| Centrifuge | 900 | |
| Refrigerator | 43,200 | |
| Vacuum oven | 28,800 | |
| Coffee mill | 600 | |
| Energy (kJ) | Tray dehydrator | 3456 |
| Hammer grill | 10,080 | |
| Heating plate | 216 | |
| Centrifuge | 1260 | |
| Refrigerator | 6480 | |
| Vacuum oven | 40,320 | |
| Coffee mill | 66 | |
| Specific Energy (kJ/kg) | 558,465.70 | |
| Price per unit of electricity (MXN/kWh) | 2.58 | |
| Cost of energy per unit of pectin (MXN/kg) | 400.23 | |
| Cost of energy per unit of pectin (USD/kg) | 19.71 | |
| Parameter | Reactive | ||
|---|---|---|---|
| Citric Acid | Ethanol | Purified Water | |
| Cost (MXN/kg or L) | 60 | 45 | 0.5 |
| Required quantity to produce 1 kg of Haden mango peel pectin (kg or L) | 1.73 | 9.03 | 270.76 |
| Cost/kg of pectin (MXN) | 104.04 | 406.14 | 135.38 |
| Cost/kg of pectin (USD) | 5.12 | 20.00 | 6.67 |
Publisher’s Note: MDPI stays neutral with regard to jurisdictional claims in published maps and institutional affiliations. |
© 2021 by the authors. Licensee MDPI, Basel, Switzerland. This article is an open access article distributed under the terms and conditions of the Creative Commons Attribution (CC BY) license (https://creativecommons.org/licenses/by/4.0/).
Share and Cite
Valdivia-Rivera, S.; Herrera-Pool, I.E.; Ayora-Talavera, T.; Lizardi-Jiménez, M.A.; García-Cruz, U.; Cuevas-Bernardino, J.C.; Cervantes-Uc, J.M.; Pacheco, N. Kinetic, Thermodynamic, Physicochemical, and Economical Characterization of Pectin from Mangifera indica L. cv. Haden Residues. Foods 2021, 10, 2093. https://doi.org/10.3390/foods10092093
Valdivia-Rivera S, Herrera-Pool IE, Ayora-Talavera T, Lizardi-Jiménez MA, García-Cruz U, Cuevas-Bernardino JC, Cervantes-Uc JM, Pacheco N. Kinetic, Thermodynamic, Physicochemical, and Economical Characterization of Pectin from Mangifera indica L. cv. Haden Residues. Foods. 2021; 10(9):2093. https://doi.org/10.3390/foods10092093
Chicago/Turabian StyleValdivia-Rivera, Sergio, Iván Emanuel Herrera-Pool, Teresa Ayora-Talavera, Manuel Alejandro Lizardi-Jiménez, Ulises García-Cruz, Juan Carlos Cuevas-Bernardino, José Manuel Cervantes-Uc, and Neith Pacheco. 2021. "Kinetic, Thermodynamic, Physicochemical, and Economical Characterization of Pectin from Mangifera indica L. cv. Haden Residues" Foods 10, no. 9: 2093. https://doi.org/10.3390/foods10092093