
Flavonoids as Human Intestinal α-Glucosidase Inhibitors


Abstract
:
1. Introduction
2. Materials and Methods
2.1. Reagents and Instruments
2.2. HPAE-PAD Instrumentation and Chromatographic Conditions
2.3. Substrate, Inhibitor/Flavonoid and Sample Preparation
2.4. Validation Parameters for Quantification
2.4.1. Specificity and Matrix Effect
2.4.2. Linearity
2.4.3. Sensitivity
2.4.4. Precision
2.4.5. Accuracy as Extraction Recovery
2.5. Cell Culture
2.6. Enzyme Activity Assay
2.6.1. Optimization of Assay Conditions and Enzyme Kinetics
2.6.2. Inhibition by Acarbose and Flavonoids
2.7. Data Analysis
3. Results
3.1. Method Validation
3.2. Inhibition of α-Glucosidase Activities
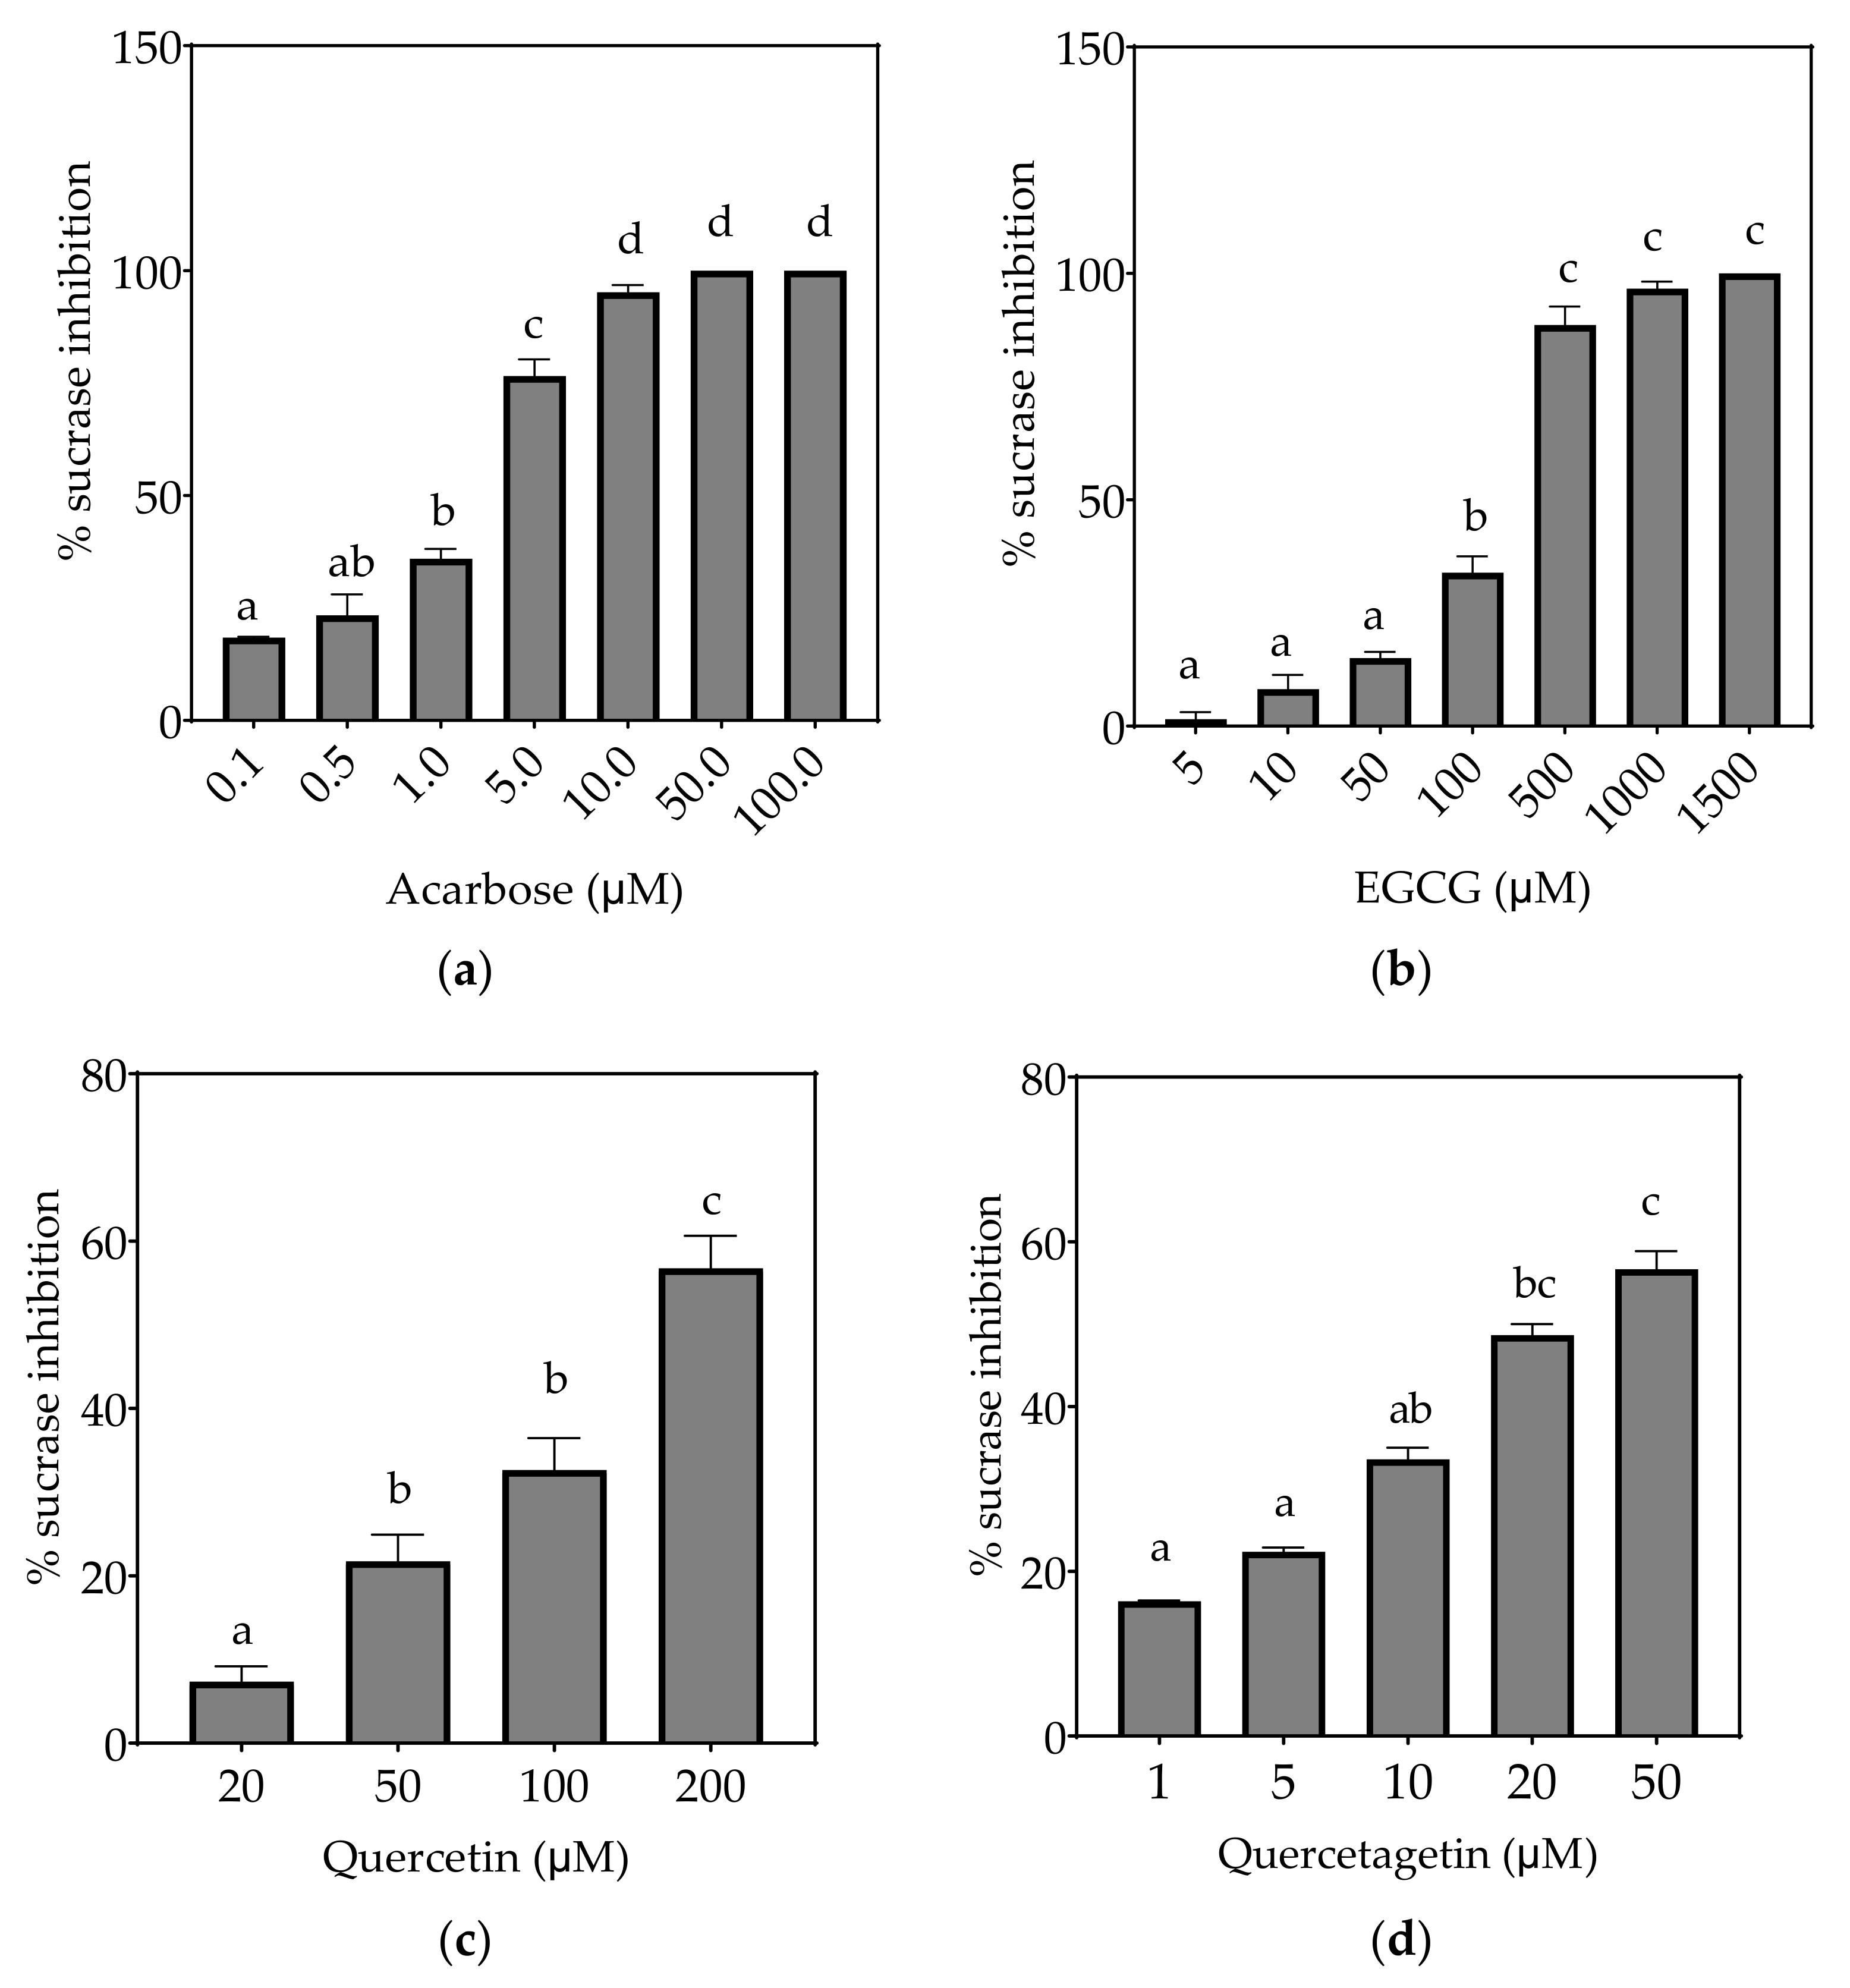
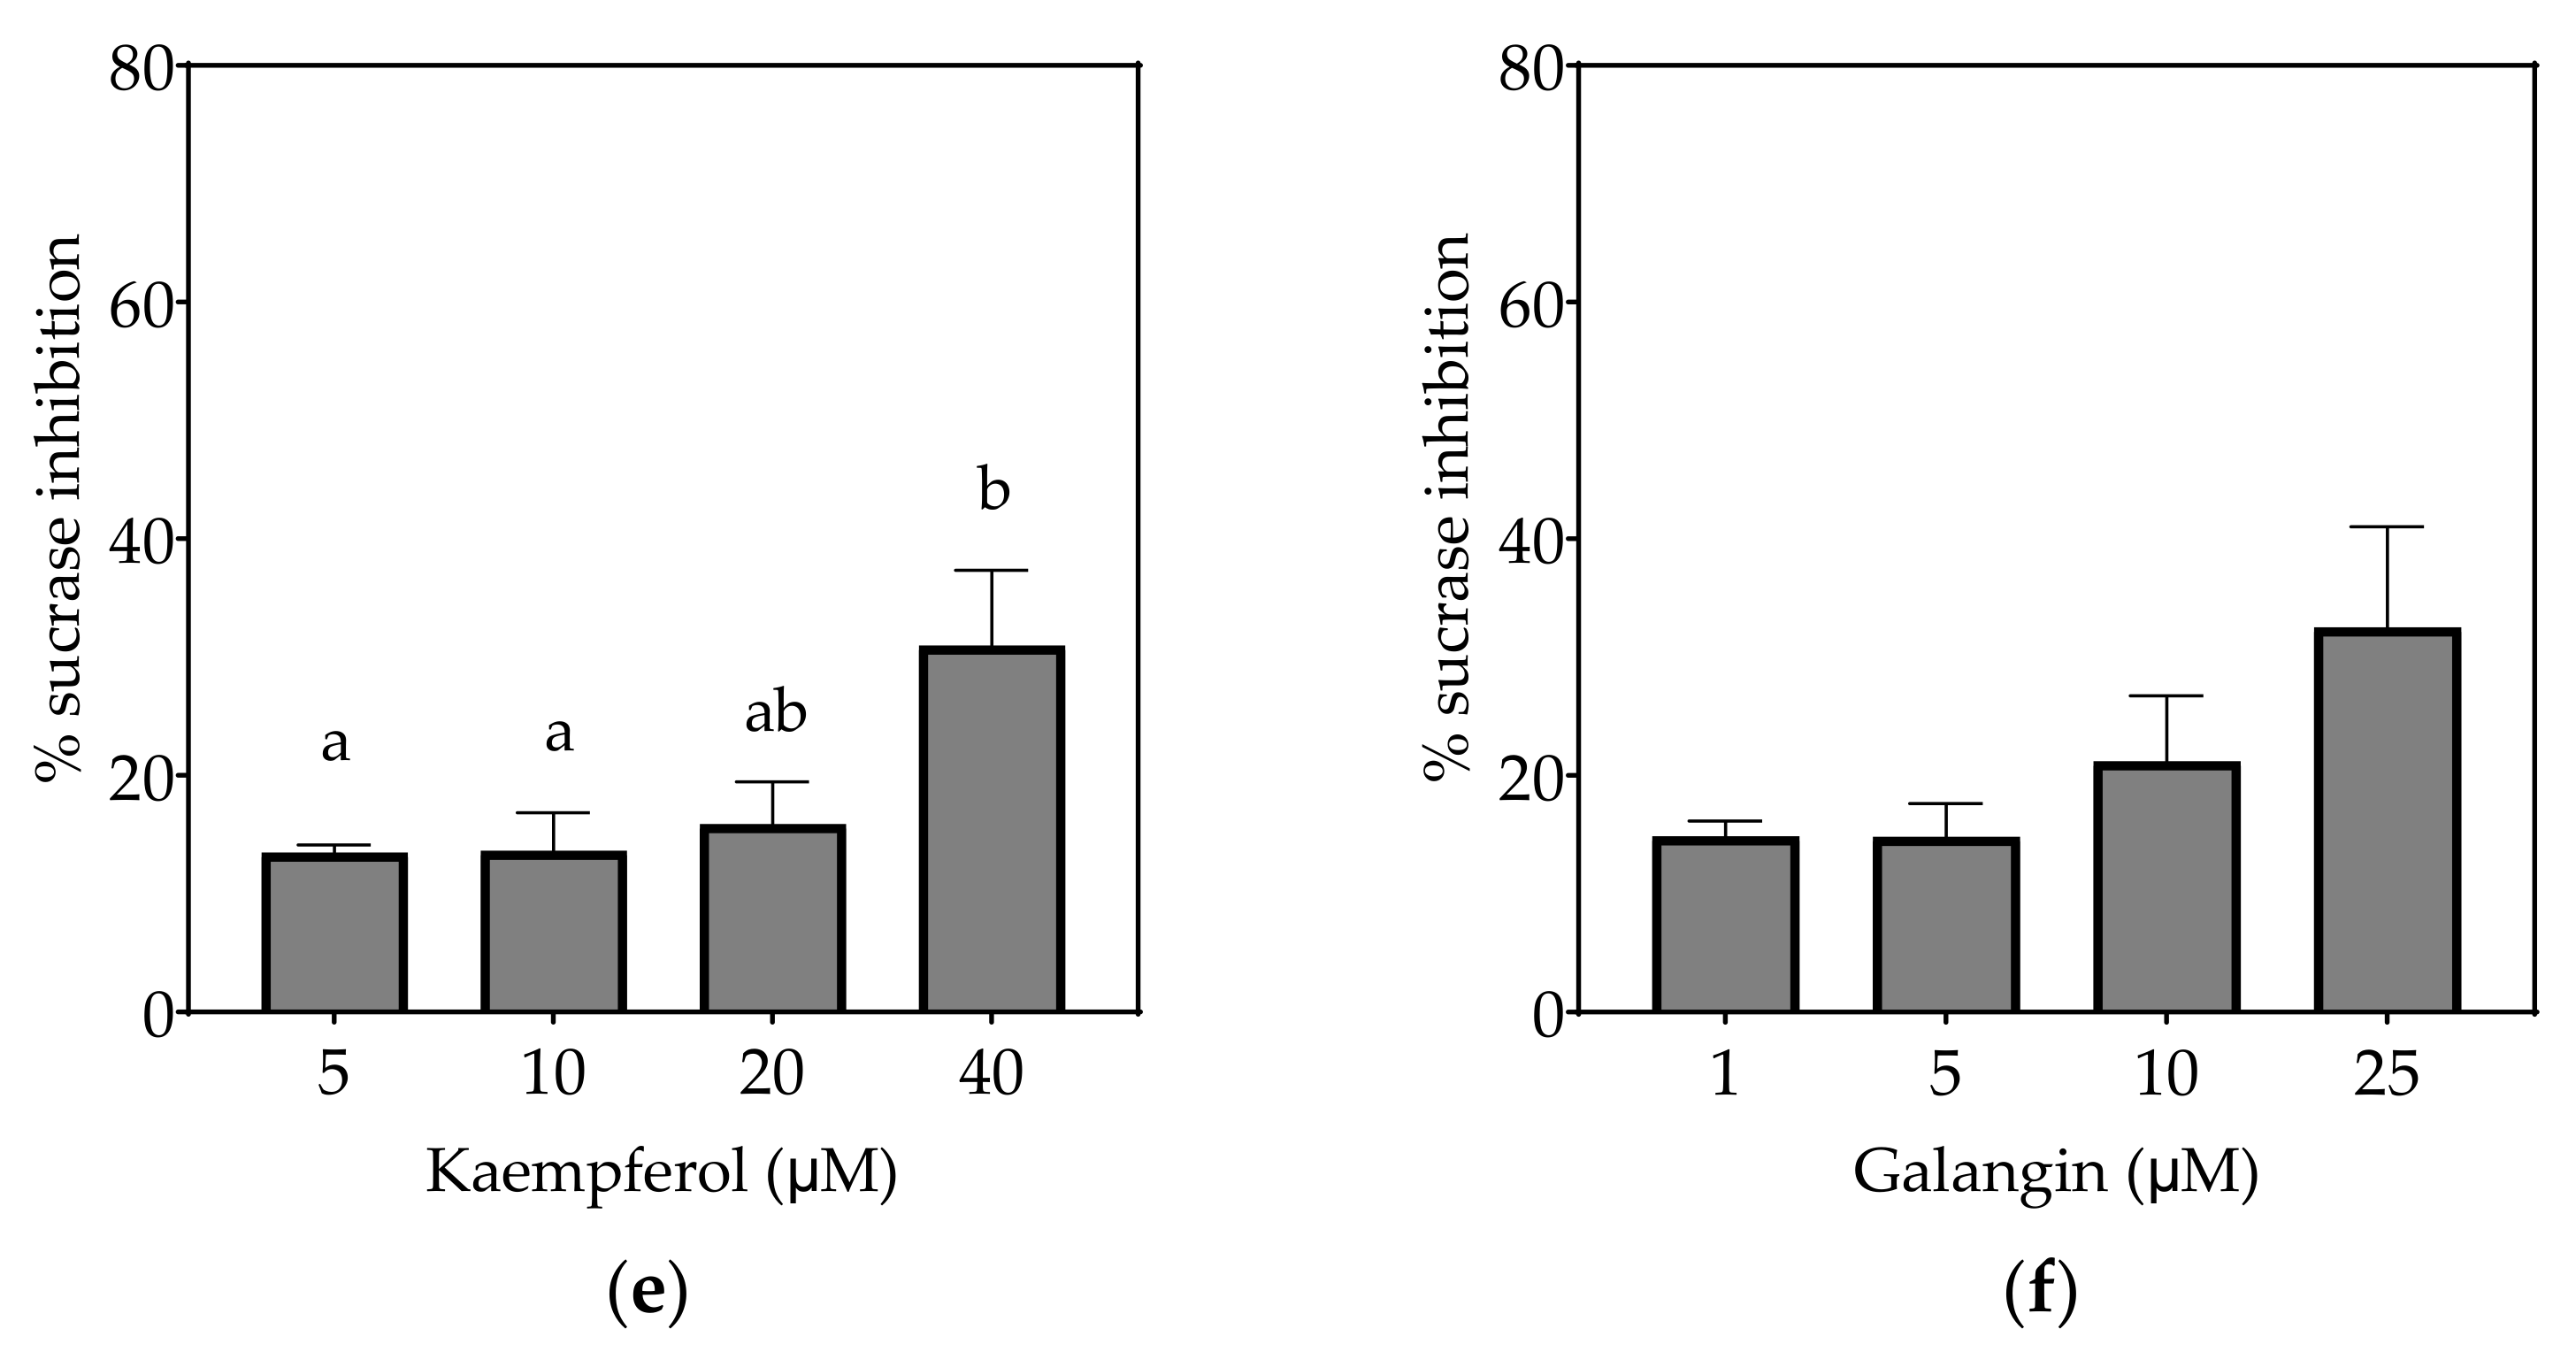
3.2.1. Sucrase
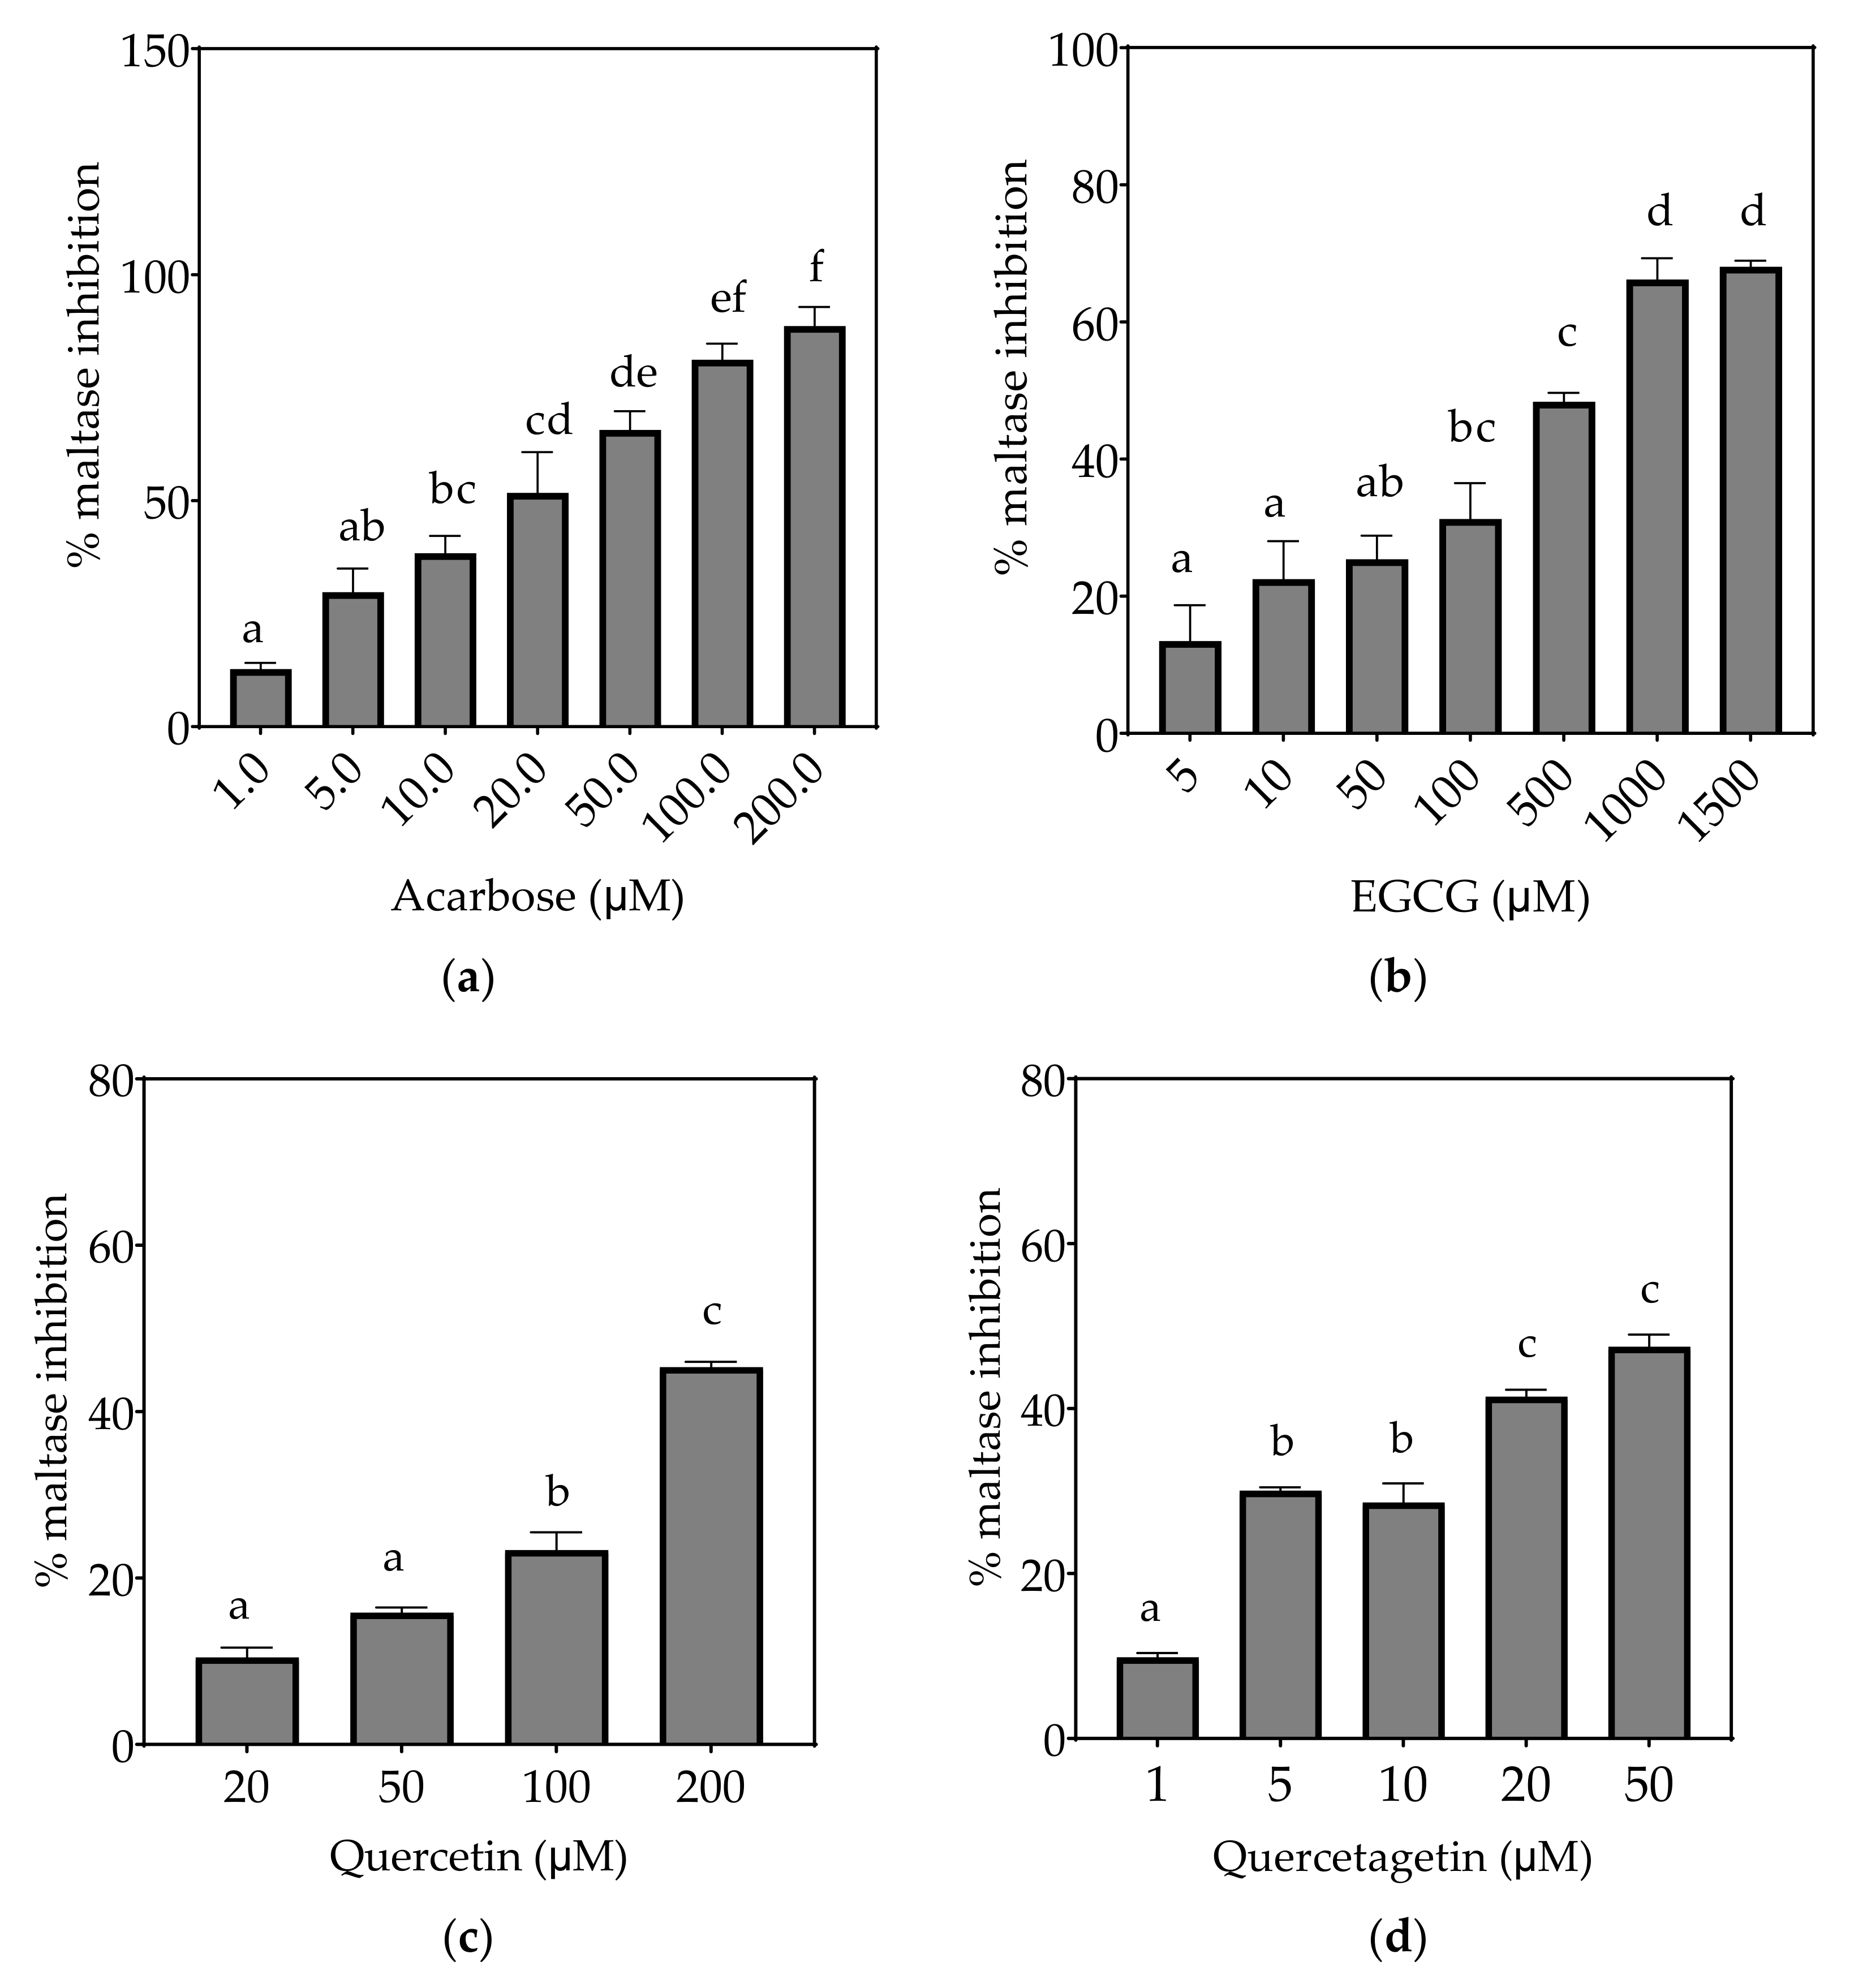
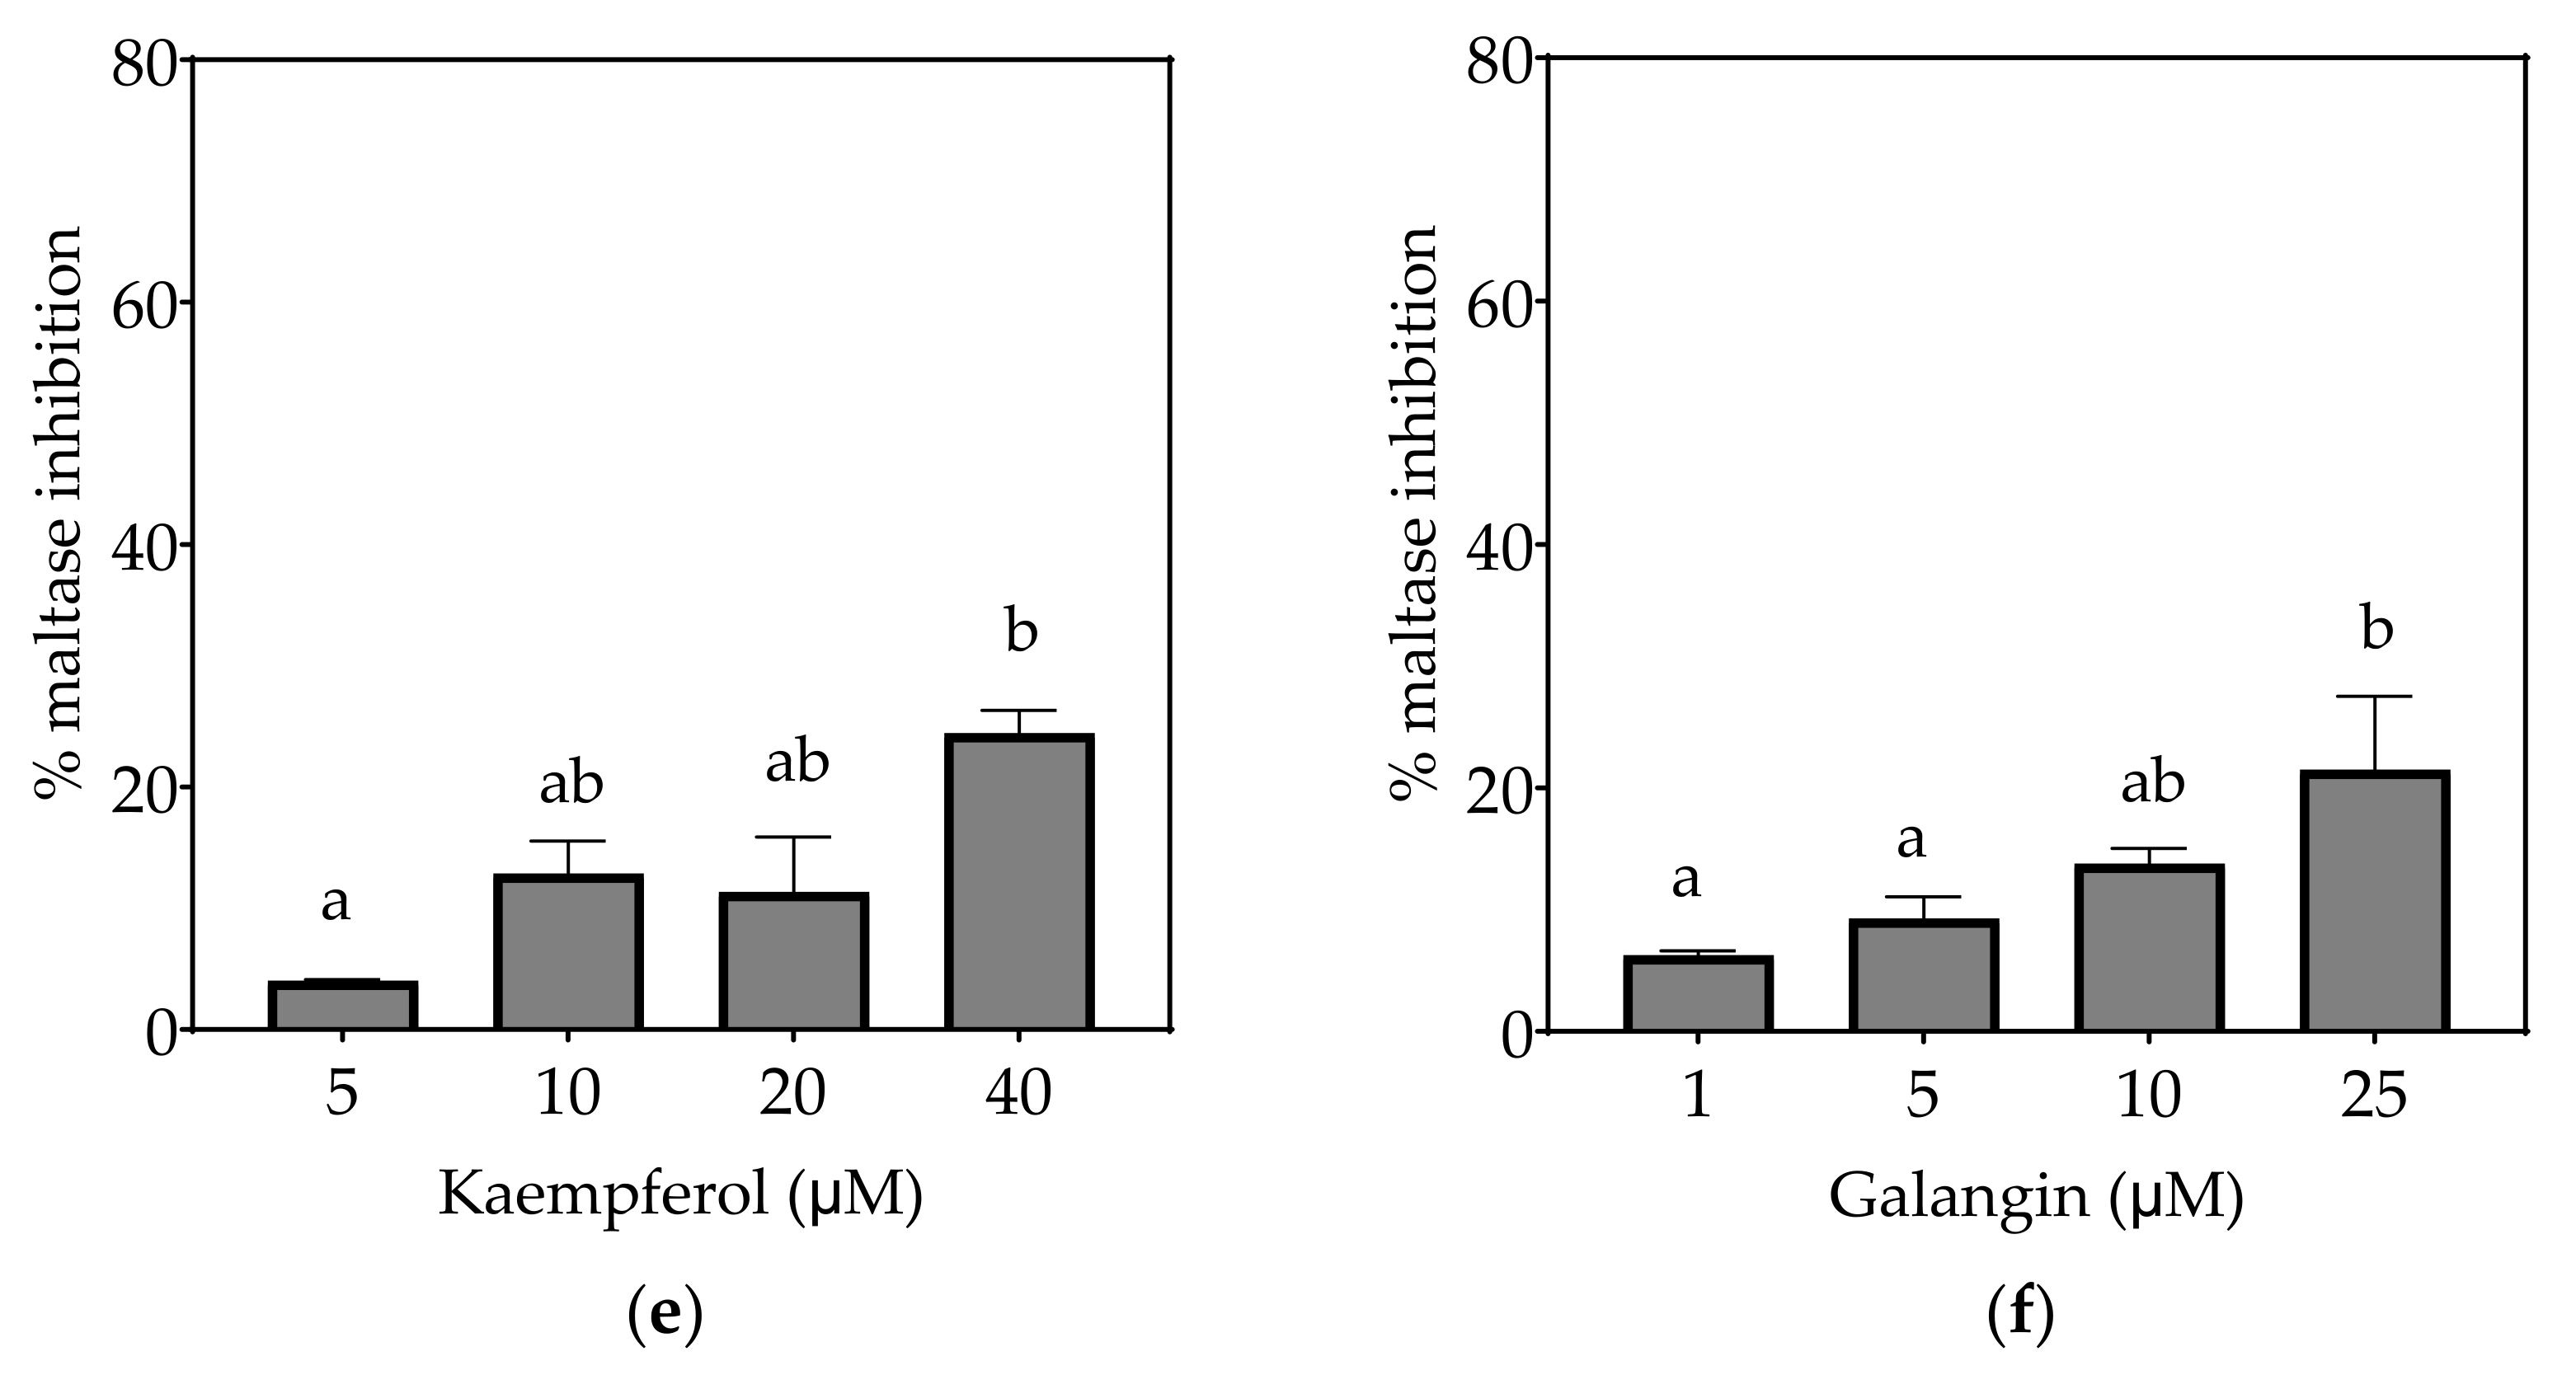
3.2.2. Maltase
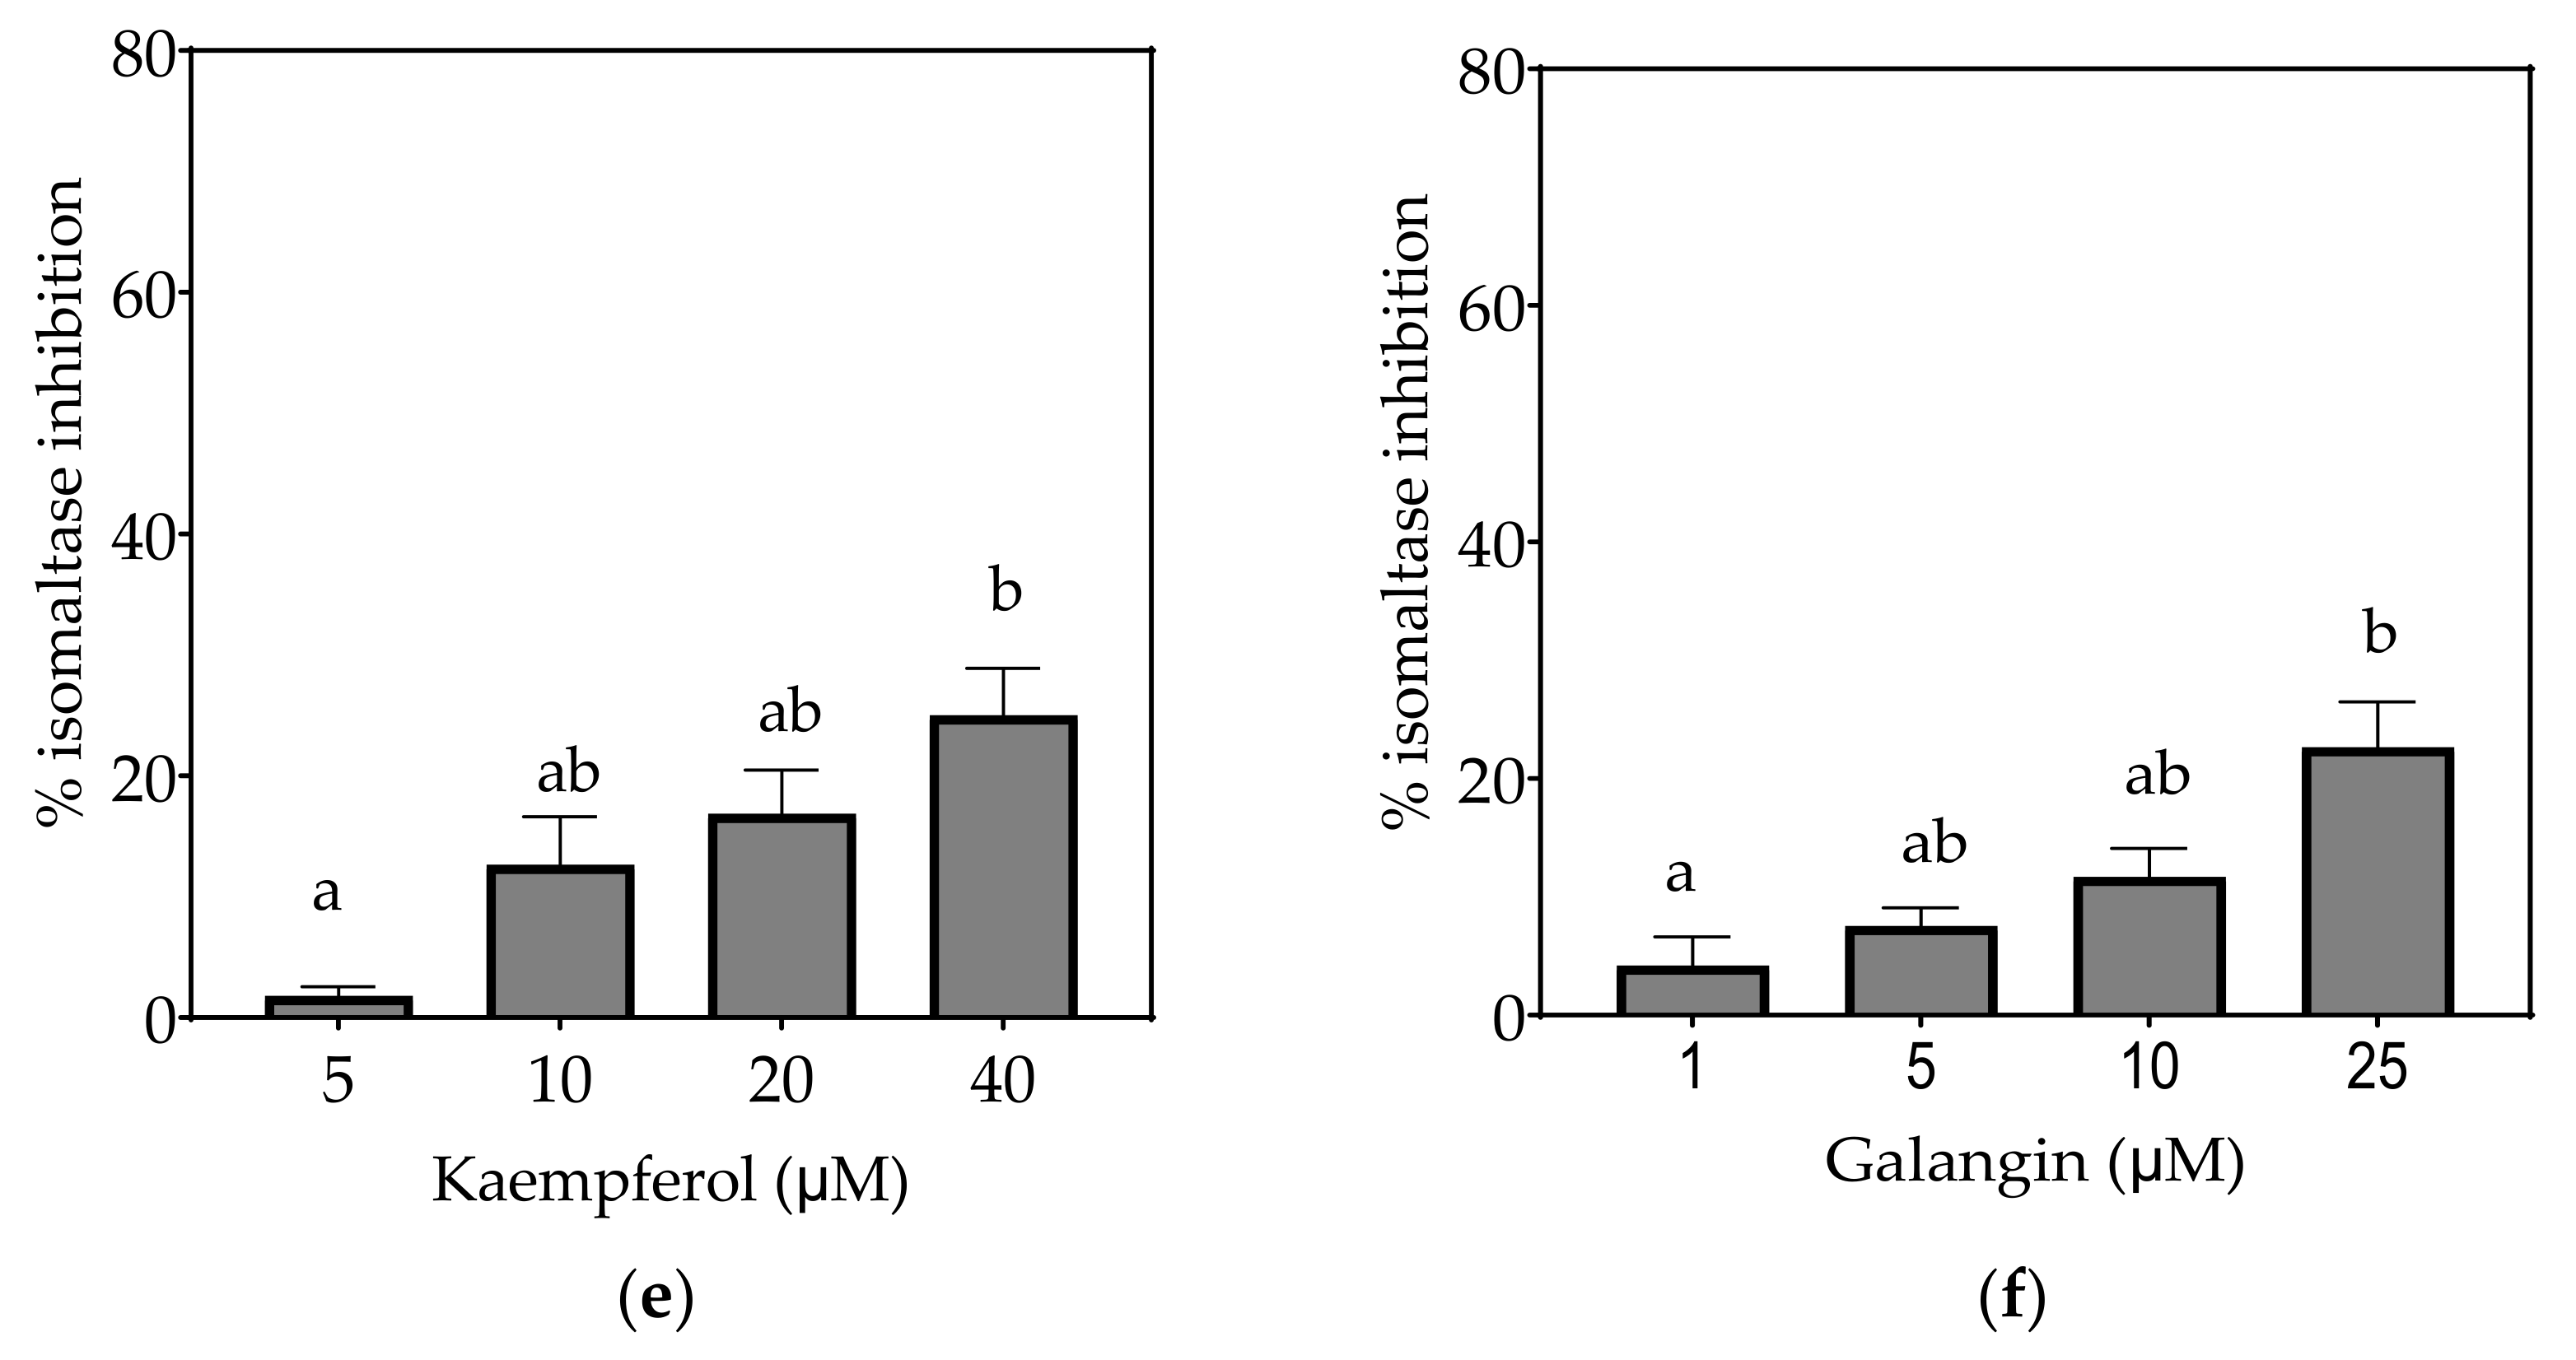
3.2.3. Isomaltase
4. Discussion
4.1. Inhibitory Activities of Flavonoids
4.1.1. Quercetagetin
4.1.2. Kaempferol
4.1.3. Galangin
4.1.4. Quercetin
4.1.5. EGCG
4.2. Structure-Function Relationships
4.3. Comparing Flavonoids to Acarbose
5. Conclusions
Author Contributions
Funding
Institutional Review Board Statement
Informed Consent Statement
Data Availability Statement
Acknowledgments
Conflicts of Interest
References
- Oguntibeju, O.O. Type 2 diabetes mellitus, oxidative stress and inflammation: Examining the links. Int. J. Physiol. Pathophysiol. Pharmacol. 2019, 11, 45–63. [Google Scholar] [PubMed]
- Chiba, S. Molecular mechanism in alpha-glucosidase and glucoamylase. Biosci. Biotechnol. Biochem. 1997, 61, 1233–1239. [Google Scholar] [CrossRef] [PubMed]
- Rose, D.R.; Chaudet, M.M.; Jones, K. Structural Studies of the Intestinal alpha-Glucosidases, Maltase-glucoamylase and Sucrase-isomaltase. J. Pediatr. Gastroenterol. Nutr. 2018, 66 (Suppl. S3), S11–S13. [Google Scholar] [CrossRef] [PubMed]
- Hamaker, B.R.; Lee, B.H.; Quezada-Calvillo, R. Starch digestion and patients with congenital sucrase-isomaltase deficiency. J. Pediatr. Gastroenterol. Nutr. 2012, 55 (Suppl. S2), S24–S28. [Google Scholar] [CrossRef] [Green Version]
- Dahlqvist, A. Specificity of the human intestinal disaccharidases and implications for hereditary disaccharide intolerance. J. Clin. Investig. 1962, 41, 463–470. [Google Scholar] [CrossRef] [Green Version]
- Karnsakul, W.; Luginbuehl, U.; Hahn, D.; Sterchi, E.; Avery, S.; Sen, P.; Swallow, D.; Nichols, B. Disaccharidase activities in dyspeptic children: Biochemical and molecular investigations of maltase-glucoamylase activity. J. Pediatr. Gastroenterol. Nutr. 2002, 35, 551–556. [Google Scholar] [CrossRef]
- McIver, L.A.; Tripp, J. Acarbose. In StatPearls; StatPearls Publishing: Treasure Island, FL, USA, 2020. [Google Scholar]
- Lin, W.H.; Yang, C.Y.; Kuo, S.; Kuo, T.H.; Roan, J.N.; Li, C.Y.; Wang, M.C.; Ou, H.T. Hepatic and cardiovascular safety of acarbose among type 2 diabetes patients with end-stage renal disease: A nationwide population-based longitudinal study. Diabetes Res. Clin. Pract. 2020, 108489. [Google Scholar] [CrossRef]
- Li, C.; Kuang, J.; Zhao, Y.; Sun, H.; Guan, H. Effect of type 2 diabetes and antihyperglycemic drug therapy on signs of tumor invasion in papillary thyroid cancer. Endocrine 2020, 69, 92–99. [Google Scholar] [CrossRef]
- DiNicolantonio, J.J.; Bhutani, J.; O’Keefe, J.H. Acarbose: Safe and effective for lowering postprandial hyperglycaemia and improving cardiovascular outcomes. Open Heart 2015, 2, e000327. [Google Scholar] [CrossRef] [Green Version]
- Spiller, H.A. Management of antidiabetic medications in overdose. Drug Saf. 1998, 19, 411–424. [Google Scholar] [CrossRef] [PubMed]
- Szymanska, R.; Pospisil, P.; Kruk, J. Plant-Derived Antioxidants in Disease Prevention 2018. Oxid. Med. Cell Longev. 2018, 2018, 2068370. [Google Scholar] [CrossRef] [PubMed] [Green Version]
- Kim, Y.; Keogh, J.B.; Clifton, P.M. Polyphenols and Glycemic Control. Nutrients 2016, 8, 17. [Google Scholar] [CrossRef] [PubMed]
- Aryaeian, N.; Sedehi, S.K.; Arablou, T. Polyphenols and their effects on diabetes management: A review. Med. J. Islam Repub. Iran 2017, 31, 134. [Google Scholar] [CrossRef] [PubMed] [Green Version]
- Al-Duhaidahawi, D.; Hasan, S.A.; Al-Zubaidy, H.F.S. Flavonoids in the Treatment of Diabetes Clinical Outcomes and Mechanism to ameliorate Blood Glucose levels. Curr. Diabetes Rev. 2020. [Google Scholar] [CrossRef]
- Scalbert, A.; Williamson, G. Dietary intake and bioavailability of polyphenols. J. Nutr. 2000, 130, 2073S–2085S. [Google Scholar] [CrossRef]
- Manach, C.; Scalbert, A.; Morand, C.; Remesy, C. Polyphenols: Food sources and bioavailability. Am. J. Clin. Nutr. 2004, 79, 727–747. [Google Scholar] [CrossRef] [Green Version]
- Rasouli, H.; Hosseini-Ghazvini, S.M.; Adibi, H.; Khodarahmi, R. Differential alpha-amylase/alpha-glucosidase inhibitory activities of plant-derived phenolic compounds: A virtual screening perspective for the treatment of obesity and diabetes. Food Funct. 2017, 8, 1942–1954. [Google Scholar] [CrossRef]
- Woodward, K.A.; Draijer, R.; Thijssen, D.H.J.; Low, D.A. Polyphenols and Microvascular Function in Humans: A Systematic Review. Curr. Pharm. Des. 2018, 24, 203–226. [Google Scholar] [CrossRef] [PubMed] [Green Version]
- Xiao, J.; Kai, G.; Yamamoto, K.; Chen, X. Advance in dietary polyphenols as alpha-glucosidases inhibitors: A review on structure-activity relationship aspect. Crit. Rev. Food Sci. Nutr. 2013, 53, 818–836. [Google Scholar] [CrossRef]
- Sun, Q.; Wedick, N.M.; Tworoger, S.S.; Pan, A.; Townsend, M.K.; Cassidy, A.; Franke, A.A.; Rimm, E.B.; Hu, F.B.; van Dam, R.M. Urinary Excretion of Select Dietary Polyphenol Metabolites Is Associated with a Lower Risk of Type 2 Diabetes in Proximate but Not Remote Follow-Up in a Prospective Investigation in 2 Cohorts of US Women. J. Nutr. 2015, 145, 1280–1288. [Google Scholar] [CrossRef]
- Kumar, S.; Mittal, A.; Babu, D.; Mittal, A. Herbal medicines for diabetes management and its secondary complications. Curr. Diabetes Rev. 2020. [Google Scholar] [CrossRef]
- Williamson, G. Possible effects of dietary polyphenols on sugar absorption and digestion. Mol. Nutr. Food Res. 2013, 57, 48–57. [Google Scholar] [CrossRef] [PubMed]
- Van Beers, E.H.; Al, R.H.; Rings, E.H.H.M.; Einerhand, A.W.C.; Dekker, J.; Buller, H.A. Lactase and sucrase-isomaltase gene expression during Caco-2 cell differentiation. Biochem. J. 1995, 308, 769–775. [Google Scholar] [CrossRef] [PubMed] [Green Version]
- Miyake, T.; Sakai, S.; Shibuya, T. Process for Producing a High-Purity Isomaltose. U.S. Patent 4,521,252, 26 October 1981. [Google Scholar]
- Turco, L.; Catone, T.; Caloni, F.; Di Consiglio, E.; Testai, E.; Stammati, A. Caco-2/TC7 cell line characterization for intestinal absorption: How reliable is this in vitro model for the prediction of the oral dose fraction absorbed in human? Toxicol. In Vitro 2011, 25, 13–20. [Google Scholar] [CrossRef]
- Pyner, A.; Nyambe-Silavwe, H.; Williamson, G. Inhibition of Human and Rat Sucrase and Maltase Activities To Assess Antiglycemic Potential: Optimization of the Assay Using Acarbose and Polyphenols. J. Agric. Food Chem. 2017, 65, 8643–8651. [Google Scholar] [CrossRef]
- Amidon, G.L.; Lennernas, H.; Shah, V.P.; Crison, J.R. A theoretical basis for a biopharmaceutic drug classification: The correlation of in vitro drug product dissolution and in vivo bioavailability. Pharm. Res. 1995, 12, 413–420. [Google Scholar] [CrossRef] [PubMed] [Green Version]
- Kaur, H.; Kaur, G. A Critical Appraisal of Solubility Enhancement Techniques of Polyphenols. J. Pharm. 2014, 2014. [Google Scholar] [CrossRef] [Green Version]
- Pyner, A.; Chan, S.Y.; Tumova, S.; Kerimi, A.; Williamson, G. Indirect Chronic Effects of an Oleuropein-Rich Olive Leaf Extract on Sucrase-Isomaltase In Vitro and In Vivo. Nutrients 2019, 11, 1505. [Google Scholar] [CrossRef] [Green Version]
- FDA. Guidance for Industry: Bioanalytical Method Validation; U.S. Department of Health and Human Services: Washington, DC, USA, 2018. [Google Scholar]
- Branch, S.K. Guidelines from the International Conference on Harmonisation (ICH). J. Pharm. Biomed. Anal. 2005, 38, 798–805. [Google Scholar] [CrossRef]
- Rao, T.N. Validation of Analytical Methods; IntechOpen: London, UK, 2018. [Google Scholar] [CrossRef] [Green Version]
- Bradford, M.M. A rapid and sensitive method for the quantitation of microgram quantities of protein utilizing the principle of protein-dye binding. Anal. Biochem. 1976, 72, 248–254. [Google Scholar] [CrossRef]
- Zor, T.; Selinger, S. Linearization of the Bradford Protein Assay Increases Its Sensitivity: Theoretical and Experimental Studies. Anal. Biochem. 1996, 236, 302–308. [Google Scholar] [CrossRef] [Green Version]
- Walgren, R.A.; Walle, U.K.; Walle, T. Transport of quercetin and its glucosides across human intestinal epithelial Caco-2 cells. Biochem. Pharmacol. 1998, 55, 1721–1727. [Google Scholar] [CrossRef]
- Zhu, J.; Chen, C.; Zhang, B.; Huang, Q. The inhibitory effects of flavonoids on alpha-amylase and alpha-glucosidase. Crit. Rev. Food Sci. Nutr. 2020, 60, 695–708. [Google Scholar] [CrossRef]
- Sheliya, M.A.; Rayhana, B.; Ali, A.; Pillai, K.K.; Aeri, V.; Sharma, M.; Mir, S.R. Inhibition of alpha-glucosidase by new prenylated flavonoids from Euphorbia hirta L. herb. J. Ethnopharmacol. 2015, 176, 1–8. [Google Scholar] [CrossRef]
- Hong, S.H.; Marmur, J. Upstream regulatory regions controlling the expression of the yeast maltase gene. Mol. Cell Biol. 1987, 7, 2477–2483. [Google Scholar] [CrossRef] [PubMed] [Green Version]
- Hong, S.H.; Marmur, J. Primary structure of the maltase gene of the MAL6 locus of Saccharomyces carlsbergensis. Gene 1986, 41, 75–84. [Google Scholar] [CrossRef]
- Zane, A.; Wender, S.H. Flavonols in spinach leaves. J. Org. Chem. 1961, 26, 4718–4719. [Google Scholar] [CrossRef]
- Wang, W.; Xu, H.; Chen, H.; Tai, K.; Liu, F.; Gao, Y. In vitro antioxidant, anti-diabetic and antilipemic potentials of quercetagetin extracted from marigold (Tagetes erecta L.) inflorescence residues. J. Food Sci. Technol. 2016, 53, 2614–2624. [Google Scholar] [CrossRef] [PubMed] [Green Version]
- Wu, Q.; Yang, X.; Zou, L.; Fu, D. Bioactivity guided isolation of alpha-glucosidase inhibitor from whole herbs of Crossostephium chinense. Zhongguo Zhong Yao Za Zhi 2009, 34, 2206–2211. [Google Scholar]
- Xiao, X.; Erukainure, O.L.; Sanni, O.; Koorbanally, N.A.; Islam, M.S. Phytochemical properties of black tea (Camellia sinensis) and rooibos tea (Aspalathus linearis); and their modulatory effects on key hyperglycaemic processes and oxidative stress. J. Food Sci. Technol. 2020, 57, 4345–4354. [Google Scholar] [CrossRef] [PubMed]
- Zou, L.; Wu, Q.; Yang, X.; Fu, D. Effects of chemical constituents of Crossostephium chinense on insulin secretion in rat islets in vitro. Zhongguo Zhong Yao Za Zhi 2009, 34, 1401–1405. [Google Scholar]
- Gong, Y.; Liu, X.; He, W.H.; Xu, H.G.; Yuan, F.; Gao, Y.X. Investigation into the antioxidant activity and chemical composition of alcoholic extracts from defatted marigold (Tagetes erecta L.) residue. Fitoterapia 2012, 83, 481–489. [Google Scholar] [CrossRef]
- Baek, S.; Kang, N.J.; Popowicz, G.M.; Arciniega, M.; Jung, S.K.; Byun, S.; Song, N.R.; Heo, Y.S.; Kim, B.Y.; Lee, H.J.; et al. Structural and functional analysis of the natural JNK1 inhibitor quercetagetin. J. Mol. Biol. 2013, 425, 411–423. [Google Scholar] [CrossRef] [Green Version]
- Tereschuk, M.L.; Riera, M.V.; Castro, G.R.; Abdala, L.R. Antimicrobial activity of flavonoids from leaves of Tagetes minuta. J. Ethnopharmacol. 1997, 56, 227–232. [Google Scholar] [CrossRef]
- Cotin, S.; Calliste, C.A.; Mazeron, M.C.; Hantz, S.; Duroux, J.L.; Rawlinson, W.D.; Ploy, M.C.; Alain, S. Eight flavonoids and their potential as inhibitors of human cytomegalovirus replication. Antiviral Res. 2012, 96, 181–186. [Google Scholar] [CrossRef]
- Tadera, K.; Minami, Y.; Takamatsu, K.; Matsuoka, T. Inhibition of alpha-glucosidase and alpha-amylase by flavonoids. J. Nutr. Sci. Vitaminol. 2006, 52, 149–153. [Google Scholar] [CrossRef] [Green Version]
- Wang, H.; Du, Y.; Song, C.H. α-Glucosidase and α-amylase inhibitory activities of guava leaves. Food Chem. 2010, 123, 6–13. [Google Scholar] [CrossRef]
- Zhang, B.W.; Li, X.; Sun, W.L.; Xing, Y.; Xiu, Z.L.; Zhuang, C.L.; Dong, Y.S. Dietary Flavonoids and Acarbose Synergistically Inhibit alpha-Glucosidase and Lower Postprandial Blood Glucose. J. Agric. Food Chem. 2017, 65, 8319–8330. [Google Scholar] [CrossRef]
- Ye, X.P.; Song, C.Q.; Yuan, P.; Mao, R. α-Glucosidase and αamylase inhibitory activity of common constituents from traditional Chinese medicine used for diabetes mellitus. Chin. J. Nat. Med. 2010, 8, 349–352. [Google Scholar] [CrossRef]
- Matsui, T.; Kobayashi, M.; Hayashida, S.; Matsumoto, K. Luteolin, a Flavone, Does Not Suppress Postprandial Glucose Absorption Through an Inhibition of α-Glucosidase Action. Biosci. Biotechnol. Biochem. 2002, 66, 689–692. [Google Scholar] [CrossRef] [PubMed]
- Peng, X.; Zhang, G.; Liao, Y.; Gong, D. Inhibitory kinetics and mechanism of kaempferol on alpha-glucosidase. Food Chem. 2016, 190, 207–215. [Google Scholar] [CrossRef] [PubMed]
- Renda, G.; Sari, S.; Barut, B.; Soral, M.; Liptaj, T.; Korkmaz, B.; Ozel, A.; Erik, I.; Sohretoglu, D. alpha-Glucosidase inhibitory effects of polyphenols from Geranium asphodeloides: Inhibition kinetics and mechanistic insights through in vitro and in silico studies. Bioorgan. Chem. 2018, 81, 545–552. [Google Scholar] [CrossRef] [PubMed]
- Camaforte, N.A.P.; Saldanha, L.L.; Vareda, P.M.P.; Rezende-Neto, J.M.; Senger, M.R.; Delgado, A.Q.; Morgan, H.J.N.; Violato, N.M.; Pieroni, L.G.; Dokkedal, A.L.; et al. Hypoglycaemic activity of Bauhinia holophylla through GSK3-beta inhibition and glycogenesis activation. Pharm. Biol. 2019, 57, 269–279. [Google Scholar] [CrossRef] [PubMed] [Green Version]
- Varghese, G.K.; Bose, L.V.; Habtemariam, S. Antidiabetic components of Cassia alata leaves: Identification through alpha-glucosidase inhibition studies. Pharm. Biol. 2013, 51, 345–349. [Google Scholar] [CrossRef] [PubMed]
- Chen, H.; Ouyang, K.; Jiang, Y.; Yang, Z.; Hu, W.; Xiong, L.; Wang, N.; Liu, X.; Wang, W. Constituent analysis of the ethanol extracts of Chimonanthus nitens Oliv. leaves and their inhibitory effect on alpha-glucosidase activity. Int. J. Biol. Macromol. 2017, 98, 829–836. [Google Scholar] [CrossRef] [PubMed]
- Andrade, C.; Ferreres, F.; Gomes, N.G.M.; Gil-Izquierdo, A.; Bapia, S.; Duangsrisai, S.; Pereira, D.M.; Andrade, P.B.; Valentao, P. Gustavia gracillima Miers. flowers effects on enzymatic targets underlying metabolic disorders and characterization of its polyphenolic content by HPLC-DAD-ESI/MS(n). Food Res. Int. 2020, 137, 109694. [Google Scholar] [CrossRef] [PubMed]
- Aloud, A.A.; Veeramani, C.; Govindasamy, C.; Alsaif, M.A.; El Newehy, A.S.; Al-Numair, K.S. Galangin, a dietary flavonoid, improves antioxidant status and reduces hyperglycemia-mediated oxidative stress in streptozotocin-induced diabetic rats. Redox Rep. 2017, 22, 290–300. [Google Scholar] [CrossRef]
- Patil, K.K.; Meshram, R.J.; Dhole, N.A.; Gacche, R.N. Role of dietary flavonoids in amelioration of sugar induced cataractogenesis. Arch. Biochem Biophys 2016, 593, 1–11. [Google Scholar] [CrossRef]
- Aloud, A.A.; Chinnadurai, V.; Govindasamy, C.; Alsaif, M.A.; Al-Numair, K.S. Galangin, a dietary flavonoid, ameliorates hyperglycaemia and lipid abnormalities in rats with streptozotocin-induced hyperglycaemia. Pharm. Biol. 2018, 56, 302–308. [Google Scholar] [CrossRef]
- Aloud, A.A.; Chinnadurai, V.; Chandramohan, G.; Alsaif, M.A.; Al-Numair, K.S. Galangin controls streptozotocin-caused glucose homeostasis and reverses glycolytic and gluconeogenic enzyme changes in rats. Arch. Physiol. Biochem. 2020, 126, 101–106. [Google Scholar] [CrossRef]
- Zeng, L.; Ding, H.; Hu, X.; Zhang, G.; Gong, D. Galangin inhibits alpha-glucosidase activity and formation of non-enzymatic glycation products. Food Chem. 2019, 271, 70–79. [Google Scholar] [CrossRef] [PubMed]
- Sheng, Z.; Ai, B.; Zheng, L.; Zheng, X.; Xu, Z.; Shen, Y.; Jin, Z. Inhibitory activities of kaempferol, galangin, carnosic acid and polydatin against glycation and α-amylase and α-glucosidase enzymes. Food Sci. Technol. 2018, 53, 755–766. [Google Scholar] [CrossRef]
- Hollman, P.C.; van Trijp, J.M.; Buysman, M.N.; van der Gaag, M.S.; Mengelers, M.J.; de Vries, J.H.; Katan, M.B. Relative bioavailability of the antioxidant flavonoid quercetin from various foods in man. FEBS Lett. 1997, 418, 152–156. [Google Scholar] [CrossRef] [Green Version]
- Eid, H.M.; Haddad, P.S. The Antidiabetic Potential of Quercetin: Underlying Mechanisms. Curr. Med. Chem. 2017, 24, 355–364. [Google Scholar] [PubMed]
- Kwon, O.; Eck, P.; Chen, S.; Corpe, C.P.; Lee, J.H.; Kruhlak, M.; Levine, M. Inhibition of the intestinal glucose transporter GLUT2 by flavonoids. FASEB J. 2007, 21, 366–377. [Google Scholar] [CrossRef] [Green Version]
- Figueiredo-Gonzalez, M.; Grosso, C.; Valentao, P.; Andrade, P.B. alpha-Glucosidase and alpha-amylase inhibitors from Myrcia spp.: A stronger alternative to acarbose? J. Pharm. Biomed. Anal. 2016, 118, 322–327. [Google Scholar] [CrossRef]
- Escandon-Rivera, S.; Gonzalez-Andrade, M.; Bye, R.; Linares, E.; Navarrete, A.; Mata, R. alpha-glucosidase inhibitors from Brickellia cavanillesii. J. Nat. Prod. 2012, 75, 968–974. [Google Scholar] [CrossRef]
- Mujawdiya, P.K.; Kapur, S. Screening of Antioxidant and α-Glucosidase Inhibitory Activities of Indian Medicinal Plants. Curr. Enzyme Inhib. 2020, 16, 145–154. [Google Scholar] [CrossRef]
- Gao, J.; Xu, P.; Wang, Y.; Wang, Y.; Hochstetter, D. Combined effects of green tea extracts, green tea polyphenols or epigallocatechin gallate with acarbose on inhibition against alpha-amylase and alpha-glucosidase in vitro. Molecules 2013, 18, 11614–11623. [Google Scholar] [CrossRef] [Green Version]
- Nguyen, T.T.H.; Jung, S.H.; Lee, S.; Ryu, H.J.; Kang, H.K.; Moon, Y.H.; Kim, Y.M.; Kimura, A.; Kim, D. Inhibitory effects of epigallocatechin gallate and its glucoside on the human intestinal maltase inhibition. Biotechnol. Bioprocess. Eng. 2012, 17, 966–971. [Google Scholar] [CrossRef] [PubMed]
- Simsek, M.; Quezada-Calvillo, R.; Ferruzzi, M.G.; Nichols, B.L.; Hamaker, B.R. Dietary phenolic compounds selectively inhibit the individual subunits of maltase-glucoamylase and sucrase-isomaltase with the potential of modulating glucose release. J. Agric. Food Chem. 2015, 63, 3873–3879. [Google Scholar] [CrossRef]
- Li, X.; Li, S.; Chen, M.; Wang, J.; Xie, B.; Sun, Z. (−)-Epigallocatechin-3-gallate (EGCG) inhibits starch digestion and improves glucose homeostasis through direct or indirect activation of PXR/CAR-mediated phase II metabolism in diabetic mice. Food Funct. 2018, 9, 4651–4663. [Google Scholar] [CrossRef]
- Ni, D.; Ai, Z.; Munoz-Sandoval, D.; Suresh, R.; Ellis, P.R.; Yuqiong, C.; Sharp, P.A.; Butterworth, P.J.; Yu, Z.; Corpe, C.P. Inhibition of the facilitative sugar transporters (GLUTs) by tea extracts and catechins. FASEB J. 2020, 34, 9995–10010. [Google Scholar] [CrossRef]
- Asbaghi, O.; Fouladvand, F.; Gonzalez, M.J.; Ashtary-Larky, D.; Choghakhori, R.; Abbasnezhad, A. Effect of green tea on glycemic control in patients with type 2 diabetes mellitus: A systematic review and meta-analysis. Diabetes Metab. Syndr. 2020, 15, 23–31. [Google Scholar] [CrossRef]
- Bansode, T.S.; Salalkar, B.K. Strategies in the design of antidiabetic drugs from Terminalia chebula using in silico and in vitro approach. MicroMedicine 2016, 4, 60–67. [Google Scholar]
- Gao, H.; Kawabata, J. Importance of the B ring and its substitution on the alpha-glucosidase inhibitory activity of baicalein, 5,6,7-trihydroxyflavone. Biosci. Biotechnol. Biochem. 2004, 68, 1858–1864. [Google Scholar] [CrossRef] [Green Version]
- Lo Piparo, E.; Scheib, H.; Frei, N.; Williamson, G.; Grigorov, M.; Chou, C.J. Flavonoids for controlling starch digestion: Structural requirements for inhibiting human alpha-amylase. J. Med. Chem. 2008, 51, 3555–3561. [Google Scholar] [CrossRef] [PubMed]
- Wang, T.; Li, Q.; Bi, K. Bioactive flavonoids in medicinal plants: Structure, activity and biological fate. Asian J. Pharm. Sci. 2018, 113, 12–23. [Google Scholar] [CrossRef] [PubMed]
- Li, H.; Song, F.; Xing, J.; Tsao, R.; Liu, Z.; Liu, S. Screening and structural characterization of α-glucosidase inhibitors from hawthorn leaf flavonoids extract by ultrafiltration LC-DAD-MSn and SORI-CID FTICR MS. J. Am. Soc. Mass Spec. 2009, 20, 1496–1503. [Google Scholar] [CrossRef] [PubMed] [Green Version]
- Xiao, J.; Kai, G.; Ni, X.; Yang, F.; Chen, X. Interaction of natural polyphenols with alpha-amylase in vitro: Molecular property-affinity relationship aspect. Mol. Biosyst 2011, 7, 1883–1890. [Google Scholar] [CrossRef] [PubMed]
- Cao, H.; Chen, X. Structures required of flavonoids for inhibiting digestive enzymes. Anticancer Agents Med. Chem. 2012, 12, 929–939. [Google Scholar] [CrossRef]
- Wang, L.; Liu, Y.; Luo, Y.; Huang, K.; Wu, Z. Quickly Screening for Potential alpha-Glucosidase Inhibitors from Guava Leaves Tea by Bioaffinity Ultrafiltration Coupled with HPLC-ESI-TOF/MS Method. J. Agric. Food Chem 2018, 66, 1576–1582. [Google Scholar] [CrossRef] [PubMed]
- Wang, L.; Luo, Y.; Wu, Y.; Liu, Y.; Wu, Z. Fermentation and complex enzyme hydrolysis for improving the total soluble phenolic contents, flavonoid aglycones contents and bio-activities of guava leaves tea. Food Chem. 2018, 264, 189–198. [Google Scholar] [CrossRef]
- El-Fadi, S.A.; Osman, A.; Al-Zohairy, A.M.; Dahab, A.A.; Abo El Kheir, Z.A. Asessment of Total Phenolic, Flavonoid Content, Antioxidant Potential and HPLC Profile of Three Moringa Species Leaf Extracts. Sci. J. Flowers Ornam. Plants 2020, 7, 53–70. [Google Scholar] [CrossRef]
- Toma, A.; Makonnen, E.; Mekonnen, Y.; Debella, A.; Addisakwattana, S. Intestinal alpha-glucosidase and some pancreatic enzymes inhibitory effect of hydroalcholic extract of Moringa stenopetala leaves. BMC Complement. Altern Med. 2014, 14, 180. [Google Scholar] [CrossRef] [PubMed] [Green Version]
- Lee, B.H.; Rose, D.R.; Lin, A.H.; Quezada-Calvillo, R.; Nichols, B.L.; Hamaker, B.R. Contribution of the Individual Small Intestinal alpha-Glucosidases to Digestion of Unusual alpha-Linked Glycemic Disaccharides. J. Agric. Food Chem. 2016, 64, 6487–6494. [Google Scholar] [CrossRef] [PubMed]
- Visvanathan, R.; Houghton, M.J.; Williamson, G. Maltoheptaoside hydrolysis with chromatographic detection and starch hydrolysis with reducing sugar analysis: Comparison of assays allows assessment of the roles of direct alpha-amylase inhibition and starch complexation. Food Chem. 2021, 343, 128423. [Google Scholar] [CrossRef]


| Parameters | Sucrase | Maltase | Isomaltase |
|---|---|---|---|
| Substrate concentration (mM) | 20 | 20 | 20 |
| CFE protein concentration (mg/mL) | 0–0.35 | 0–0.25 | 0–0.30 |
| Specific activity (mean mU/mg ± SD) | 145 ± 31 1 | 1197 ± 183 1 | 298 ± 37 |
| Linear equation | |||
| R2 | 0.9878 | 0.9995 | 0.9859 |
| Parameters | Enzymes | ||
|---|---|---|---|
| Sucrase (tested at one concentration) | |||
| CFE tested (mg/mL) | 0.25 | ||
| App Km (mM) (95% CI) | 5.8 (2.1–12.2) | ||
| Vmax (mmol/min) (95% CI) | 0.039 (0.031–0.045) | ||
| Maltase (tested at multiple concentrations) | |||
| CFE tested (mg/mL) | 0.10 | 0.20 | 0.30 |
| App Km (mM) (95% CI) | 8.8 (6.4–11.7) | 11.6 (8.8–14.9) | 19.1 (13.9–26.1) |
| Vmax (mmol/min) (95% CI) | 0.35 (0.33–0.38) | 0.64 (0.59–0.69) | 1.04 (0.93–1.17) |
| Isomaltase (tested at multiple concentrations) | |||
| CFE tested (mg/mL) | 0.10 | 0.20 | 0.30 |
| App Km (mM) (95% CI) | 3.1 (1.55–5.07) | 8.8 (7.5–10.2) | 9.3 (7.4–11.7) |
| Vmax (mmol/min) (95% CI) | 0.082 (0.076–0.087) | 0.22 (0.21–0.22) | 0.30 (0.29–0.32) |
| Sugar | Retention Time (min) | Retention Time Precision (%CV) | Calibration Range (μM) | Regression Equation | Correlation Coefficient (R2) | LOD 1 (μM) | LOQ 1 (μM) |
|---|---|---|---|---|---|---|---|
| Glucose | 5.542 | 0.40 | 0.56–55.5 | = 1.1540 + 0.1366 | 0.9991 | 0.5952 | 1.804 |
| Sucrose | 6.842 | 0.60 | 0.29–29.2 | = 0.3299 + 0.0385 | 0.9994 | 0.4797 | 1.454 |
| Fructose | 7.808 | 1.05 | 0.56–55.5 | = 0.5741 + 0.8929 | 0.9990 | 0.6190 | 1.876 |
| Isomaltose | 10.975 | 0.50 | 0.29–29.2 | = 0.7562 + 0.0387 | 0.9999 | 0.2004 | 0.607 |
| Maltose | 19.492 | 0.93 | 0.29–29.2 | = 0.6027 + 0.0050 | 1.0000 | 0.1056 | 0.320 |
| Sugar | Glucose | Sucrose | Fructose | Isomaltose | Maltose | |||||
|---|---|---|---|---|---|---|---|---|---|---|
| Concentration (µg/mL) | Peak Area (nC×min) | %CV | Peak Area (nC×min) | %CV | Peak Area (nC×min) | %CV | Peak Area (nC×min) | %CV | Peak Area (nC×min) | %CV |
| Intra-run (n = 3)—Repeatability | ||||||||||
| 0.1 | 0.13 | 2.14 | 0.04 | 5.52 | 0.07 | 6.52 | 0.08 | 3.47 | 0.05 | 10.39 |
| 0.5 | 0.69 | 1.47 | 0.20 | 2.73 | 0.36 | 4.18 | 0.42 | 2.19 | 0.31 | 3.10 |
| 1.0 | 1.38 | 1.21 | 0.39 | 1.56 | 0.70 | 2.20 | 0.84 | 1.63 | 0.62 | 2.17 |
| 2.5 | 3.40 | 1.75 | 0.95 | 1.98 | 1.72 | 1.67 | 2.04 | 1.66 | 1.60 | 2.46 |
| 5.0 | 6.59 | 1.36 | 1.82 | 1.43 | 3.27 | 1.63 | 3.99 | 1.48 | 3.16 | 1.35 |
| 10.0 | 12.20 | 0.63 | 3.42 | 0.94 | 6.06 | 1.03 | 7.79 | 1.05 | 6.27 | 1.08 |
| Inter-day (n = 12)—Reproducibility | ||||||||||
| 0.1 | 0.12 | 12.44 | 0.04 | 7.03 | 0.06 | 10.22 | 0.08 | 5.14 | 0.06 | 12.78 |
| 0.5 | 0.66 | 6.66 | 0.19 | 5.83 | 0.35 | 9.37 | 0.41 | 5.10 | 0.30 | 7.00 |
| 1.0 | 1.29 | 7.55 | 0.37 | 4.34 | 0.67 | 7.69 | 0.80 | 4.84 | 0.60 | 5.40 |
| 2.5 | 3.19 | 6.59 | 0.91 | 4.30 | 1.64 | 8.26 | 1.97 | 4.33 | 1.53 | 5.39 |
| 5.0 | 6.17 | 6.14 | 1.74 | 3.60 | 3.06 | 7.99 | 3.85 | 4.15 | 3.03 | 4.71 |
| 10.0 | 11.58 | 5.01 | 3.32 | 3.73 | 5.76 | 8.13 | 7.56 | 4.39 | 6.05 | 3.98 |
| Criteria | Maltose | Sucrose | Isomaltose | |||
|---|---|---|---|---|---|---|
| C1 | C2 | C1 | C2 | C1 | C2 | |
| Post-assay concentration recovered (mM) | 10.89 ± 0.09 | 19.18 ± 0.23 | 10.06 ± 0.14 | 21.35 ± 0.30 | 10.82 ± 0.25 | 21.38 ± 0.28 |
| Extraction recovery (%) | 108.9 ± 0.9 | 95.9 ± 1.1 | 100.6 ± 1.4 | 106.9 ± 1.7 | 108.2 ± 2.5 | 106.9 ± 0.6 |
| Relative erroraccuracy (%REaccuracy) | 8.93 ± 0.94 | 4.10 ± 1.14 | 1.96 ± 0.30 | 6.94 ± 1.68 | 8.24 ± 2.49 | 6.92 ± 0.62 |
| Coefficient of varianceprecision (%CV precision) | 1.50 | 2.37 | 2.34 | 3.67 | 3.00 | 1.31 |
| Sugar (20 mM) ± Test Compounds | n | Peak Area 1 (nC×Time) | Precision (%CV) | One-Way ANOVA |
|---|---|---|---|---|
| Maltose only | 9 | 5.37 ± 0.29 | 5.32% | |
| Maltose + Acarbose | 6 | 4.91 ± 0.46 | 9.41% | |
| Maltose + EGCG | 5 | 4.97 ± 0.24 | 4.73% | F (6,29) = 2.284 |
| Maltose + Quercetin | 4 | 5.02 ± 0.06 | 1.23% | F critical = 2.432 |
| Maltose + Quercetagetin | 4 | 5.15 ± 0.12 | 2.37% | p-value = 0.063 |
| Maltose + Kaempferol | 4 | 5.04 ± 0.09 | 1.78% | |
| Maltose + Galangin | 4 | 5.36 ± 0.43 | 7.94% | |
| Sucrose only | 10 | 2.97 ± 0.14 | 4.68% | |
| Sucrose + Acarbose | 8 | 3.00 ± 0.18 | 5.83% | |
| Sucrose + EGCG | 4 | 2.85 ± 0.27 | 9.53% | F (6,48) = 1.218 |
| Sucrose + Quercetin | 7 | 2.93 ± 0.16 | 5.37% | F critical = 2.295 |
| Sucrose + Quercetagetin | 3 | 2.97 ± 0.04 | 1.36% | p-value = 0.314 |
| Sucrose + Kaempferol | 5 | 3.09 ± 0.05 | 1.71% | |
| Sucrose + Galangin | 7 | 3.01 ± 0.12 | 3.95% | |
| Isomaltose only | 13 | 6.51 ± 0.70 | 10.73% | |
| Isomaltose + Acarbose | 11 | 6.68 ± 0.67 | 10.11% | |
| Isomaltose + EGCG | 10 | 6.36 ± 0.18 | 2.79% | F (6,48) = 1.218 |
| Isomaltose + Quercetin | 4 | 6.50 ± 0.45 | 6.86% | F critical = 2.295 |
| Isomaltose + Quercetagetin | 3 | 6.30 ± 0.02 | 0.32% | p-value = 0.314 |
| Isomaltose + Kaempferol | 7 | 6.96 ± 0.29 | 4.15% | |
| Isomaltose + Galangin | 7 | 6.68 ± 0.49 | 7.29% |
| Compounds Tested | Drug | Flavan-3-ol | Flavonols | |||
|---|---|---|---|---|---|---|
| Acarbose | EGCG | Quercetin | Quercetagetin | Kaempferol | Galangin | |
| Chemical structure |  |  |  |  |  | |
 | ||||||
| Molecular formula | C25H43NO18 | C22H18O11 | C15H10O7 | C15H10O8 | C15H10O6 | C15H10O5 |
| Concentration (µM) | 0–200 1 | 0–1500 1 | 0–200 2 | 0–50 2 | 0–40 3 | 0–25 3 |
| Ring position and substitution | ||||||
| C3, C ring | - | galloyl | hydroxyl | hydroxyl | hydroxyl | hydroxyl |
| C5, A ring | - | OH | OH | OH | OH | OH |
| C6, A ring | - | H | H | OH | H | H |
| C7, A ring | - | OH | OH | OH | OH | OH |
| C3′, B ring | - | OH | OH | OH | H | H |
| C4′, B ring | - | OH | OH | OH | OH | H |
| C5′, B ring | - | OH | H | H | H | H |
| 50% inhibitory concentration (IC50) | ||||||
| Sucrase (µM) | 1.65 ± 0.25 a | 175.2 ± 60.1 c | 161.9 ± 13.6 c | 21.7 ± 5.3 b | ND (31%) | ND (33%) |
| Maltase (µM) | 13.9 ± 2.3 a | 186.4 ± 40.4 b | 247.3 ± 7.0 b | ND (48%) | ND (25%) | ND (22%) |
| Isomaltase (µM) | 39.1 ± 2.1 a | 461.9 ± 60.3 b | ND (18%) | ND (29%) | ND (27%) | ND (22%) |
| 25% inhibitory concentration (IC25) | ||||||
| Sucrase (µM) | 0.60 ± 0.09 a | 72.9 ± 10.3 d | 69.5 ± 8.2 d | 6.6 ± 1.8 b | 30.3 ± 8.2 c | 20.8 ± 5.5 c |
| Maltase (µM) | 4.6 ± 0.8 a | 43.8 ± 9.2 b | 82.0 ± 4.6 c | 6.7 ± 1.5 a | 44.2 ± 4.4 b | 17.6 ± 2.2 a |
| Isomaltase (µM) | 14.4 ± 1.1 a | 241.9 ± 40.4 b | ND (18%) | 20.3 ± 7.3 a | 34.0 ± 8.4 a | 29.4 ± 1.6 a |
| 15% inhibitory concentration (IC15) | ||||||
| Sucrase (µM) | 0.32 ± 0.05 a | 41.2 ± 6.0 d | 40.5 ± 5.1 d | 3.5 ± 1.1 b | 14.2 ± 3.7 c | 12.7 ± 2.1 c |
| Maltase (µM) | 2.4 ± 0.4 a | 21.7 ± 4.5 c | 43.0 ± 3.1 d | 3.4 ± 0.9 ab | 19.0 ± 5.5 bc | 8.7 ± 1.1 abc |
| Isomaltase (µM) | 7.8 ± 0.7 a | 118.6 ± 18.0 b | 104.0 ± 18.8 b | 5.9 ± 1.9 a | 12.5 ± 3.7 a | 9.3 ± 1.2 a |
Publisher’s Note: MDPI stays neutral with regard to jurisdictional claims in published maps and institutional affiliations. |
© 2021 by the authors. Licensee MDPI, Basel, Switzerland. This article is an open access article distributed under the terms and conditions of the Creative Commons Attribution (CC BY) license (https://creativecommons.org/licenses/by/4.0/).
Share and Cite
Barber, E.; Houghton, M.J.; Williamson, G. Flavonoids as Human Intestinal α-Glucosidase Inhibitors. Foods 2021, 10, 1939. https://doi.org/10.3390/foods10081939
Barber E, Houghton MJ, Williamson G. Flavonoids as Human Intestinal α-Glucosidase Inhibitors. Foods. 2021; 10(8):1939. https://doi.org/10.3390/foods10081939
Chicago/Turabian StyleBarber, Elizabeth, Michael J. Houghton, and Gary Williamson. 2021. "Flavonoids as Human Intestinal α-Glucosidase Inhibitors" Foods 10, no. 8: 1939. https://doi.org/10.3390/foods10081939