
Optimization of Natural Antioxidants Extraction from Pineapple Peel and Their Stabilization by Spray Drying

 ,
,  ,
,  ,
,  , , , and
Abstract
:
1. Introduction
2. Materials and Methods
2.1. Raw Material
2.2. Extraction Method
2.2.1. Aqueous Extraction: Experimental Design and Statistical Analysis
2.2.2. Aqueous Extraction with Optimized Conditions
2.2.3. Influence of Solvent Type
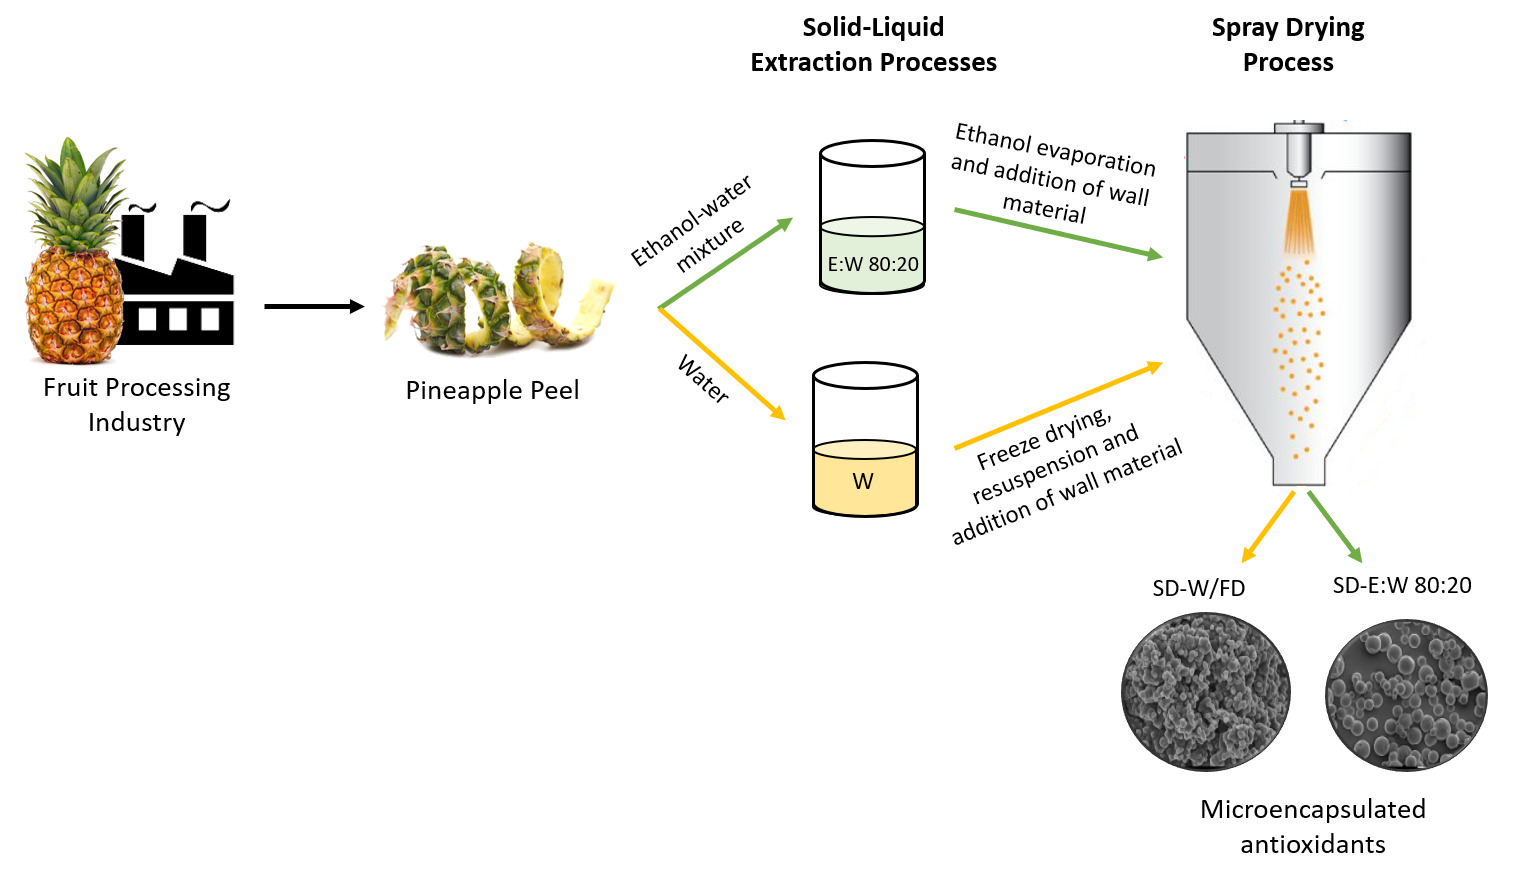
2.3. Stabilization of the Bioactive Extracts by Encapsulation Using Drying Processes
2.3.1. Direct Addition of Wall Material to Extracts Followed by Spray Drying
2.3.2. Freeze Drying
2.3.3. Encapsulation of Freeze Drying Powder by Spray Drying
2.4. Spray Drying and Microparticles’ Characterization
2.4.1. Morphological Characterization of Microparticles
2.4.2. Preparation of Extracts from Microparticles
2.4.3. Particles Loading
2.5. Analytical Methods
2.5.1. Total Soluble Solids, pH, Color, and Moisture Content
2.5.2. Total Phenolic Content (TPC)
2.5.3. Identification of Phenolic Compounds
Identification by HPLC
Mass Spectrometry
2.5.4. Antioxidant Activity
DPPH Assay
FRAP Assay
2.6. Statistical Analysis
3. Results
3.1. Efficiency of Extraction Methods
3.1.1. Aqueous Extraction
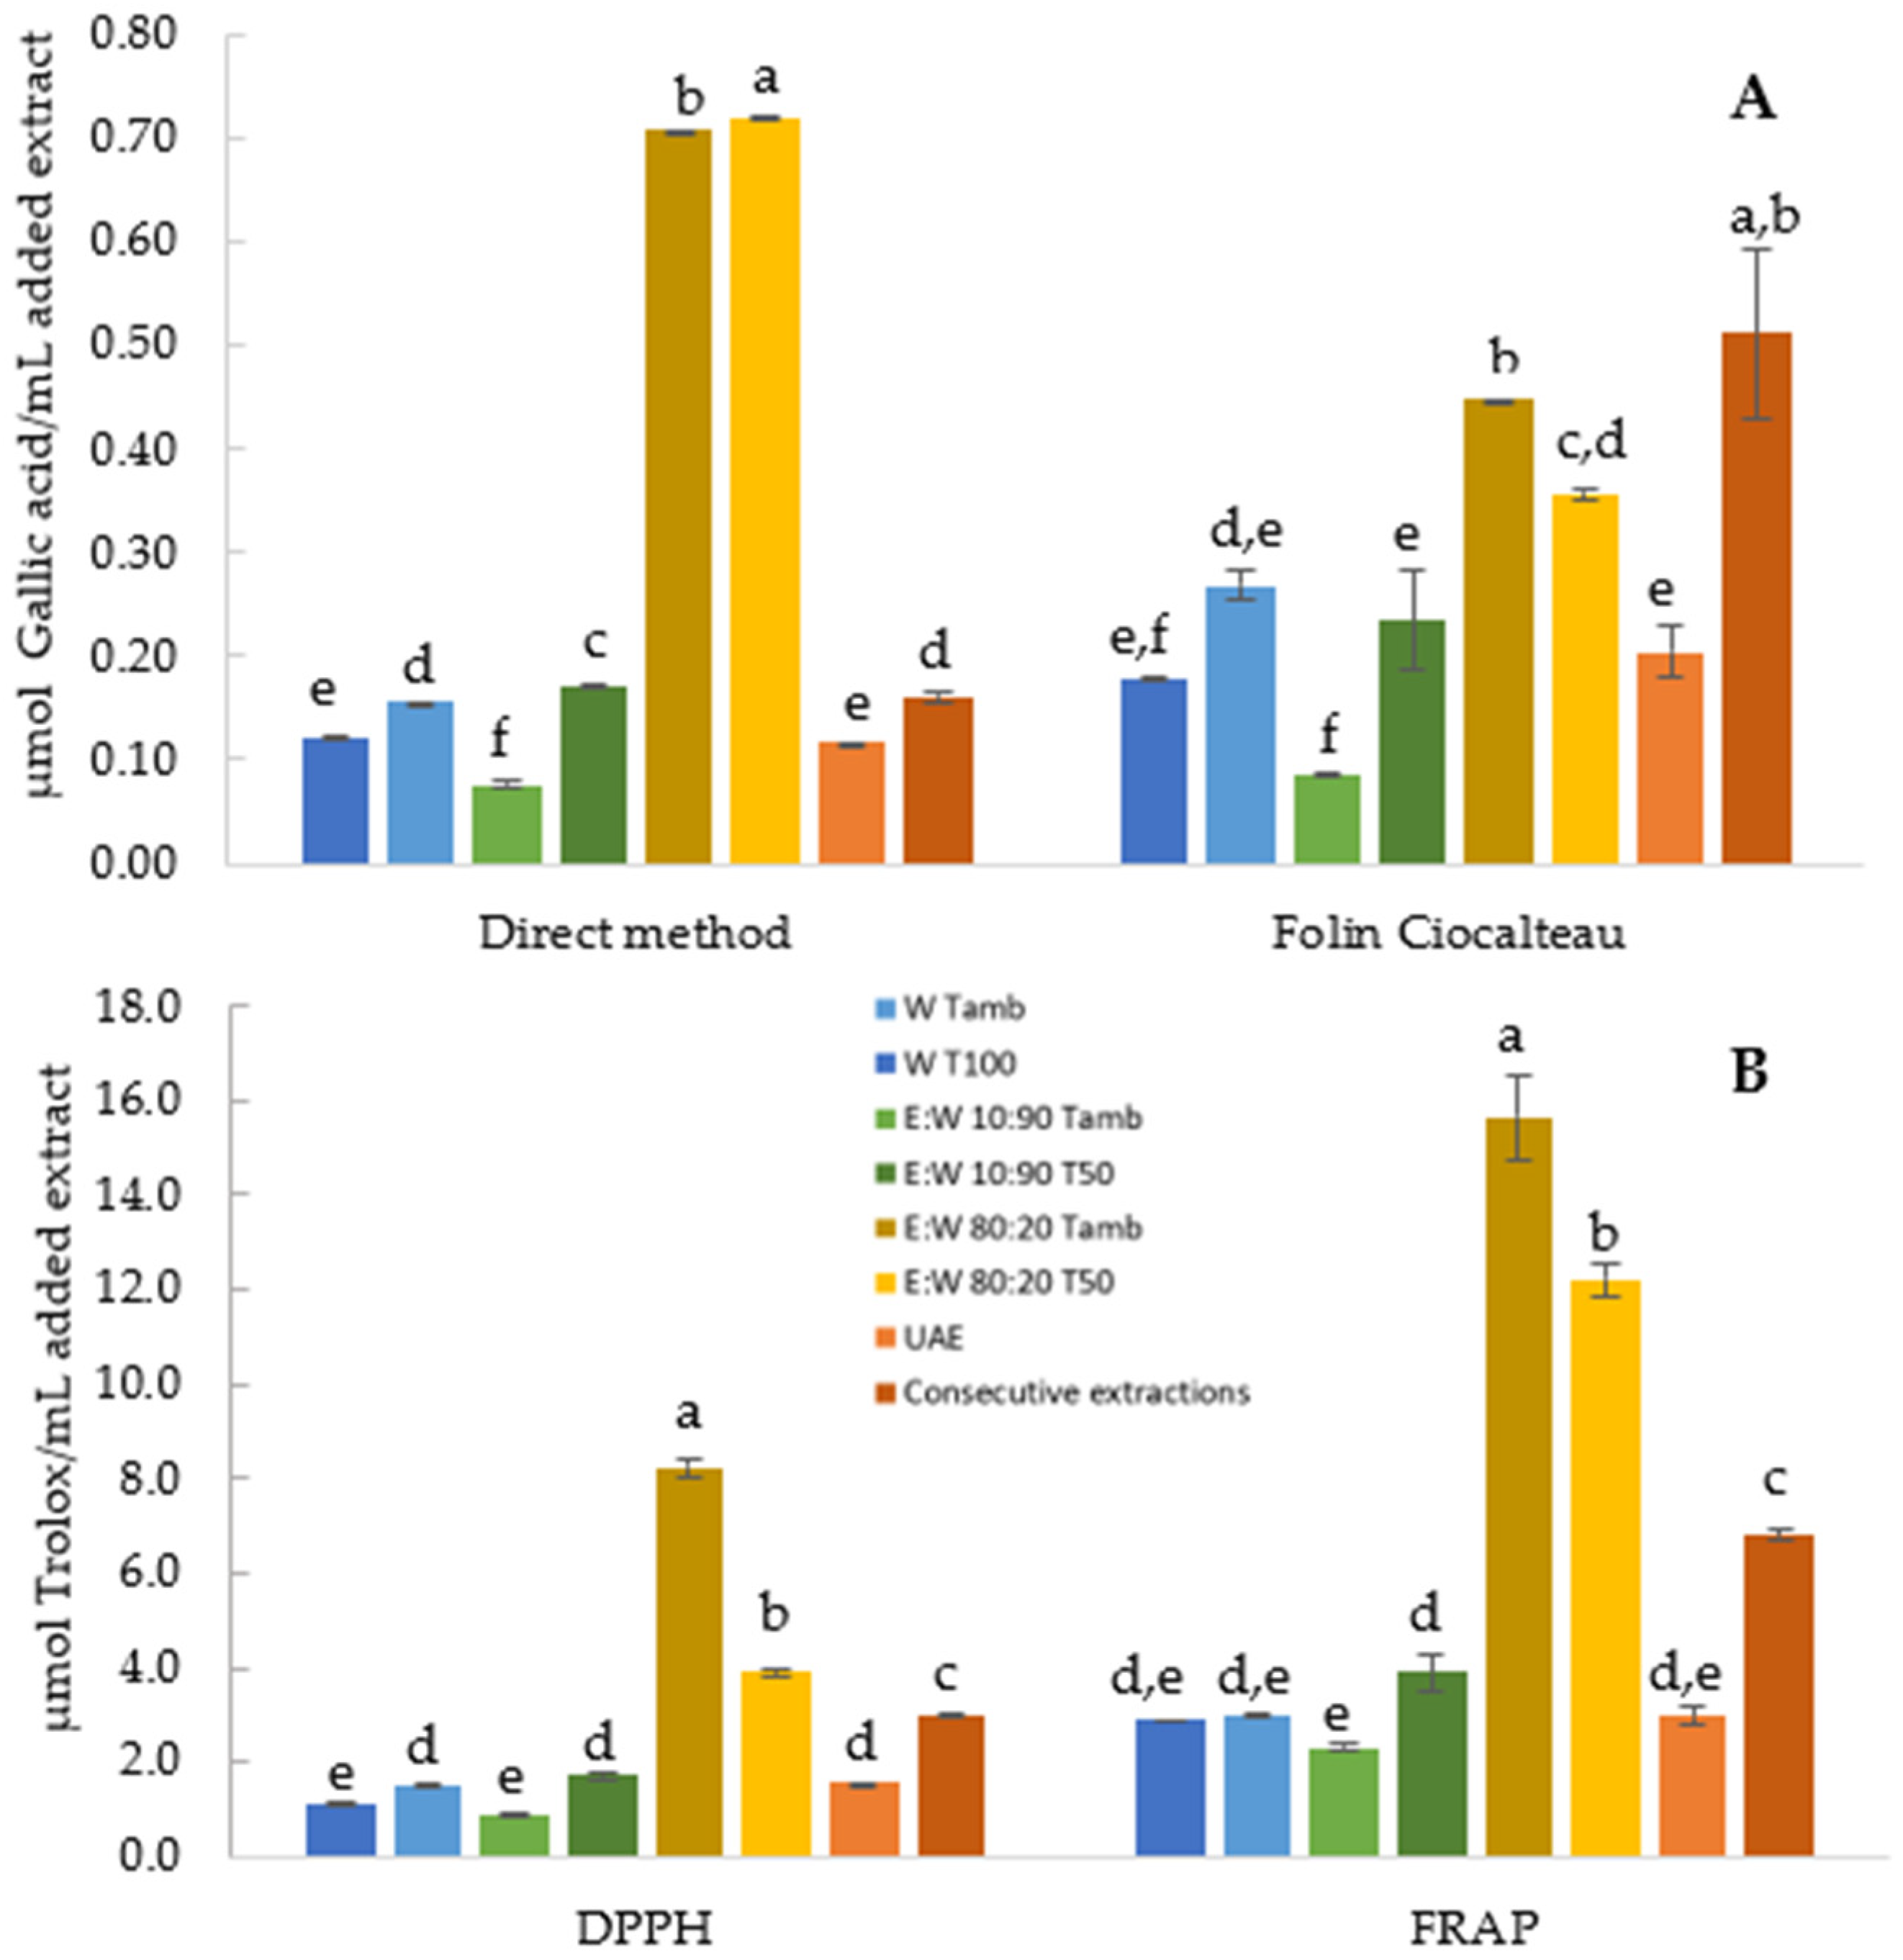
3.1.2. Effect of Type of Solvent, Temperature, and Extraction Process
3.1.3. Major Physicochemical Properties of Selected Extracts
3.2. Effect of Drying Stabilization Processes
3.2.1. TPC and AOA
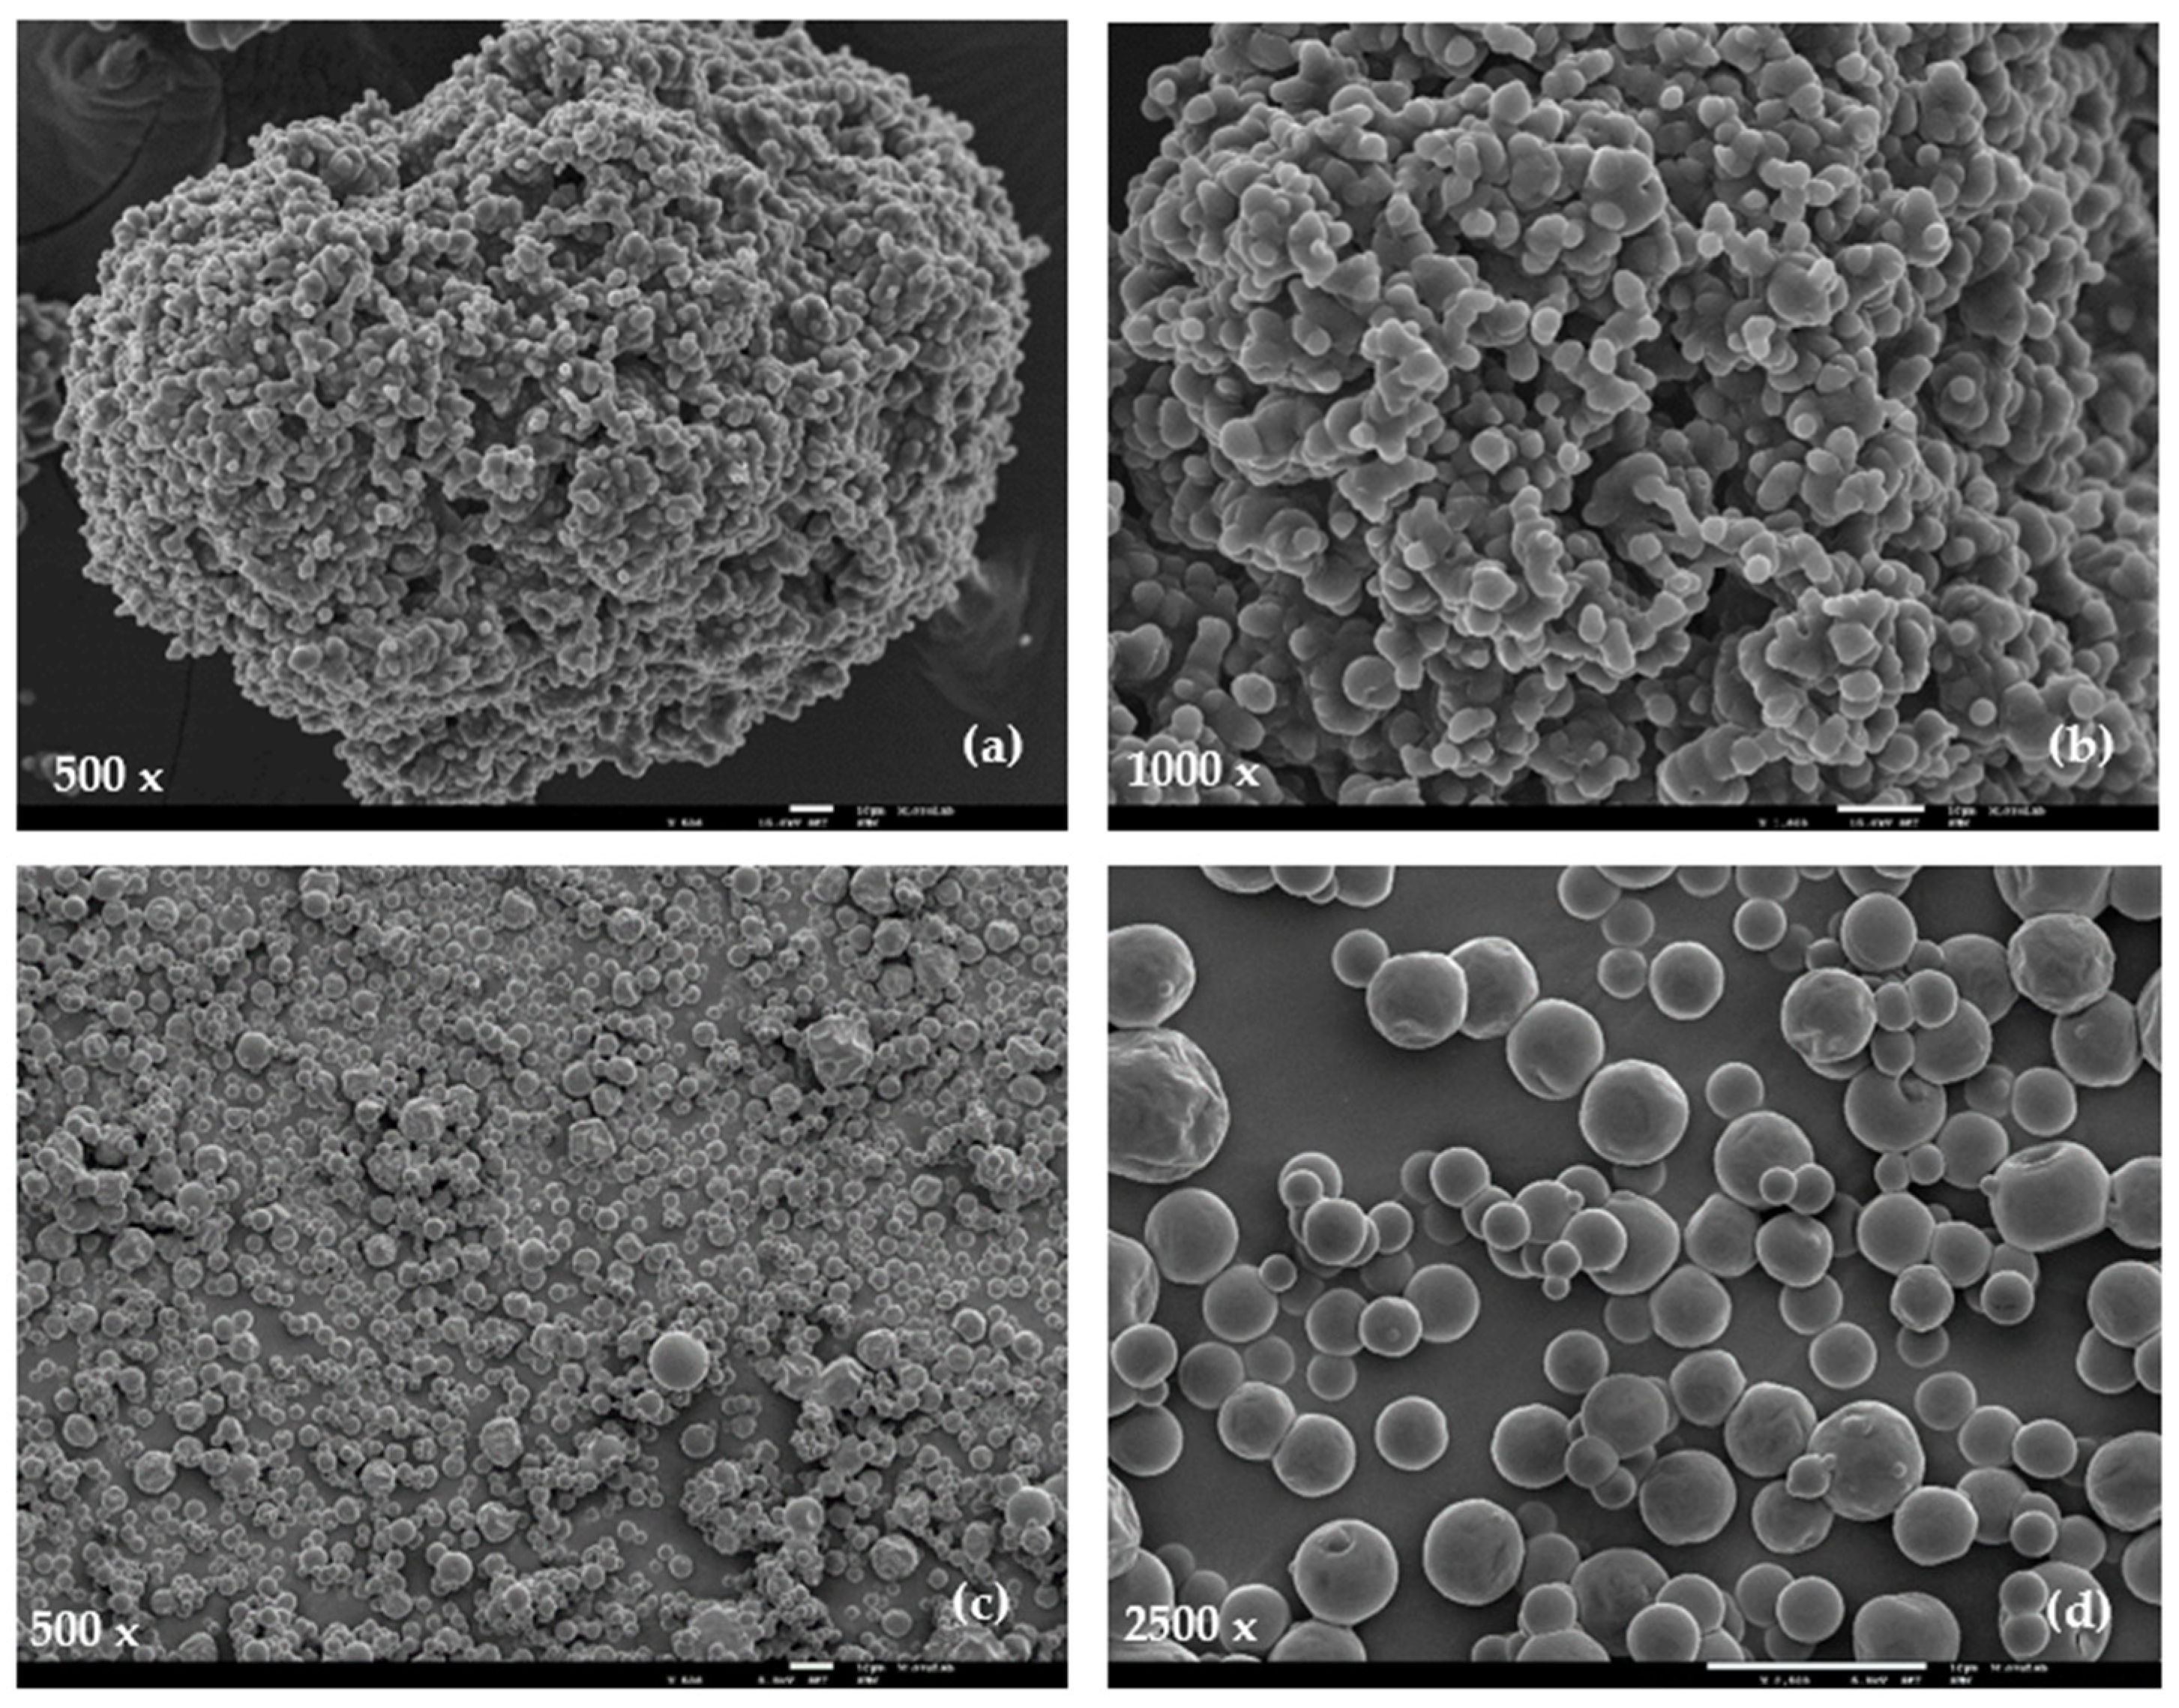
3.2.2. Particles Morphology
3.2.3. Phenolic Profile before and after Encapsulation
3.2.4. LC-HRMS/MS Analysis
4. Conclusions
Supplementary Materials
Author Contributions
Funding
Institutional Review Board Statement
Informed Consent Statement
Conflicts of Interest
References
- Plazzotta, S.; Manzocco, L.; Nicoli, M.C. Fruit and vegetable waste management and the challenge of fresh-cut salad. Trends Food Sci. Technol. 2017, 63, 51–59. [Google Scholar] [CrossRef]
- Roda, A.; De Faveri, D.M.; Giacosa, S.; Dordoni, R.; Lambri, M. Effect of pre-treatments on the saccharification of pineapple waste as a potential source for vinegar production. J. Clean Prod. 2016, 112 Pt 5, 4477–4484. [Google Scholar] [CrossRef]
- Guo, C.; Yang, J.; Wei, J.; Li, Y.; Xu, J.; Jiang, Y. Antioxidant activities of peel, pulp and seed fractions of common fruits as determined by FRAP assay. Nutr. Res. 2003, 23, 1719–1726. [Google Scholar] [CrossRef]
- Ajila, C.M.; Bhat, S.G.; Prasada Rao, U.J.S. Valuable components of raw and ripe peels from two Indian mango varieties. Food Chem. 2007, 102, 1006–1011. [Google Scholar] [CrossRef]
- Safdar, M.N.; Kausar, T.; Jabbar, S.; Mumtaz, A.; Ahad, K.; Saddozai, A.A. Extraction and quantification of polyphenols from kinnow (Citrus reticulate L.) peel using ultrasound and maceration techniques. J. Food Drug Anal. 2017, 25, 488–500. [Google Scholar] [CrossRef] [Green Version]
- De Oliveira, A.C.; Valentim, I.B.; Silva, C.A.; Bechara, E.J.H.; de Barros, M.P.; Mano, C.M.; Goulart, M.O.F. Total phenolic content and free radical scavenging activities of methanolic extract powders of tropical fruit residues. Food Chem. 2009, 115, 469–475. [Google Scholar] [CrossRef]
- Dai, H.; Ou, S.; Liu, Z.; Huang, H. Pineapple peel carboxymethyl cellulose/polyvinyl alcohol/mesoporous silica SBA-15 hydrogel composites for papain immobilization. Carbohydr. Polym. 2017, 169 (Suppl. C), 504–514. [Google Scholar] [CrossRef]
- Ketnawa, S.; Chaiwut, P.; Rawdkuen, S. Pineapple wastes: A potential source for bromelain extraction. Food Bioprod. Process. 2012, 90, 385–391. [Google Scholar] [CrossRef]
- Lu, X.-H.; Sun, D.-Q.; Wu, Q.-S.; Liu, S.-H.; Sun, G.-M. Physico-chemical properties, antioxidant activity and mineral contents of pineapple genotypes grown in China. Molecules 2014, 19, 8518–8532. [Google Scholar] [CrossRef]
- Guo, J.; Miao, Z.; Wan, J.; Guo, X. Pineapple peel bromelain extraction using gemini surfactant-based reverse micelle—Role of spacer of gemini surfactant. Sep. Purif. Technol. 2018, 190 (Suppl. C), 156–164. [Google Scholar] [CrossRef]
- Erukainure, O.L.; Ajiboye, J.A.; Adejobi, R.O.; Okafor, O.Y.; Kosoko, S.B.; Owolabi, F.O. Effect of pineapple peel extract on total phospholipids and lipid peroxidation in brain tissues of rats. Asian Pac. J. Trop. 2011, 4, 182–184. [Google Scholar] [CrossRef] [Green Version]
- Gil, L.S.; Maupoey, P.F. An Integrated Approach for Pineapple Waste Valorisation. Bioethanol Production and Bromelain Extraction from Pineapple Residues. J. Clean. Prod. 2017. [Google Scholar] [CrossRef]
- Ignat, I.; Volf, I.; Popa, V.I. A critical review of methods for characterisation of polyphenolic compounds in fruits and vegetables. Food Chem. 2011, 126, 1821–1835. [Google Scholar] [CrossRef] [PubMed]
- Caleja, C.; Barros, L.; Antonio, A.L.; Oliveira, M.B.P.P.; Ferreira, I.C.F.R. A comparative study between natural and synthetic antioxidants: Evaluation of their performance after incorporation into biscuits. Food Chem. 2017, 216 (Suppl. C), 342–346. [Google Scholar] [CrossRef] [Green Version]
- Yang, Y.; Song, X.; Sui, X.; Qi, B.; Wang, Z.; Li, Y.; Jiang, L. Rosemary extract can be used as a synthetic antioxidant to improve vegetable oil oxidative stability. Ind. Crop. Prod. 2016, 80 (Suppl. C), 141–147. [Google Scholar] [CrossRef]
- Zia-ur, R. Citrus peel extract—A natural source of antioxidant. Food Chem. 2006, 99, 450–454. [Google Scholar] [CrossRef]
- González-Montelongo, R.; Gloria Lobo, M.; González, M. Antioxidant activity in banana peel extracts: Testing extraction conditions and related bioactive compounds. Food Chem. 2010, 119, 1030–1039. [Google Scholar] [CrossRef]
- Li, Y.; Guo, C.; Yang, J.; Wei, J.; Xu, J.; Cheng, S. Evaluation of antioxidant properties of pomegranate peel extract in comparison with pomegranate pulp extract. Food Chem. 2006, 96, 254–260. [Google Scholar] [CrossRef]
- De Oliveira, R.C.; de Barros, S.T.D.; Gimenes, M.L. The extraction of passion fruit oil with green solvents. J. Food Eng. 2013, 117, 458–463. [Google Scholar] [CrossRef]
- Caldas, T.W.; Mazza, K.E.L.; Teles, A.S.C.; Mattos, G.N.; Brígida, A.I.S.; Conte-Junior, C.A.; Borguini, R.G.; Godoy, R.L.O.; Cabral, L.M.C.; Tonon, R.V. Phenolic compounds recovery from grape skin using conventional and non-conventional extraction methods. Ind. Crop. Prod. 2018, 111 (Suppl. C), 86–91. [Google Scholar] [CrossRef]
- Kazemi, M.; Karim, R.; Mirhosseini, H.; Abdul Hamid, A. Optimization of pulsed ultrasound-assisted technique for extraction of phenolics from pomegranate peel of Malas variety: Punicalagin and hydroxybenzoic acids. Food Chem. 2016, 206 (Suppl. C), 156–166. [Google Scholar] [CrossRef] [PubMed]
- Luthria, D.L. Optimization of extraction of phenolic acids from a vegetable waste product using a pressurized liquid extractor. J. Funct. Foods 2012, 4, 842–850. [Google Scholar] [CrossRef]
- De Andrade Lima, M.; Charalampopoulos, D.; Chatzifragkou, A. Optimisation and modelling of supercritical CO2 extraction process of carotenoids from carrot peels. J. Supercrit. Fluids 2018, 133 Pt 1, 94–102. [Google Scholar] [CrossRef]
- Rasheed, A.; Cobham, E.; ZEIGHMAMI, M.; Ong, S. Extraction of phenolic compounds from pineapple fruit. In Proceedings of the 2nd International Symposium on Processing & Drying of Foods, Fruits & Vegetables, Kuala Lumpur, Malaysia, 8–19 June 2012. [Google Scholar]
- Caleja, C.; Barros, L.; Antonio, A.L.; Carocho, M.; Oliveira, M.B.P.P.; Ferreira, I.C.F.R. Fortification of yogurts with different antioxidant preservatives: A comparative study between natural and synthetic additives. Food Chem. 2016, 210 (Suppl. C), 262–268. [Google Scholar] [CrossRef] [Green Version]
- Aguiar, J.; Estevinho, B.N.; Santos, L. Microencapsulation of natural antioxidants for food application—The specific case of coffee antioxidants—A review. Trends Food Sci. Technol. 2016, 58 (Suppl. C), 21–39. [Google Scholar] [CrossRef]
- Supapvanich, S.; Prathaan, P.; Tepsorn, R. Browning inhibition in fresh-cut rose apple fruit cv. Taaptimjaan using konjac glucomannan coating incorporated with pineapple fruit extract. Postharvest Biol. Technol. 2012, 73, 46–49. [Google Scholar] [CrossRef]
- Chaisakdanugull, C.; Theerakulkait, C.; Wrolstad, R.E. Pineapple juice and its fractions in enzymatic browning inhibition of banana [Musa (AAA Group) Gros Michel]. J. Agric. Food Chem. 2007, 55, 4252–4257. [Google Scholar] [CrossRef]
- Saisung, P.; Theerakulkait, C. Inhibitory effect of pineapple shell extract and its ultrafiltered fractions on polyphenol oxidase activity and browning in fresh-cut banana slices Efecto inhibidor de extracto de cáscara de piña y sus fracciones ultrafiltradas en la actividad polifenoloxidasa y pardeamiento de rodajas de plátano recién cortadas. CyTA-J. Food 2011, 9, 37–42. [Google Scholar] [CrossRef]
- Theerakulkait, C.; Saisung, P. Effect of pineapple shell extracts on browning in fresh vegetable and fruit puree and slices. Kasetsart J. 2006, 40, 182–188. [Google Scholar]
- Cho, I.-H.; Zoh, K.-D. Photocatalytic degradation of azo dye (Reactive Red 120) in TiO2/UV system: Optimization and modeling using a response surface methodology (RSM) based on the central composite design. Dyes Pigm. 2007, 75, 533–543. [Google Scholar] [CrossRef]
- Lundstedt, T.; Seifert, E.; Abramo, L.; Thelin, B.; Nyström, Å.; Pettersen, J.; Bergman, R. Experimental design and optimization. Chemom. Intell. Lab. Syst. 1998, 42, 3–40. [Google Scholar] [CrossRef]
- Box, G.E.; Hunter, W.G.; Hunter, J.S. Statistics for Experimenters: An Introduction to Design, Data Analysis, and Model Building. JSTOR 1979, 35, 528–529. [Google Scholar]
- Hashib, S.A.; Rahman, N.A.; Suzihaque, M.U.H.; Ibrahim, U.K.; Hanif, N.E. Effect of Slurry Concentration and Inlet Temperature Towards Glass Temperature of Spray Dried Pineapple Powder. Procedia Soc. Behav. Sci. 2015, 195, 2660–2667. [Google Scholar] [CrossRef] [Green Version]
- Jittanit, W.; Niti-Att, S.; Techanuntachaikul, O. Study of spray drying of pineapple juice using maltodextrin as an adjunct. Chiang Mai J. Sci. 2010, 37, 498–506. [Google Scholar]
- Abadio, F.D.B.; Domingues, A.M.; Borges, S.V.; Oliveira, V.M. Physical properties of powdered pineapple (Ananas comosus) juice—Effect of malt dextrin concentration and atomization speed. J. Food Eng. 2004, 64, 285–287. [Google Scholar] [CrossRef]
- Su, Y.L.; Fu, Z.Y.; Zhang, J.Y.; Wang, W.M.; Wang, H.; Wang, Y.C.; Zhang, Q.J. Microencapsulation of Radix salvia miltiorrhiza nanoparticles by spray-drying. Powder Technol. 2008, 184, 114–121. [Google Scholar] [CrossRef]
- Lourenço, S.C.; Moldão-Martins, M.; Alves, V.D. Microencapsulation of Pineapple Peel Extract by Spray Drying Using Maltodextrin, Inulin, and Arabic Gum as Wall Matrices. Foods 2020, 9, 718. [Google Scholar] [CrossRef]
- Rocha, G.A.; Fávaro-Trindade, C.S.; Grosso, C.R.F. Microencapsulation of lycopene by spray drying: Characterization, stability and application of microcapsules. Food Bioprod. Process. 2012, 90, 37–42. [Google Scholar] [CrossRef]
- Nadzirah, K.; Zainal, S.; Noriham, A.; Normah, I.; Siti Roha, A.; Nadya, H. Physico-chemical properties of pineapple variety N36 harvested and stored at different maturity stages. Int. Food Res. J. 2013, 20, 225–231. [Google Scholar]
- Rolle, L.; Torchio, F.; Lorrain, B.; Giacosa, S.; Segade, S.R.; Cagnasso, E.; Gerbi, V.; Teissedre, P.-L. Rapid methods for the evaluation of total phenol content and extractability in intact grape seeds of Cabernet-Sauvignon: Instrumental mechanical properties and FT-NIR spectrum. OENO One 2012, 46, 29–40. [Google Scholar] [CrossRef]
- Ribéreau-Gayon, P.; Glories, Y.; Maujean, A.; Dubourdieu, D. Alcohols and other volatile compounds. In Handbook of Enology: The Chemistry of Wine Stabilization and Treatments, 2nd ed.; John Wiley & Sons, Ltd.: Chichester, UK, 2006; Volume 2, pp. 51–64. [Google Scholar]
- Mokrani, A.; Madani, K. Effect of solvent, time and temperature on the extraction of phenolic compounds and antioxidant capacity of peach (Prunus persica L.) fruit. Sep. Purif. Technol. 2016, 162, 68–76. [Google Scholar] [CrossRef]
- Campos, D.A.; Ribeiro, T.B.; Teixeira, J.A.; Pastrana, L.; Pintado, M.M. Integral valorization of pineapple (Ananas comosus L.) by-products through a green chemistry approach towards added value ingredients. Foods 2020, 9, 60. [Google Scholar] [CrossRef] [PubMed] [Green Version]
- Sanchez, C.; Serrano, C.; Oliveira, M.; Vasilenko, P.; Santos, M.; Sousa, R. Differential susceptibility of Morettini pears to blue mold caused by Penicillium expansum. J. Food Agric. 2016, 374–380. [Google Scholar] [CrossRef] [Green Version]
- Sharif, S.; Nabais, P.; Melo, M.J.; Oliveira, M.C. Traditional Yellow Dyes Used in the 21st Century in Central Iran: The Knowledge of Master Dyers Revealed by HPLC-DAD and UHPLC-HRMS/MS. Molecules 2020, 25, 908. [Google Scholar] [CrossRef] [Green Version]
- Pinelo, M.; Fabbro, P.D.; Manzocco, L.; Nuñez, M.J.; Nicoli, M.C. Optimization of continuous phenol extraction from Vitis vinifera byproducts. Food Chem. 2005, 92, 109–117. [Google Scholar] [CrossRef]
- Pompeu, D.R.; Silva, E.M.; Rogez, H. Optimisation of the solvent extraction of phenolic antioxidants from fruits of Euterpe oleracea using Response Surface Methodology. Bioresour. Technol. 2009, 100, 6076–6082. [Google Scholar] [CrossRef]
- Spigno, G.; Tramelli, L.; De Faveri, D.M. Effects of extraction time, temperature and solvent on concentration and antioxidant activity of grape marc phenolics. J. Food Eng. 2007, 81, 200–208. [Google Scholar] [CrossRef]
- Cacace, J.E.; Mazza, G. Mass transfer process during extraction of phenolic compounds from milled berries. J. Food Eng. 2003, 59, 379–389. [Google Scholar] [CrossRef]
- Belwal, T.; Dhyani, P.; Bhatt, I.D.; Rawal, R.S.; Pande, V. Optimization extraction conditions for improving phenolic content and antioxidant activity in Berberis asiatica fruits using response surface methodology (RSM). Food Chem. 2016, 207, 115–124. [Google Scholar] [CrossRef] [PubMed]
- Wissam, Z.; Ghada, B.; Wassim, A.; Warid, K. Effective extraction of polyphenols and proanthocyanidins from pomegranate’s peel. Int. J. Pharm. Pharm. Sci. 2012, 4 (Suppl. 3), 675–682. [Google Scholar]
- Alberti, A.; Zielinski, A.A.F.; Zardo, D.M.; Demiate, I.M.; Nogueira, A.; Mafra, L.I. Optimisation of the extraction of phenolic compounds from apples using response surface methodology. Food Chem. 2014, 149, 151–158. [Google Scholar] [CrossRef] [PubMed] [Green Version]
- Liyana-Pathirana, C.; Shahidi, F. Optimization of extraction of phenolic compounds from wheat using response surface methodology. Food Chem. 2005, 93, 47–56. [Google Scholar] [CrossRef]
- Silva, E.M.; Rogez, H.; Larondelle, Y. Optimization of extraction of phenolics from Inga edulis leaves using response surface methodology. Sep. Purif. Technol. 2007, 55, 381–387. [Google Scholar] [CrossRef]
- Chanioti, S.; Tzia, C. Optimization of ultrasound-assisted extraction of oil from olive pomace using response surface technology: Oil recovery, unsaponifiable matter, total phenol content and antioxidant activity. LWT Food Sci. Technol. 2017, 79, 178–189. [Google Scholar] [CrossRef]
- Wani, S.M.; Jan, N.; Wani, T.A.; Ahmad, M.; Masoodi, F.A.; Gani, A. Optimization of antioxidant activity and total polyphenols of dried apricot fruit extracts (Prunus armeniaca L.) using response surface methodology. J. Saudi Soc. Agric. Sci. 2017, 16, 119–126. [Google Scholar] [CrossRef] [Green Version]
- Alothman, M.; Bhat, R.; Karim, A.A. Antioxidant capacity and phenolic content of selected tropical fruits from Malaysia, extracted with different solvents. Food Chem. 2009, 115, 785–788. [Google Scholar] [CrossRef]
- Benmeziane, F.; Djamai, R.; Cadot, Y.; Seridi, R. Optimization of extraction parameters of phenolic compounds from Algerian fresh table grapes, (Vitis vinifera). Int. Food Res. J. 2014, 21, 1025–1029. [Google Scholar]
- Fathordoobady, F.; Mirhosseini, H.; Selamat, J.; Manap, M.Y.A. Effect of solvent type and ratio on betacyanins and antioxidant activity of extracts from Hylocereus polyrhizus flesh and peel by supercritical fluid extraction and solvent extraction. Food Chem. 2016, 202 (Suppl. C), 70–80. [Google Scholar] [CrossRef] [PubMed]
- Do, Q.D.; Angkawijaya, A.E.; Tran-Nguyen, P.L.; Huynh, L.H.; Soetaredjo, F.E.; Ismadji, S.; Ju, Y.-H. Effect of extraction solvent on total phenol content, total flavonoid content, and antioxidant activity of Limnophila aromatica. J. Food Drug Anal. 2014, 22, 296–302. [Google Scholar] [CrossRef] [Green Version]
- Chew, K.; Khoo, M.; Ng, S.; Thoo, Y.; Wan Aida, W.; Ho, C. Effect of ethanol concentration, extraction time and extraction temperature on the recovery of phenolic compounds and antioxidant capacity of Orthosiphon stamineus extracts. Int. Food Res. J. 2011, 18, 1427. [Google Scholar]
- M’hiri, N.; Ioannou, I.; Ghoul, M.; Boudhrioua, N.M. Extraction methods of citrus peel phenolic compounds. Food Rev. Int. 2014, 30, 265–290. [Google Scholar] [CrossRef]
- Chemat, F.; Rombaut, N.; Sicaire, A.-G.; Meullemiestre, A.; Fabiano-Tixier, A.-S.; Abert-Vian, M. Ultrasound assisted extraction of food and natural products. Mechanisms, techniques, combinations, protocols and applications. A review. Ultrason. Sonochem. 2017, 34, 540–560. [Google Scholar] [CrossRef]
- Salar, R.K.; Purewal, S.S.; Bhatti, M.S. Optimization of extraction conditions and enhancement of phenolic content and antioxidant activity of pearl millet fermented with Aspergillus awamori MTCC-548. Resour. Effic. Technol. 2016, 2, 148–157. [Google Scholar] [CrossRef] [Green Version]
- Garmus, T.T.; Paviani, L.C.; Queiroga, C.L.; Cabral, F.A. Extraction of phenolic compounds from pepper-rosmarin (Lippia sidoides Cham.) leaves by sequential extraction in fixed bed extractor using supercritical CO2, ethanol and water as solvents. J. Supercrit. Fluids 2015, 99 (Suppl. C), 68–75. [Google Scholar] [CrossRef]
- Pérez-Jiménez, J.; Arranz, S.; Tabernero, M.; Díaz- Rubio, M.E.; Serrano, J.; Goñi, I.; Saura-Calixto, F. Updated methodology to determine antioxidant capacity in plant foods, oils and beverages: Extraction, measurement and expression of results. Food Res. Int. 2008, 41, 274–285. [Google Scholar] [CrossRef]
- Selvamuthukumaran, M.; Shi, J. Recent advances in extraction of antioxidants from plant by-products processing industries. Food Qual. Saf. 2017, 1, 61–81. [Google Scholar] [CrossRef]
- Vilkhu, K.; Mawson, R.; Simons, L.; Bates, D. Applications and opportunities for ultrasound assisted extraction in the food industry—A review. Innov. Food Sci. Emerg. Technol. 2008, 9, 161–169. [Google Scholar] [CrossRef]
- Casazza, A.A.; Aliakbarian, B.; Mantegna, S.; Cravotto, G.; Perego, P. Extraction of phenolics from Vitis vinifera wastes using non-conventional techniques. J. Food Eng. 2010, 100, 50–55. [Google Scholar] [CrossRef]
- Prakash Maran, J.; Manikandan, S.; Vigna Nivetha, C.; Dinesh, R. Ultrasound assisted extraction of bioactive compounds from Nephelium lappaceum L. fruit peel using central composite face centered response surface design. Arab. J. Chem. 2017, 10, S1145–S1157. [Google Scholar] [CrossRef] [Green Version]
- Pan, Z.; Qu, W.; Ma, H.; Atungulu, G.G.; McHugh, T.H. Continuous and pulsed ultrasound-assisted extractions of antioxidants from pomegranate peel. Ultrason. Sonochem. 2011, 18, 1249–1257. [Google Scholar] [CrossRef]
- Selani, M.M.; Brazaca, S.G.C.; dos Santos Dias, C.T.; Ratnayake, W.S.; Flores, R.A.; Bianchini, A. Characterisation and potential application of pineapple pomace in an extruded product for fibre enhancement. Food Chem. 2014, 163, 23–30. [Google Scholar] [CrossRef] [Green Version]
- Li, T.; Shen, P.; Liu, W.; Liu, C.; Liang, R.; Yan, N.; Chen, J. Major polyphenolics in pineapple peels and their antioxidant interactions. Int. J. Food Prop. 2014, 17, 1805–1817. [Google Scholar] [CrossRef]
- Lutz, M.; Hernández, J.; Henríquez, C. Phenolic content and antioxidant capacity in fresh and dry fruits and vegetables grown in Chile. CyTA J. Food 2015, 13, 541–547. [Google Scholar]
- Hossain, M.A.; Rahman, S.M.M. Total phenolics, flavonoids and antioxidant activity of tropical fruit pineapple. Food Res. Int. 2011, 44, 672–676. [Google Scholar] [CrossRef]
- Martínez, R.; Torres, P.; Meneses, M.A.; Figueroa, J.G.; Pérez-Álvarez, J.A.; Viuda-Martos, M. Chemical, technological and in vitro antioxidant properties of mango, guava, pineapple and passion fruit dietary fibre concentrate. Food Chem. 2012, 135, 1520–1526. [Google Scholar] [CrossRef]
- Ramírez, M.J.; Giraldo, G.I.; Orrego, C.E. Modeling and stability of polyphenol in spray-dried and freeze-dried fruit encapsulates. Powder Technol. 2015, 277 (Suppl. C), 89–96. [Google Scholar] [CrossRef]
- Tontul, I.; Topuz, A. Spray-drying of fruit and vegetable juices: Effect of drying conditions on the product yield and physical properties. Trends Food Sci. Technol. 2017, 63, 91–102. [Google Scholar] [CrossRef]
- Fang, Z.; Bhandari, B. Effect of spray drying and storage on the stability of bayberry polyphenols. Food Chem. 2011, 129, 1139–1147. [Google Scholar] [CrossRef]
- Anagnostopoulou, M.A.; Kefalas, P.; Papageorgiou, V.P.; Assimopoulou, A.N.; Boskou, D. Radical scavenging activity of various extracts and fractions of sweet orange peel (Citrus sinensis). Food Chem. 2006, 94, 19–25. [Google Scholar] [CrossRef]
- Ismail, A.; Marjan, Z.M.; Foong, C.W. Total antioxidant activity and phenolic content in selected vegetables. Food Chem. 2004, 87, 581–586. [Google Scholar] [CrossRef]
- Shofinita, D.; Feng, S.; Langrish, T.A.G. Comparing yields from the extraction of different citrus peels and spray drying of the extracts. Adv. Powder Technol. 2015, 26, 1633–1638. [Google Scholar] [CrossRef]
- Alves, A.I.; Rodrigues, M.Z.; Pinto, M.R.M.R.; Vanzela, E.S.L.; Stringheta, P.C.; Perrone, Í.T.; Ramos, A.M. Morphological characterization of pequi extract microencapsulated through spray drying. Int. J. Food Prop. 2017, 1–8. [Google Scholar] [CrossRef] [Green Version]
- Edrisi Sormoli, M.; Langrish, T.A.G. Spray drying bioactive orange-peel extracts produced by Soxhlet extraction: Use of WPI, antioxidant activity and moisture sorption isotherms. LWT Food Sci. Technol. 2016, 72, 1–8. [Google Scholar] [CrossRef]
- Yousefi, S.; Emam-Djomeh, Z.; Mousavi, S. Effect of carrier type and spray drying on the physicochemical properties of powdered and reconstituted pomegranate juice (Punica granatum L.). J. Food Sci. Technol. 2011, 48, 677–684. [Google Scholar] [CrossRef] [PubMed] [Green Version]
- Saikia, S.; Mahnot, N.K.; Mahanta, C.L. Effect of spray drying of four fruit juices on physicochemical, phytochemical and antioxidant properties. J. Food Process. Preserv. 2015, 39, 1656–1664. [Google Scholar] [CrossRef]
- Tonon, R.V.; Freitas, S.S.; Hubinger, M.D. Spray drying of açai (Euterpe oleraceae Mart.) juice: Effect of inlet air temperature and type of carrier agent. J. Food Process. Preserv. 2011, 35, 691–700. [Google Scholar] [CrossRef]
- Saénz, C.; Tapia, S.; Chávez, J.; Robert, P. Microencapsulation by spray drying of bioactive compounds from cactus pear (Opuntia ficus-indica). Food Chem. 2009, 114, 616–622. [Google Scholar] [CrossRef]
- Du, L.; Sun, G.; Zhang, X.; Liu, Y.; Prinyawiwatkul, W.; Xu, Z.; Shen, Y. Comparisons and correlations of phenolic profiles and anti-oxidant activities of seventeen varieties of pineapple. Food Sci. Biotechnol. 2016, 25, 445–451. [Google Scholar] [CrossRef]
- Wen, L.; Wrolstad, R. Phenolic composition of authentic pineapple juice. J. Food Sci. 2002, 67, 155–161. [Google Scholar] [CrossRef]
- Steingass, C.B.; Glock, M.P.; Schweiggert, R.M.; Carle, R. Studies into the phenolic patterns of different tissues of pineapple (Ananas comosus [L.] Merr.) infructescence by HPLC-DAD-ESI-MS n and GC-MS analysis. Anal. Bioanal. Chem. 2015, 407, 6463–6479. [Google Scholar] [CrossRef]
- Difonzo, G.; Vollmer, K.; Caponio, F.; Pasqualone, A.; Carle, R.; Steingass, C. Characterisation and classification of pineapple (Ananas comosus [L.] Merr.) juice from pulp and peel. Food Cont. 2019, 96, 260–270. [Google Scholar] [CrossRef]
- Ogawa, E.M.; Costa, H.B.; Ventura, J.A.; Caetano, L.C.; Pinto, F.E.; Oliveira, B.G.; Barroso, M.E.S.; Scherer, R.; Endringer, D.C.; Romão, W. Chemical profile of pineapple cv. Vitória in different maturation stages using electrospray ionization mass spectrometry. J. Sci. Food Agric. 2018, 98, 1105–1116. [Google Scholar] [CrossRef]
- Ma, C.; Xiao, S.-Y.; Li, Z.-G.; Wang, W.; Du, L.-J. Characterization of active phenolic components in the ethanolic extract of Ananas comosus L. leaves using high-performance liquid chromatography with diode array detection and tandem mass spectrometry. J. Chromatogr. A 2007, 1165, 39–44. [Google Scholar] [CrossRef] [PubMed]
- Yapo, E.; Kouakou, H.; Kouakou, L.; Kouadio, J.; Kouamé, P.; Mérillon, J. Phenolic profiles of pineapple fruits (Ananas comosus L. Merrill) influence of the origin of suckers. Aust. J. Basic Appl. Sci. 2011, 5, 1372–1378. [Google Scholar]
- Masike, K.; Mhlongo, M.I.; Mudau, S.P.; Nobela, O.; Ncube, E.N.; Tugizimana, F.; George, M.J.; Madala, N.E. Highlighting mass spectrometric fragmentation differences and similarities between hydroxycinnamoyl-quinic acids and hydroxycinnamoyl-isocitric acids. Chem. Cent. J. 2017, 11, 1–7. [Google Scholar] [CrossRef] [PubMed]
- Lourenço, S.C.; Fraqueza, M.J.; Fernandes, M.H.; Moldão-Martins, M.; Alves, V.D. Application of Edible Alginate Films with Pineapple Peel Active Compounds on Beef Meat Preservation. Antioxidants 2020, 9, 667. [Google Scholar] [CrossRef] [PubMed]


| Independent Variable | Response Variable | |||||
|---|---|---|---|---|---|---|
| Run | X1 | X2 | t (min) | S:S (ratio) | TPC | |
| mg GAE/g dry PP | mg GAE/L | |||||
| 1 | −1 | −1 | 11 | 1.6 | 1.7 | 134.8 |
| 2 | −1 | 1 | 11 | 4.4 | 4.4 | 122.4 |
| 3 | 1 | −1 | 39 | 1.6 | 2.8 | 219.2 |
| 4 | 1 | 1 | 39 | 4.4 | 4.6 | 128.8 |
| 5 (C) | 0 | 0 | 25 | 3.0 | 3.4 | 142.7 |
| 6 (C) | 0 | 0 | 25 | 3.0 | 3.4 | 145.6 |
| 7 | −α | 0 | 5 | 3.0 | 3.1 | 132.9 |
| 8 | α | 0 | 45 | 3.0 | 3.9 | 166.1 |
| 9 | 0 | −α | 25 | 1.0 | 2.1 | 257.9 |
| 10 | 0 | α | 25 | 5.0 | 4.4 | 101.9 |
| 11 (C) | 0 | 0 | 25 | 3.0 | 3.3 | 138.8 |
| 12 (C) | 0 | 0 | 25 | 3.0 | 3.4 | 146.3 |
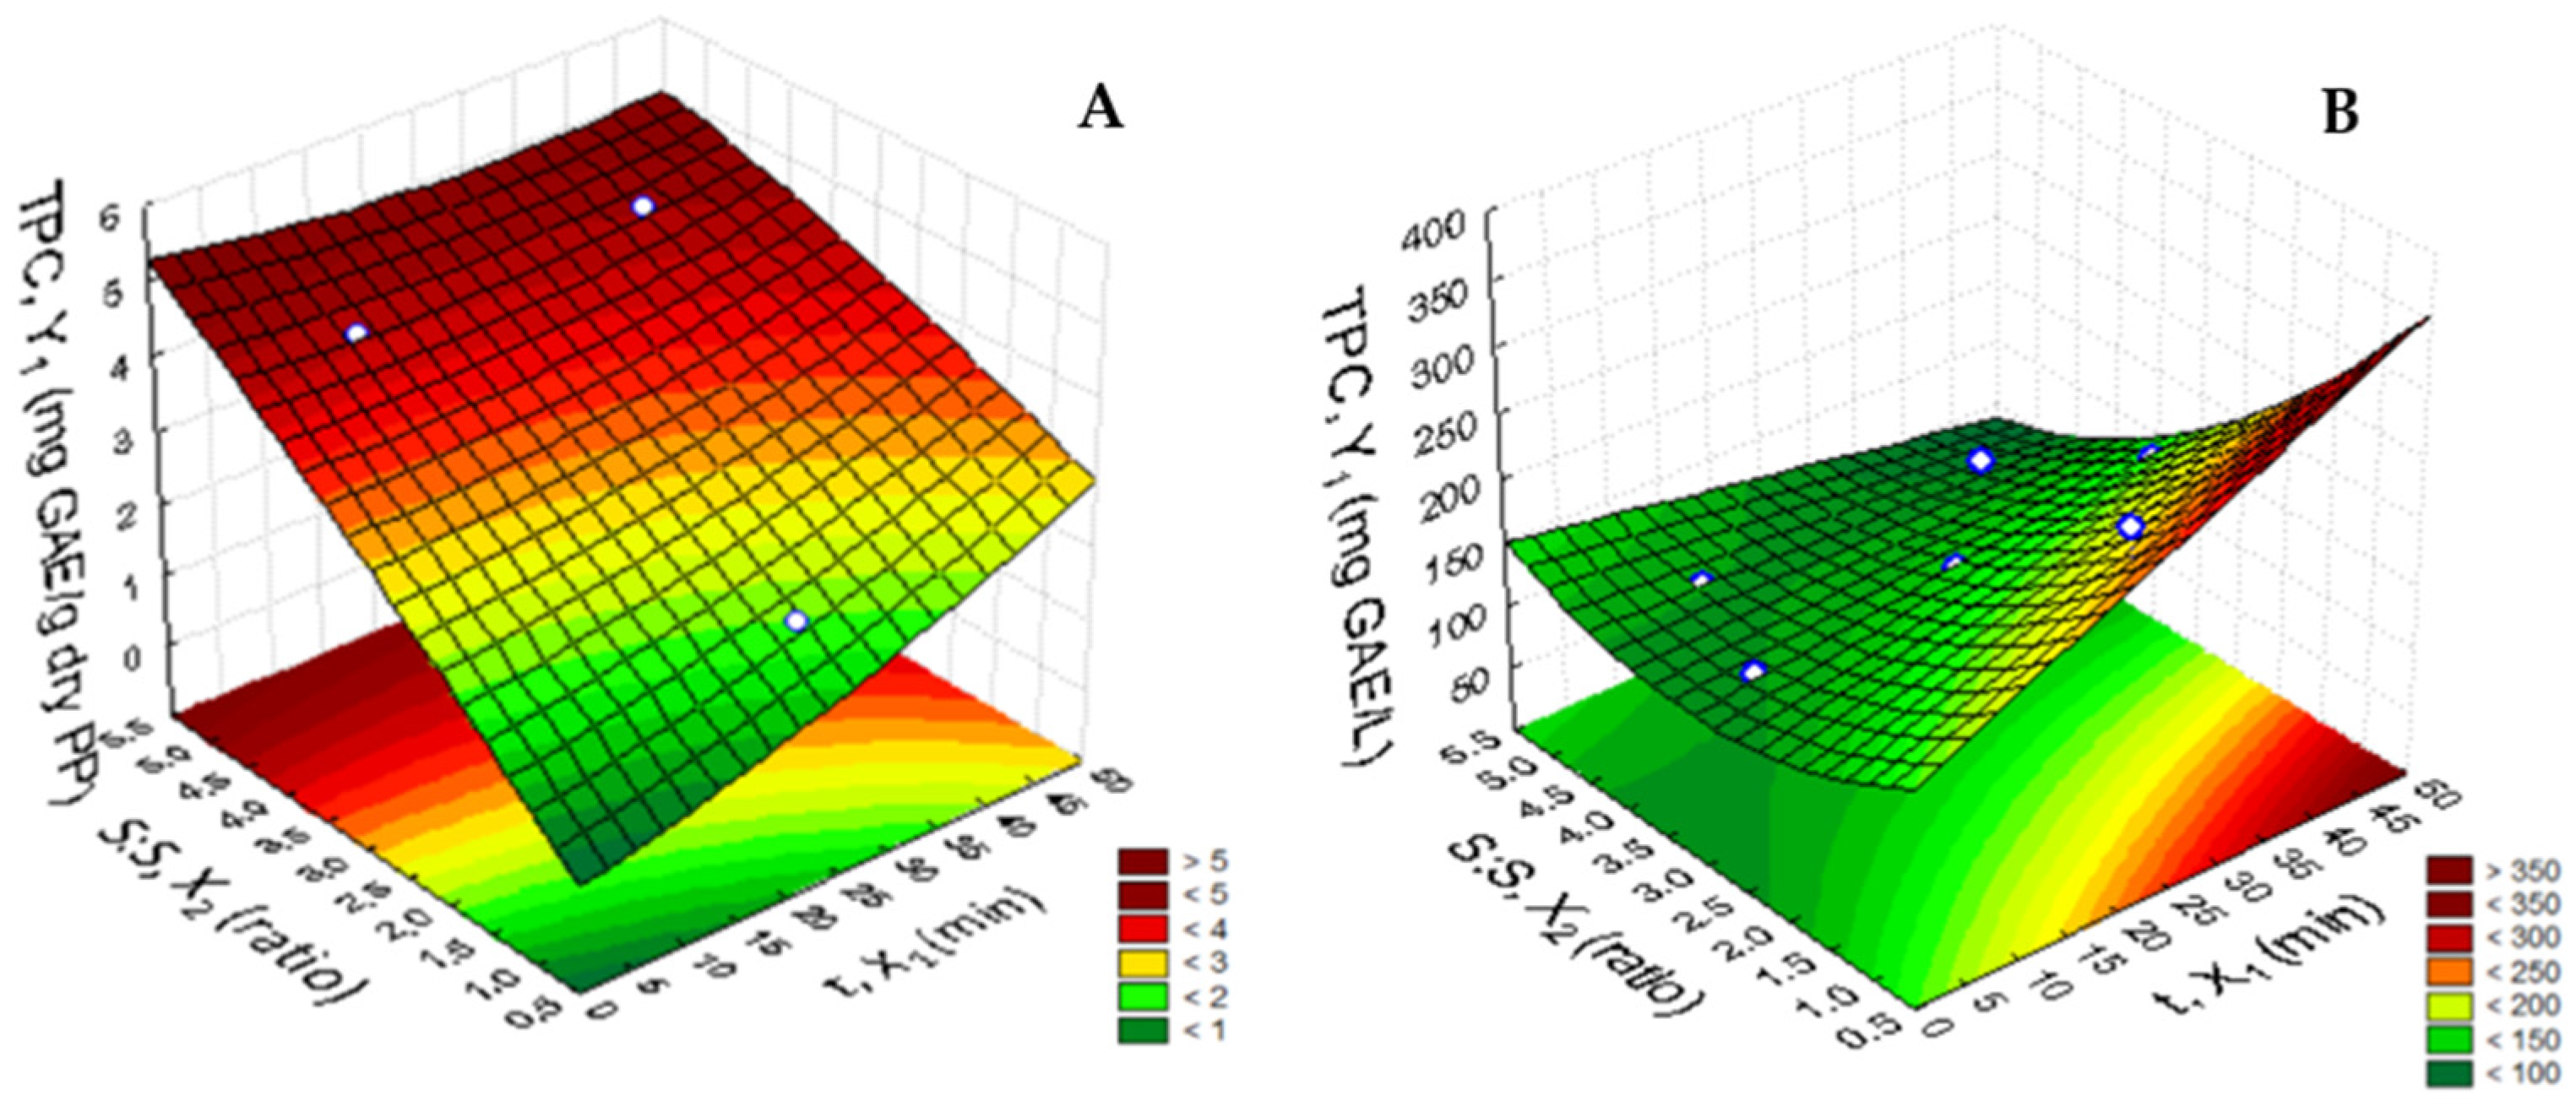
| Dependent Variable TPC | Equation | R2 | R2adj | Lack of Fit |
|---|---|---|---|---|
| mg GAE/g dry PP | 3.36 * + 0.60 t * + 0.15 t2 + 1.95 S:S * − 0.112 S:S2 − 0.42 tS:S | 0.97 | 0.95 | 0.034 |
| mg GAE/L | 143.18 * + 34.20 t * − 0.13 t2 − 80.57 S:S * + 29.64 S:S2 + 29.64 tS:S | 0.89 | 0.80 | 0.003 |
| Assay | Results 1 | ||
|---|---|---|---|
| W | E:W 80:20 | ||
| Moisture content (%) | 95.47 a | 93.72 b | |
| pH | 4.02 ± 0.02 a | 3.70 ± 0.04 b | |
| Color | L* | 89.86 ± 0.71 b | 92.01 ± 0.20 a |
| a* | 0.58 ± 0.08 a | −1.55 ± 0.15 b | |
| b* | −1.01 ± 0.34 b | 4.03 ± 0.17 a | |
| TSS | °Brix | 5.01 ± 0.05 b | 7.80 ± 1.40 a |
| wt% | 4.50 ± 0.02 b | 6.40 ± 0.04 a | |
| TPC | Direct (mg GAE/g dry extract) | 2.71 ± 0.059 b | 11.10 ± 0.01 a |
| Folin Ciocalteau (mg GAE/g dry extract) | 4.08 ± 0.46 b | 7.05 ± 0.01 a | |
| AOA | DPPH (µmol Trolox/g dry extract) | 7.28 ± 2.10 b | 91.79 ± 1.98 a |
| FRAP (µmol Trolox/g dry extract) | 51.19 ± 2.93 b | 174.50 ± 9.98 a | |
| FRAP (µmol Ferrous sulfate/g dry extract) | 82.97 ± 4.88 b | 285.86 ± 6.64 a | |
| TPC | ||
|---|---|---|
| Direct Method | Folin | |
| mg GAE/g dry extract | mg GAE/g dry extract | |
| W | 2.71 ± 0.06 b | 4.08 ± 0.46 a |
| E:W 80:20 | 11.14 ± 0.01 b | 7.05 ± 0.01 a |
| mg GAE /g freeze dried | ||
| FD-W | 7.18 ± 0.02 A | |
| mg GAE/g particles | ||
| SD-W/FD | 6.12 ± 0.01 B | |
| SD-E:W 80:20 | 2.74 ± 0.01 C | |
| W | E:W 80:20 | FD-W | SD-W/FD | SD-E:W 80:20 | ||
|---|---|---|---|---|---|---|
| DPPH | TEAC (µmol Trolox/mg GAE) | 2.66 ± 0.77 c | 8.23 ± 0.18 b | 1.59 ± 0.13 d | 2.61 ± 0.15 c | 10.49 ± 0.09 a |
| FRAP | TEAC (µmol Trolox/mg GAE) | 18.88 ± 1.08 a | 15.66 ± 0.90 b | 8.33 ± 0.39 c | 7.46 ± 0.09 c | 15.66 ± 0.27 b |
| µmol Sulfate ferrous/mg GAE | 30.62 ± 1.80 a | 25.65 ± 1.50 b | 13.66 ± 0.66 c | 12.17 ± 0.15 c | 25.52 ± 0.46 b | |
| Phenolic Compounds | Chemical Formula | Water Extract (W/FD) | E:W 80:20 Extract | Encapsulated W/FD Extract | Encapsulated E:W 80:20 Extract |
|---|---|---|---|---|---|
| mg/100 g DM | mg/100 g DM | mg/g Particles | mg/g Particles | ||
| Gallic acid | C7H6O5 | 27.54 | 61.13 | 34.73 | 18.85 |
| Chlorogenic acid | C16H18O9 | 16.60 | 58.04 | 18.85 | 20.80 |
| Caffeic acid | C9H8O4 | 22.41 | 19.60 | 14.98 | 11.13 |
| p-Coumaric acid | C9H8O3 | 18.71 | 13.00 | 24.95 | 21.77 |
| Ferulic acid | C10H10O4 | 80.23 | 259.16 | 89.90 | 113.92 |
| Total by HPLC | 165.49 | 410.93 | 183.41 | 186.47 | |
Publisher’s Note: MDPI stays neutral with regard to jurisdictional claims in published maps and institutional affiliations. |
© 2021 by the authors. Licensee MDPI, Basel, Switzerland. This article is an open access article distributed under the terms and conditions of the Creative Commons Attribution (CC BY) license (https://creativecommons.org/licenses/by/4.0/).
Share and Cite
Lourenço, S.C.; Campos, D.A.; Gómez-García, R.; Pintado, M.; Oliveira, M.C.; Santos, D.I.; Corrêa-Filho, L.C.; Moldão-Martins, M.; Alves, V.D. Optimization of Natural Antioxidants Extraction from Pineapple Peel and Their Stabilization by Spray Drying. Foods 2021, 10, 1255. https://doi.org/10.3390/foods10061255
Lourenço SC, Campos DA, Gómez-García R, Pintado M, Oliveira MC, Santos DI, Corrêa-Filho LC, Moldão-Martins M, Alves VD. Optimization of Natural Antioxidants Extraction from Pineapple Peel and Their Stabilization by Spray Drying. Foods. 2021; 10(6):1255. https://doi.org/10.3390/foods10061255
Chicago/Turabian StyleLourenço, Sofia C., Débora A. Campos, Ricardo Gómez-García, Manuela Pintado, M. Conceição Oliveira, Diana I. Santos, Luiz C. Corrêa-Filho, Margarida Moldão-Martins, and Vítor D. Alves. 2021. "Optimization of Natural Antioxidants Extraction from Pineapple Peel and Their Stabilization by Spray Drying" Foods 10, no. 6: 1255. https://doi.org/10.3390/foods10061255