
Effect of Light Intensity and Wavelength on Biomass Growth and Protein and Amino Acid Composition of Dunaliella salina


Abstract
:1. Introduction
2. Materials and Methods
2.1. Microalgal Strain and Cultivation Methods
2.2. Biomass Analyses and Calculations
2.3. Statistics
3. Results
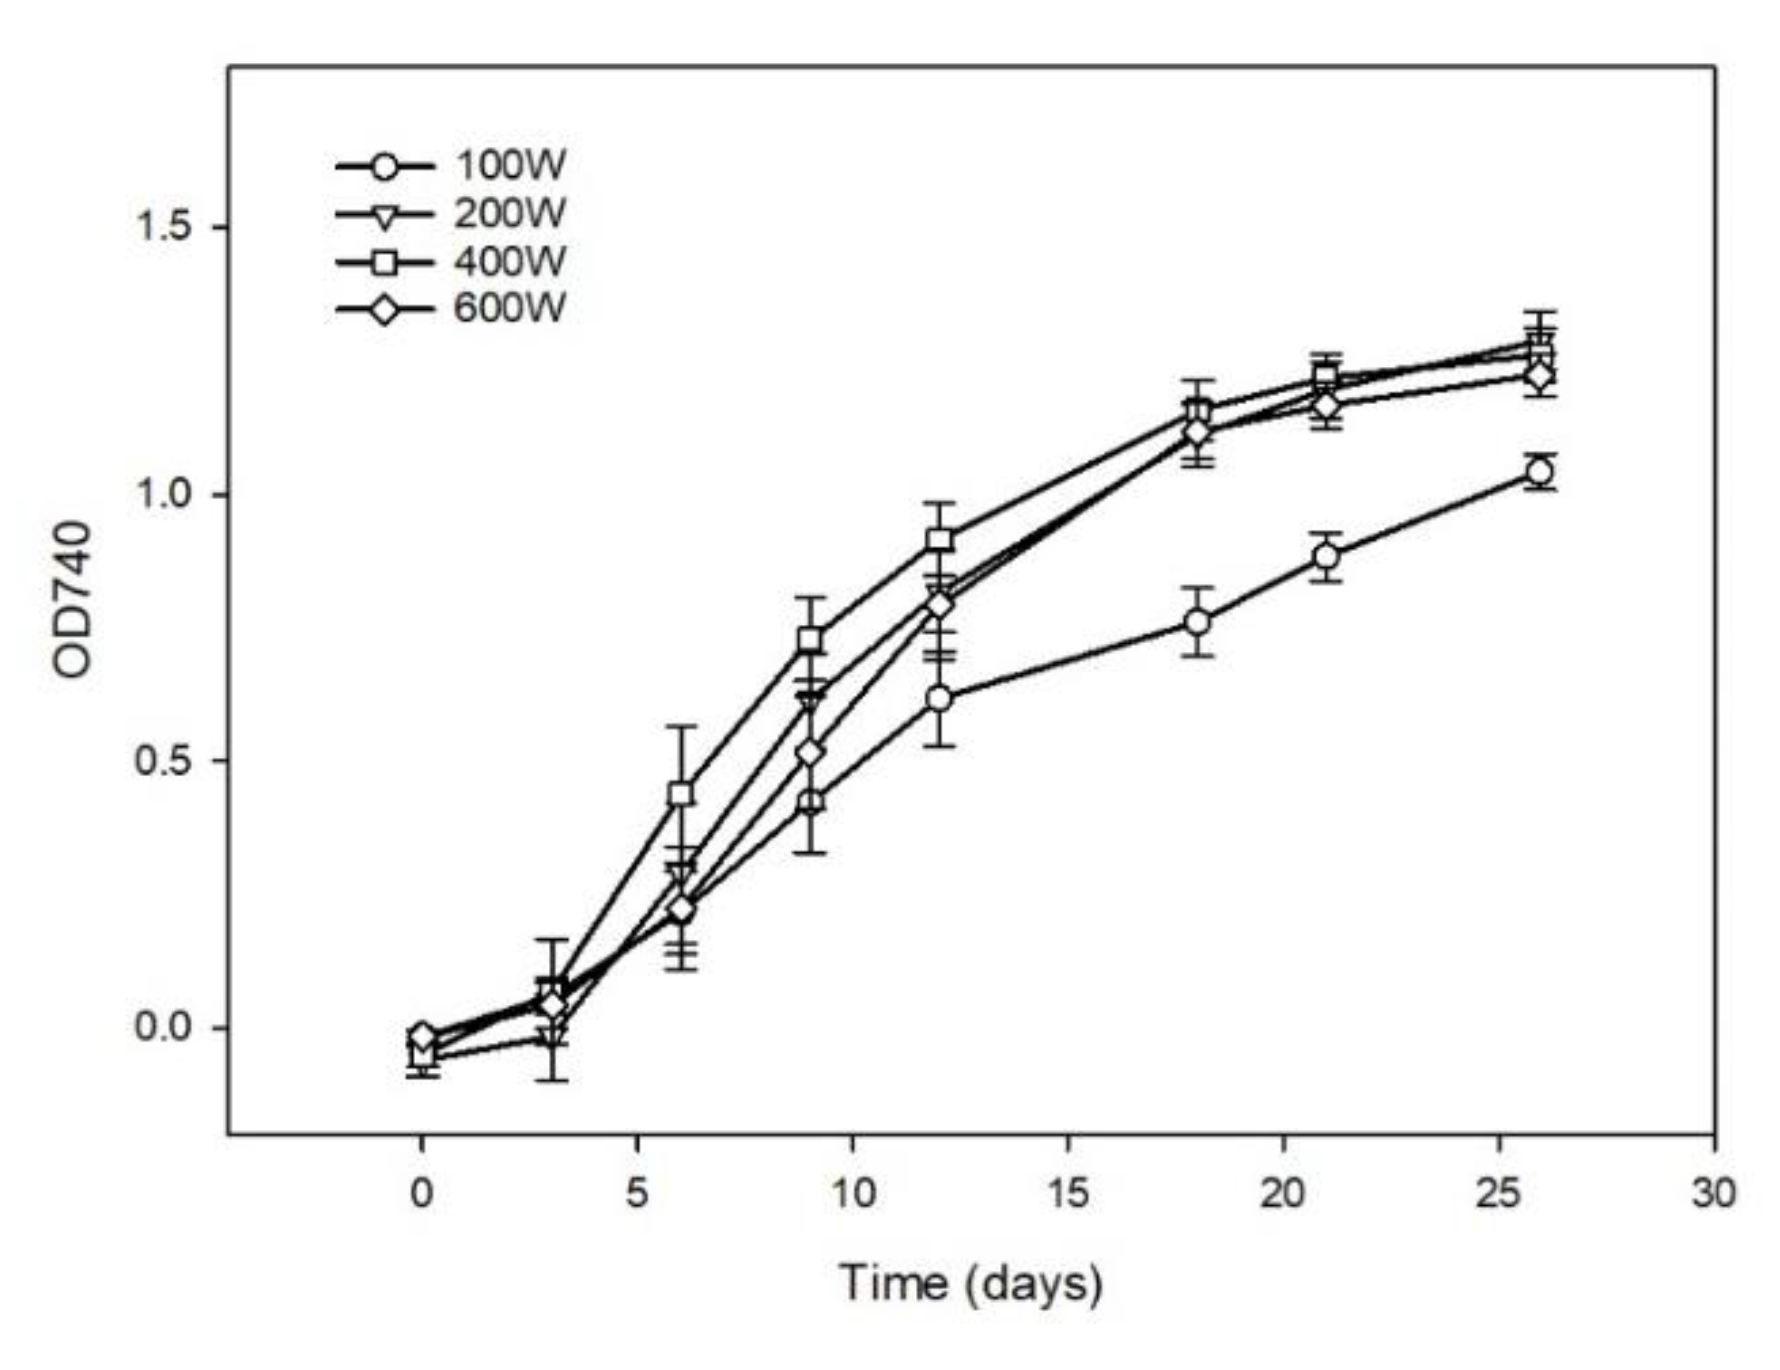
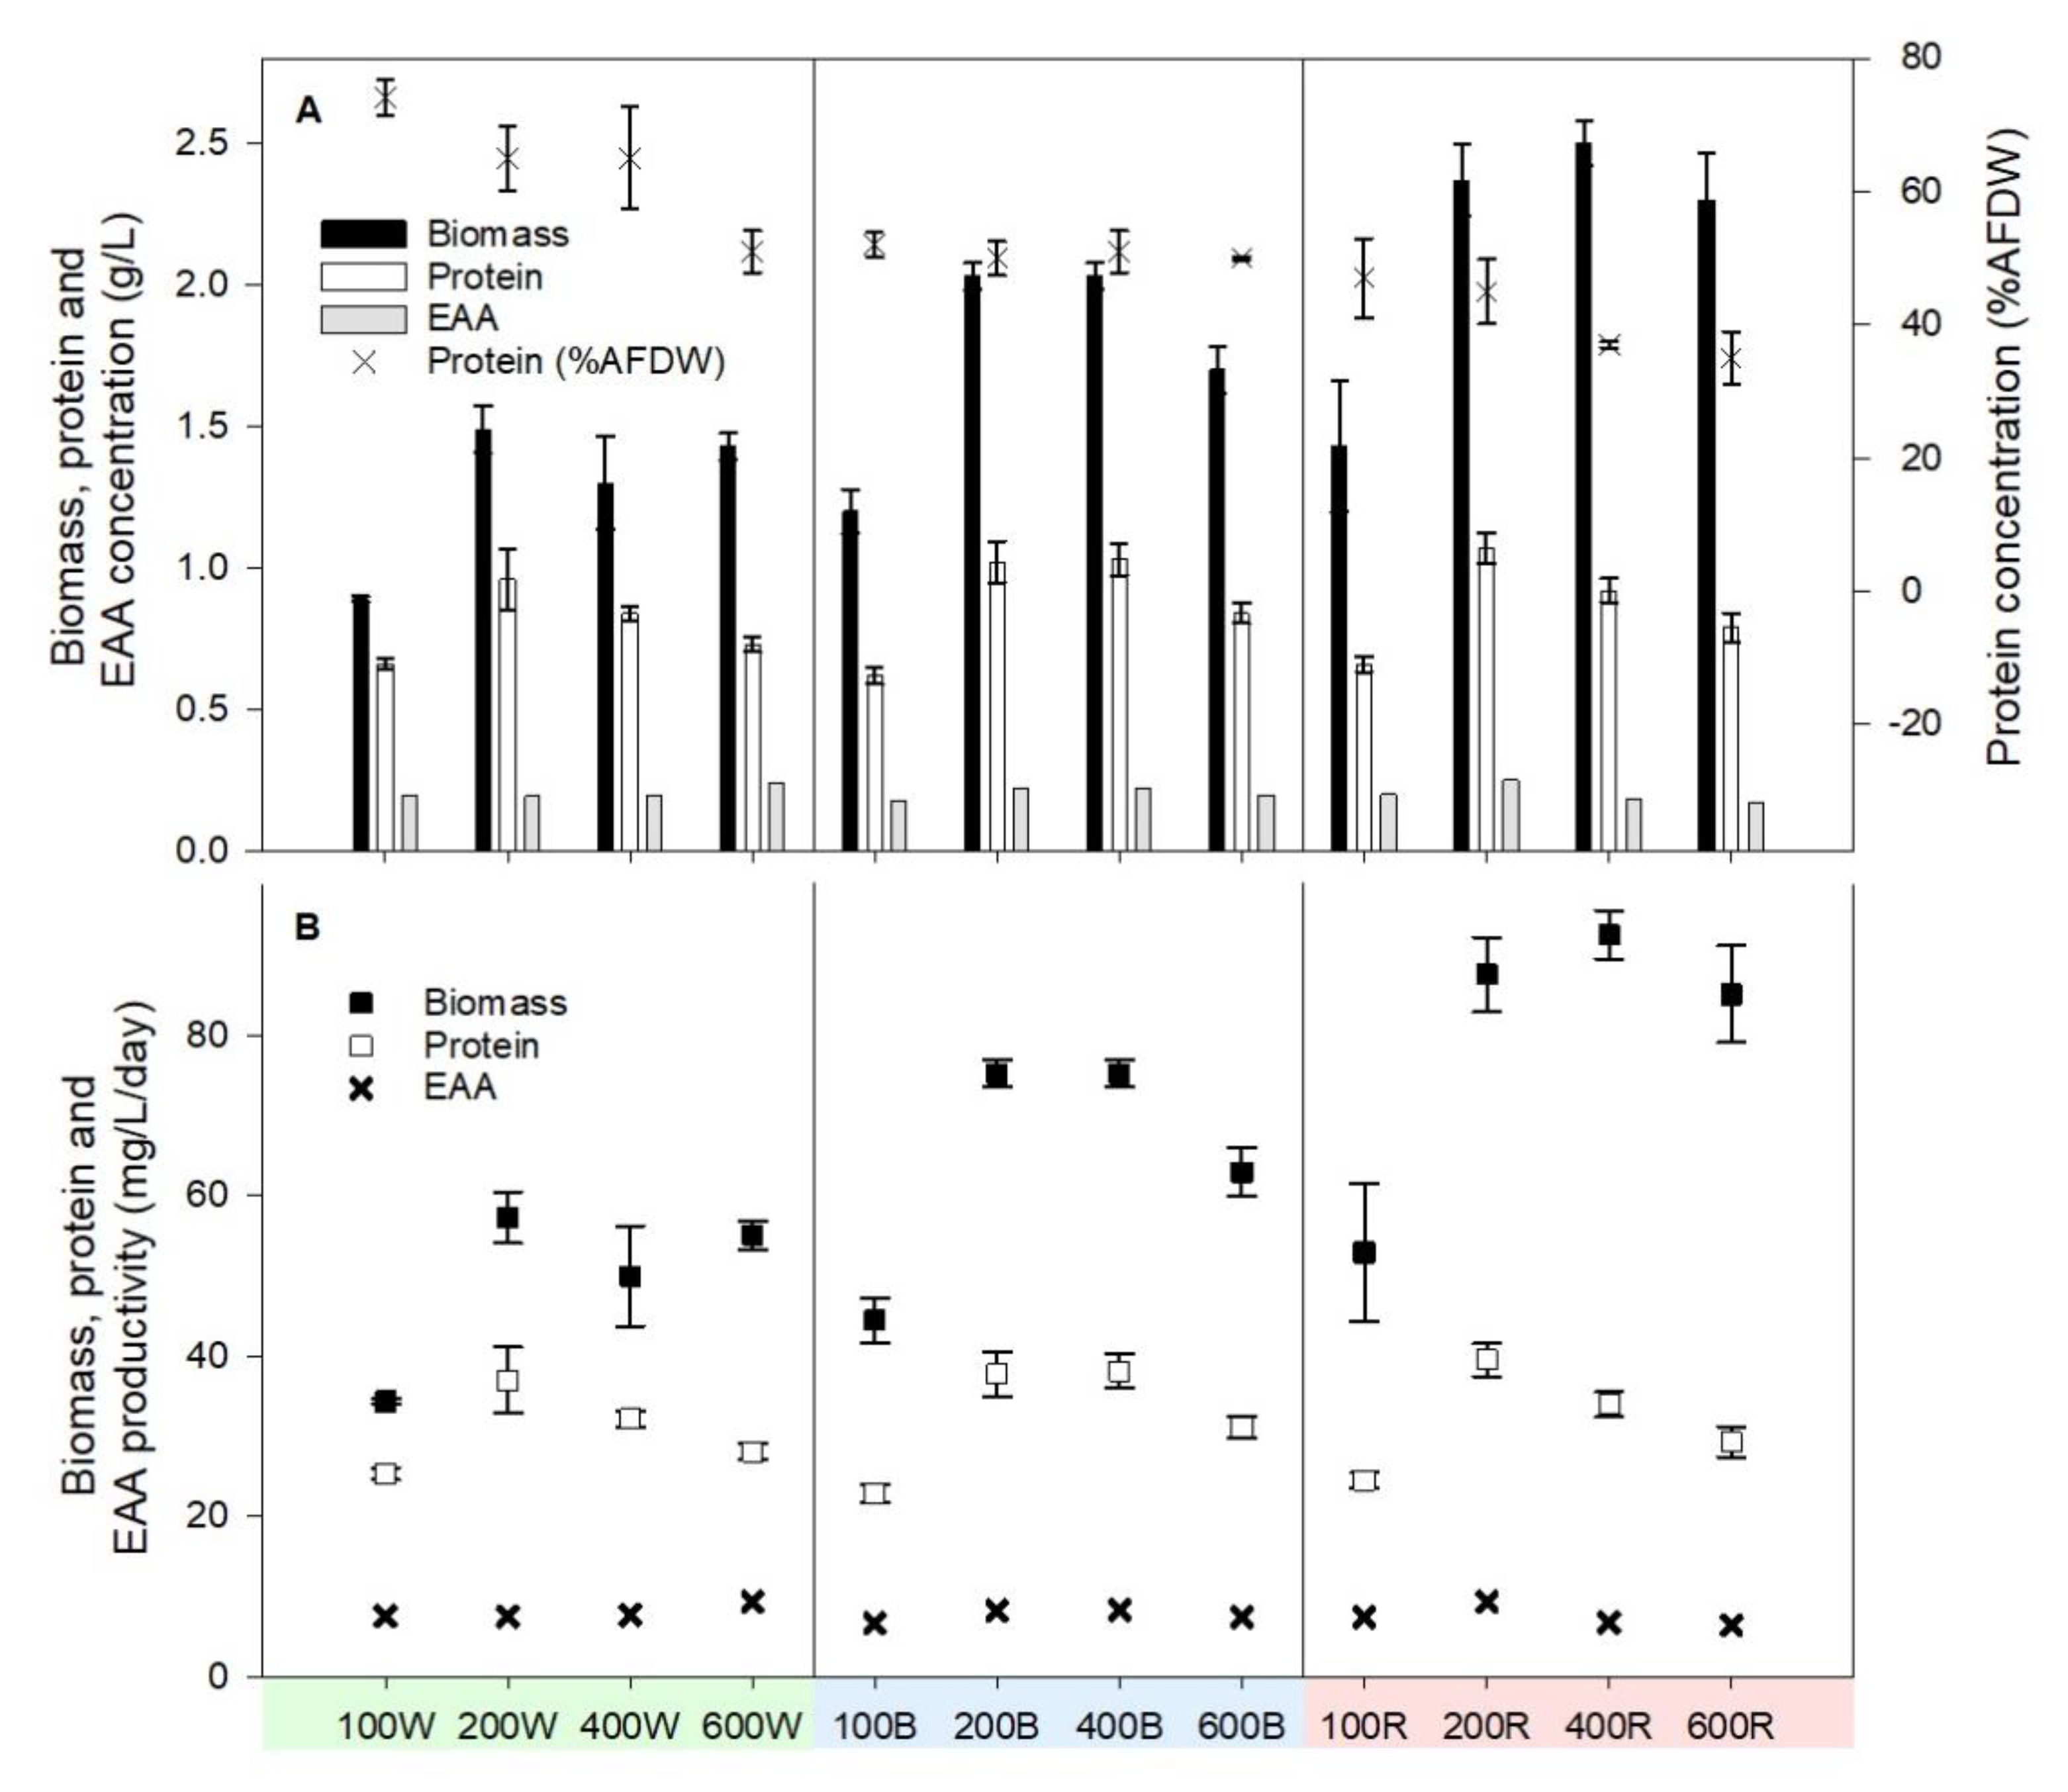
3.1. Biomass Growth
3.2. Protein Content and Protein Concentration Dynamics
3.3. Amino Acids
4. Discussion
4.1. Effect of Light Intensity and Wavelength
4.2. Amino Acid Dynamics
5. Conclusions
Author Contributions
Funding
Conflicts of Interest
References
- Vigani, M.; Parisi, C.; Rodríguez-Cerezo, E.; Barbosa, M.J.; Sijtsma, L.; Ploeg, M.; Enzing, C. Food and Feed Products from Micro-algae: Market Opportunities and Challenges for the EU. Trends Food Sci. Technol. 2015, 42, 81–92. [Google Scholar] [CrossRef]
- Becker, E.W. Micro-algae as a Source of Protein. Biotechnol. Adv. 2007, 25, 207–210. [Google Scholar] [CrossRef] [PubMed]
- Kent, M.; Welladsen, H.M.; Mangott, A.; Li, Y. Nutritional Evaluation of Australian Microalgae as Potential Human Health Supplements. PLoS ONE 2015, 10, e0118985. [Google Scholar] [CrossRef] [PubMed]
- Sidari, R.; Tofalo, R. A Comprehensive Overview on Microalgal-Fortified/Based Food and Beverages. Food Rev. Int. 2019, 35, 778–805. [Google Scholar] [CrossRef]
- Xu, Y.; Harvey, P.J. Phytoene and Phytofluene Overproduction by Dunaliella salina Using the Mitosis Inhibitor Chlorpropham. Algal Res. 2020, 52, 102126. [Google Scholar] [CrossRef]
- Harvey, P.J.; Ben-Amotz, A. Towards a Sustainable Dunaliella salina Microalgal Biorefinery for 9-cis β-carotene Production. Algal Res. 2020, 50, 102002. [Google Scholar] [CrossRef]
- Sher, I.; Tzameret, A.; Peri-Chen, S.; Edelshtain, V.; Ioffe, M.; Sayer, A.; Buzhansky, L.; Gazit, E.; Rotenstreich, Y. Synthetic 9-cis-beta-carotene Inhibits Photoreceptor Degeneration in Cultures of Eye Cups from rpe65rd12 Mouse Model of Retinoid Cycle Defect. Sci. Rep. 2018, 8, 1–9. [Google Scholar] [CrossRef] [Green Version]
- Sui, Y.; Vlaeminck, S.E. Dunaliella Microalgae for Nutritional Protein: An Undervalued Asset. Trends Biotechnol. 2020, 38, 10–12. [Google Scholar] [CrossRef]
- Sui, Y.; Vlaeminck, S.E. Effects of Salinity, pH and Growth Phase on the Protein Productivity by Dunaliella salina. J. Chem. Technol. Biotechnol. 2019, 94, 1032–1040. [Google Scholar] [CrossRef]
- Sui, Y.; Muys, M.; Vermeir, P.; D’Adamo, S.; Vlaeminck, S.E. Light Regime and Growth Phase Affect the Microalgal Production of Protein Quantity and Quality with Dunaliella salina. Bioresour. Technol. 2019, 275, 145–152. [Google Scholar] [CrossRef]
- Sui, Y.; Muys, M.; Van de Waal, D.B.; D’Adamo, S.; Vermeir, P.; Fernandes, T.V.; Vlaeminck, S.E. Enhancement of Co-production of Nutritional Protein and Carotenoids in Dunaliella salina Using a Two-phase Cultivation Assisted by Nitrogen Level and Light Intensity. Bioresour. Technol. 2019, 287, 121398. [Google Scholar] [CrossRef] [PubMed]
- Lv, H.; Qiao, C.; Zhong, C.; Jia, S. Metabolic Fingerprinting of Dunaliella salina Cultured under Sulfur Deprivation Conditions. J. Appl. Phycol. 2018, 30, 355–365. [Google Scholar] [CrossRef]
- Lv, H.; Cui, X.; Tan, Z.; Jia, S. Analysis of Metabolic Responses of Dunaliella salina to Phosphorus Deprivation. J. Appl. Phycol. 2017, 29, 1251–1260. [Google Scholar] [CrossRef]
- Severes, A.; Hegde, S.; D’Souza, L.; Hegde, S. Use of Light Emitting Diodes (LEDs) for Enhanced Lipid Production in Micro-algae Based Biofuels. J. Photochem. Photobiol. B Biol. 2017, 170, 235–240. [Google Scholar] [CrossRef]
- Da Fontoura Prates, D.; Duarte, J.H.; Vendruscolo, R.G.; Wagner, R.; Ballus, C.A.; da Silva Oliveira, W.; Godoy, H.T.; Barcia, M.T.; de Morais, M.G.; Radmann, E.M.; et al. Role of Light Emitting Diode (LED) Wavelengths on Increase of Protein Productivity and Free Amino Acid Profile of Spirulina sp. Cultures. Bioresour. Technol. 2020, 306, 123184. [Google Scholar] [CrossRef] [PubMed]
- Fu, W.; Guomundsson, Ó.; Paglia, G.; Herjólfsson, G.; Andrésson, Ó.S.; Palsson, B.O.; Brynjólfsson, S. Enhancement of Carotenoid Biosynthesis in the Green Microalga Dunaliella salina with Light-emitting Diodes and Adaptive Laboratory Evolution. Appl. Microbiol. Biotechnol. 2013, 97, 2395–2403. [Google Scholar] [CrossRef] [PubMed] [Green Version]
- Han, S.I.; Kim, S.; Lee, C.; Choi, Y.E. Blue-Red LED Wavelength Shifting Strategy for Enhancing Beta-carotene Production from Halotolerant Microalga, Dunaliella salina. J. Microbiol. 2019, 57, 101–106. [Google Scholar] [CrossRef] [PubMed]
- Li, Y.; Li, L.; Liu, J.; Qin, R. Light Absorption and Growth Response of Dunaliella under Different Light Qualities. J. Appl. Phycol. 2020, 32, 1041–1052. [Google Scholar] [CrossRef]
- Xu, Y.; Harvey, P.J. Red Light Control of β-Carotene Isomerisation to 9-cis β-Carotene and Carotenoid Accumulation in Dunaliella salina. Antioxidants 2019, 8, 148. [Google Scholar] [CrossRef] [Green Version]
- Xu, Y.; Harvey, P.J. Carotenoid Production by Dunaliella salina under Red Light. Antioxidants 2019, 8, 123. [Google Scholar] [CrossRef] [Green Version]
- Borowitzka, M.A. Algal Growth Media and Sources of Cultures. In Micro-Algal Biotechnology; Cambridge University Press: Cambridge, UK, 1988; pp. 456–465. ISBN 0-521-32349-5. [Google Scholar]
- Phenomenex Phenomenex EZ: Faast Amino Acid Analysis. U.S. Patent 90501–1430, 2003. Available online: https://phenomenex.blob.core.windows.net/documents/9562ede9-23a7-4852-9ead-8fdd1d221de7.pdf (accessed on 7 May 2021).
- Xu, Y.; Ibrahim, I.M.; Harvey, P.J. The Influence of Photoperiod and Light Intensity on the Growth and Photosynthesis of Dunaliella salina (Chlorophyta) CCAP 19/30. Plant Physiol. Biochem. 2016, 106, 305–315. [Google Scholar] [CrossRef] [Green Version]
- Metsoviti, M.N.; Papapolymerou, G.; Karapanagiotidis, I.T.; Katsoulas, N. Effect of Light Intensity and Quality on Growth Rate and Composition of Chlorella vulgaris. Plants 2020, 9, 31. [Google Scholar] [CrossRef] [Green Version]
- He, Q.; Yang, H.; Wu, L.; Hu, C. Effect of Light Intensity on Physiological Changes, Carbon Allocation and Neutral Lipid Accumulation in Oleaginous Microalgae. Bioresour. Technol. 2015, 191, 219–228. [Google Scholar] [CrossRef]
- Nzayisenga, J.C.; Farge, X.; Groll, S.L.; Sellstedt, A. Effects of Light Intensity on Growth and Lipid Production in Microalgae Grown in Wastewater. Biotechnol. Biofuels 2020, 13, 4. [Google Scholar] [CrossRef]
- Cuhel, R.L.; Ortner, P.B.; Lean, D.R.S. Night Synthesis of Protein by Algae. Limnol. Oceanogr. 1984, 29, 731–744. [Google Scholar] [CrossRef]
- Xi, T.; Kim, D.G.; Roh, S.W.; Choi, J.S.; Choi, Y.E. Enhancement of Astaxanthin Production Using Haematococcus pluvialis with Novel LED Wavelength Shift Strategy. Appl. Microbiol. Biotechnol. 2016, 100, 6231–6238. [Google Scholar] [CrossRef] [PubMed]
- Jahns, P.; Holzwarth, A.R. The Role of the Xanthophyll Cycle and of Lutein in Photoprotection of Photosystem II. Biochim. Biophys. Acta Bioenerg. 2012, 1817, 182–193. [Google Scholar] [CrossRef] [PubMed] [Green Version]
- Guenther, J.E.; Nemson, J.A.; Melis, A. Photosystem Stoichiometry and Chlorophyll Antenna Size in Dunaliella salina (Green Algae). BBA Bioenerg. 1988, 934, 108–117. [Google Scholar] [CrossRef]
- Hempel, N.; Petrick, I.; Behrendt, F. Biomass Productivity and Productivity of Fatty Acids and Amino Acids of Microalgae Strains as Key Characteristics of Suitability for Biodiesel Production. J. Appl. Phycol. 2012, 24, 1407–1418. [Google Scholar] [CrossRef] [Green Version]
- Alipanah, L.; Rohloff, J.; Winge, P.; Bones, A.M.; Brembu, T. Whole-cell Response to Nitrogen Deprivation in the Diatom Phaeodactylum tricornutum. J. Exp. Bot. 2015, 66, 6281–6296. [Google Scholar] [CrossRef] [PubMed] [Green Version]
- Kiyota, H.; Hirai, M.; Ikeuchi, M. NblA1/A2-Dependent Homeostasis of Amino Acid Pools during Nitrogen Starvation in Synechocystis sp. PCC 6803. Metabolites 2014, 4, 517–531. [Google Scholar] [CrossRef] [PubMed]
- Van de Waal, D.B.; Ferreruela, G.; Van Donk, E.; Huisman, J.; Visser, P.M.; Tonk, L.; Matthijs, H.C.P. Pulsed Nitrogen Supply Induces Dynamic Changes in the Amino Acid Composition and Microcystin Production of the Harmful Cyanobacterium Planktothrix agardhii. FEMS Microbiol. Ecol. 2010, 74, 430–438. [Google Scholar] [CrossRef] [PubMed] [Green Version]
- Zhang, Y.; Liu, Y.; Cao, X.; Gao, P.; Liu, X.; Wang, X.; Zhang, J.; Zhou, J.; Xue, S.; Xu, G.; et al. Free Amino Acids and Small Molecular Acids Profiling of Marine Microalga Isochrysis zhangjiangensis under Nitrogen Deficiency. Algal Res. 2016, 13, 207–217. [Google Scholar] [CrossRef]
- Giordano, M.; Pezzoni, V.; Hell, R. Strategies for the Allocation of Resources under Sulfur Limitation in the Green Alga Dunaliella salina. Plant Physiol. 2000, 124, 857–864. [Google Scholar] [CrossRef] [Green Version]
- Jungandreas, A.; Costa, B.S.; Jakob, T.; Von Bergen, M.; Baumann, S.; Wilhelm, C. The Acclimation of Phaeodactylum tricornutum to Blue and Red Light Does Not Influence the Photosynthetic Light Reaction but Strongly Disturbs the Carbon Allocation Pattern. PLoS ONE 2014, 9, e99727. [Google Scholar] [CrossRef] [PubMed] [Green Version]
- Patelou, M.; Infante, C.; Dardelle, F.; Randewig, D.; Kouri, E.D.; Udvardi, M.K.; Tsiplakou, E.; Mantecón, L.; Flemetakis, E. Transcriptomic and Metabolomic Adaptation of Nannochloropsis gaditana Grown under Different Light Regimes. Algal Res. 2020, 45, 101735. [Google Scholar] [CrossRef]


| Stage 1 White (W) Light | Stage 2 Blue (B) and Red (R) Light | |||||||
|---|---|---|---|---|---|---|---|---|
| Treatments | 100W | 200W | 400W | 600W | 100B | 200B | 400B | 600B |
| 100R | 200R | 400R | 600R | |||||
| Light intensity (µmol photos m−2 s−1) | 100 | 200 | 400 | 600 | 100 | 200 | 400 | 600 |
| 100B | 200B | 400B | 600B | 100R | 200R | 400R | 600R | |
|---|---|---|---|---|---|---|---|---|
| AFDW concentration | 1.34 ± 0.07 | 1.37 ± 0.05 | 1.59 ± 0.20 | 1.19 ± 0.07 | 1.60 ± 0.25 | 1.59 ± 0.08 | 1.95 ± 0.23 | 1.61 ± 0.16 |
| Avg *,a | 1.37 ± 0.18 | 1.69 ± 0.25 | ||||||
| Protein concentration | 0.94 ± 0.05 | 1.07 ± 0.09 | 1.23 ± 0.05 | 1.16 ± 0.03 | 1.00 ± 0.06 | 1.12 ± 0.12 | 1.10 ± 0.02 | 1.08 ± 0.08 |
| Avg * | 1.10 ± 0.12 | 1.08 ± 0.09 | ||||||
| %AFDW Protein | 0.70 ± 0.00 | 0.78 ± 0.07 | 0.79 ± 0.13 | 0.98 ± 0.06 | 0.64 ± 0.07 | 0.70 ± 0.06 | 0.57 ± 0.07 | 0.69 ± 0.12 |
| Avg *,b | 0.81 ± 0.13 | 0.65 ± 0.10 | ||||||
| EAA concentration | 0.91 | 1.14 | 1.12 | 0.81 | 1.13 | 1.14 | 0.82 | 0.87 |
| Avg * | 1.00 ± 0.14 | 0.99 ± 0.21 | ||||||
| Biomass productivity | 1.29 ± 0.07 | 1.32 ± 0.05 | 1.53 ± 0.19 | 1.14 ± 0.07 | 1.54 ± 0.24 | 1.53 ± 0.08 | 1.88 ± 0.22 | 1.55 ± 0.15 |
| Avg *,c | 1.32 ± 0.18 | 1.62 ± 0.24 | ||||||
| Protein productivity | 0.90 ± 0.05 | 1.03 ± 0.09 | 1.19 ± 0.05 | 1.11 ± 0.03 | 0.97 ± 0.06 | 1.08 ± 0.12 | 1.06 ± 0.02 | 1.04 ± 0.07 |
| Avg * | 1.06 ± 0.12 | 1.04 ± 0.09 | ||||||
| EAA productivity | 0.88 | 1.10 | 1.08 | 0.78 | 0.99 | 1.25 | 0.89 | 0.69 |
| Avg * | 0.96 ± 0.13 | 0.95 ± 0.20 | ||||||
| mg/g Protein | Histidine | Isoleucine | Leucine | Lysine | Methionine + Cysteine | Phenylalanine + Tyrosine | Threonine | Valine | Total EAA |
|---|---|---|---|---|---|---|---|---|---|
| 100W | 8.3 | 19.7 | 37.9 | 9.7 | 58.6 | 101.4 | 27.9 | 37.9 | 309.3 |
| 200W | 6.7 | 13.7 | 28.8 | 9.2 | 37.1 | 68.8 | 15.3 | 22.1 | 206.6 |
| 400W | 7.1 | 17.2 | 32.3 | 10.4 | 48.5 | 78.1 | 18.7 | 28.7 | 247.2 |
| 600W | 11.1 | 19.5 | 34.8 | 14.1 | 73.7 | 118.4 | 26.9 | 32.0 | 340.1 |
| 100B | 7.8 | 15.7 | 31.0 | 13.7 | 62.3 | 87.8 | 17.6 | 28.1 | 271.1 |
| 200B | 7.0 | 16.0 | 30.8 | 10.6 | 41.6 | 80.6 | 19.9 | 24.5 | 236.3 |
| 400B | 6.7 | 15.4 | 27.2 | 9.0 | 36.0 | 75.9 | 18.6 | 24.5 | 218.4 |
| 600B | 6.8 | 18.3 | 31.0 | 9.2 | 46.6 | 77.6 | 23.0 | 28.8 | 247.3 |
| 100R | 8.1 | 20.6 | 40.6 | 12.2 | 48.3 | 100.3 | 26.9 | 32.3 | 295.3 |
| 200R | 6.9 | 12.0 | 23.9 | 6.6 | 47.3 | 74.7 | 18.1 | 24.1 | 219.4 |
| 400R | 6.5 | 15.0 | 25.2 | 9.7 | 39.1 | 71.2 | 16.3 | 23.0 | 211.3 |
| 600R | 8.0 | 16.0 | 28.1 | 10.8 | 53.9 | 65.8 | 21.8 | 27.6 | 239.5 |
| FAO/WHO | 15 | 30 | 59 | 45 | 22 | 38 | 23 | 39 | 271 |
Publisher’s Note: MDPI stays neutral with regard to jurisdictional claims in published maps and institutional affiliations. |
© 2021 by the authors. Licensee MDPI, Basel, Switzerland. This article is an open access article distributed under the terms and conditions of the Creative Commons Attribution (CC BY) license (https://creativecommons.org/licenses/by/4.0/).
Share and Cite
Sui, Y.; Harvey, P.J. Effect of Light Intensity and Wavelength on Biomass Growth and Protein and Amino Acid Composition of Dunaliella salina. Foods 2021, 10, 1018. https://doi.org/10.3390/foods10051018
Sui Y, Harvey PJ. Effect of Light Intensity and Wavelength on Biomass Growth and Protein and Amino Acid Composition of Dunaliella salina. Foods. 2021; 10(5):1018. https://doi.org/10.3390/foods10051018
Chicago/Turabian StyleSui, Yixing, and Patricia J. Harvey. 2021. "Effect of Light Intensity and Wavelength on Biomass Growth and Protein and Amino Acid Composition of Dunaliella salina" Foods 10, no. 5: 1018. https://doi.org/10.3390/foods10051018