
Generating New Snack Food Texture Ideas Using Sensory and Consumer Research Tools: A Case Study of the Japanese and South Korean Snack Food Markets


Abstract
:
1. Introduction
2. Materials and Methods
2.1. Materials
2.2. Snacks Data Bank
2.3. Projective Mapping
2.4. Snacks Sensory Description
2.5. Descriptive Profiling
2.6. Sample Preparation
2.7. Panelists
2.8. Data Analysis
3. Results
3.1. Projective Mapping
3.1.1. Japanese Snacks
3.1.2. South Korean Snacks
3.2. Descriptive Profiling
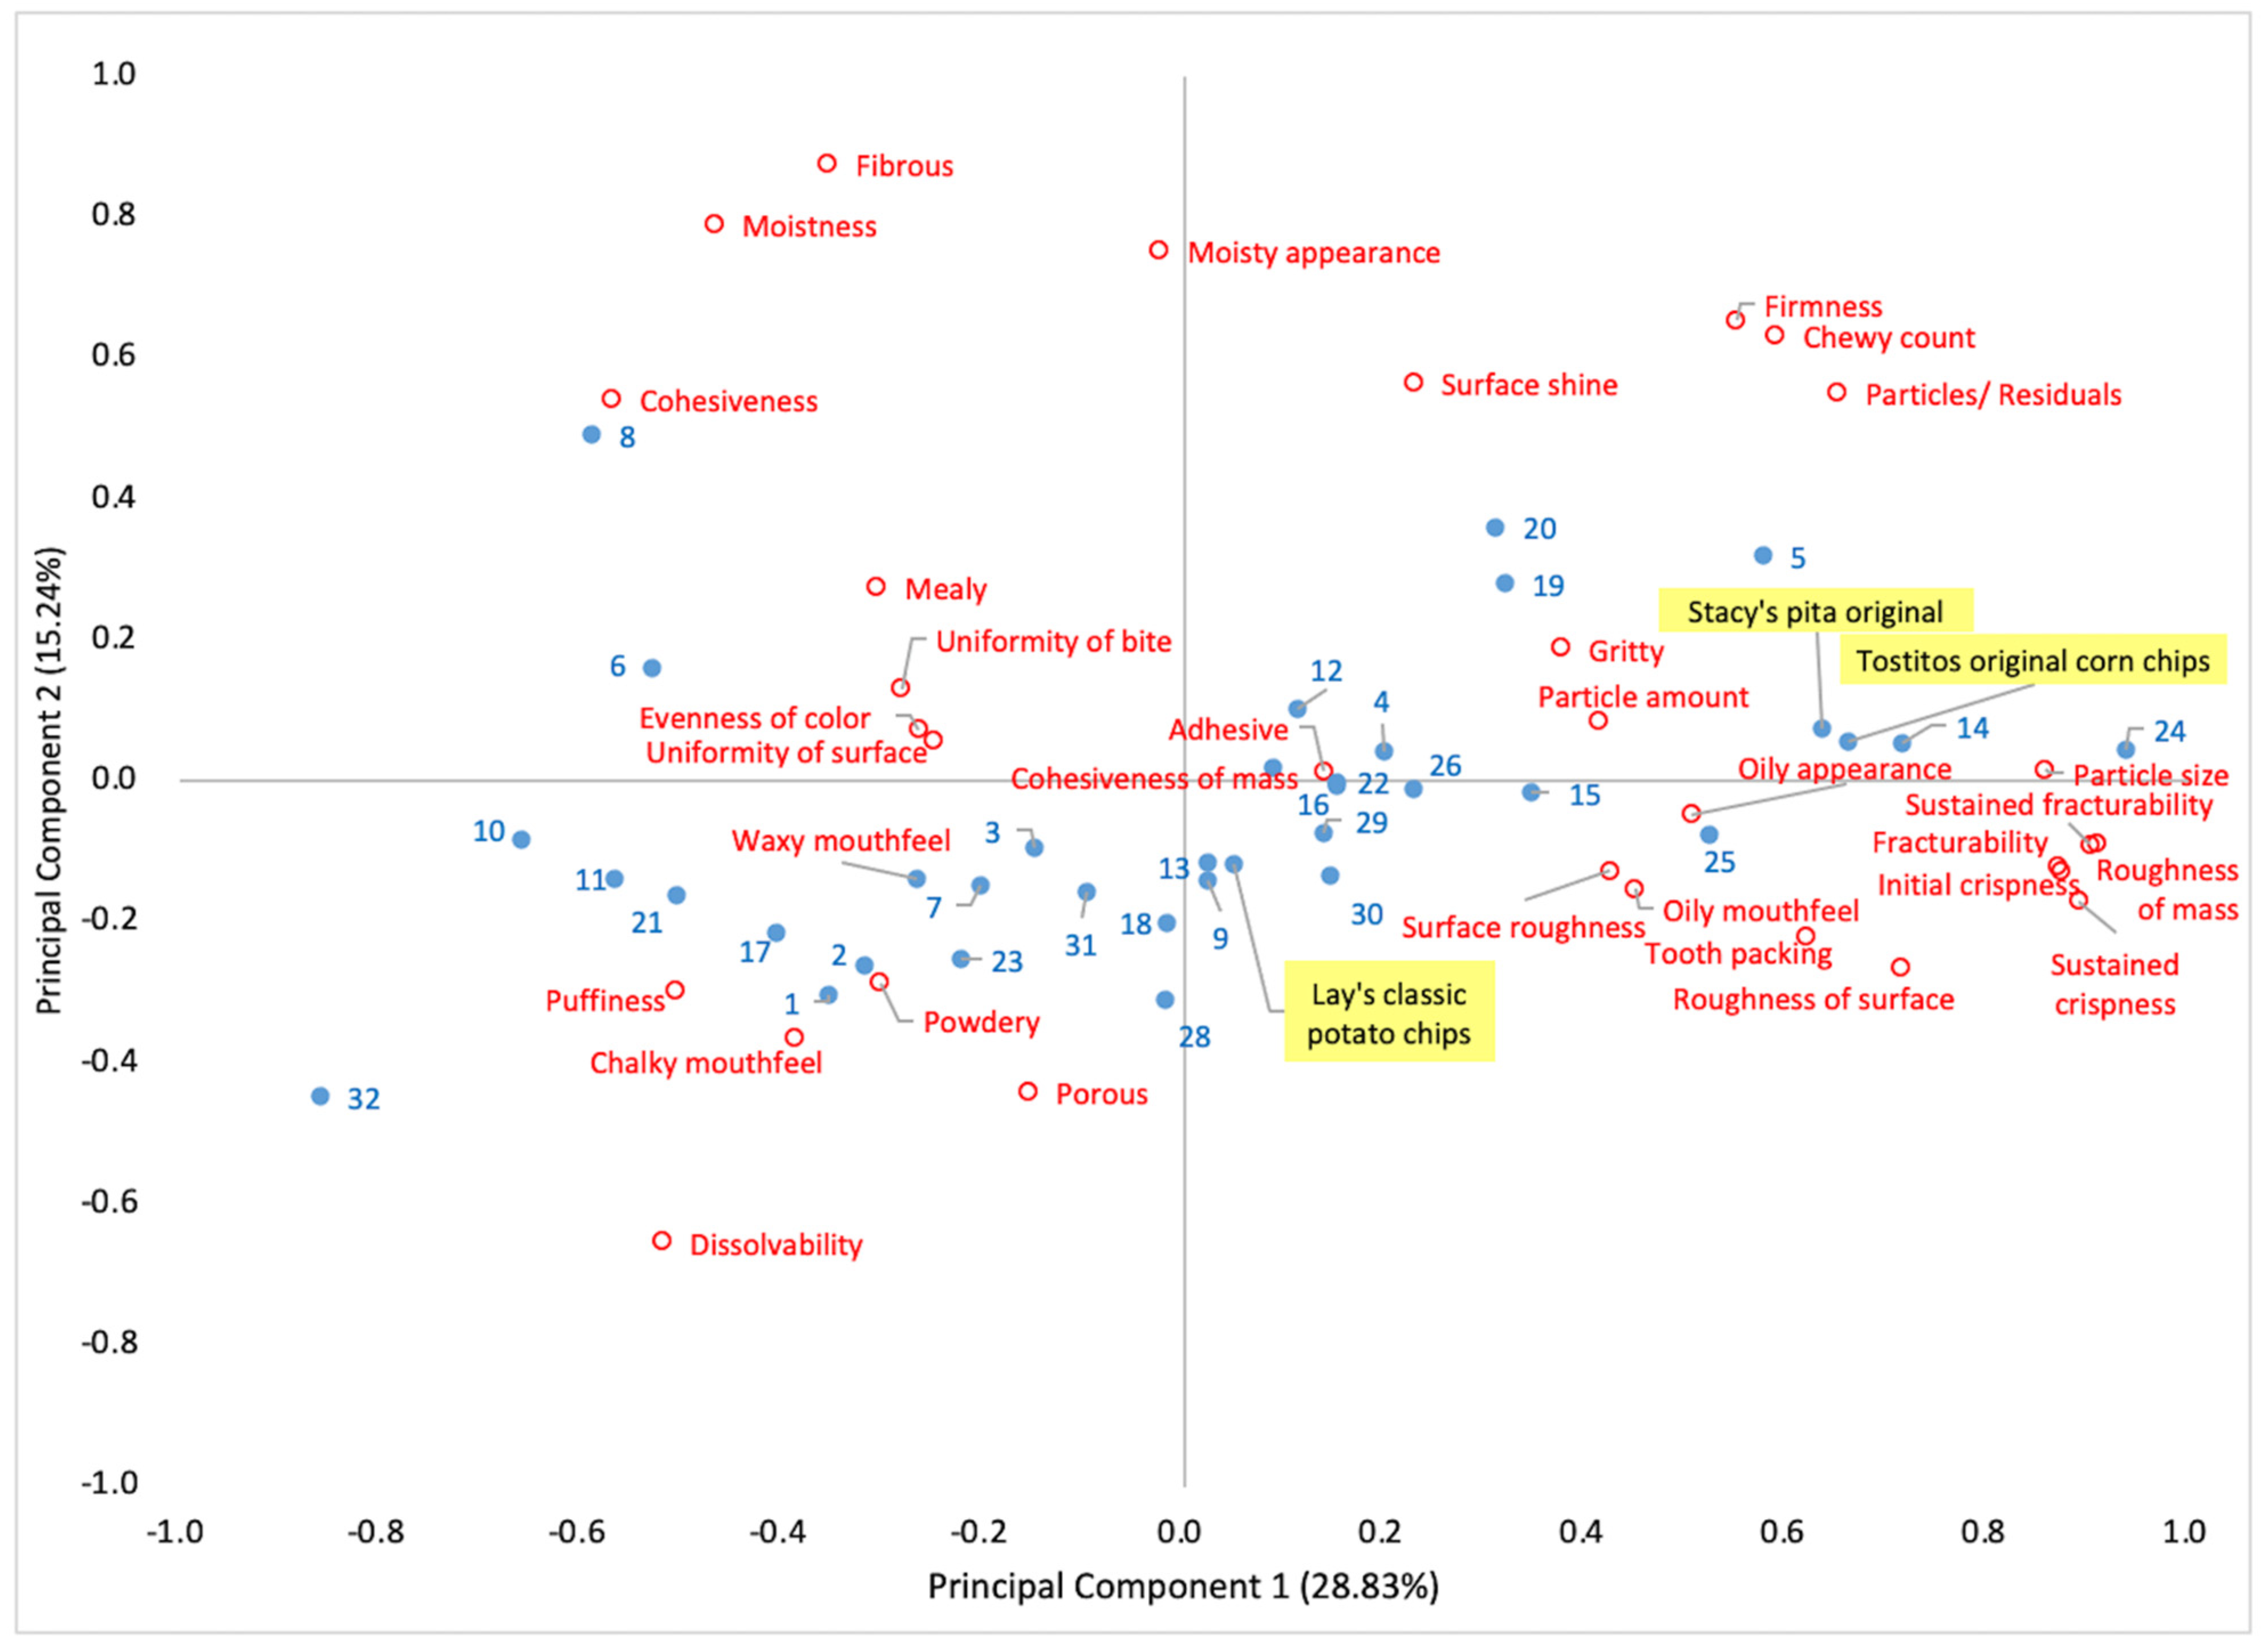
3.2.1. Japanese Snacks
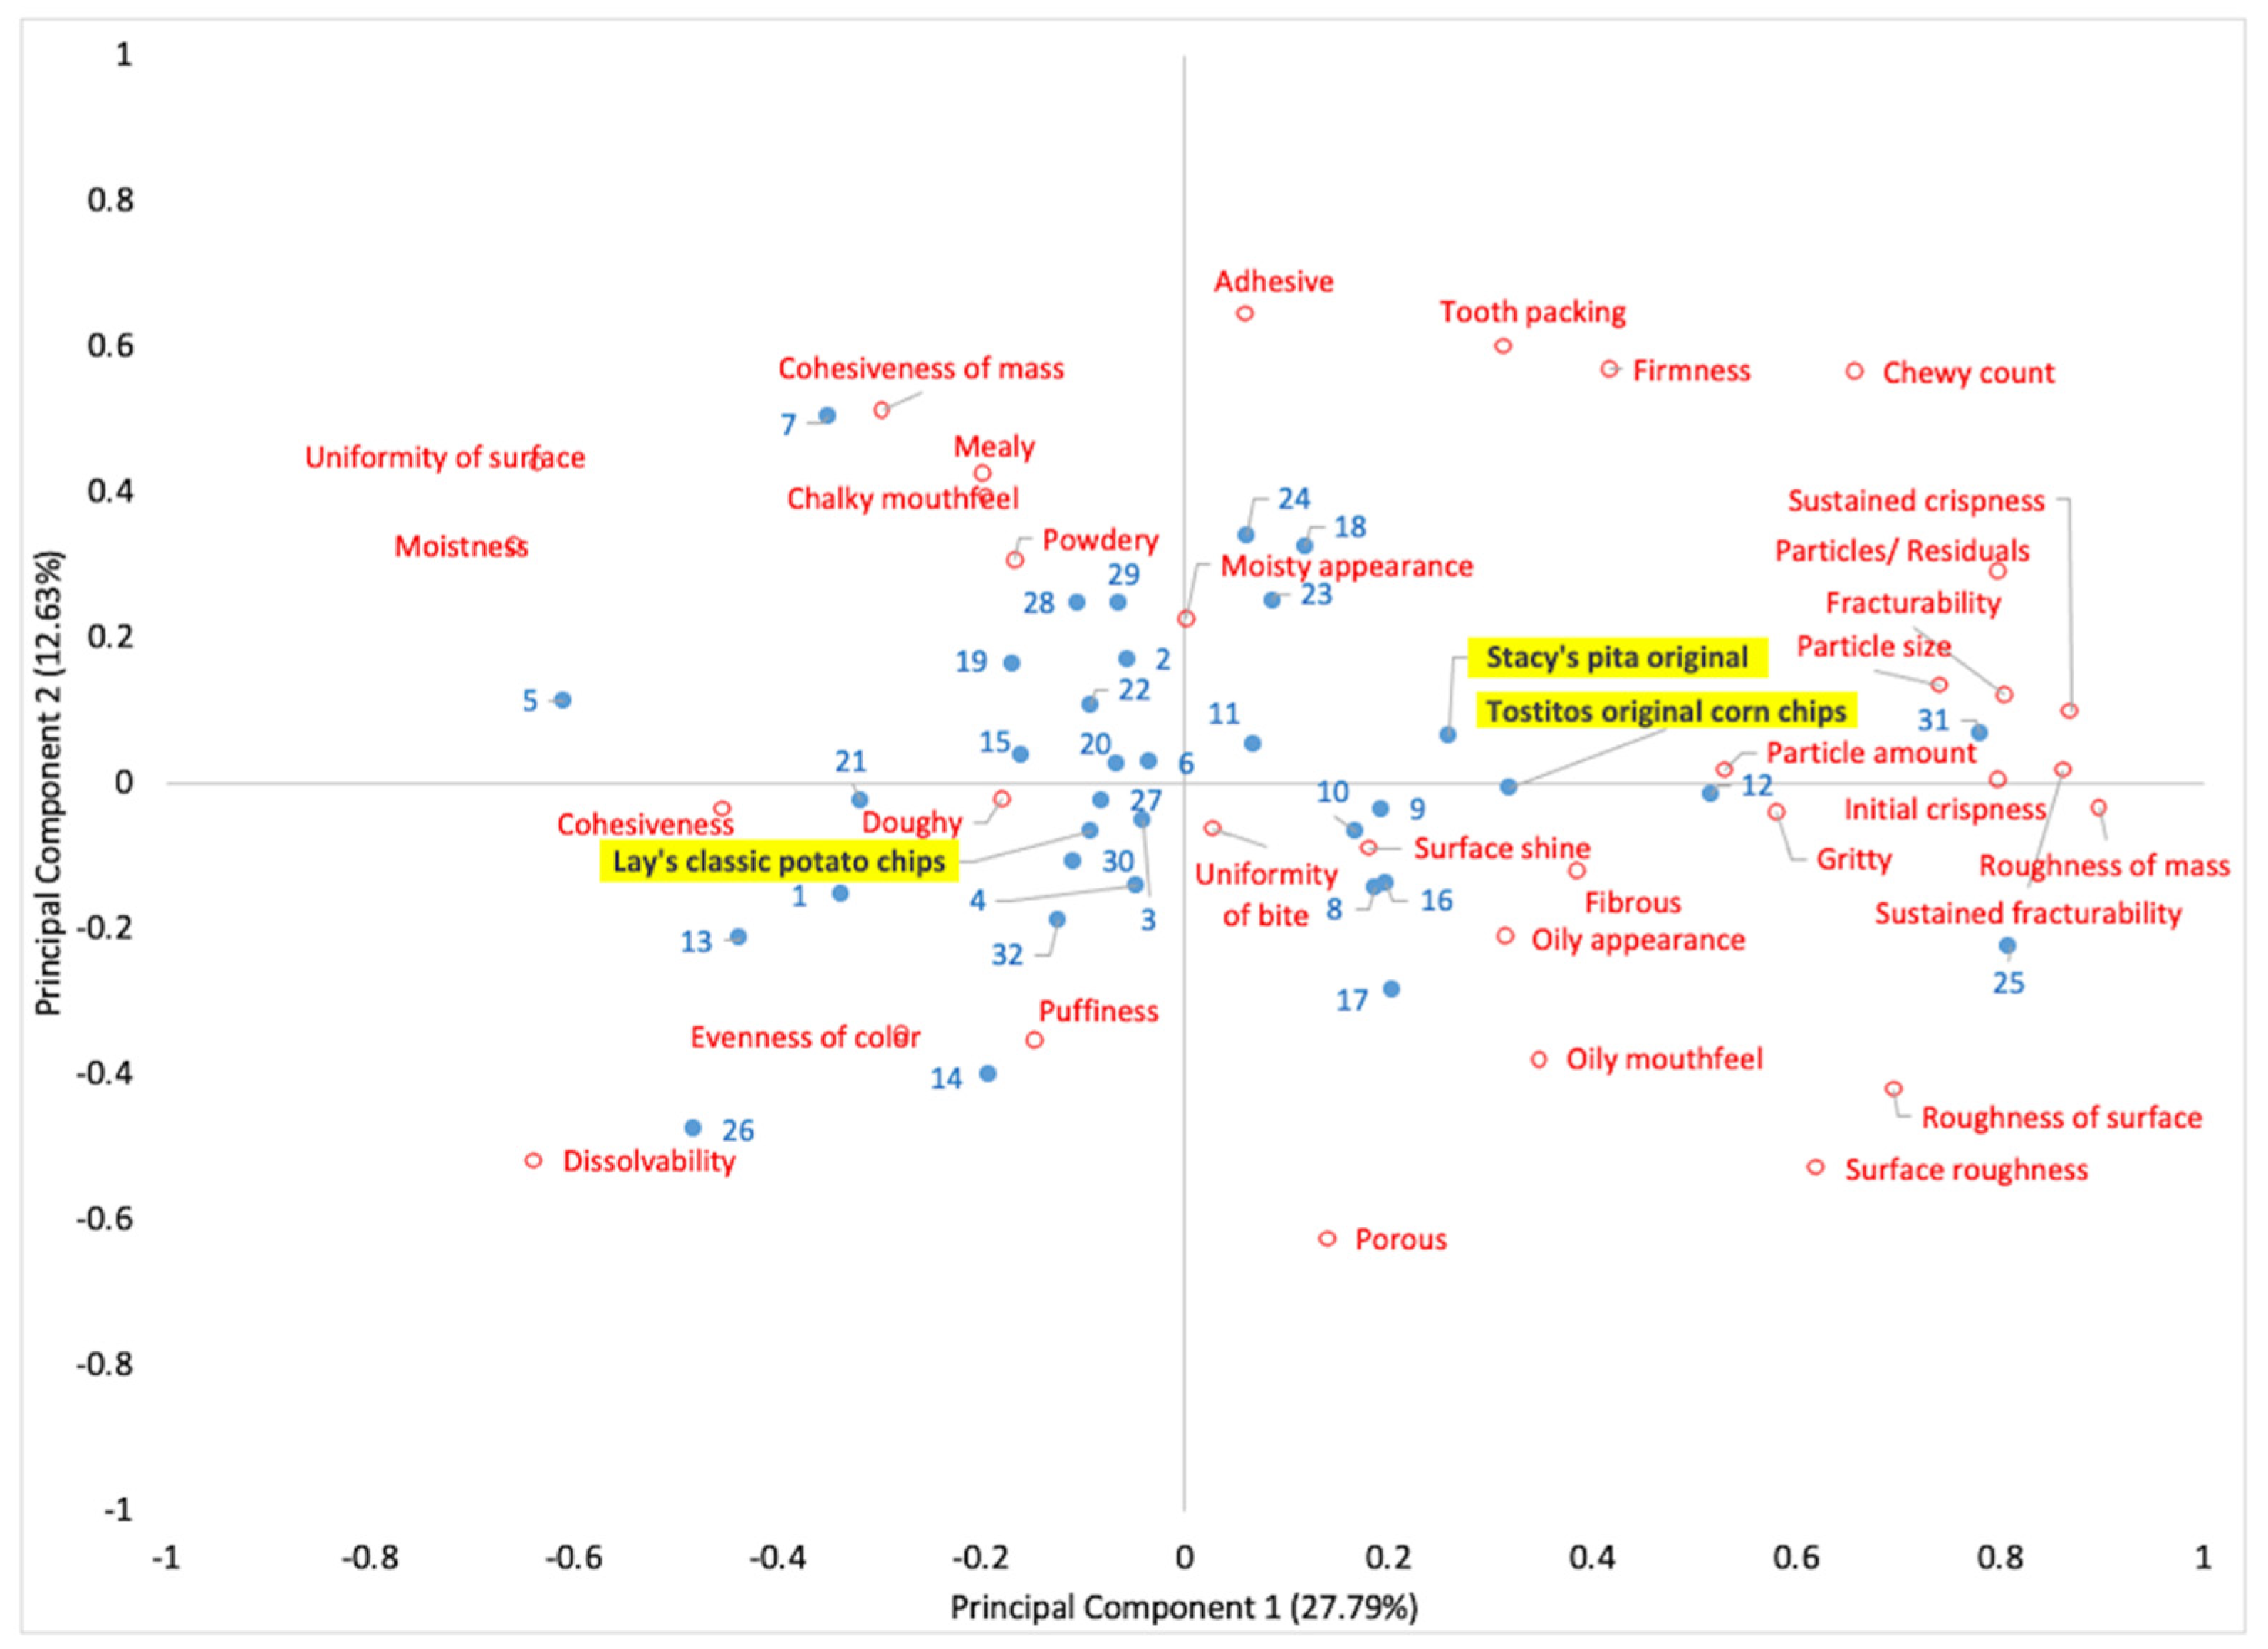
3.2.2. South Korean Snacks
4. Discussion
- Step 1: Pre-development Homework (Preliminary Market Assessment, Which Markets and Why?)
- Step 2: Market-Driven Product Assessment
- Step 3: Opportunity Definition (Distinct, Early Features, Requirements, and Product Specifications)
- Step 4: Opportunity for Fine-Tuning (Iterative, Prototype Development, Test, Feedback, and Revise Iterations)
- Step 5: Opportunity Feasibility (Marketing, R&D, Engineering, Production)
4.1. Implications
4.2. Limitations
4.3. Future Research
5. Conclusions
Supplementary Materials
Author Contributions
Funding
Institutional Review Board Statement
Informed Consent Statement
Acknowledgments
Conflicts of Interest
References
- Fuller, G.W. New Food Product Development; CRC Press: Boca Raton, FL, USA, 2016; ISBN 9780429062711. [Google Scholar]
- Guiné, R.P.F.; Ramalhosa, E.C.D.; Valente, L.P. New Foods, New Consumers: Innovation in Food Product Development. Curr. Nutr. Food Sci. 2016, 12, 175–189. [Google Scholar] [CrossRef]
- Santoro, G.; Vrontis, D.; Pastore, A. External knowledge sourcing and new product development. Br. Food J. 2017, 119, 2373–2387. [Google Scholar] [CrossRef]
- Bresciani, S. Open, networked and dynamic innovation in the food and beverage industry. Br. Food J. 2017, 119, 2290–2293. [Google Scholar] [CrossRef]
- Della Corte, V.; Del Gaudio, G.; Sepe, F. Innovation and tradition-based firms: A multiple case study in the agro-food sector. Br. Food J. 2018, 120, 1295–1314. [Google Scholar] [CrossRef]
- Merieux NutriSciences; Lascom. How to Facilitate Your Product Development in a Global Regulatory Environment. A white paper. Food and Beverage. 2018. Available online: http://www.lascom.com/wp-content/uploads/2018/05/White-Paper_Merieux-NutriSciences-Lascom_How-to-facilitate-product-development-in-a-global-regulatory-environment.pdf (accessed on 10 January 2020).
- Stewart-Knox, B.; Parr, H.; Bunting, B.; Mitchell, P. A model for reduced fat food product development success. Food Qual. Prefer. 2003, 14, 583–593. [Google Scholar] [CrossRef]
- Banović, M.; Krystallis, A.; Guerrero, L.; Reinders, M.J. Consumers as co-creators of new product ideas: An application of projective and creative research techniques. Food Res. Int. 2016, 87, 211–223. [Google Scholar] [CrossRef] [PubMed]
- De Pelsmaeker, S.; Gellynck, X.; Delbaere, C.; Declercq, N.; Dewettinck, K. Consumer-driven product development and improvement combined with sensory analysis: A case-study for European filled chocolates. Food Qual. Prefer. 2015, 41, 20–29. [Google Scholar] [CrossRef]
- Murley, T.; Kumar, R.; Chambers, E.; Chambers, D.; Ciccone, M.; Yang, G. A process for evaluating a product category in an unfamiliar country: Issues and solutions in a case study of snacks in Japan. J. Sens. Stud. 2020, 35, e12574. [Google Scholar] [CrossRef]
- Horvat, A.; Granato, G.; Fogliano, V.; Luning, P.A. Understanding consumer data use in new product development and the product life cycle in European food firms—An empirical study. Food Qual. Prefer. 2019, 76, 20–32. [Google Scholar] [CrossRef]
- Johnson, M.W. Reinvent Your Business Model: How to Seize the White Space for Transformative Growth; Harvard Business Press: Brighton, MA, USA, 2018; ISBN 978-1-6336-9646-4. [Google Scholar]
- Jagtap, S.; Duong, L.N.K. Improving the new product development using big data: A case study of a food company. Br. Food J. 2019, 121, 2835–2848. [Google Scholar] [CrossRef] [Green Version]
- Dijksterhuis, G. New product failure: Five potential sources discussed. Trends Food Sci. Technol. 2016, 50, 243–248. [Google Scholar] [CrossRef]
- Nielson. Breakthrough innovation report. 2014. Available online: https://www.nielsen.com/us/en/insights/report/2014/breakthrough-innovation-report/ (accessed on 10 January 2020).
- Kemp, S.; Hort, J. Trends in sensory science. Food Sci. Technol. 2015, 29, 36–39. [Google Scholar]
- Asioli, D.; Varela, P.; Hersleth, M.; Almli, V.L.; Olsen, N.V.; Næs, T. A discussion of recent methodologies for combining sensory and extrinsic product properties in consumer studies. Food Qual. Prefer. 2017, 56, 266–273. [Google Scholar] [CrossRef]
- Cooper, R.G. The drivers of success in new-product development. Ind. Mark. Manag. 2019, 76, 36–47. [Google Scholar] [CrossRef]
- Costa, A.I.A.; Jongen, W.M.F. New insights into consumer-led food product development. Trends Food Sci. Technol. 2006, 17, 457–465. [Google Scholar] [CrossRef]
- Grujić, S.; Odžaković, B.; Ciganović, M. Sensory analysis as a tool in the new food product development. In Proceedings of the II International Congress Food Technology Quality and Safety, Novi Sad, Serbia, 28–30 October 2014; pp. 325–330. [Google Scholar]
- Ryynänen, T.; Hakatie, A. “We must have the wrong consumers”—A case study on new food product development failure. Br. Food J. 2014, 116, 707–722. [Google Scholar] [CrossRef]
- Simeone, M.; Marotta, G. Towards an integration of sensory research and marketing in new food products development: A theoretical and methodological review. Afr. J. Bus. Manag. 2010, 4, 4207–4216. [Google Scholar]
- Talavera, M.; Chambers, E. Using sensory sciences help products succeed. Br. Food J. 2017, 119, 2130–2144. [Google Scholar] [CrossRef]
- MacFie, H.J.H. Index. In Consumer-Led Food Product Development; Elsevier: Amsterdam, The Netherlands, 2007; pp. 593–613. ISBN 9781845690724. [Google Scholar]
- Crofton, E.C.; Scannell, A.G.M. Snack foods from brewing waste: Consumer-led approach to developing sustainable snack options. Br. Food J. 2020. [Google Scholar] [CrossRef]
- Cuny, C.; Petit, C.; Allain, G. Capturing implicit texture-flavour associations to predict consumers’ new product preferences. J. Retail. Consum. Serv. 2020. [Google Scholar] [CrossRef]
- Godin, L.; Laakso, S.; Sahakian, M. Doing laundry in consumption corridors: Wellbeing and everyday life. Sustain. Sci. Pract. Policy 2020, 16, 99–113. [Google Scholar] [CrossRef]
- Mahama-Musah, F.; Vanhaverbeke, L.; Gillet, A. The impact of personal, market- and product-relevant factors on patronage behaviour in the automobile tyre replacement market. J. Retail. Consum. Serv. 2020, 57, 102206. [Google Scholar] [CrossRef]
- Mora, M.; Romeo-Arroyo, E.; Torán-Pereg, P.; Chaya, C.; Vázquez-Araújo, L. Sustainable and health claims vs sensory properties: Consumers’ opinions and choices using a vegetable dip as example product. Food Res. Int. 2020, 137, 109521. [Google Scholar] [CrossRef]
- Zocchi, D.M.; Piochi, M.; Cabrino, G.; Fontefrancesco, M.F.; Torri, L. Linking producers’ and consumers’ perceptions in the valorisation of non-timber forest products: An analysis of Ogiek forest honey. Food Res. Int. 2020, 137, 109417. [Google Scholar] [CrossRef]
- Donelan, A.K.; Chambers, D.H.; Chambers, E.; Godwin, S.L.; Cates, S.C. Consumer Poultry Handling Behavior in the Grocery Store and In-Home Storage. J. Food Prot. 2016, 79, 582–588. [Google Scholar] [CrossRef]
- Pawera, L.; Khomsan, A.; Zuhud, E.A.M.; Hunter, D.; Ickowitz, A.; Polesny, Z. Wild food plants and trends in their use: From knowledge and perceptions to drivers of change in West Sumatra, Indonesia. Foods 2020, 9, 1240. [Google Scholar] [CrossRef]
- Talavera, M.; Sasse, A.M. Gathering consumer terminology using focus groups—An example with beauty care. J. Sens. Stud. 2019, 34, 12533. [Google Scholar] [CrossRef] [Green Version]
- Hoppu, U.; Puputti, S.; Mattila, S.; Puurtinen, M.; Sandell, M. Food consumption and emotions at a salad lunch buffet in a multisensory environment. Foods 2020, 9, 1349. [Google Scholar] [CrossRef]
- Bryant, C.; van Nek, L.; Rolland, N.C.M. European markets for cultured meat: A comparison of germany and france. Foods 2020, 9, 1152. [Google Scholar] [CrossRef]
- Chambers, E.; Tran, T.; Chambers, E. Natural: A $75 billion word with no definition—Why not? J. Sens. Stud. 2019, 34, e12501. [Google Scholar] [CrossRef]
- Murley, T.; Chambers, E. The influence of colorants, flavorants and product identity on perceptions of naturalness. Foods 2019, 8, 317. [Google Scholar] [CrossRef] [PubMed] [Green Version]
- Doungtip, P.; Sriwattana, S.; Kim, K.T. Understanding Thai consumer attitudes and expectations of ginseng food products. J. Sens. Stud. 2020, 35, 12553. [Google Scholar] [CrossRef]
- Aguiar, L.A.; Melo, L.; de Lacerda de Oliveira, L. Validation of rapid descriptive sensory methods against conventional descriptive analyses: A systematic review. Crit. Rev. Food Sci. Nutr. 2019, 59, 2535–2552. [Google Scholar] [CrossRef] [PubMed]
- Cartier, R.; Rytz, A.; Lecomte, A.; Poblete, F.; Krystlik, J.; Belin, E.; Martin, N. Sorting procedure as an alternative to quantitative descriptive analysis to obtain a product sensory map. Food Qual. Prefer. 2006, 17, 562–571. [Google Scholar] [CrossRef]
- Pagès, J.; Cadoret, M.; Lê, S. The sorted napping: A new holistic approach in sensory evaluation. J. Sens. Stud. 2010, 25, 637–658. [Google Scholar] [CrossRef]
- Risvik, E.; McEwan, J.A.; Rødbotten, M. Evaluation of sensory profiling and projective mapping data. Food Qual. Prefer. 1997, 8, 63–71. [Google Scholar] [CrossRef]
- Zhang, T.; Lusk, K.; Mirosa, M.; Oey, I. Understanding young immigrant Chinese consumers’ freshness perceptions of orange juices: A study based on concept evaluation. Food Qual. Prefer. 2016, 48, 156–165. [Google Scholar] [CrossRef]
- He, W.; Chung, H.Y. Comparison between quantitative descriptive analysis and flash profile in profiling the sensory properties of commercial red sufu (Chinese fermented soybean curd). J. Sci. Food Agric. 2019, 99, 3024–3033. [Google Scholar] [CrossRef] [PubMed]
- Brand, J.; Kidd, M.; van Antwerpen, L.; Valentin, D.; Næs, T.; Nieuwoudt, H.H. Sorting in combination with quality scoring: A tool for industry professionals to identify drivers of wine quality rapidly. S. Afr. J. Enol. Vitic. 2018, 39, 163–175. [Google Scholar] [CrossRef] [Green Version]
- González-Mohíno, A.; Antequera, T.; Pérez-Palacios, T.; Ventanas, S. Napping combined with ultra-flash profile (UFP) methodology for sensory assessment of cod and pork subjected to different cooking methods and conditions. Eur. Food Res. Technol. 2019, 245, 2221–2231. [Google Scholar] [CrossRef]
- Cliceri, D.; Dinnella, C.; Depezay, L.; Morizet, D.; Giboreau, A.; Appleton, K.M.; Hartwell, H.; Monteleone, E. Exploring salient dimensions in a free sorting task: A cross-country study within the elderly population. Food Qual. Prefer. 2017, 60, 19–30. [Google Scholar] [CrossRef]
- Saldaña, E.; Martins, M.M.; Behrens, J.H.; Valentin, D.; Selani, M.M.; Contreras-Castillo, C.J. Looking at non-sensory factors underlying consumers’ perception of smoked bacon. Meat Sci. 2020, 163, 108072. [Google Scholar] [CrossRef] [PubMed]
- Soares, E.K.B.; Esmerino, E.A.; Ferreira, M.V.S.; da Silva, M.A.A.P.; Freitas, M.Q.; Cruz, A.G. What are the cultural effects on consumers’ perceptions? A case study covering coalho cheese in the Brazilian northeast and southeast area using word association. Food Res. Int. 2017, 102, 553–558. [Google Scholar] [CrossRef] [PubMed]
- Katiyo, W.; Coorey, R.; Buys, E.M.; Kock, H.L. Consumers’ perceptions of intrinsic and extrinsic attributes as indicators of safety and quality of chicken meat: Actionable information for public health authorities and the chicken industry. J. Food Sci. 2020, 85, 1845–1855. [Google Scholar] [CrossRef] [PubMed]
- Thomas, S.; Chambault, M. Integrating the Packaging and Product Experience in Food and Beverages; Elsevier: Amsterdam, The Netherlands, 2016; ISBN 9780081003565. [Google Scholar]
- Mayhew, E.; Schmidt, S.; Lee, S.Y. Napping—Ultra flash profile as a tool for category identification and subsequent model system formulation of caramel corn products. J. Food Sci. 2016, 81, S1782–S1790. [Google Scholar] [CrossRef] [PubMed]
- Valentin, D.; Cholet, S.; Nestrud, M.; Abdi, H. Projective mapping and sorting tasks, Chapter 15. In Descriptive Analysis in Sensory Evaluation; Kemp, S.E., Hort, J., Hollowood, T., Eds.; John Wiley & Sons, Ltd.: Chichester, UK, 2018; pp. 535–559. ISBN 978-0-470-67139-9. [Google Scholar]
- Lawless, H.T.; Heymann, H. Sensory Evaluation of Food; Food Science Text Series; Springer: New York, NY, USA, 2013; ISBN 978-1-4419-6487-8. [Google Scholar]
- Chambers, E. Consensus Methods for Descriptive Analysis. In Descriptive Analysis in Sensory Evaluation; Kemp, S., Hort, J., Hollowood, T., Eds.; John Wiley & Sons, Ltd.: Chichester, UK, 2018; pp. 213–236. ISBN 978-0-470-67139-9. [Google Scholar]
- Chambers, E. Analysis of sensory properties in foods: A special issue. Foods 2019, 8, 291. [Google Scholar] [CrossRef] [Green Version]
- Luchsinger, S.E.; Kropf, D.H.; García Zepeda, C.M.; Chambers IV, E.; Hollingsworth, M.E.; Hunt, M.C.; Marsden, J.L.; Kastner, C.L.; Kuecker, W.G. Sensory analysis and consumer acceptance of irradiated boneless pork chops. J. Food Sci. 1996, 61. [Google Scholar] [CrossRef]
- Muñoz, A.M.; Chambers, E.I. Relating measurements of sensory properties to consumer acceptance of meat products. Food Technol. 1993, 47, 128–131. [Google Scholar]
- Suwonsichon, S. The importance of sensory lexicons for research and development of food products. Foods 2019, 8, 27. [Google Scholar] [CrossRef] [PubMed] [Green Version]
- Yang, J.; Lee, J. Application of sensory descriptive analysis and consumer studies to investigate traditional and authentic foods: A review. Foods 2019, 8, 54. [Google Scholar] [CrossRef] [Green Version]
- Van Kleef, E.; van Trijp, H.C.M.; Luning, P. Consumer research in the early stages of new product development: A critical review of methods and techniques. Food Qual. Prefer. 2005, 16, 181–201. [Google Scholar] [CrossRef]
- Tran, T.; James, M.N.; Chambers, D.; Koppel, K.; Chambers, E. Lexicon development for the sensory description of rye bread. J. Sens. Stud. 2019, 34, e12474. [Google Scholar] [CrossRef] [Green Version]
- Chun, S.; Chambers, E.; Han, I. Development of a Sensory Flavor Lexicon for Mushrooms and Subsequent Characterization of Fresh and Dried Mushrooms. Foods 2020, 9, 980. [Google Scholar] [CrossRef] [PubMed]
- Kumar, R.; Chambers, E. Lexicon for multiparameter texture assessment of snack and snack-like foods in English, Spanish, Chinese, and Hindi. J. Sens. Stud. 2019, 34, e12500. [Google Scholar] [CrossRef]
- Sharma, C.; Chambers, E.; Jayanty, S.S.; Sathuvalli Rajakalyan, V.; Holm, D.G.; Talavera, M. Development of a lexicon to describe the sensory characteristics of a wide variety of potato cultivars. J. Sens. Stud. 2020, 35, e12577. [Google Scholar] [CrossRef]
- de Godoy, R.C.B.; Chambers, E.; Yang, G. Development of a preliminary sensory lexicon for mate tea. J. Sens. Stud. 2020, 35, e12570. [Google Scholar] [CrossRef]
- Laird, H.; Miller, R.K.; Kerth, C.R.; Chambers, E. The Flavor and Texture Attributes of Ground Beef. Flavor Texture Attrib. Gr. Beef 2017, 1, 7. [Google Scholar] [CrossRef]
- Jaffe, T.R.; Wang, H.; Chambers, E. Determination of a lexicon for the sensory flavor attributes of smoked food products. J. Sens. Stud. 2017, 32, e12262. [Google Scholar] [CrossRef]
- Culbert, J.A.; Ristic, R.; Ovington, L.A.; Saliba, A.J.; Wilkinson, K.L. Influence of production method on the sensory profile and consumer acceptance of Australian sparkling white wine styles. Aust. J. Grape Wine Res. 2017, 23, 170–178. [Google Scholar] [CrossRef]
- Lee, J.; Chambers, E.; Chambers, D.H.; Chun, S.S.; Oupadissakoon, C.; Johnson, D.E. Consumer acceptance for green tea by consumers in the United States, Korea and Thailand. J. Sens. Stud. 2010, 25, 109–132. [Google Scholar] [CrossRef]
- Bowen, A.J.; Blake, A.; Tureček, J.; Amyotte, B. External preference mapping: A guide for a consumer-driven approach to apple breeding. J. Sens. Stud. 2019, 34, e12472. [Google Scholar] [CrossRef] [Green Version]
- Sharma, C.; Jayanty, S.S.; Chambers, E.; Talavera, M. Segmentation of potato consumers based on sensory and attitudinal aspects. Foods 2020, 9, 161. [Google Scholar] [CrossRef] [Green Version]
- Salvador, A.; Varela, P.; Sanz, T.; Fiszman, S.M. Understanding potato chips crispy texture by simultaneous fracture and acoustic measurements, and sensory analysis. LWT Food Sci. Technol. 2009, 42, 763–767. [Google Scholar] [CrossRef]
- Antmann, G.; Ares, G.; Salvador, A.; Varela, P.; Fiszman, S.M. Exploring and explaining creaminess perception: Consumers’ underlying concepts. J. Sens. Stud. 2011, 26, 40–47. [Google Scholar] [CrossRef]
- Frøst, M.B.; Janhøj, T. Understanding creaminess. Int. Dairy J. 2007, 17, 1298–1311. [Google Scholar] [CrossRef] [Green Version]
- De Pelsmaeker, S.; Dewettinck, K.; Gellynck, X. The possibility of using tasting as a presentation method for sensory stimuli in conjoint analysis. Trends Food Sci. Technol. 2013, 29, 108–115. [Google Scholar] [CrossRef]
- Adriana, L.S.; Mauricio, C.; Delores, C.; Loreida, T.; Kadri, K.; Edgar, C.; Yu, H. Benefits, Challenges, and Opportunities of Conducting a Collaborative Research Course in an International University Partnership: A Study Case Between Kansas State University and Tallinn University of Technology. J. Food Sci. Educ. 2019, 18, 78–86. [Google Scholar] [CrossRef] [Green Version]
- Corley, J. Finding the white space in natural personal care: How Olivina identified a niche (natural male grooming) and fast-tracked from formulation to shelf in nine months. Glob. Cosmet. Ind. 2017, 185, 34–39. [Google Scholar]
- Thompson, A. Kinder Joy, M&M’S Caramel top IRI’s list of 2018 New Product Pacesetters. Candy Ind. 2019, 184, 10–11. [Google Scholar]
- Phan, U.T.X.; Chambers, E. Application of An Eating Motivation Survey to Study Eating Occasions. J. Sens. Stud. 2016, 31, 114–123. [Google Scholar] [CrossRef]
- Pagès, J. Collection and analysis of perceived product inter-distances using multiple factor analysis: Application to the study of 10 white wines from the Loire Valley. Food Qual. Prefer. 2005, 16, 642–649. [Google Scholar] [CrossRef]
- Chambers, E.; Chambers, D.H. Chapter 1 | Consensus Profile Methods Derived from the Flavor Profile Method. In Descriptive Analysis Testing for Sensory Evaluation, 2nd ed.; Bleibaum, R., Ed.; ASTM International: West Conshohocken, PA, USA, 2020; pp. 1–18. [Google Scholar]
- Griffin, L.E.; Dean, L.L.; Drake, M.A. The development of a lexicon for cashew nuts. J. Sens. Stud. 2017, 32, e12244. [Google Scholar] [CrossRef]
- Chambers, E.; Bowers, J.A.; Dayton, A.D. Statistical designs and panel training/experience for sensory analysis. J. Food Sci. 1981, 46, 1902–1906. [Google Scholar] [CrossRef]
- Chambers, E.; Smith, E.A. Effects of testing experience on performance of trained sensory panelists. J. Sens. Stud. 1993, 8, 155–166. [Google Scholar] [CrossRef]
- Chambers, D.H.; Allison, A.M.A.; Chambers IV, E. Training effects on performance of descriptive panelists. J. Sens. Stud. 2004, 19, 486–499. [Google Scholar] [CrossRef]
- Otremba, M.M.; Dikeman, M.E.; Milliken, G.A.; Stroda, S.L.; Unruh, J.A.; Chambers IV, E. Interrelationships among evaluations of beef longissimus and semitendinosus muscle tenderness by Warner-Bratzler shear force, a descriptive-texture profile sensory panel, and a descriptive attribute sensory panel. J. Anim. Sci. 1999, 77, 865–873. [Google Scholar] [CrossRef] [PubMed]
- Belisle, C.; Adhikari, K.; Chavez, D.; Phan, U.T.X. Development of a lexicon for flavor and texture of fresh peach cultivars. J. Sens. Stud. 2017. [Google Scholar] [CrossRef]
- Chambers, E.; Lee, J.; Chun, S.; Miller, A.E. Development of a Lexicon for Commercially Available Cabbage (Baechu) Kimchi. J. Sens. Stud. 2012, 27, 511–518. [Google Scholar] [CrossRef]
- Muñoz, A.M.; Chambers IV, E.; Hummer, S. A multifaceted category research study: How to understand a product category and its consumer responses. J. Sens. Stud. 1996, 11. [Google Scholar] [CrossRef]
- Suwonsichon, S.; Chambers Iv, E.; Kongpensook, V.; Oupadissakoon, C. Sensory lexicon for mango as affected by cultivars and stages of ripeness. J. Sens. Stud. 2012, 27, 148–160. [Google Scholar] [CrossRef]
- Thompson, K.R.; Chambers, D.H.; Chambers IV, E. Sensory characteristics of ice cream produced in the U.S.A. and ITALY. J. Sens. Stud. 2009, 24, 396–414. [Google Scholar] [CrossRef]
- Grunert, K.G. (Ed.) Consumer Trends and New Product Opportunities in the Food Sector; Wageningen Academic Publishers: Wageningen, The Netherlands, 2017; ISBN 978-90-8686-307-5. [Google Scholar]
- Simms, C.; Trott, P. Packaging Dependent Products: How do Firms in the Packaged Food Sector Manage the Development of new Packaging Opportunities? In Proceedings of the 12th European Conference on Innovation and Entrepreneurship, Academic Conferences International Limited, Paris, France, 21–22 September 2017; pp. 611–619. [Google Scholar]
- Wind, J.; Mahajan, V. Issues and Opportunities in New Product Development: An Introduction to the Special Issue. J. Mark. Res. 1997, 34, 1–12. [Google Scholar] [CrossRef] [Green Version]
- Cooper, R.G. Best practices and success drivers in new product development. In Handbook of Research on New Product Development; Edward Elgar Publishing: Cheltenham, UK, 2018; ISBN 978-1-78471-814-5. [Google Scholar]
- Costa, G.M.; Paula, M.M.; Costa, G.N.; Esmerino, E.A.; Silva, R.; Freitas, M.Q.; Barão, C.E.; Cruz, A.G.; Pimentel, T.C. Preferred attribute elicitation methodology compared to conventional descriptive analysis: A study using probiotic yogurt sweetened with xylitol and added with prebiotic components. J. Sens. Stud. 2020. [Google Scholar] [CrossRef]
- Moussaoui, K.A.; Varela, P. Exploring consumer product profiling techniques and their linkage to a quantitative descriptive analysis. Food Qual. Prefer. 2010, 21, 1088–1099. [Google Scholar] [CrossRef] [Green Version]
- Cooper, R.G. Winning at New Products: Creating Value through Innovation; Basic Books: New York, NY, USA, 2017; ISBN 0465093329. [Google Scholar]
- Kumar, R.; Chambers, E. Understanding the terminology for snack foods and their texture by consumers in four languages: A qualitative study. Foods 2019, 8, 484. [Google Scholar] [CrossRef] [Green Version]
- O’sullivan, M. Index. In A Handbook for Sensory and Consumer-Driven New Product Development; Elsevier: Amsterdam, The Netherlands, 2017; pp. 325–337. [Google Scholar]
- Goldenberg, J.; Mazursky, D. Creativity in Product Innovation; Cambridge University Press: Cambridge, UK, 2002; ISBN 9780521800891. [Google Scholar]
- Reid, S.E.; de Brentani, U. The Fuzzy Front End of New Product Development for Discontinuous Innovations: A Theoretical Model. J. Prod. Innov. Manag. 2004, 21, 170–184. [Google Scholar] [CrossRef]
- Savela-Huovinen, U.; Muukkonen, H.; Toom, A. Sensory expert assessor’s learning practices at workplace: Competencies and contexts in sensory evaluation. J. Sens. Stud. 2018, 33. [Google Scholar] [CrossRef]
- Knudsen, M.P. The relative importance of interfirm relationships and knowledge transfer for new product development success. J. Prod. Innov. Manag. 2007, 24, 117–138. [Google Scholar] [CrossRef]
- Capitanio, F.; Coppola, A.; Pascucci, S. Product and process innovation in the Italian food industry. Agribusiness 2010, 26, 503–518. [Google Scholar] [CrossRef]
- Chen, Y.; Vanhaverbeke, W.; Du, J. The interaction between internal R&D and different types of external knowledge sourcing: An empirical study of Chinese innovative firms. R D Manag. 2016, 46, 1006–1023. [Google Scholar] [CrossRef]
- Zobel, A.K. Benefiting from Open Innovation: A Multidimensional Model of Absorptive Capacity. J. Prod. Innov. Manag. 2017. [Google Scholar] [CrossRef]
- Koppel, K.; Chambers, E.; Vázquez-Araújo, L.; Timberg, L.; Carbonell-Barrachina, T.A.; Suwonsichon, S. Cross-country comparison of pomegranate juice acceptance in Estonia, Spain, Thailand, and United States. Food Qual. Prefer. 2014, 31. [Google Scholar] [CrossRef] [Green Version]


| Serial Numbers | Snacks | Manufacturer 1 | PM Code * and Group Numbers ** |
|---|---|---|---|
| 1 | 3D corn bugle | - | 23, group-2 |
| 2 | Bourbon lubera rolls | Bourbon | 13 |
| 3 | Nagewa potato rings | Family Mart collection | 4, group-5 |
| 4 | Sesame wafer rolls | - | 40, group-8 |
| 5 | Seaweed coated crackers | - | 34, group-6 |
| 6 | Freeze-dried strawberries | Fukumi | 16, group-4 |
| 7 | Cheese-filled crackers | Family Mart collection | 15, group-2 |
| 8 | Plum meat snack | Seven Eleven | 29, group-3 |
| 9 | Baby star ramen | Oyatsu Company | 33, group-6 |
| 10 | Strawberry filled balls | Seven Eleven | 25, group-4 |
| 11 | Freeze-dried ice-cream cone | Glico | 47, group-4 |
| 12 | Cheese-filled rolls | Kirara | 36, group-1 |
| 13 | Squid chips | - | 21, group-1 |
| 14 | Unbranded rice crisps | - | 41, group-6 |
| 15 | Pasta shaped snack | Seven Eleven | 1, group-1 |
| 16 | Calbee Potato Sticks | Calbee | 2 |
| 17 | Pocky chocolate sticks | Glico | 26, group-9 |
| 18 | Pea crisps | Calbee | 11, group-5 |
| 19 | Sweet potato sticks | Family Mart collection | 9, group-7 |
| 20 | Unbranded seaweed crackers | - | 35, group-1 |
| 21 | Riska corn potage puffs | Riska | New |
| 22 | Bourbon rice crackers with cheese | Bourbon | New |
| 23 | Zaku curry filled snacks | - | New |
| 24 | Kameda nut clusters | Kameda | New |
| 25 | Renkon lotus root chips | Sokan group | New |
| 26 | Morianga bites | Morianga | New |
| 27 | Steamed plum seaweed | Family Mart Collection | New |
| 28 | Edamame crisps | Seven Eleven | New |
| 29 | Denroku crispy coated nuts | Denroku | New |
| 30 | Mayonnaise potato wedges | Seven Eleven | New |
| 31 | Soybean FL coated peanuts | Nuts.com | New |
| 32 | Peanut coated cotton candy balls | - | New |
| 33 | Lay’s classic potato chips | Frito-Lay | Anchor |
| 34 | Tostitos original corn chips | Frito-Lay | Anchor |
| 35 | Stacy’s pita original | Frito-Lay | Anchor |
| Serial Numbers | Snacks | Manufacturer 1 | PM Code * and Group Numbers ** |
|---|---|---|---|
| 1 | Orion turtle chips (Himalayan salt) | Orion | 41, group-3 |
| 2 | Orion Peanut Balls | Orion | 44, group-4 |
| 3 | Orion original potato chip | Orion | 40 |
| 4 | Taco chips | Lotte | 28, group-1 |
| 5 | Peanut crunchy bar | Koon brother | 13, group-9 |
| 6 | Pulmuone Crispy seaweed chips | Pulmuone | 7, group-3 |
| 7 | Dasang sweet potato sticks | Dasang | 5, group-7 |
| 8 | Soy sauce seaweed chips | Tempura Chips | 60, group-2 |
| 9 | Momali crown snack | Crown Co. | 4, group-4 |
| 10 | Haitai Rice Sticks | Haitai Calbee | 52, group-1 |
| 11 | Daiso orion potato chips | Orion | 14 |
| 12 | Florentin Coconut French dessert | Peacock | 48, group-4 |
| 13 | Heyroo Injeolmi snack | Heyroo | 38, group-6 |
| 14 | Heyroo Noodle snack | Heyroo | 21, group-3 |
| 15 | Heyroo sweet popcorn | Heyroo | 43, group-4 |
| 16 | Heyroo oranda clusters | Heyroo | 46, group-5 |
| 17 | Prawn snack | - | 63, group-3 |
| 18 | Laver Almond | Tom’s farm | 31 |
| 19 | Mushroom snack | - | 15, group-6 |
| 20 | Kims crispy roasted laver chips | Dongwon Yangban | 57, group-7 |
| 21 | Seed filled cookie | Lotte | New |
| 22 | Seaweed rolls | Only price 2000 | New |
| 23 | Squid rice balls | - | New |
| 24 | Roasted lotus seeds | Daily super nuts | New |
| 25 | Baby crab crunch | Farm & Dale | New |
| 26 | Soft somjulmi snack | Peacock | New |
| 27 | Seaweed crisps | Cheiljedang | New |
| 28 | Honey butter cashew-nut | Tom’s Farm 1982 | New |
| 29 | Yogurt cashew-nut | Murgerbon | New |
| 30 | Tofu snack | Hav’eat | New |
| 31 | NongHyup grain crisps | NongHyup | New |
| 32 | Chicken shaped snack | Lotte | New |
| 33 | Lay’s classic potato chips | Frito-Lay | Anchor |
| 34 | Stacy’s pita Original | Frito-Lay | Anchor |
| 35 | Tostitos original corn chips | Frito-Lay | Anchor |
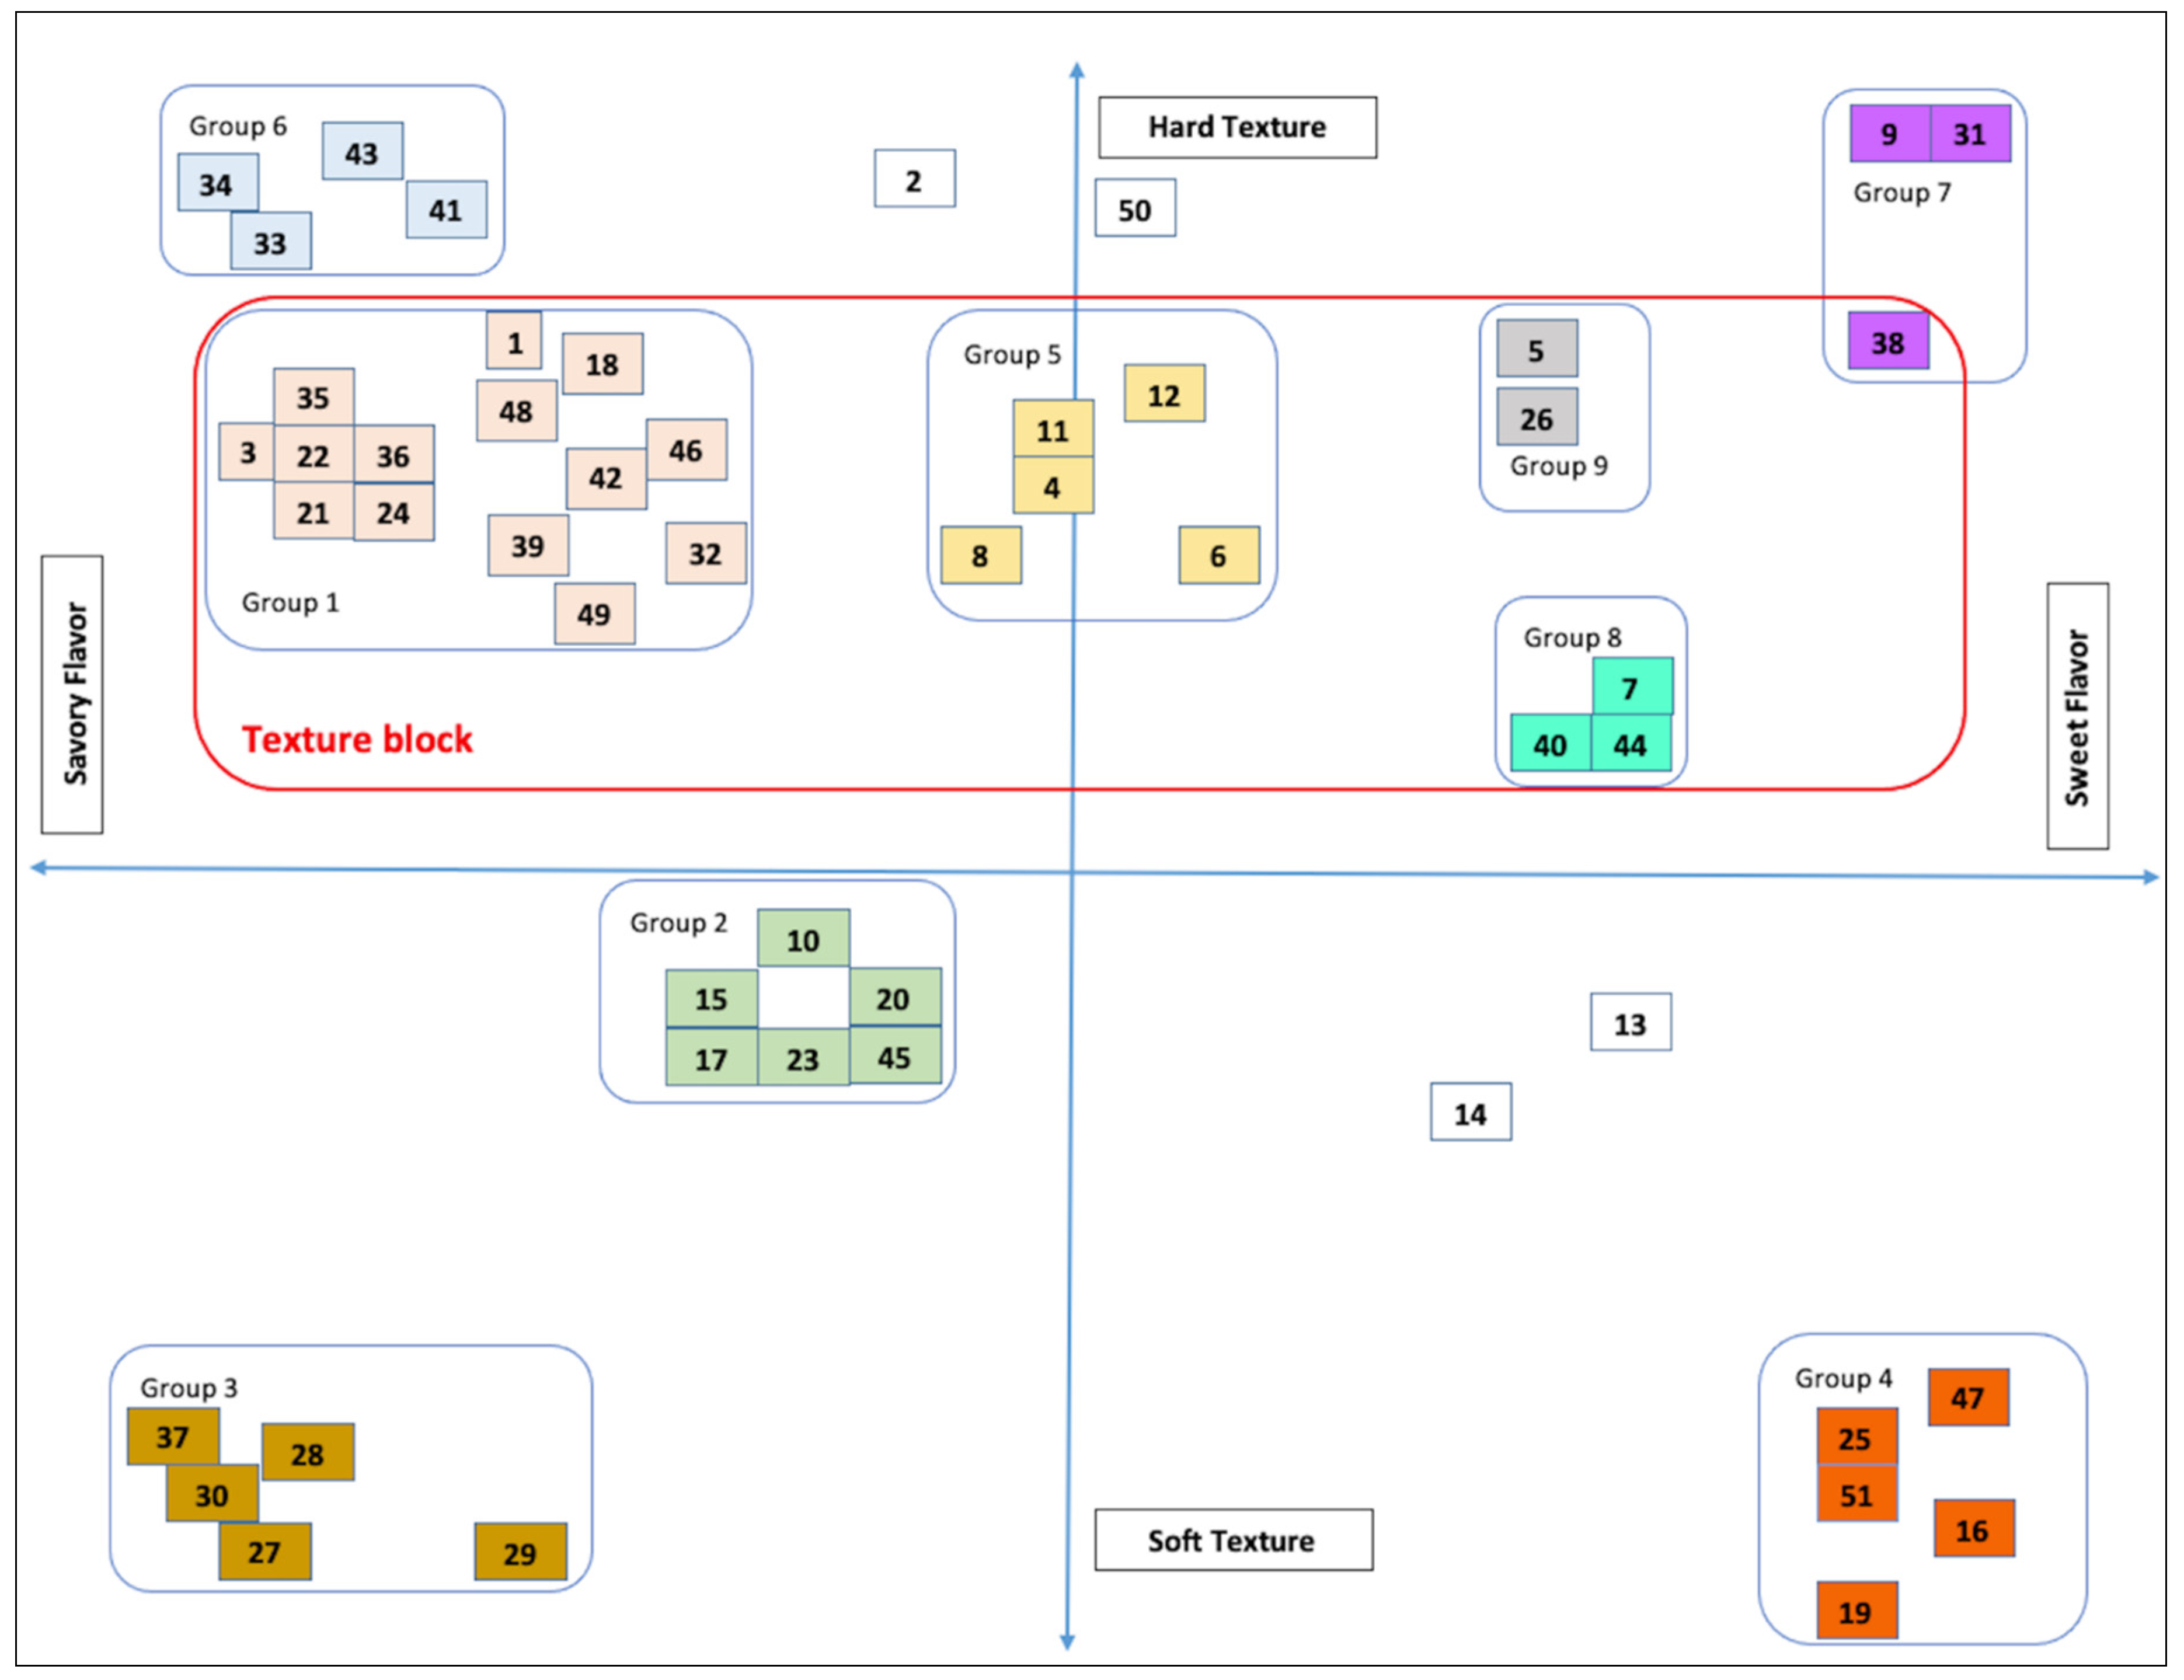
| Groups | Number of Snacks | Texture and Flavor | Snacks Type and Flavor | Examples Snacks Names |
|---|---|---|---|---|
| Group-1 | 14 | Moderate hard bite texture with mild to a strong savory flavor | Type—crackers, wafers, rolls, puffs Flavor—cheese, squid, savory | Ramen noodle snack, shrimp chips, seaweed crackers, squid snack, rice crackers, coated rice crackers, rice crackers, pasta shape fried snack, ginseng root chips, cheese-filled rolls |
| Group-2 | 6 | Soft bite texture with a low savory flavor | Type—crackers, wafers, rolls, puffs Flavor—cheese, sweet, sesame | 3D corn bugles, corn puffs, squid crackers, shrimp crackers, cheese-filled sticks, unbranded rice crackers |
| Group-3 | 5 | Extremely soft-chewy with a strong savory flavor | Type—seafood and meat Flavor—seafood, fish | Dried squid, plum meat, dried fish, cheese with cod, spicy grilled kamaboko fish |
| Group-4 | 5 | Extremely soft with a strong sweet flavor | Type—cake, freeze-dried, puffed balls Flavor—strawberry, chocolate, sweet | Baumkuchen cake, freeze-dried strawberries, strawberry filled puffed balls, freeze-dried strawberry ice-cream cone, chocolate sweet treats |
| Group-5 | 5 | Moderate hard bite with a bland taste | Type—sticks, chips, crisps Flavor—bland, plain, salt | Fried rice crackers, potato rings, pea sticks, rice crackers, fried rice crackers with peanuts |
| Group-6 | 4 | Extremely hard bite with a very strong savory flavor | Type—hard grain crackers Flavor—seaweed | Seaweed crackers, baby star ramen noodle snack, unbranded fried snack, unbranded crackers |
| Group-7 | 3 | Extremely hard bite with a strong sweet flavor | Type—sticks, crackers Flavor -sweet | Unbranded baked crackers, soybean coated walnuts, sweet potato sticks |
| Group-8 | 3 | Moderate hard bite with a mildly sweet flavor | Type—puffs, crackers, Flavor—sweet, chocolate | Chocolate-coated baked rice puffs, sesame wafer rolls, sugar granules coated crackers |
| Group-9 | 2 | Moderate soft bite with a mildly sweet flavor | Type—sticks Flavor—sweet, chocolate, sesame | Rice crackers with sesame seeds, Pocky chocolate sticks |
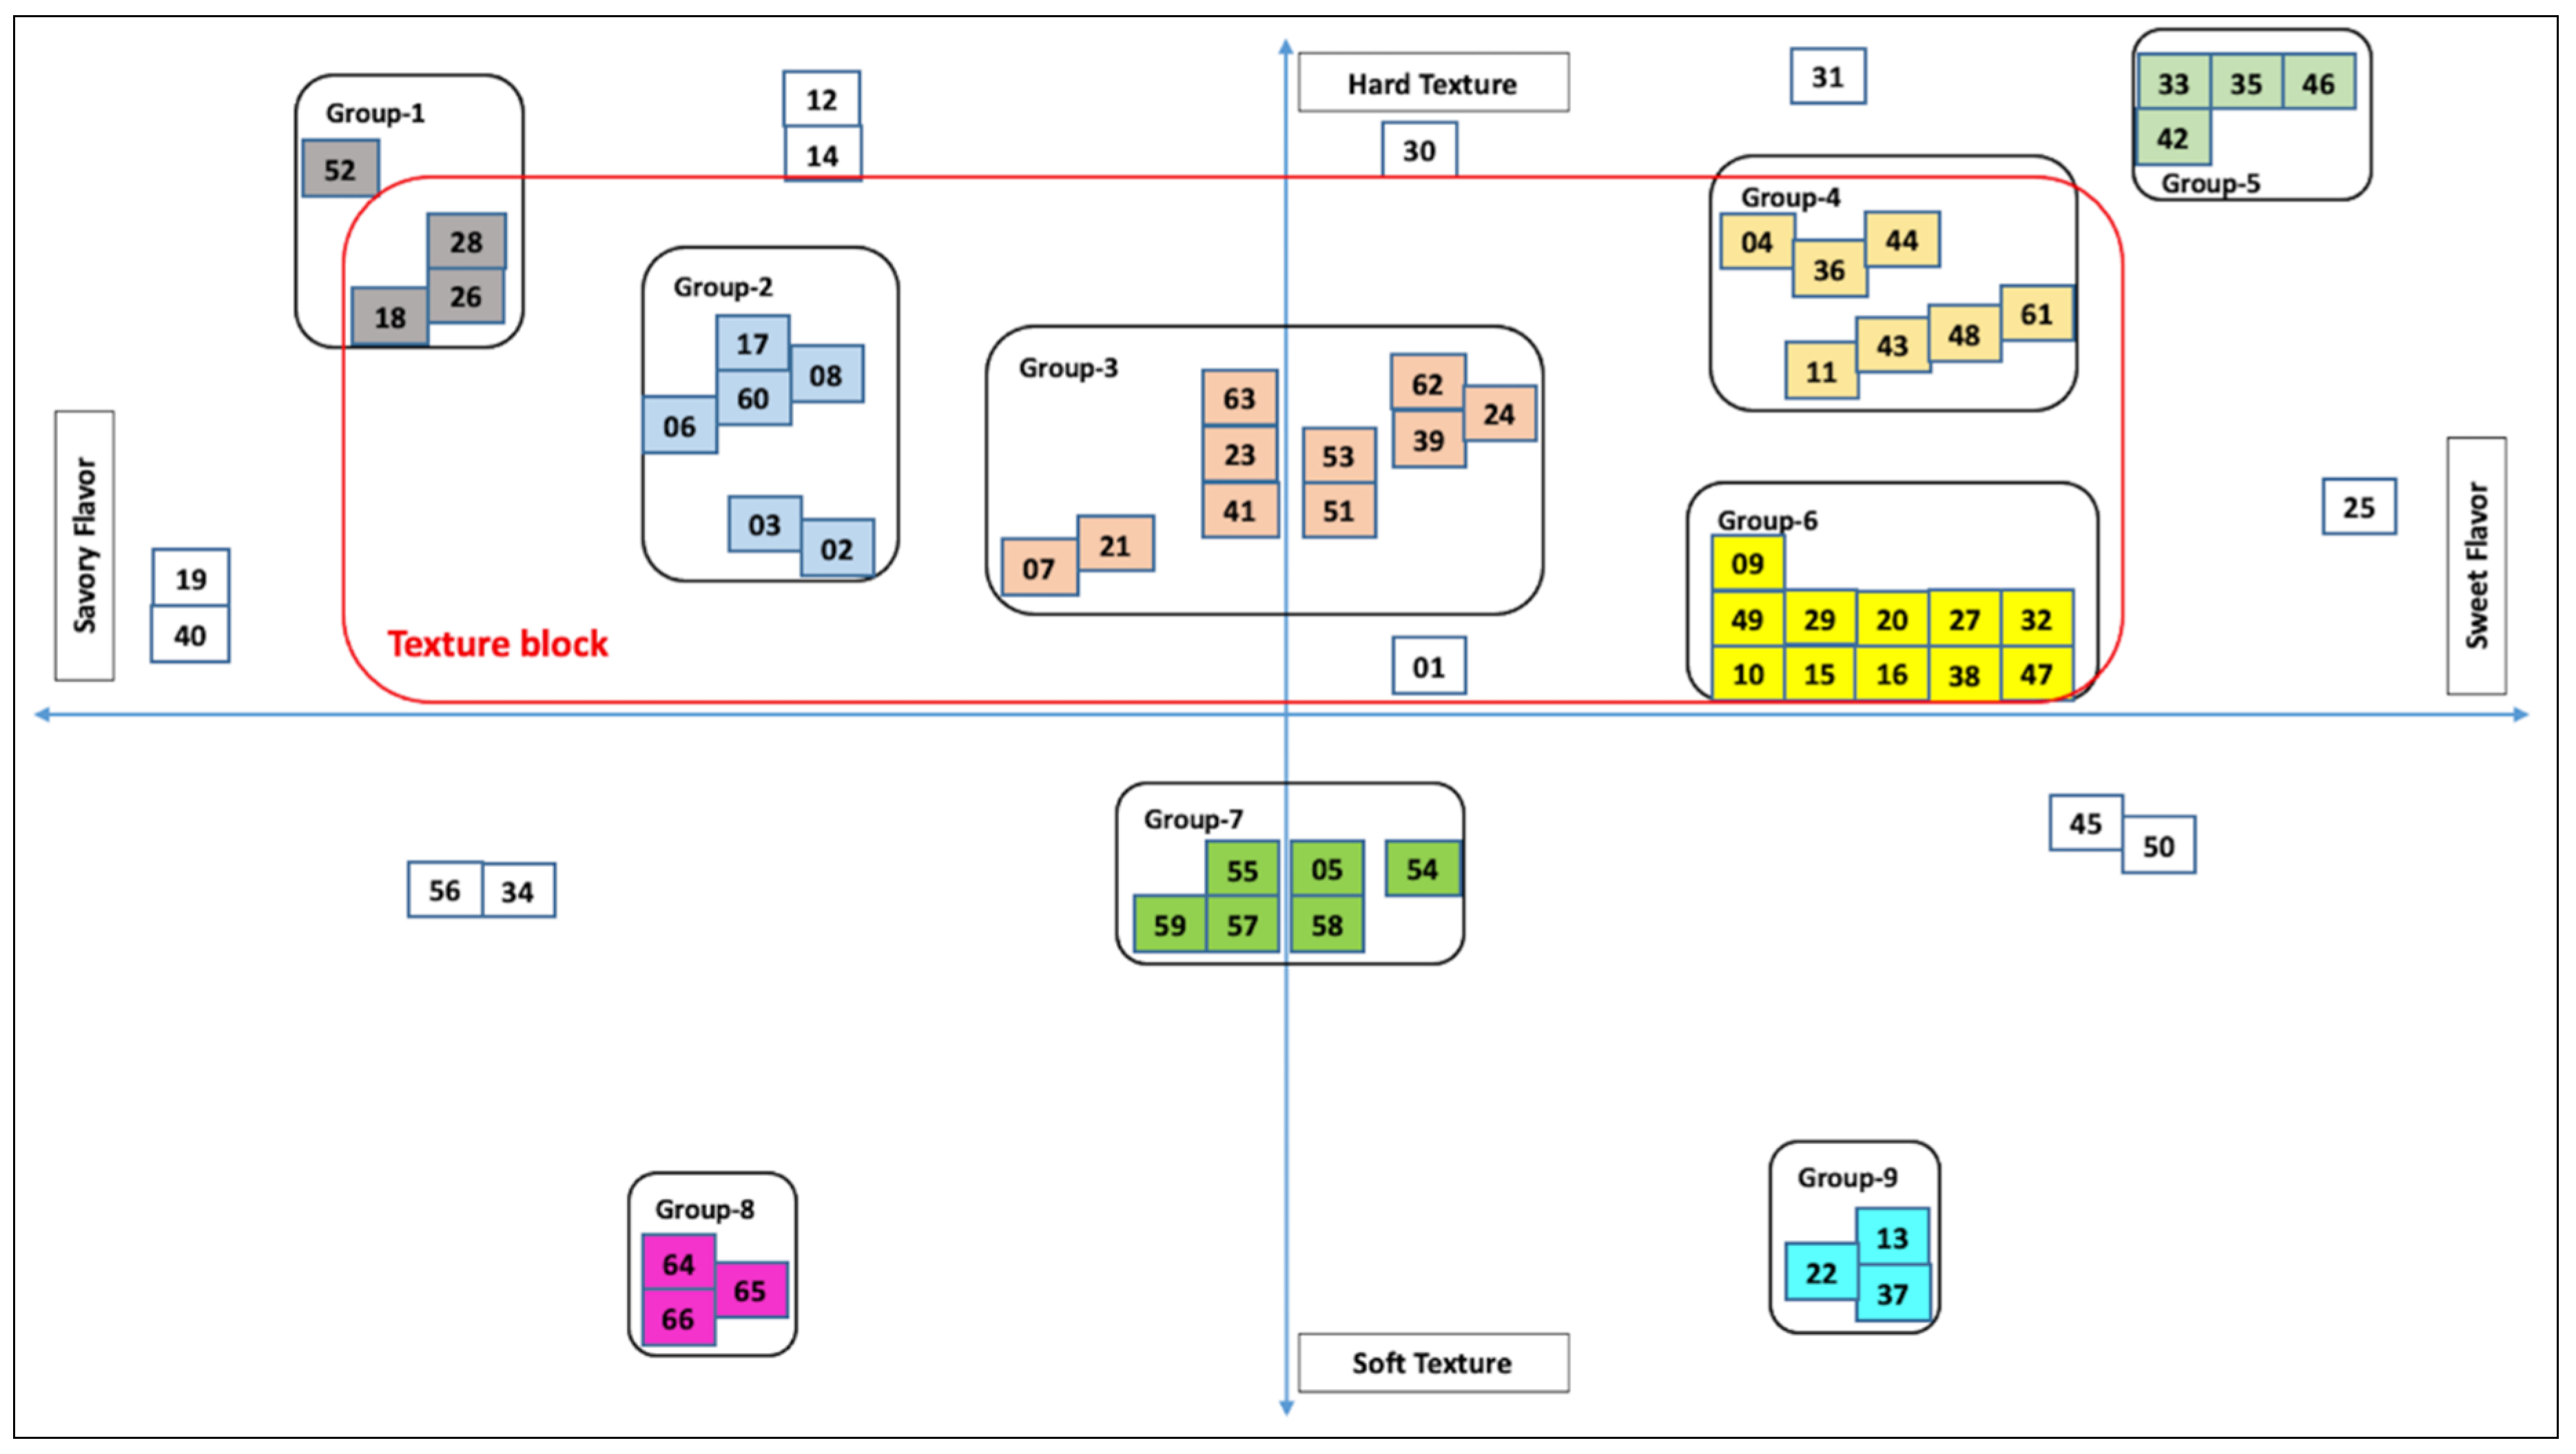
| Groups | Number of Snacks | Texture and Flavor | Snacks Type and Flavor | Examples Snacks Names |
|---|---|---|---|---|
| Group-1 | 4 | Extremely hard bite with an extremely strong savory flavor | Type—chips, sticks Flavor—savory, corn, garlic, seaweed | Binggre smoky bacon chip with spicy beef flavor, Brito’s snacks, Mexican taco chip, Mister free’d chia seed tortilla chips, Haitai spicy Rice cake sticks |
| Group-2 | 6 | Moderate hard bite with a mild savory flavor | Type—potato chips, fish chips Flavor—seaweed, chicken, crab, savory | Nong shim cuttlefish roasted butter chips, crab-shaped baked snack, Nongshim chicken leg snack, Nongshim potato chips, Pulmuone seaweed chips |
| Group-3 | 10 | Moderate hard bite with a bland or little sweet flavor | Type—chips, trail mix, crackers Flavor—soy, seaweed, bland, salt | Orion turtle chips, Peacock Seoul crispy rice chips, Pulmuone crispy seaweed snack, Soy Sauce Tempura Seaweed Snacks, Heyroo noodle snack, Prawn snack, Heyroo seaweed tofu snack, dried fish snack, Mum Mum rice rusks, ChungWoo Fermented Hardtack crackers, The Kims crispy laver chips |
| Group-4 | 7 | Moderate hard bite with a mildly sweet flavor | Type—nuts, chips, crackers, Flavor—squid, coffee, sweet | Orion squid flavored peanut balls, crunchy and tasty deep anchovy fried, Momali shinchon (crown) snack, Peacock Florentin coconut French dessert, Heyroo sweet popcorn kernel covered with sweet butter scent, coffee coated peanut, Nobrand coconut sticks |
| Group-5 | 4 | Extremely hard bite with an extremely sweet flavor | Type—puffs, chips Flavor—sweet, peanut | Nobrand seashell-shaped snack, Haitai matdongsan peanut crunch, Heyroo oranda snacks, Amigo chips |
| Group-6 | 11 | Slight hard bite with a mildly sweet flavor | Type—chips, sticks, crisps, crackers, rolls Flavor—sweet, rice, seaweed, fish | Fried butter potato chips, Orion potato sticks, Orion Gosomi Sweet Cookie Cracker, heyroo injeolmi traditional Rice Cake Snack Crispy Coated by Bean powder, Heyroo egg snacks, Shinhwa seasoned dried fish meat, Haitai calbee sweet potato chips, Crown rice crackers, Market O nature mushroom snack, Big roll grilled seaweed roll: classic flavor, Pulmuone snack chip |
| Group-7 | 6 | Slight soft bite with a bland or little sweet flavor | Type—sticks, chips, crisps Flavor—seaweed, sweet, sesame | Roasted sweet potato chew snack with pineapple flavor, coconut seaweed baby snack, seaweed snack with white sesame, The Kims crispy roasted laver chips, Team Korea crispy laver snack, K-fish seaweed chips |
| Group-8 | 3 | Very soft chewy texture with a mild savory flavor | Type—Jerky, dried meat Flavor—seafood and meat | Roast horse mackerel, baked cheese dried squid, hot pork jerky |
| Group-9 | 3 | Very soft texture with a mild to very sweet flavor | Type—grain bars, crisps Flavor—sweet, banana | Mybizcuit peanut crunchy bar, Premium Grain bars, Kiddylicious banana crispy |
Publisher’s Note: MDPI stays neutral with regard to jurisdictional claims in published maps and institutional affiliations. |
© 2021 by the authors. Licensee MDPI, Basel, Switzerland. This article is an open access article distributed under the terms and conditions of the Creative Commons Attribution (CC BY) license (http://creativecommons.org/licenses/by/4.0/).
Share and Cite
Kumar, R.; Chambers, E., IV; Chambers, D.H.; Lee, J. Generating New Snack Food Texture Ideas Using Sensory and Consumer Research Tools: A Case Study of the Japanese and South Korean Snack Food Markets. Foods 2021, 10, 474. https://doi.org/10.3390/foods10020474
Kumar R, Chambers E IV, Chambers DH, Lee J. Generating New Snack Food Texture Ideas Using Sensory and Consumer Research Tools: A Case Study of the Japanese and South Korean Snack Food Markets. Foods. 2021; 10(2):474. https://doi.org/10.3390/foods10020474
Chicago/Turabian StyleKumar, Rajesh, Edgar Chambers, IV, Delores H. Chambers, and Jeehyun Lee. 2021. "Generating New Snack Food Texture Ideas Using Sensory and Consumer Research Tools: A Case Study of the Japanese and South Korean Snack Food Markets" Foods 10, no. 2: 474. https://doi.org/10.3390/foods10020474