
Effects of Roasting Sweet Potato (Ipomoea batatas L. Lam.): Quality, Volatile Compound Composition, and Sensory Evaluation

 , ,
, ,
Abstract
:1. Introduction
2. Materials and Methods
2.1. Materials Preparation
2.2. Color Analysis
2.3. Quality Index
2.3.1. Total Starch Content
2.3.2. Sugar Composition
2.3.3. Total Acidity
2.4. GC/MS Analysis
2.5. Sensory Evaluation
2.6. Statistical Analysis
3. Results and Discussion
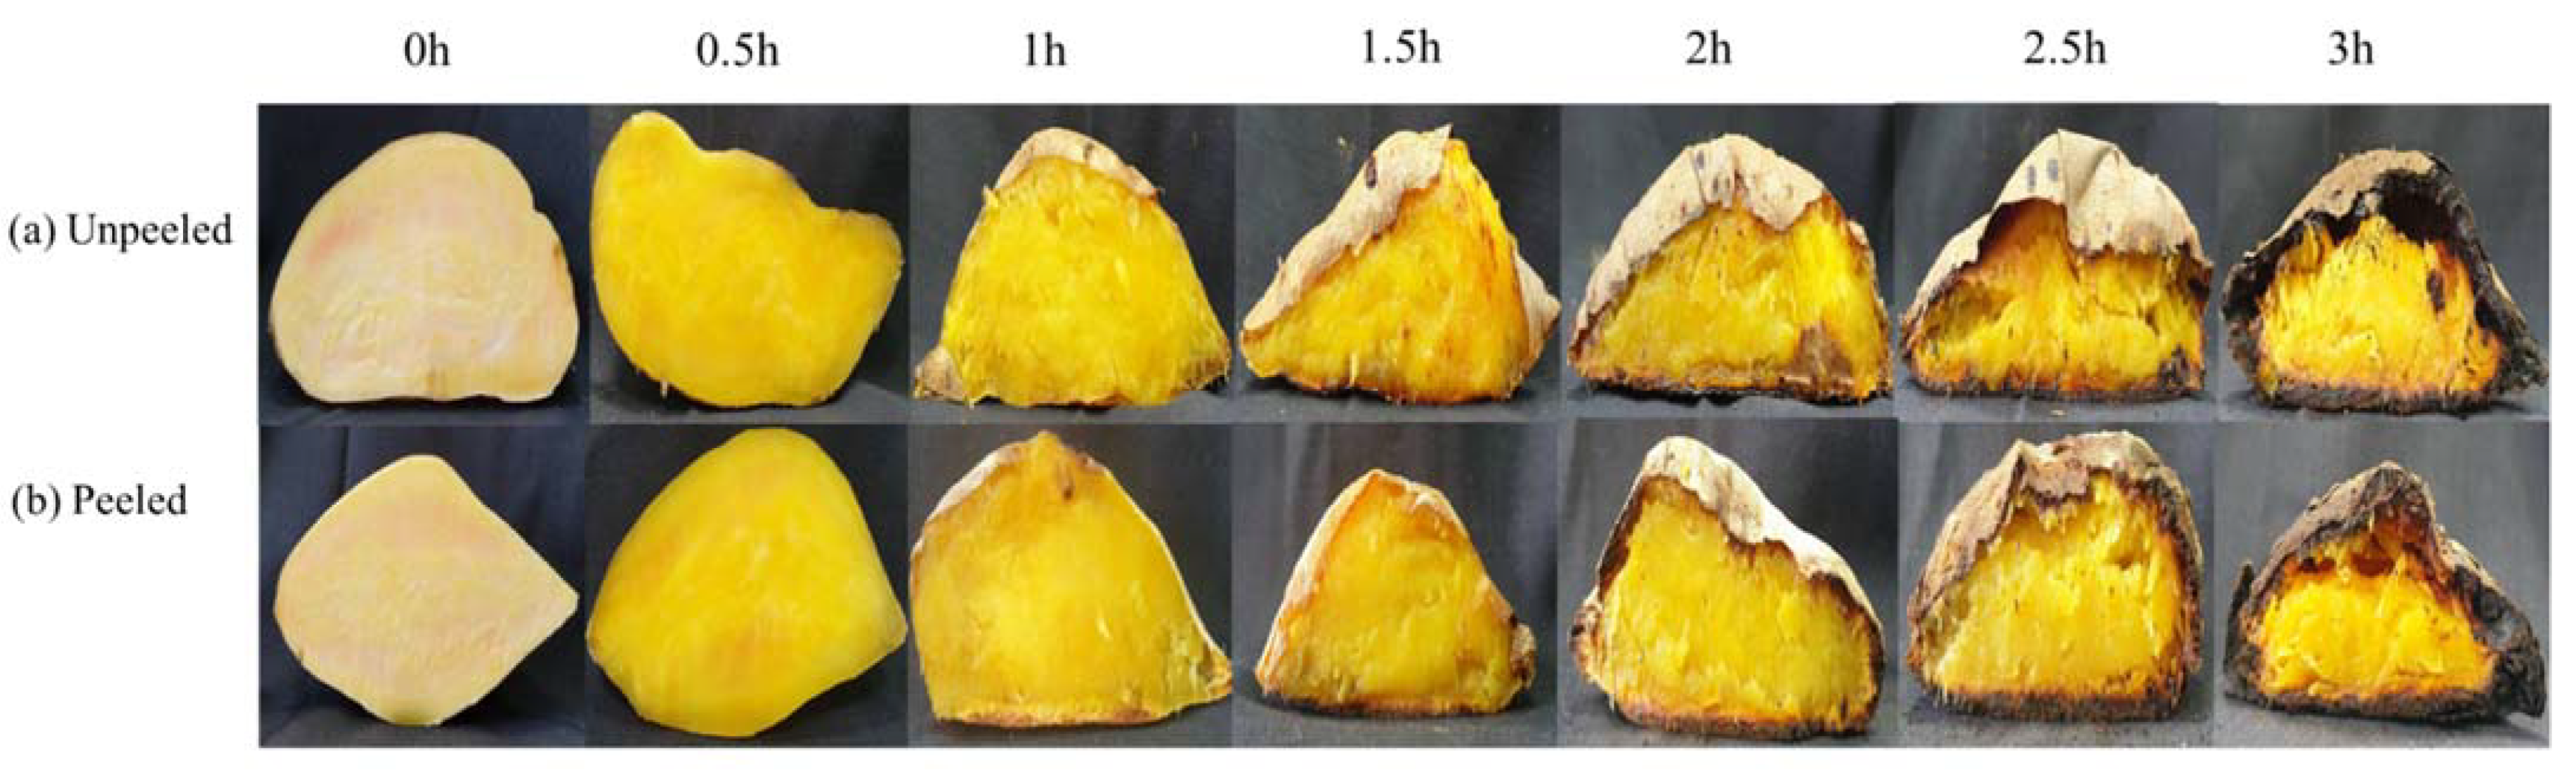
3.1. Appearance and Color Analysis
3.2. Quality Index
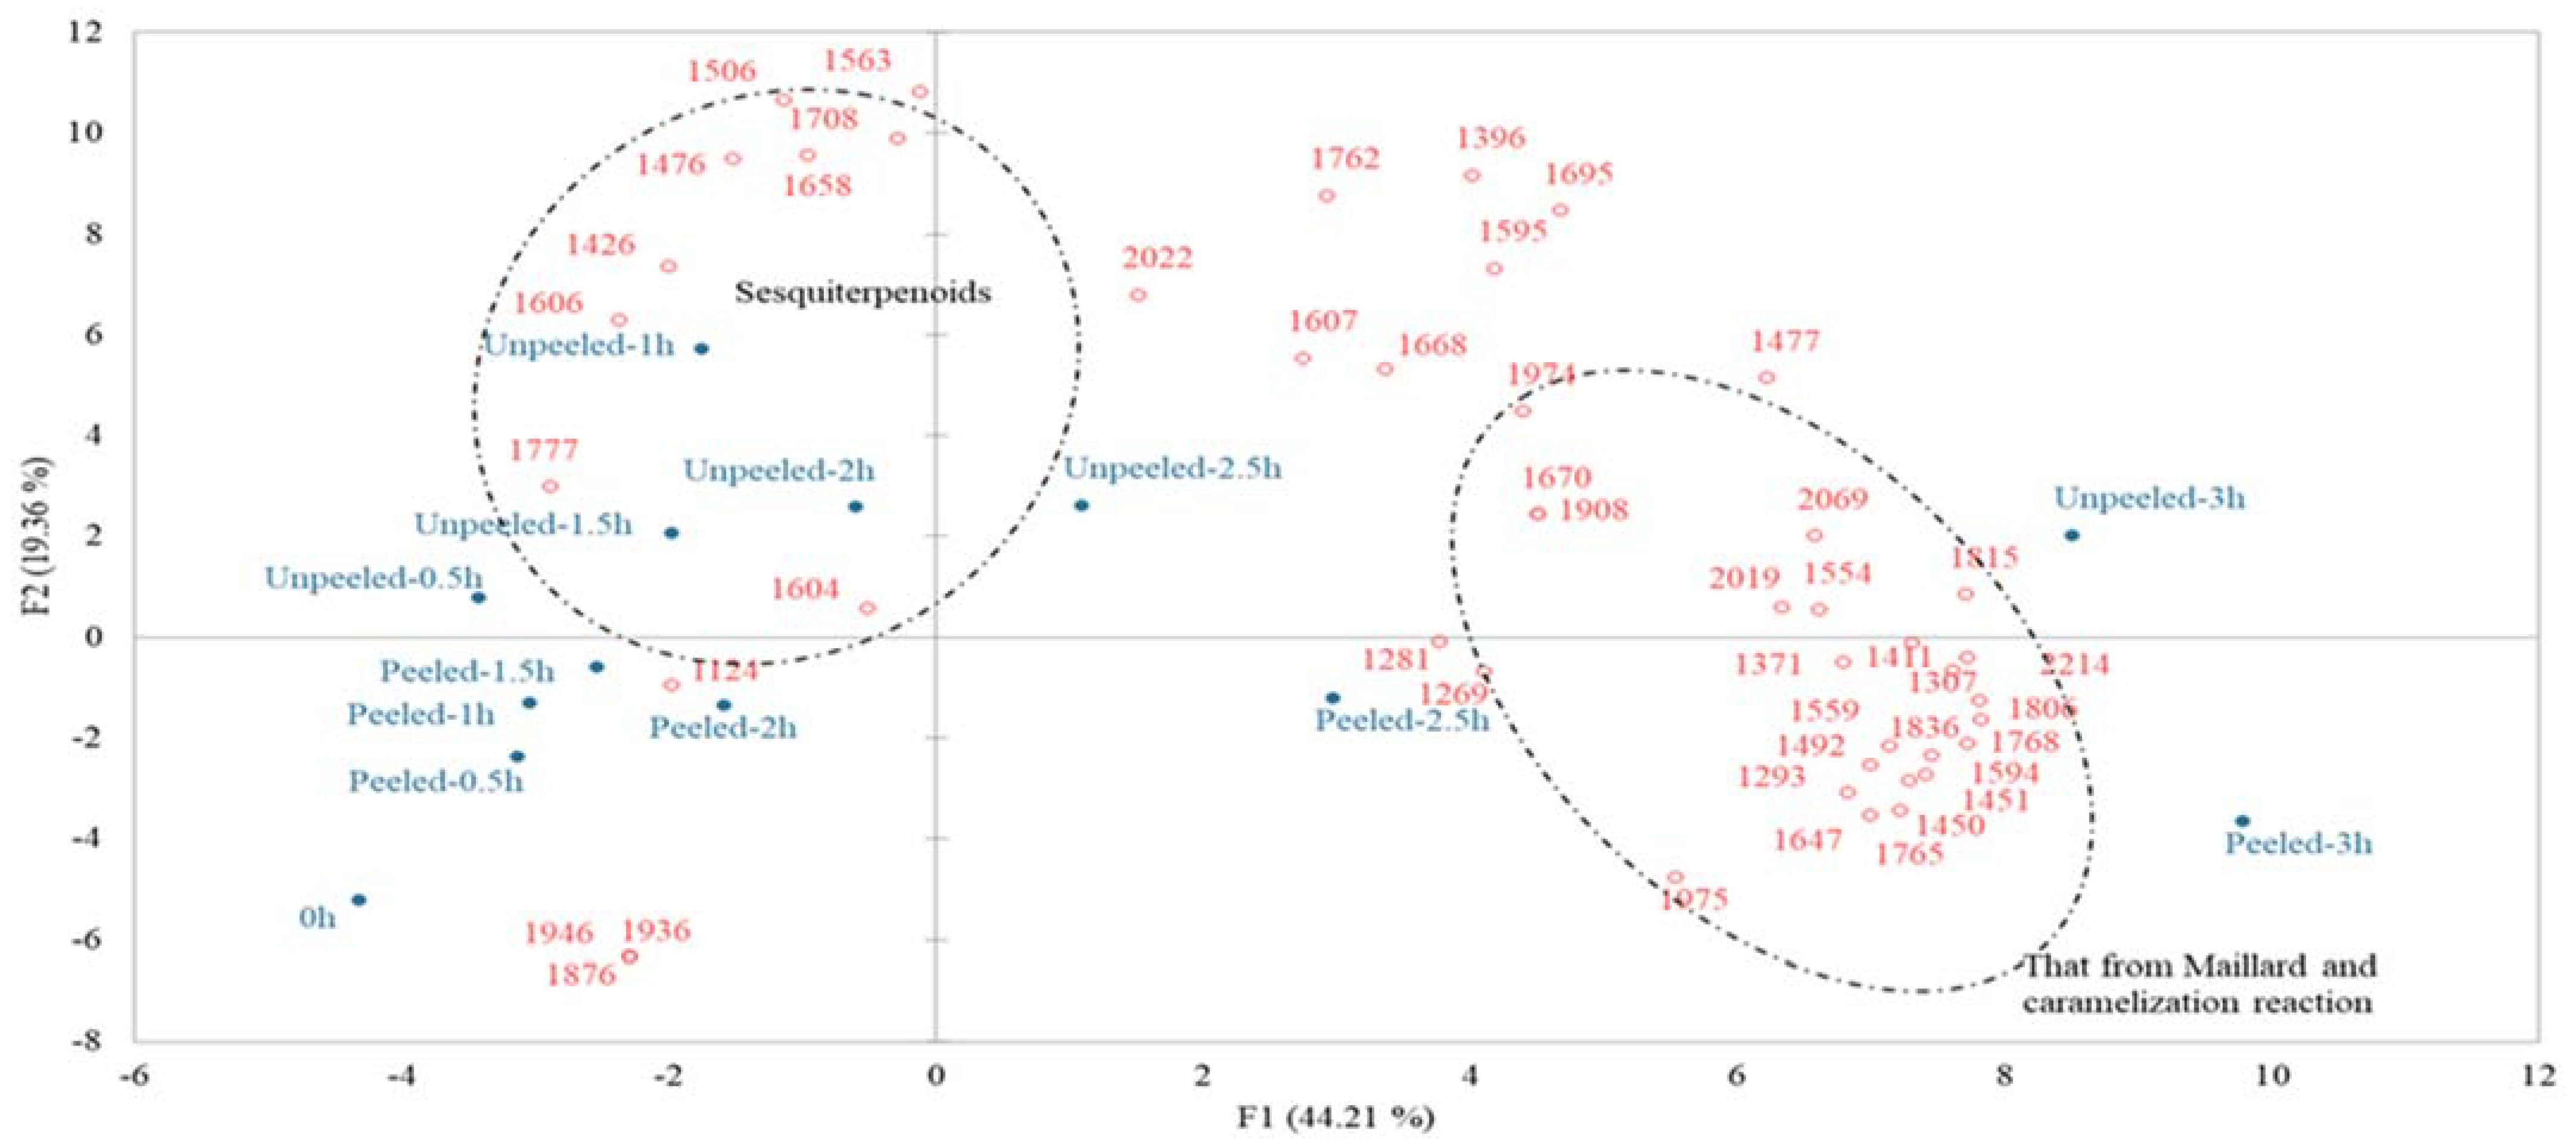
3.3. GC/MS Analysis
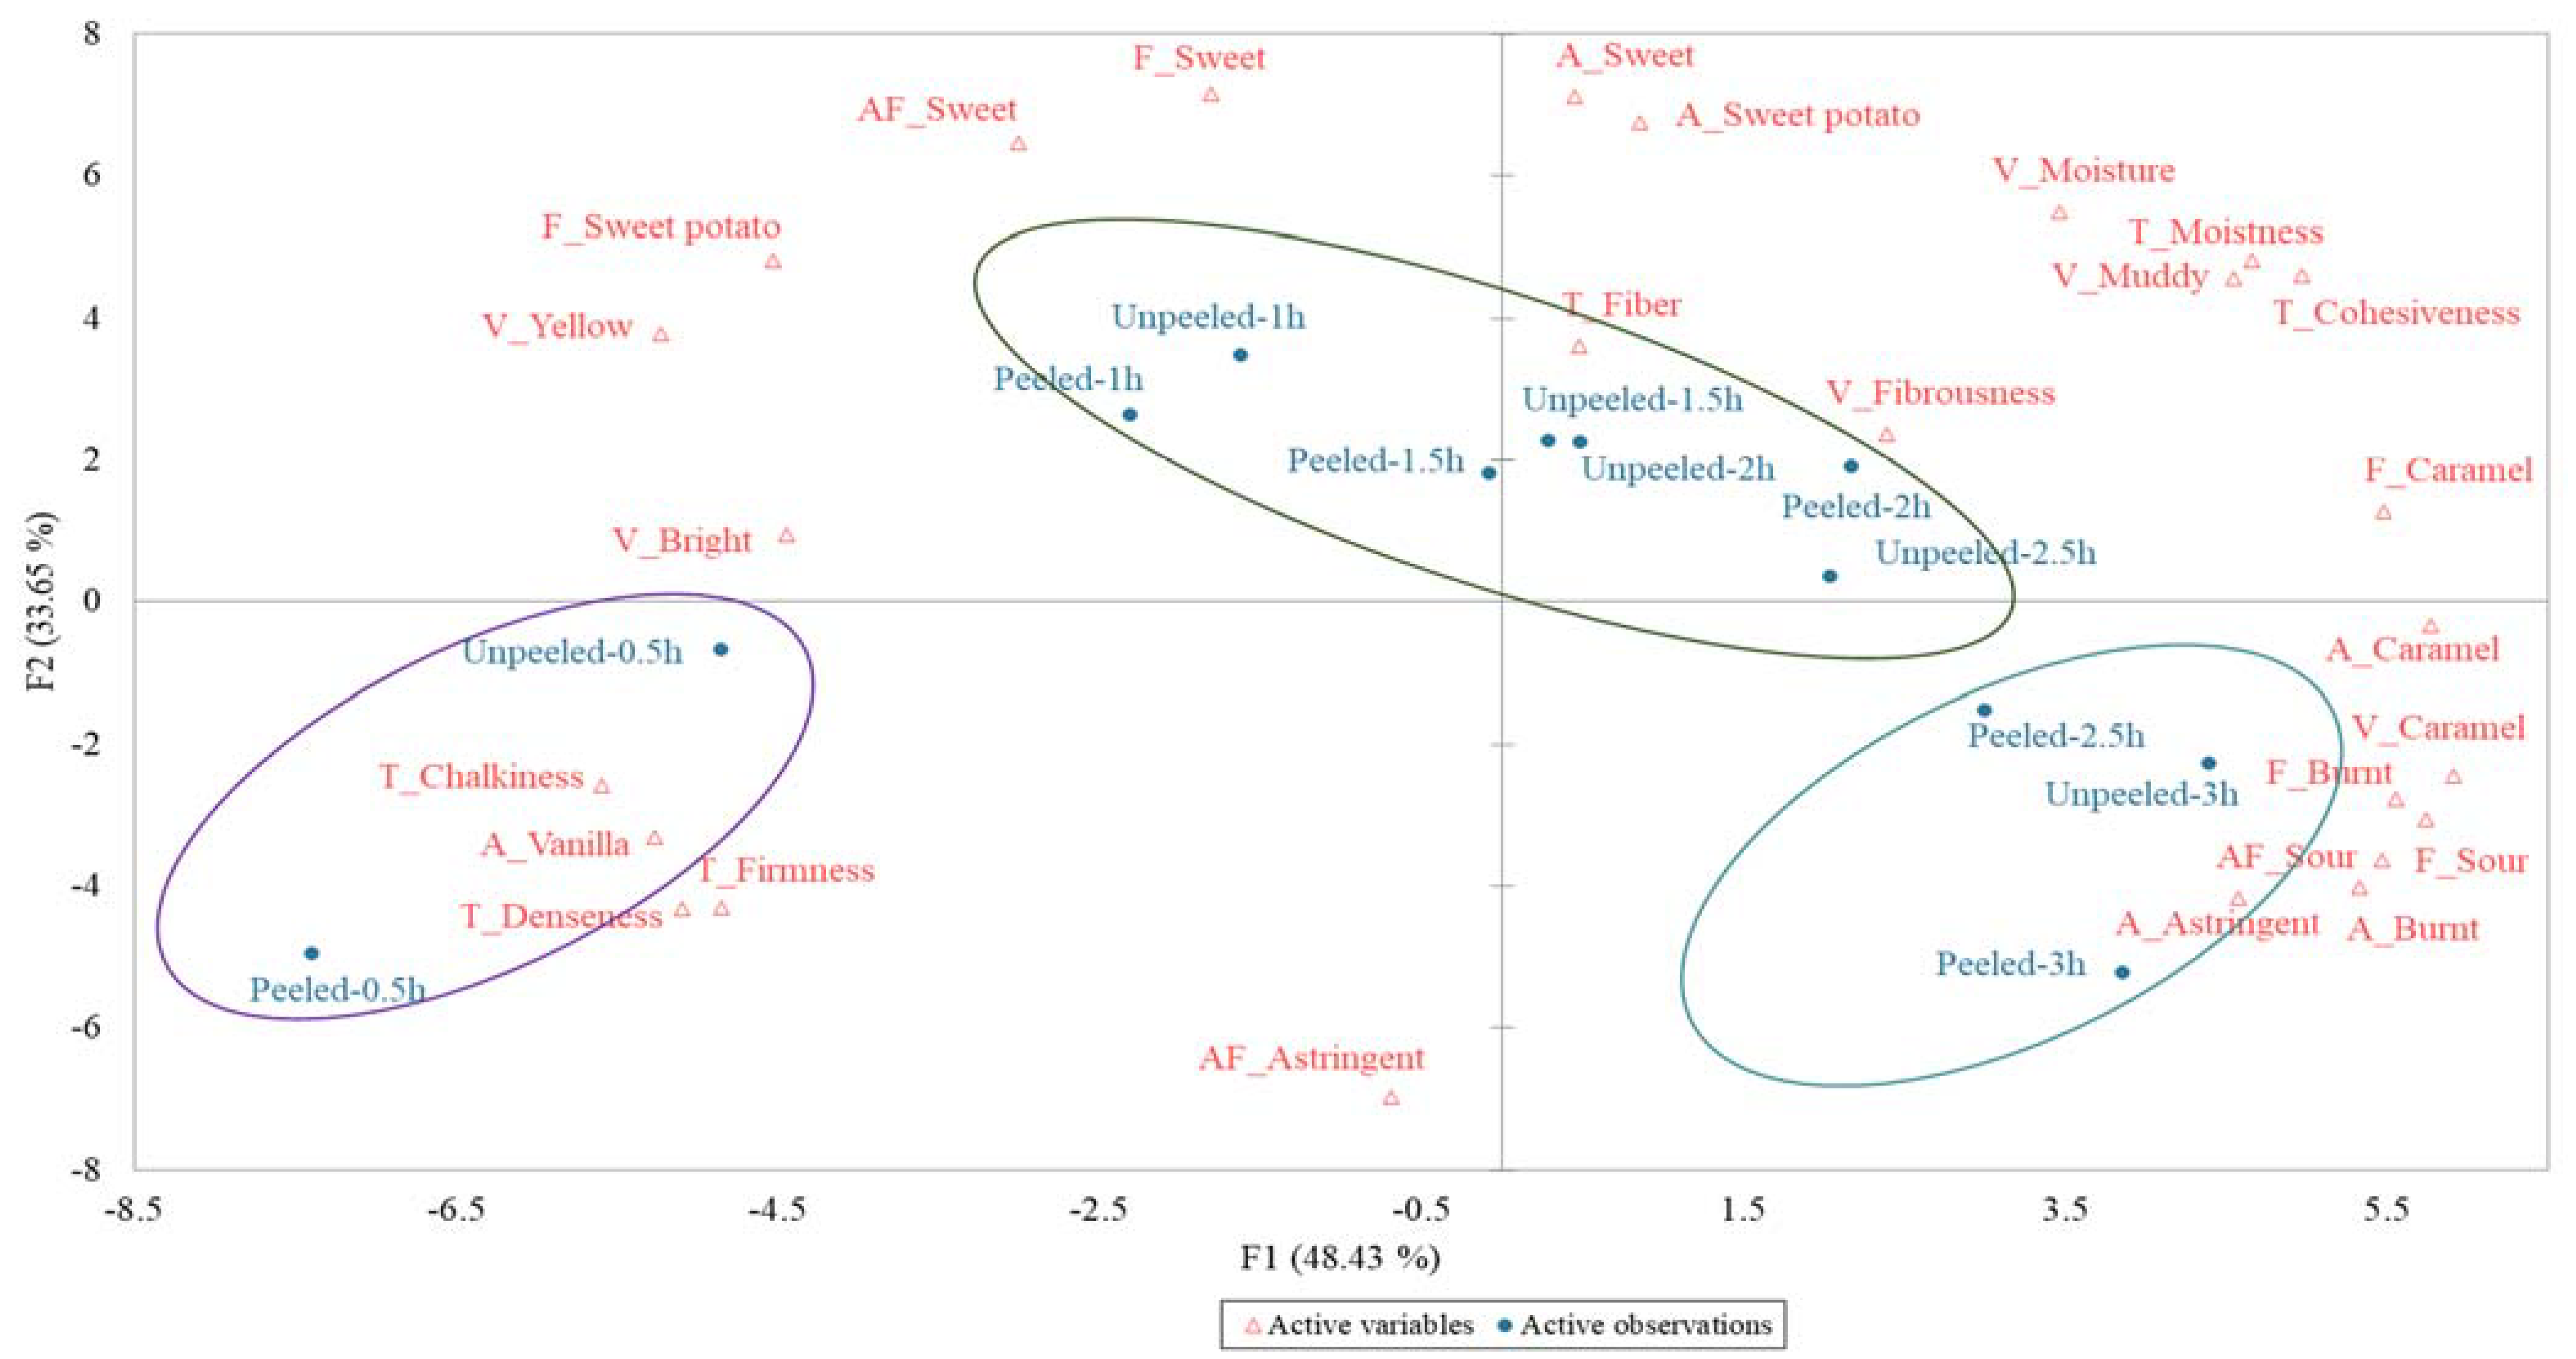
3.4. Sensory Evaluation
4. Conclusions
Author Contributions
Funding
Institutional Review Board Statement
Informed Consent Statement
Data Availability Statement
Acknowledgments
Conflicts of Interest
Appendix A

| Attribute | Description | |
|---|---|---|
| Visual | Yellow | Flesh that is yellow in colour. |
| Caramel | Appearance associated with brown sugar. | |
| Fibrousness | Amount of stringy fibers present. | |
| Moisture | Appearance that is moist. | |
| Muddy | Appearance that is muddy. | |
| Bright | Appearance that is bright. | |
| Aroma | Sweet | Aromatic like sugar. |
| Caramel | Aromatic associated with brown sugar. | |
| Sour | Aromatic associated with acid. | |
| Burnt | An aromatic associated with vegetables that were burnt while cooking. | |
| Sweet potato | Aromatic associated with cooked sweet potato of TNG57. | |
| Vanilla | Aromatic notes associated with damp soil, wet foliage or slightly undercooked potatoes. or In-mouth aromatic associated with vanilla and vanillin. | |
| Flavor | Sweet potato | Flavor notes associated with the taste of cooked TNG57. |
| Sweet | Tastes like sugar. | |
| Caramel | Flavor associated with brown sugar. | |
| Sour | Basic taste stimulated by acid. | |
| Burnt | The degree of browning or brown spots due to roasting. | |
| Texture | Moistness | The amount of moistness/wetness of the sample in the mouth. |
| Cohesiveness | Degree to which sample holds together after chewing. | |
| Denseness | The solidness/compactness of the sample. | |
| Firmness | Degree to which the sample retains its shape after lightly squeezing it. | |
| Chalkiness | Degree to which the mouth feels chalky, like raw potato, very fine particles, often perceived on the roof of the mouth. | |
| Fiber | The quality of being fibrous. | |
| Aftertaste | Sweet | An aftertaste that leaves a sweetness on the tongue and in the mouth that is pleasant. |
| Sour | Aftertaste associated with brown sugar. | |
| Astringent | Sensation of drying, drawing and/or puckering of any of the mouth surfaces. | |
References
- Teow, C.C.; Truong, V.D.; McFeeters, R.F.; Thompson, R.L.; Pecota, K.V.; Yencho, G.C. Antioxidant activities, phenolic and β-carotene contents of sweet potato genotypes with varying flesh colours. Food Chem. 2007, 103, 829–838. [Google Scholar] [CrossRef]
- Blessington, T.; Nzaramba, M.N.; Scheuring, D.C.; Hale, A.L.; Reddivari, L.; Miller, J.C. Cooking methods and storage treatments of potato: Effects on carotenoids, antioxidant activity, and phenolics. Am. J. Potato Res. 2010, 87, 479–491. [Google Scholar] [CrossRef]
- Sablani, S.; Marcotte, M.; Baik, O.; Castaigne, F. Modeling of simultaneous heat and water transport in the baking process. LWT 1998, 31, 201–209. [Google Scholar] [CrossRef]
- Wang, Y.; Kays, S. Contribution of Volatile Compounds to the Characteristic Aroma of BakedJewel’Sweetpotatoes. J. Am. Soc. Hortic. Sci. 2000, 125, 638–643. [Google Scholar] [CrossRef] [Green Version]
- Corrales, C.V.; Lebrun, M.; Vaillant, F.; Madec, M.N.; Lortal, S.; Pérez, A.M.; Fliedel, G. Key odor and physicochemical characteristics of raw and roasted jicaro seeds (Crescentia alata KHB). Food Res. Int. 2017, 96, 113–120. [Google Scholar] [CrossRef] [PubMed]
- Staatz, J.; Hollinger, F. West African Food Systems and Changing Consumer Demands; FAO: Rome, Italy, 2016. [Google Scholar]
- Shi, X.; Dean, L.O.; Davis, J.P.; Sandeep, K.P.; Sanders, T.H. The effects of different dry roast parameters on peanut quality using an industrial belt-type roaster simulator. Food Chem. 2018, 240, 974–979. [Google Scholar] [CrossRef] [PubMed]
- Hou, F.; Mu, T.; Ma, M.; Blecker, C. Sensory evaluation of roasted sweet potatoes influenced by different cultivars: A correlation study with respect to sugars, amino acids, volatile compounds, and colors. J. Food Process. Preserv. 2020, 44, e14646. [Google Scholar] [CrossRef]
- Leksrisompong, P.P.; Whitson, M.E.; Truong, V.D.; Drake, M.A. Sensory attributes and consumer acceptance of sweet potato cultivars with varying flesh colors. J. Sens. Stud. 2012, 27, 59–69. [Google Scholar] [CrossRef]
- Ofori, G.; Oduro, I.; Ellis, W.O.; Dapaah, K.H. Assessment of vitamin A content and sensory attributes of new sweet potato (Ipomoea batatas) genotypes in Ghana. Afr. J. Food Sci. 2009, 3, 184–192. [Google Scholar]
- Leighton, C.S.; Schönfeldt, H.C.; Kruger, R. Quantitative descriptive sensory analysis of five different cultivars of sweet potato to determine sensory and textural profiles. J. Sens. Stud. 2010, 25, 2–18. [Google Scholar] [CrossRef] [Green Version]
- Vizzotto, M.; Pereira, E.D.S.; Vinholes, J.R.; Munhoz, P.C.; Ferri, N.M.L.; Castro, L.A.S.D.; Krolow, A.C.R. Physicochemical and antioxidant capacity analysis of colored sweet potato genotypes: In natura and thermally processed. Cienc. Rural 2017, 47. [Google Scholar] [CrossRef] [Green Version]
- Isleroglu, H.; Kemerli, T.; Sakin-Yilmazer, M.; Guven, G.; Ozdestan, O.; Uren, A.; Kaymak-Ertekin, F. Effect of steam baking on acrylamide formation and browning kinetics of cookies. J. Food Sci. 2012, 77, E257–E263. [Google Scholar] [CrossRef]
- Liu, Y.; Sabboh, H.; Kirchhof, G.; Sopade, P. In vitro starch digestion and potassium release in sweet potato from Papua New Guinea. Int. J. Food Sci. Technol. 2010, 45, 1925–1931. [Google Scholar] [CrossRef]
- Chan, C.F.; Chiang, C.M.; Lai, Y.C.; Huang, C.L.; Kao, S.C.; Liao, W.C. Changes in sugar composition during baking and their effects on sensory attributes of baked sweet potatoes. J. Food Sci. Technol. 2014, 51, 4072–4077. [Google Scholar] [CrossRef] [Green Version]
- Picha, D.H. HPLC determination of sugars in raw and baked sweet potatoes. J. Food Sci. 1985, 50, 1189–1190. [Google Scholar] [CrossRef]
- Horwitz, W. Official Methods of Analysis; Association of Official Analytical Chemists: Washington, DC, USA, 2020; Volume 222. [Google Scholar]
- Liu, S.L.; Jaw, Y.M.; Wang, L.F.; Chuang, G.C.C.; Zhuang, Z.Y.; Chen, Y.S.; Liou, B.K. Evaluation of Sensory Quality for Taiwanese Specialty Teas with Cold Infusion Using CATA and Temporal CATA by Taiwanese Consumers. Foods 2021, 10, 2344. [Google Scholar] [CrossRef]
- Dery, E.K.; Carey, E.E.; Ssali, R.T.; Low, J.W.; Johanningsmeier, S.D.; Oduro, I.; Boakye, A.; Omodamiro, R.M.; Yusuf, H.L. Sensory characteristics and consumer segmentation of fried sweetpotato for expanded markets in Africa. Int. J. Food Sci. Technol. 2021, 56, 1419–1431. [Google Scholar] [CrossRef] [PubMed]
- van Oirschot, Q.E.; Rees, D.; Aked, J. Sensory characteristics of five sweet potato cultivars and their changes during storage under tropical conditions. Food Qual. Prefer. 2003, 14, 673–680. [Google Scholar] [CrossRef]
- Trugo, L.C.; Macrae, R. An investigation of coffee roasting using high performance gel filtration chromatography. Food Chem. 1986, 19, 1–9. [Google Scholar] [CrossRef]
- Clydesdale, F.M. Changes in color and flavor and their effect on sensory perception in the elderly. Nutr. Rev. 1994, 52, S19. [Google Scholar] [CrossRef]
- Chung, H.S.; Kim, D.H.; Youn, K.S.; Lee, J.B.; Moon, K.D. Optimization of roasting conditions according to antioxidant activity and sensory quality of coffee brews. Food Sci. Biotechnol. 2013, 22, 23–29. [Google Scholar] [CrossRef]
- Mccleary, B.V.; Gibson, T.S.; Mugford, D.C. Measurement of total starch in cereal products by amyloglucosidase-α-amylase method: Collaborative study. J. AOAC Int. 1997, 80, 571–579. [Google Scholar] [CrossRef] [Green Version]
- Trancoso-Reyes, N.; Ochoa-Martínez, L.A.; Bello-Pérez, L.A.; Morales-Castro, J.; Estévez-Santiago, R.; Olmedilla-Alonso, B. Effect of pre-treatment on physicochemical and structural properties, and the bioaccessibility of β-carotene in sweet potato flour. Food Chem. 2016, 200, 199–205. [Google Scholar] [CrossRef] [Green Version]
- Lai, Y.C.; Huang, C.L.; Chan, C.F.; Lien, C.Y.; Liao, W.C. Studies of sugar composition and starch morphology of baked sweet potatoes (Ipomoea batatas (L.) Lam). J. Food Sci. Technol. 2013, 50, 1193–1199. [Google Scholar] [CrossRef] [PubMed] [Green Version]
- Binner, S.; Jardine, W.G.; Renard, C.M.C.G.; Jarvis, M.C. Cell wall modifications during cooking of potatoes and sweet potatoes. J. Sci. Food Agric. 2000, 80, 216–218. [Google Scholar] [CrossRef]
- Caetano, P.K.; Mariano-nasser, F.A.D.C.; MendonÇa, V.Z.D.; Furlaneto, K.A.; Daiuto, E.R.; Vieites, R.L. Physicochemical and sensory characteristics of sweet potato chips undergoing different cooking methods. Food Sci. Technol. 2017, 38, 434–440. [Google Scholar] [CrossRef] [Green Version]
- Ogliari, R.; Soares, J.M.; Teixeira, F.; Schwarz, K.; da Silva, K.A.; Schiessel, D.L.; Novello, D. Chemical, nutritional and sensory characterization of sweet potato submitted to different cooking methods. Int. J. Res.-Granthaalayah 2020, 8, 147–156. [Google Scholar] [CrossRef]
- Sohail, M.; Khan, R.U.; Afridi, S.R.; Imad, M.; Mehrin, B. Preparation and quality evaluation of sweet potato ready to drink beverage. ARPN J. Agric. Biol. Sci. 2013, 8, 279–282. [Google Scholar]
- Sun, J.B.; Severson, R.F.; Schlotzhauer, W.S.; Kays, S.J. Identifying Critical Volatiles in the Flavor of BakedJewel’Sweetpotatoes [Ipomoea batatas (L.) Lam.]. J. Am. Soc. Hortic. Sci. 1995, 120, 468–474. [Google Scholar] [CrossRef]
- Chen, M.X.; Chen, X.S.; Wang, X.G.; Ci, Z.J.; Liu, X.L.; He, T.M.; Zhang, L.J. Comparison of headspace solid-phase microextraction with simultaneous steam distillation extraction for the analysis of the volatile constituents in Chinese apricot. Agric. Sci. China 2006, 5, 879–884. [Google Scholar] [CrossRef]
- Zhou, Y.; Zeng, L.; Liu, X.; Gui, J.; Mei, X.; Fu, X.; Dong, F.; Tang, J.; Zhang, L.; Yang, Z. Formation of (E)-nerolidol in tea (Camellia sinensis) leaves exposed to multiple stresses during tea manufacturing. Food Chem. 2017, 231, 78–86. [Google Scholar] [CrossRef] [PubMed]
- Ho, C.T.; Zheng, X.; Li, S. Tea aroma formation. Food Sci. Hum. Wellness 2015, 4, 9–27. [Google Scholar] [CrossRef] [Green Version]
- Ravichandran, R. Carotenoid composition, distribution and degradation to flavour volatiles during black tea manufacture and the effect of carotenoid supplementation on tea quality and aroma. Food Chem. 2002, 78, 23–28. [Google Scholar] [CrossRef]
- Bi, S.; Xu, X.; Luo, D.; Lao, F.; Pang, X.; Shen, Q.; Hu, X.; Wu, J. Characterization of key aroma compounds in raw and roasted peas (Pisum sativum L.) by application of instrumental and sensory techniques. J. Agric. Food Chem. 2020, 68, 2718–2727. [Google Scholar] [CrossRef] [PubMed]
- Perez Locas, C.; Yaylayan, V.A. Isotope labeling studies on the formation of 5-(hydroxymethyl)-2-furaldehyde (HMF) from sucrose by pyrolysis-GC/MS. J. Agric. Food Chem. 2008, 56, 6717–6723. [Google Scholar] [CrossRef] [PubMed]
- Liu, J.; Wan, P.; Xie, C.; Chen, D.W. Key aroma-active compounds in brown sugar and their influence on sweetness. Food Chem. 2021, 345, 128826. [Google Scholar] [CrossRef]
- Pu, D.; Zhang, H.; Zhang, Y.; Sun, B.; Ren, F.; Chen, H. Characterization of the key aroma compounds in white bread by aroma extract dilution analysis, quantitation, and sensory evaluation experiments. J. Food Process. Preserv. 2019, 43, e13933. [Google Scholar] [CrossRef]
- Samborska, K.; Bonikowski, R.; Kalemba, D.; Barańska, A.; Jedlińska, A.; Edris, A. Volatile aroma compounds of sugarcane molasses as affected by spray drying at low and high temperature. LWT 2021, 145, 111288. [Google Scholar] [CrossRef]
- Qin, G.; Tao, S.; Cao, Y.; Wu, J.; Zhang, H.; Huang, W.; Zhang, S. Evaluation of the volatile profile of 33 Pyrus ussuriensis cultivars by HS-SPME with GC–MS. Food Chem. 2012, 134, 2367–2382. [Google Scholar] [CrossRef] [PubMed]
- Kang, W.; Li, Y.; Xu, Y.; Jiang, W.; Tao, Y. Characterization of aroma compounds in Chinese bayberry (Myrica rubra Sieb. et Zucc.) by gas chromatography mass spectrometry (GC-MS) and olfactometry (GC-O). J. Food Sci. 2012, 77, C1030–C1035. [Google Scholar] [CrossRef]
- Cheng, H.; Qin, Z.H.; Guo, X.F.; Hu, X.S.; Wu, J.H. Geographical origin identification of propolis using GC–MS and electronic nose combined with principal component analysis. Food Res. Int. 2013, 51, 813–822. [Google Scholar] [CrossRef]
- Yuan, F.; Qian, M.C. Aroma potential in early-and late-maturity Pinot noir grapes evaluated by aroma extract dilution analysis. J. Agric. Food Chem. 2016, 64, 443–450. [Google Scholar] [CrossRef] [PubMed]
- Zhou, H.; Luo, D.; Gholamhosseini, H.; Li, Z.; Han, B.; He, J.; Wang, S. Aroma characteristic analysis of Amomi fructus from different habitats using machine olfactory and gas chromatography-mass spectrometry. Pharmacogn. Mag. 2019, 15, 392. [Google Scholar]
- King, S.C.; Meiselman, H.L.; Carr, B.T. Measuring emotions associated with foods in consumer testing. Food Qual. Prefer. 2010, 21, 1114–1116. [Google Scholar] [CrossRef]
- Taş, N.G.; Gökmen, V. Maillard reaction and caramelization during hazelnut roasting: A multiresponse kinetic study. Food Chem. 2017, 221, 1911–1922. [Google Scholar]
- Lund, M.N.; Ray, C.A. Control of Maillard reactions in foods: Strategies and chemical mechanisms. J. Agric. Food Chem. 2017, 65, 4537–4552. [Google Scholar] [CrossRef] [PubMed] [Green Version]
- Guo, S.; Jom, K.N.; Ge, Y. Influence of roasting condition on flavor profile of sunflower seeds: A flavoromics approach. Sci. Rep. 2019, 9, 1–10. [Google Scholar] [CrossRef] [PubMed] [Green Version]
- Komaki, T.; Taji, N. Studies on Enzymatic Liquefaction and Saccharification of Starch: Part VIII. Liquefying Conditions of Corn Starch by Bacterial Alpha-Amylase. Agric. Biol. Chem. 1968, 32, 860–872. [Google Scholar] [CrossRef] [Green Version]


| Time | L* | a* | b* | B.I. | ||||
|---|---|---|---|---|---|---|---|---|
| (h) | Unpeeled | Peeled | Unpeeled | Peeled | Unpeeled | Peeled | Unpeeled | Peeled |
| 0 | 70.35 ± 0.27 gA | 67.50 ± 0.33 fA | 4.40 ± 0.16 cA | 5.51 ± 0.08 dA | 28.99 ±0.12 eA | 30.84 ± 0.41 eA | 56.38 ± 0.62 aA | 65.30 ± 1.06 aA |
| 0.5 | 49.90 ± 0.16 eB | 47.33 ± 0.23 cA | 1.65 ± 0.07 aA | 3.33 ± 0.35 cB | 27.94 ± 0.15 dB | 26.90 ± 0.41 bA | 80.39 ± 0.29 bA | 85.08 ± 1.80 bB |
| 1 | 50.83 ± 0.38 fB | 49.85 ± 0.83 eA | 1.47 ± 0.10 aB | 0.54 ± 0.26 aA | 29.83 ± 0.19 eA | 29.91 ± 0.28 fA | 85.55 ± 0.60 cA | 86.77 ± 1.43 bA |
| 1.5 | 45.16 ± 0.59 dA | 48.73 ± 0.67 dB | 3.27 ± 0.62 bB | 2.22 ± 0.30 bA | 26.58 ± 0.39 cA | 30.45 ± 0.33 gB | 89.43 ± 1.63 dA | 95.01 ± 1.96 cB |
| 2 | 39.62 ± 0.37 aA | 41.14 ± 0.22 aB | 5.98 ± 0.29 dA | 6.10 ± 0.51 eB | 23.54 ± 0.20 aA | 25.81 ± 0.18 aB | 96.92 ± 0.37 eA | 103.69 ± 2.03 dB |
| 2.5 | 42.23 ± 0.61 cA | 42.76 ± 0.44 bA | 7.63 ± 0.11 eB | 7.06 ± 0.32 fA | 25.25 ± 0.65 bA | 26.26 ± 0.32 bB | 104.17 ± 2.73 fA | 108.07 ± 0.64 dA |
| 3 | 40.98 ± 3.03 bA | 44.62 ± 1.08 aA | 8.10 ± 0.15 fB | 7.52 ± 0.23 gA | 22.08 ± 0.87 cA | 27.60 ± 0.46 dB | 106.32 ± 4.74 fA | 103.34 ± 1.25 eA |
| Time | Total Starch | Fructose | Glucose | Sucrose | Maltose | Total Titratable Acidity | ||||||
|---|---|---|---|---|---|---|---|---|---|---|---|---|
| (h) | (g/100 g) | (g/100 g, DW) | (g/100 g, DW) | (g/100 g, DW) | (g/100 g, DW) | (g/100 g, DW) | ||||||
| Type | Unpeeled | Peeled | Unpeeled | Peeled | Unpeeled | Peeled | Unpeeled | Peeled | Unpeeled | Peeled | Unpeeled | Peeled |
| 0 | 64.62 ± 0.46 d | 64.62 ± 0.46 d | 1.60 ± 0.29 a | 1.82 ± 0.24 ab | 2.23 ± 0.10 a | 2.60 ± 0.18 a | 11.49 ± 0.02 c | 12.68 ± 1.10 a | ND | ND | 0.14 ± 0.01 b | 0.14 ± 0.01 abc |
| 0.5 | 50.57 ± 0.13 a | 51.84 ± 0.06 a | 1.70 ± 0.06 a | 1.56 ± 0.12 a | 2.54 ± 0.02 ab | 2.62 ± 0.05 ab | 10.63 ± 0.21 ab | 11.12 ± 0.46 a | 41.45 ± 0.45 a | 45.92 ± 2.21 a | 0.11 ± 0.01 a | 0.09 ± 0.01 a |
| 1 | 53.36 ± 0.06 c | 53.94 ± 0.57 c | 1.87 ± 0.06 ab * | 1.97 ± 0.26 ab * | 2.61 ± 0.00 ab | 3.19 ± 0.43 cd | 11.66 ± 0.34 bc | 11.79 ± 0.69 a | 39.04 ± 0.16 a * | 52.70 ± 2.69 ab * | 0.11 ± 0.01 a | 0.11 ± 0.01 ab |
| 1.5 | 52.28 ± 0.03 b | 53.38 ± 0.42 bc | 2.39 ± 0.01 c * | 2.13 ± 0.26 b * | 3.60 ± 0.23 c | 3.37 ± 0.02 c | 12.01 ± 0.14 bc | 12.51 ± 0.91 a | 39.79 ± 0.37 a * | 55.28 ± 3.30 b * | 0.13 ± 0.01 b | 0.14 ± 0.01 abc |
| 2 | 51.79 ± 0.06 b | 52.47 ± 0.25 abc | 1.94 ± 0.02 b | 2.00 ± 0.47 b | 2.79 ± 0.23 ab | 3.38 ± 0.28 c | 11.63 ± 0.06 bc | 12.09 ± 1.40 a | 39.71 ± 0.93 a * | 51.82 ± 2.70 ab * | 0.14 ± 0.01 b | 0.16 ± 0.01 abc |
| 2.5 | 51.20 ± 0.90 b | 52.90 ± 0.93 abc | 2.02 ± 0.09 b | 1.98 ± 0.15 ab | 2.75 ± 0.01 ab | 3.01 ± 0.14 bcd | 11.12 ± 0.24 abc | 12.36 ± 2.09 a | 40.00 ± 0.71 a * | 49.82 ± 1.69 ab * | 0.14 ± 0.01 b * | 0.18 ± 0.01 bc * |
| 3 | 51.10 ± 0.91 b | 51.42 ± 0.73 ab | 2.05 ± 0.05 b * | 1.77 ± 0.13 ab * | 2.89 ± 0.12 b | 2.72 ± 0.19 abc | 10.01 ± 0.01 a * | 10.79 ± 0.04 a * | 38.13 ± 0.20 a | 46.16 ± 3.00 a | 0.19 ± 0.01 c * | 0.21 ± 0.01 c * |
| No | Compound a | RI b | No | Compound a | RI b |
|---|---|---|---|---|---|
| 1 | Tetradecane | 1124 | 24 | Corylone | 1647 |
| 2 | Pentadecane | 1269 | 25 | cis-muurola-3,5-diene | 1658 |
| 3 | Nonanal | 1281 | 26 | β-Damascenone | 1668 |
| 4 | Acetic acid | 1293 | 27 | Furaneol | 1670 |
| 5 | Furfural | 1307 | 28 | trans-Calamenene | 1695 |
| 6 | 3-Methyl-tridecane | 1371 | 29 | N-Methylsuccinimide | 1708 |
| 7 | Copaene | 1396 | 30 | Butylated Hydroxytoluene | 1762 |
| 8 | 5-Methyl-2-furaldehyde | 1411 | 31 | Maltol | 1765 |
| 9 | Cyperene | 1426 | 32 | 1-(1H-pyrrole-2-yl)-ethanone | 1768 |
| 10 | γ-Butyrolactone | 1450 | 33 | trans-ß-Ionone | 1777 |
| 11 | 4-Hydroxybutyric acid | 1451 | 34 | 2-Pyrrolecarbaldehyde | 1806 |
| 12 | Benzeneacetaldehyde | 1476 | 35 | Pantolactone | 1815 |
| 13 | Pristane | 1477 | 36 | 5-Methyl tetrahydrofurfuryl alcohol | 1836 |
| 14 | 2-Furanmethanol | 1492 | 37 | Nerolidol | 1876 |
| 15 | α-Himachalene | 1506 | 38 | 3,5-dimethyl-2,4(3H,5H)-Furandione | 1908 |
| 16 | 5-methyl-2-furanmethanol | 1554 | 39 | 8α-H-Secoeudesmanolide | 1936 |
| 17 | 2(5H)-Furanone | 1559 | 40 | γ-Decalactone | 1946 |
| 18 | γ-Gurjunene | 1563 | 41 | Rosefuran | 1974 |
| 19 | α-Ionol | 1594 | 42 | 5-Acetoxymethyl-2-furaldehyde | 1975 |
| 20 | α-Guaiene | 1595 | 43 | 2,3-Dihydro-3,5-dihydroxy-6-methyl-4h-pyran-4-one | 2019 |
| 21 | α-Muurolene | 1604 | 44 | Butyl 2 heptenate | 2022 |
| 22 | α-Humulene | 1606 | 45 | 4-Methyl-5-thiazolethanol | 2069 |
| 23 | α-Bisabolol | 1607 | 46 | 5-Hydroxymethylfurfural | 2214 |
| Sample | Overall | Visual | Aroma | Flavor | Texture | Aftertaste |
|---|---|---|---|---|---|---|
| Unpeeled-0.5 h | 4.96 ± 1.26 c *** | 5.65 ± 1.38 a | 5.35 ± 1.08 b *** | 4.95 ± 1.30 d *** | 4.98 ± 1.56 b *** | 5.20 ± 1.15 cd *** |
| Unpeeled-1 h | 6.55 ± 1.37 a | 6.24 ± 1.23 a | 6.51 ± 1.40 a ** | 6.49 ± 1.43 ab | 6.47 ± 1.33 a | 6.71 ± 1.18 a |
| Unpeeled-1.5 h | 6.20 ± 1.39 ab | 5.71 ± 1.47 a * | 6.27 ± 1.35 a | 6.31 ± 1.49 abc | 5.87 ± 1.44 a * | 5.91 ± 1.55 abc |
| Unpeeled-2 h | 6.25 ± 1.46 ab | 6.25 ± 1.39 a | 6.67 ± 1.09 a | 6.56 ± 1.46 a | 6.47 ± 1.55 a | 6.25 ± 1.54 ab |
| Unpeeled-2.5 h | 5.71 ± 1.61 bc | 5.87 ± 1.50 a | 6.56 ± 1.45 a | 5.65 ± 1.95 bcd | 6.02 ± 1.67 a | 5.49 ± 1.59 bcd |
| Unpeeled-3 h | 5.53 ± 1.89 bc * | 5.67 ± 1.60 a | 6.16 ± 1.55 a | 5.45 ± 2.09 cd ** | 6.18 ± 1.66 a * | 4.95 ± 1.95 d |
| Peeled-0.5 h | 3.84 ± 1.32 d *** | 5.18 ± 1.25 c | 4.47 ± 1.12 c *** | 3.85 ± 1.38 c *** | 3.38 ± 1.34 c *** | 4.18 ± 1.40 c *** |
| Peeled-1 h | 6.35 ± 1.27 ab | 5.91 ± 1.25 abc | 5.75 ± 1.00 b ** | 6.45 ± 1.26 a | 6.31 ± 1.36 a | 6.25 ± 1.28 a |
| Peeled-1.5 h | 6.60 ± 1.15 a | 6.49 ± 1.44 a * | 6.20 ± 1.46 ab | 6.47 ± 1.26 a | 6.53 ± 1.29 a * | 6.13 ± 1.32 ab * |
| Peeled-2 h | 6.65 ± 1.25 a | 6.51 ± 1.18 a | 6.87 ± 1.26 a | 6.67 ± 1.52 a | 6.53 ± 1.39 a | 6.31 ± 1.30 a |
| Peeled-2.5 h | 5.75 ± 1.65 b | 6.02 ± 1.35 ab | 6.51 ± 1.26 a | 5.45 ± 1.95 b | 6.24 ± 1.40 a | 5.31 ± 1.90 b |
| Peeled-3 h | 4.65 ± 1.91 c * | 5.58 ± 1.66 bc | 5.69 ± 1.94 b | 4.15 ± 2.01 c ** | 5.44 ± 1.77 b * | 4.24 ± 1.90 c * |
Publisher’s Note: MDPI stays neutral with regard to jurisdictional claims in published maps and institutional affiliations. |
© 2021 by the authors. Licensee MDPI, Basel, Switzerland. This article is an open access article distributed under the terms and conditions of the Creative Commons Attribution (CC BY) license (https://creativecommons.org/licenses/by/4.0/).
Share and Cite
Tsai, Y.-J.; Lin, L.-Y.; Yang, K.-M.; Chiang, Y.-C.; Chen, M.-H.; Chiang, P.-Y. Effects of Roasting Sweet Potato (Ipomoea batatas L. Lam.): Quality, Volatile Compound Composition, and Sensory Evaluation. Foods 2021, 10, 2602. https://doi.org/10.3390/foods10112602
Tsai Y-J, Lin L-Y, Yang K-M, Chiang Y-C, Chen M-H, Chiang P-Y. Effects of Roasting Sweet Potato (Ipomoea batatas L. Lam.): Quality, Volatile Compound Composition, and Sensory Evaluation. Foods. 2021; 10(11):2602. https://doi.org/10.3390/foods10112602
Chicago/Turabian StyleTsai, Yu-Jung, Li-Yun Lin, Kai-Min Yang, Yi-Chan Chiang, Min-Hung Chen, and Po-Yuan Chiang. 2021. "Effects of Roasting Sweet Potato (Ipomoea batatas L. Lam.): Quality, Volatile Compound Composition, and Sensory Evaluation" Foods 10, no. 11: 2602. https://doi.org/10.3390/foods10112602