
Food Xanthan Polysaccharide Sulfation Process with Sulfamic Acid

 , ,
, ,  , ,
, ,
Abstract
:1. Introduction
2. Materials and Methods
2.1. Sulfation of Xanthan
2.2. Statistical Analysis of the Sulfation Xanthan Process
2.3. Methods of Physico-Chemical Analysis
2.3.1. Elemental Analysis
2.3.2. FTIR
2.3.3. XRD
2.3.4. Gel Permeation Chromatography
2.3.5. Atomic Force Microscopy
2.3.6. Thermogravimetric Analysis
3. Results and Discussion
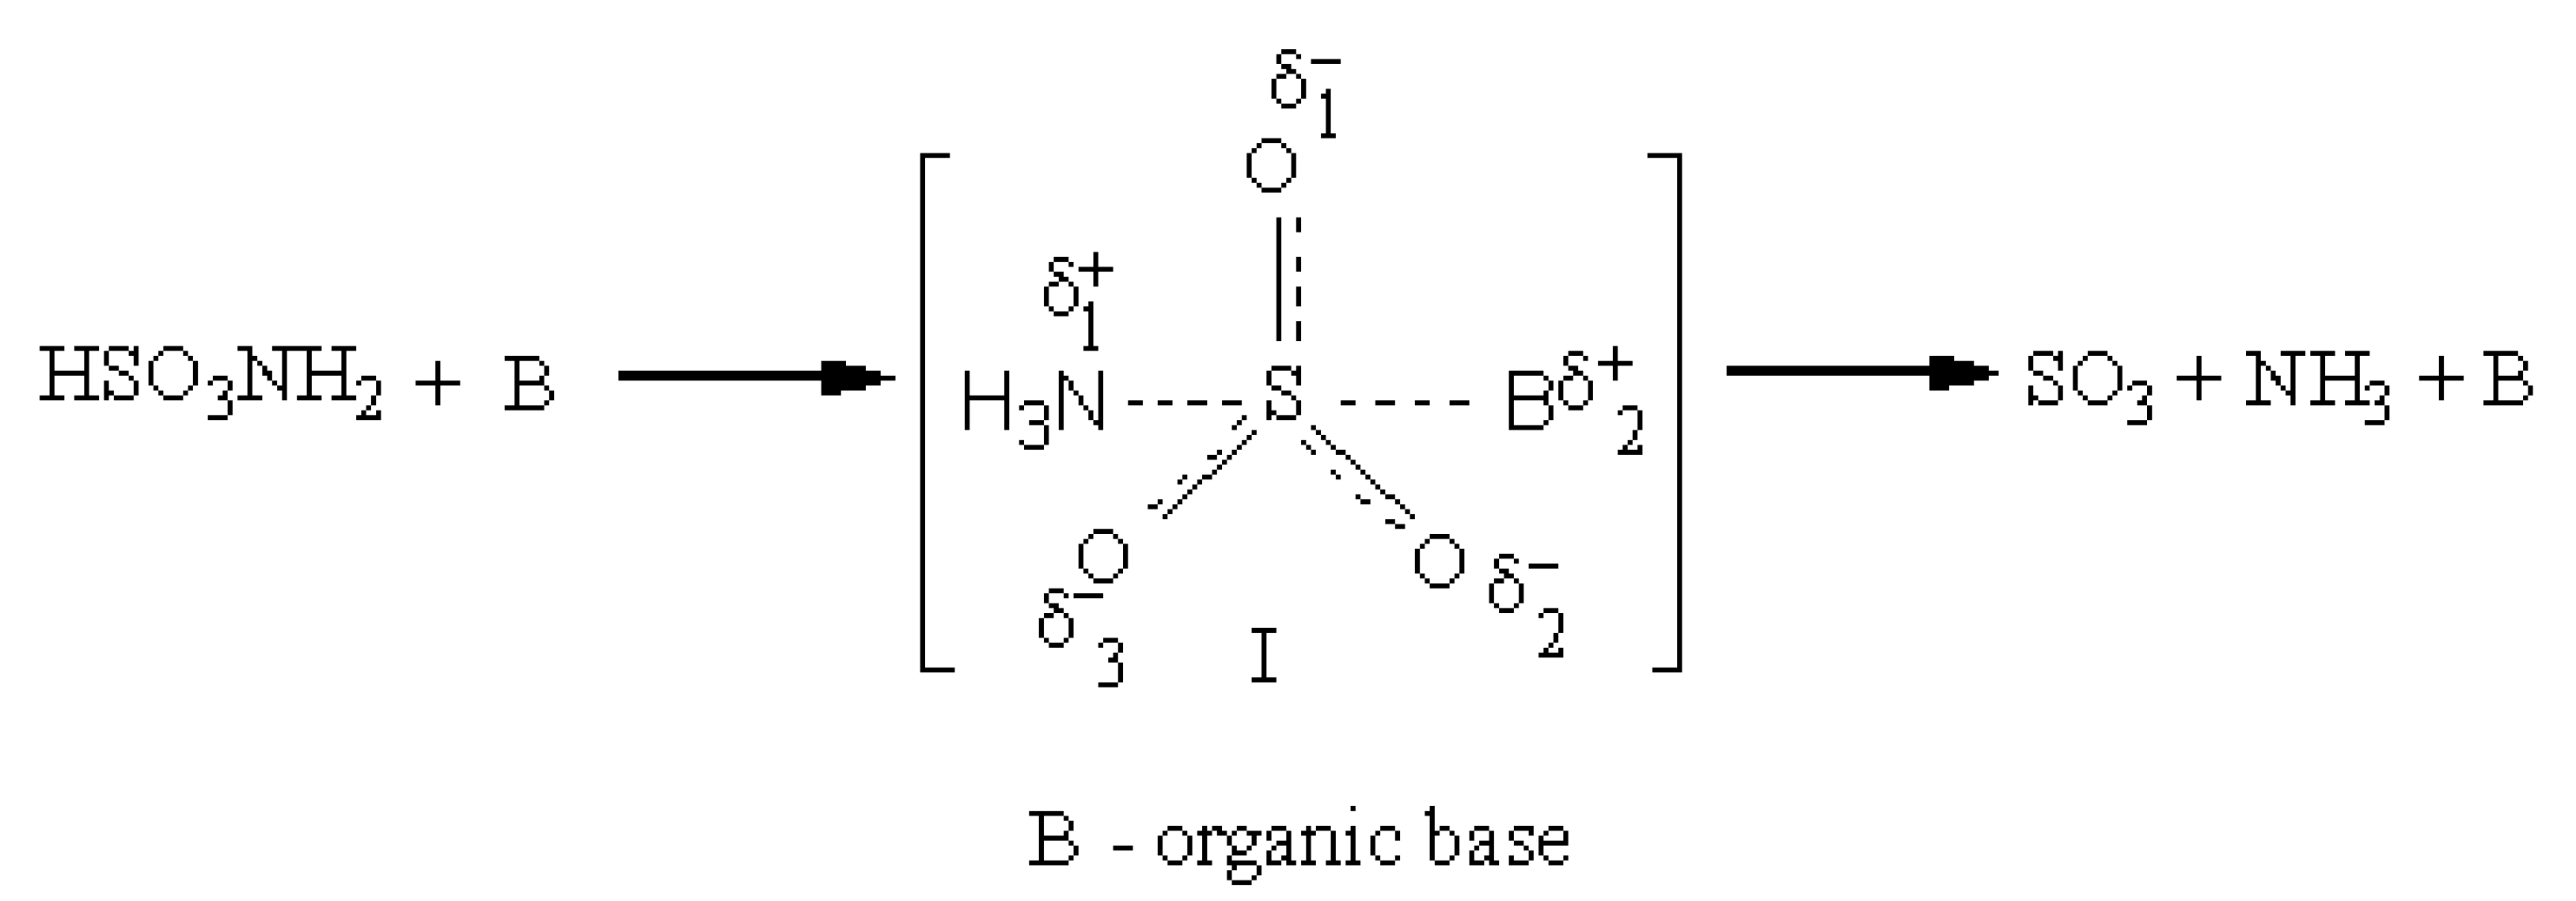
3.1. The Role of the Activator in the Process of Sulfation of Xanthan with Sulfamic Acid
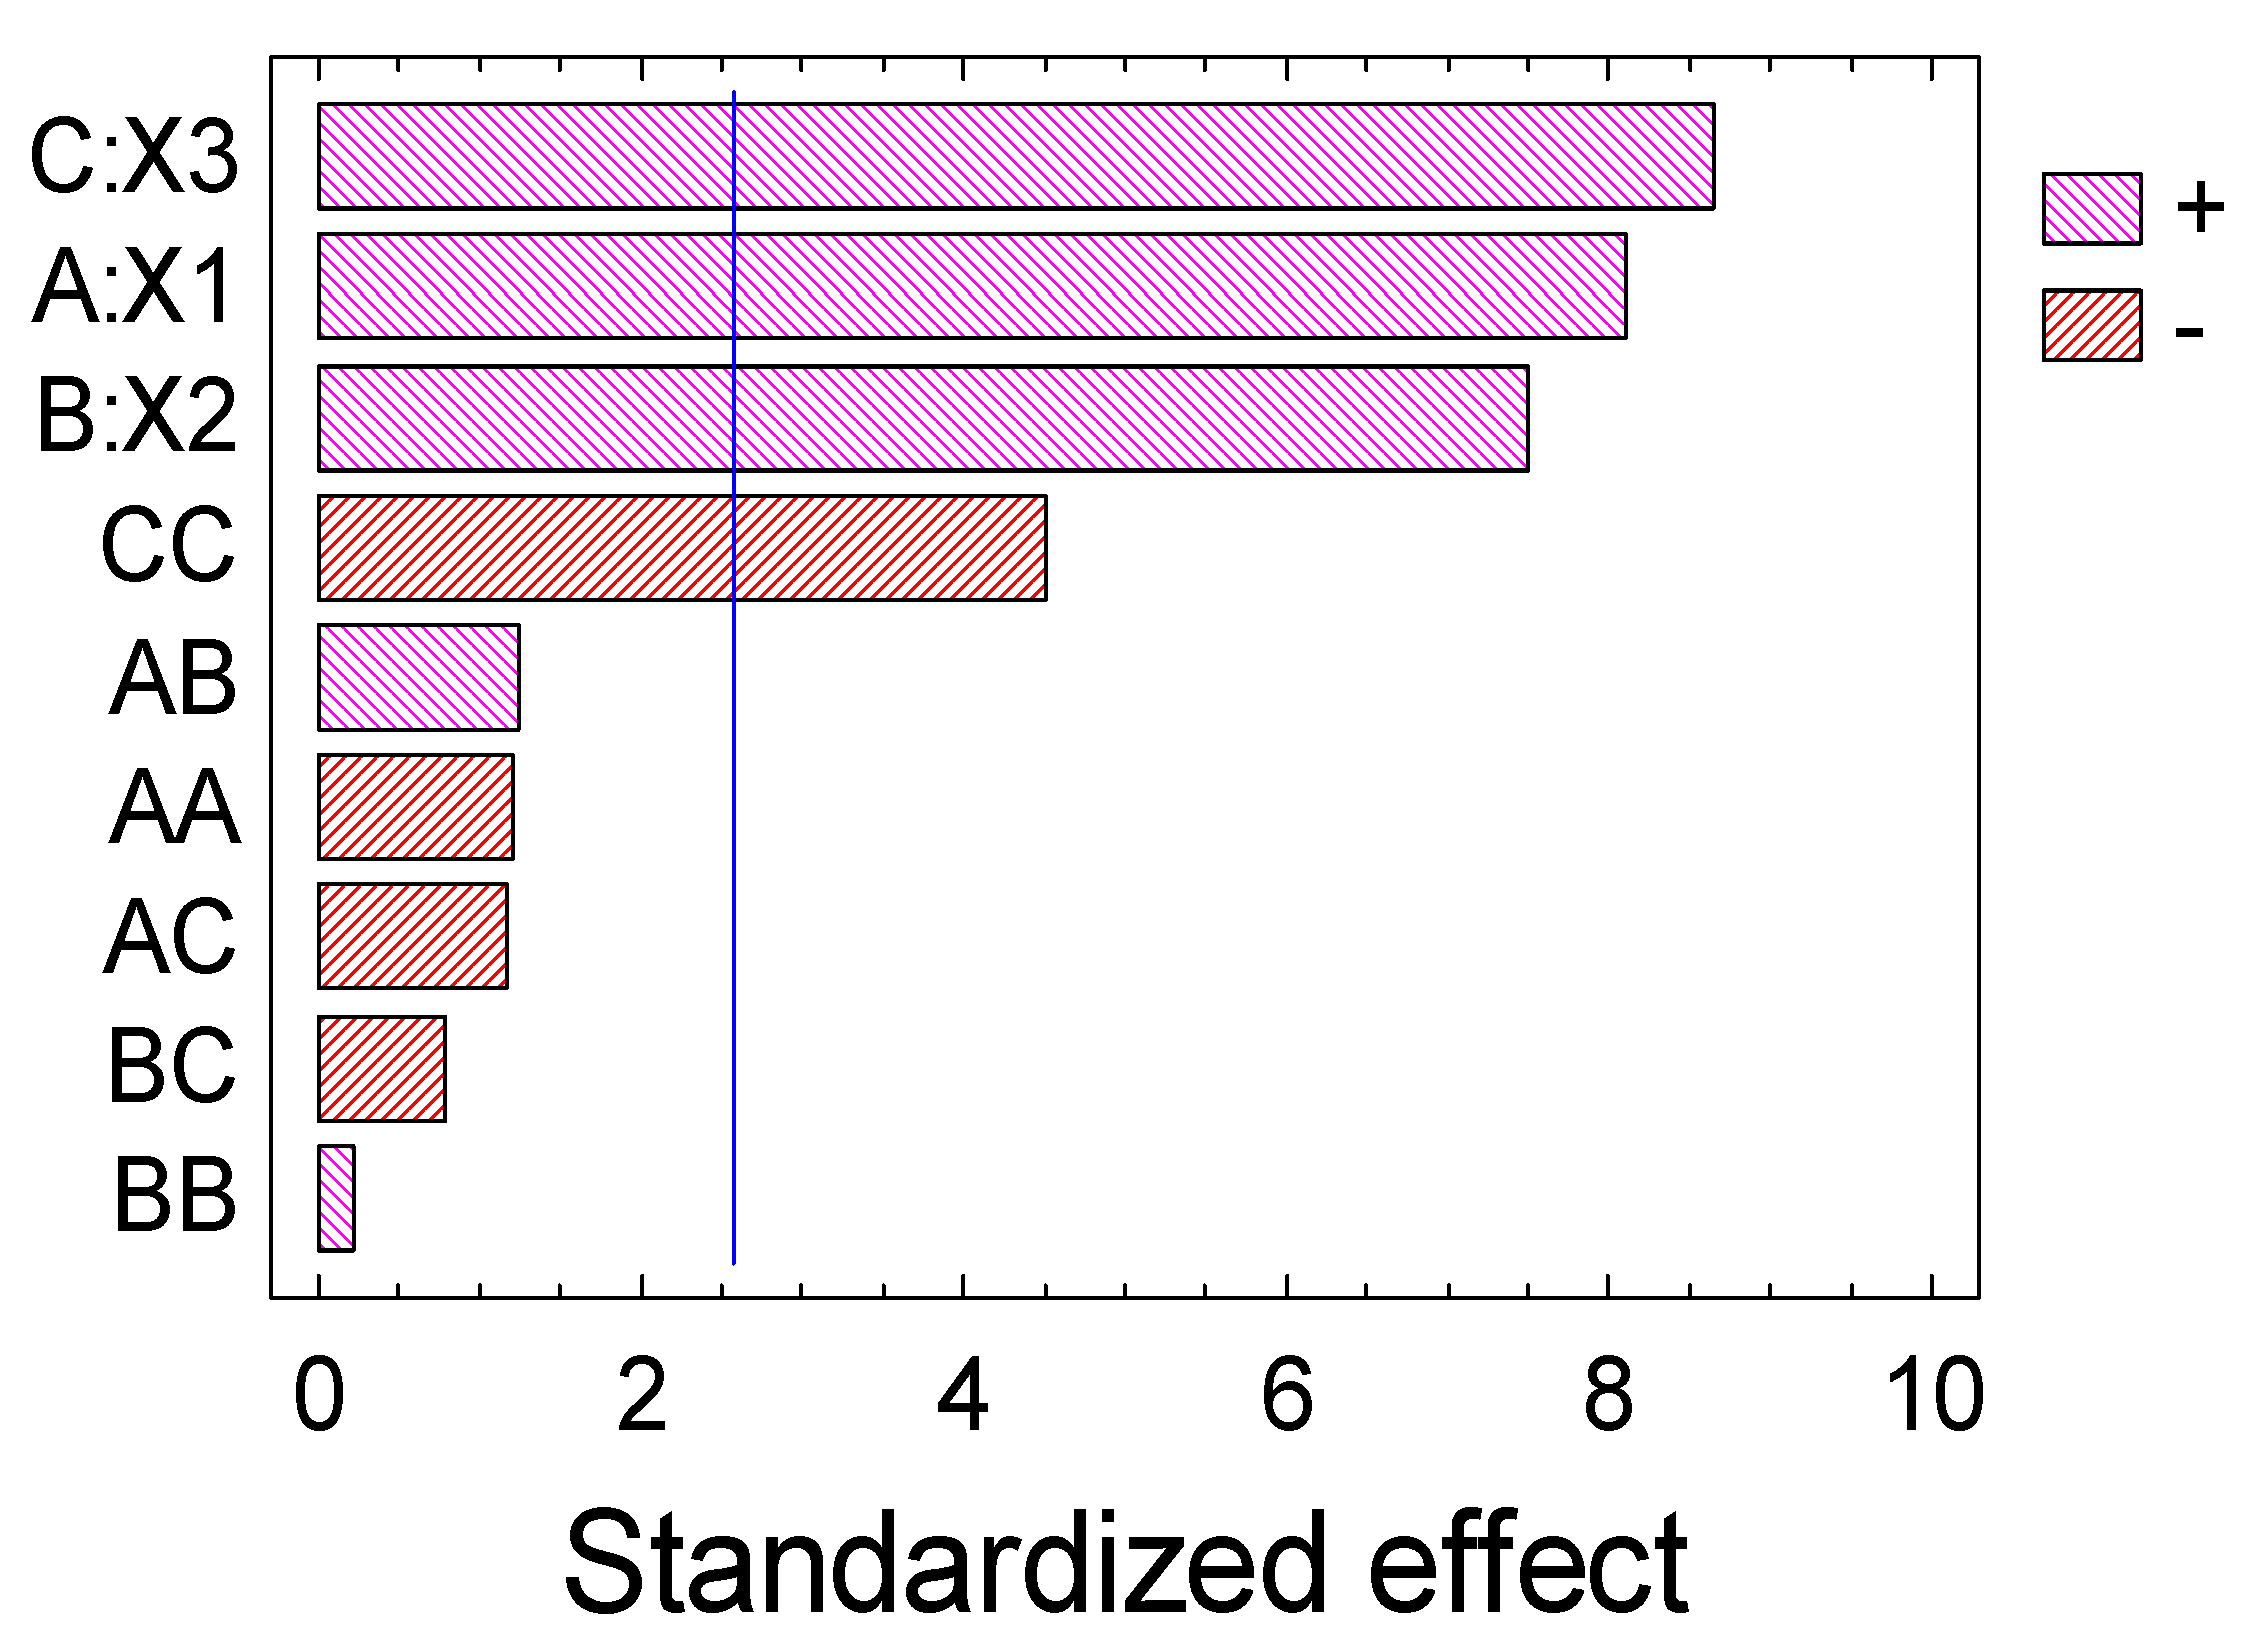
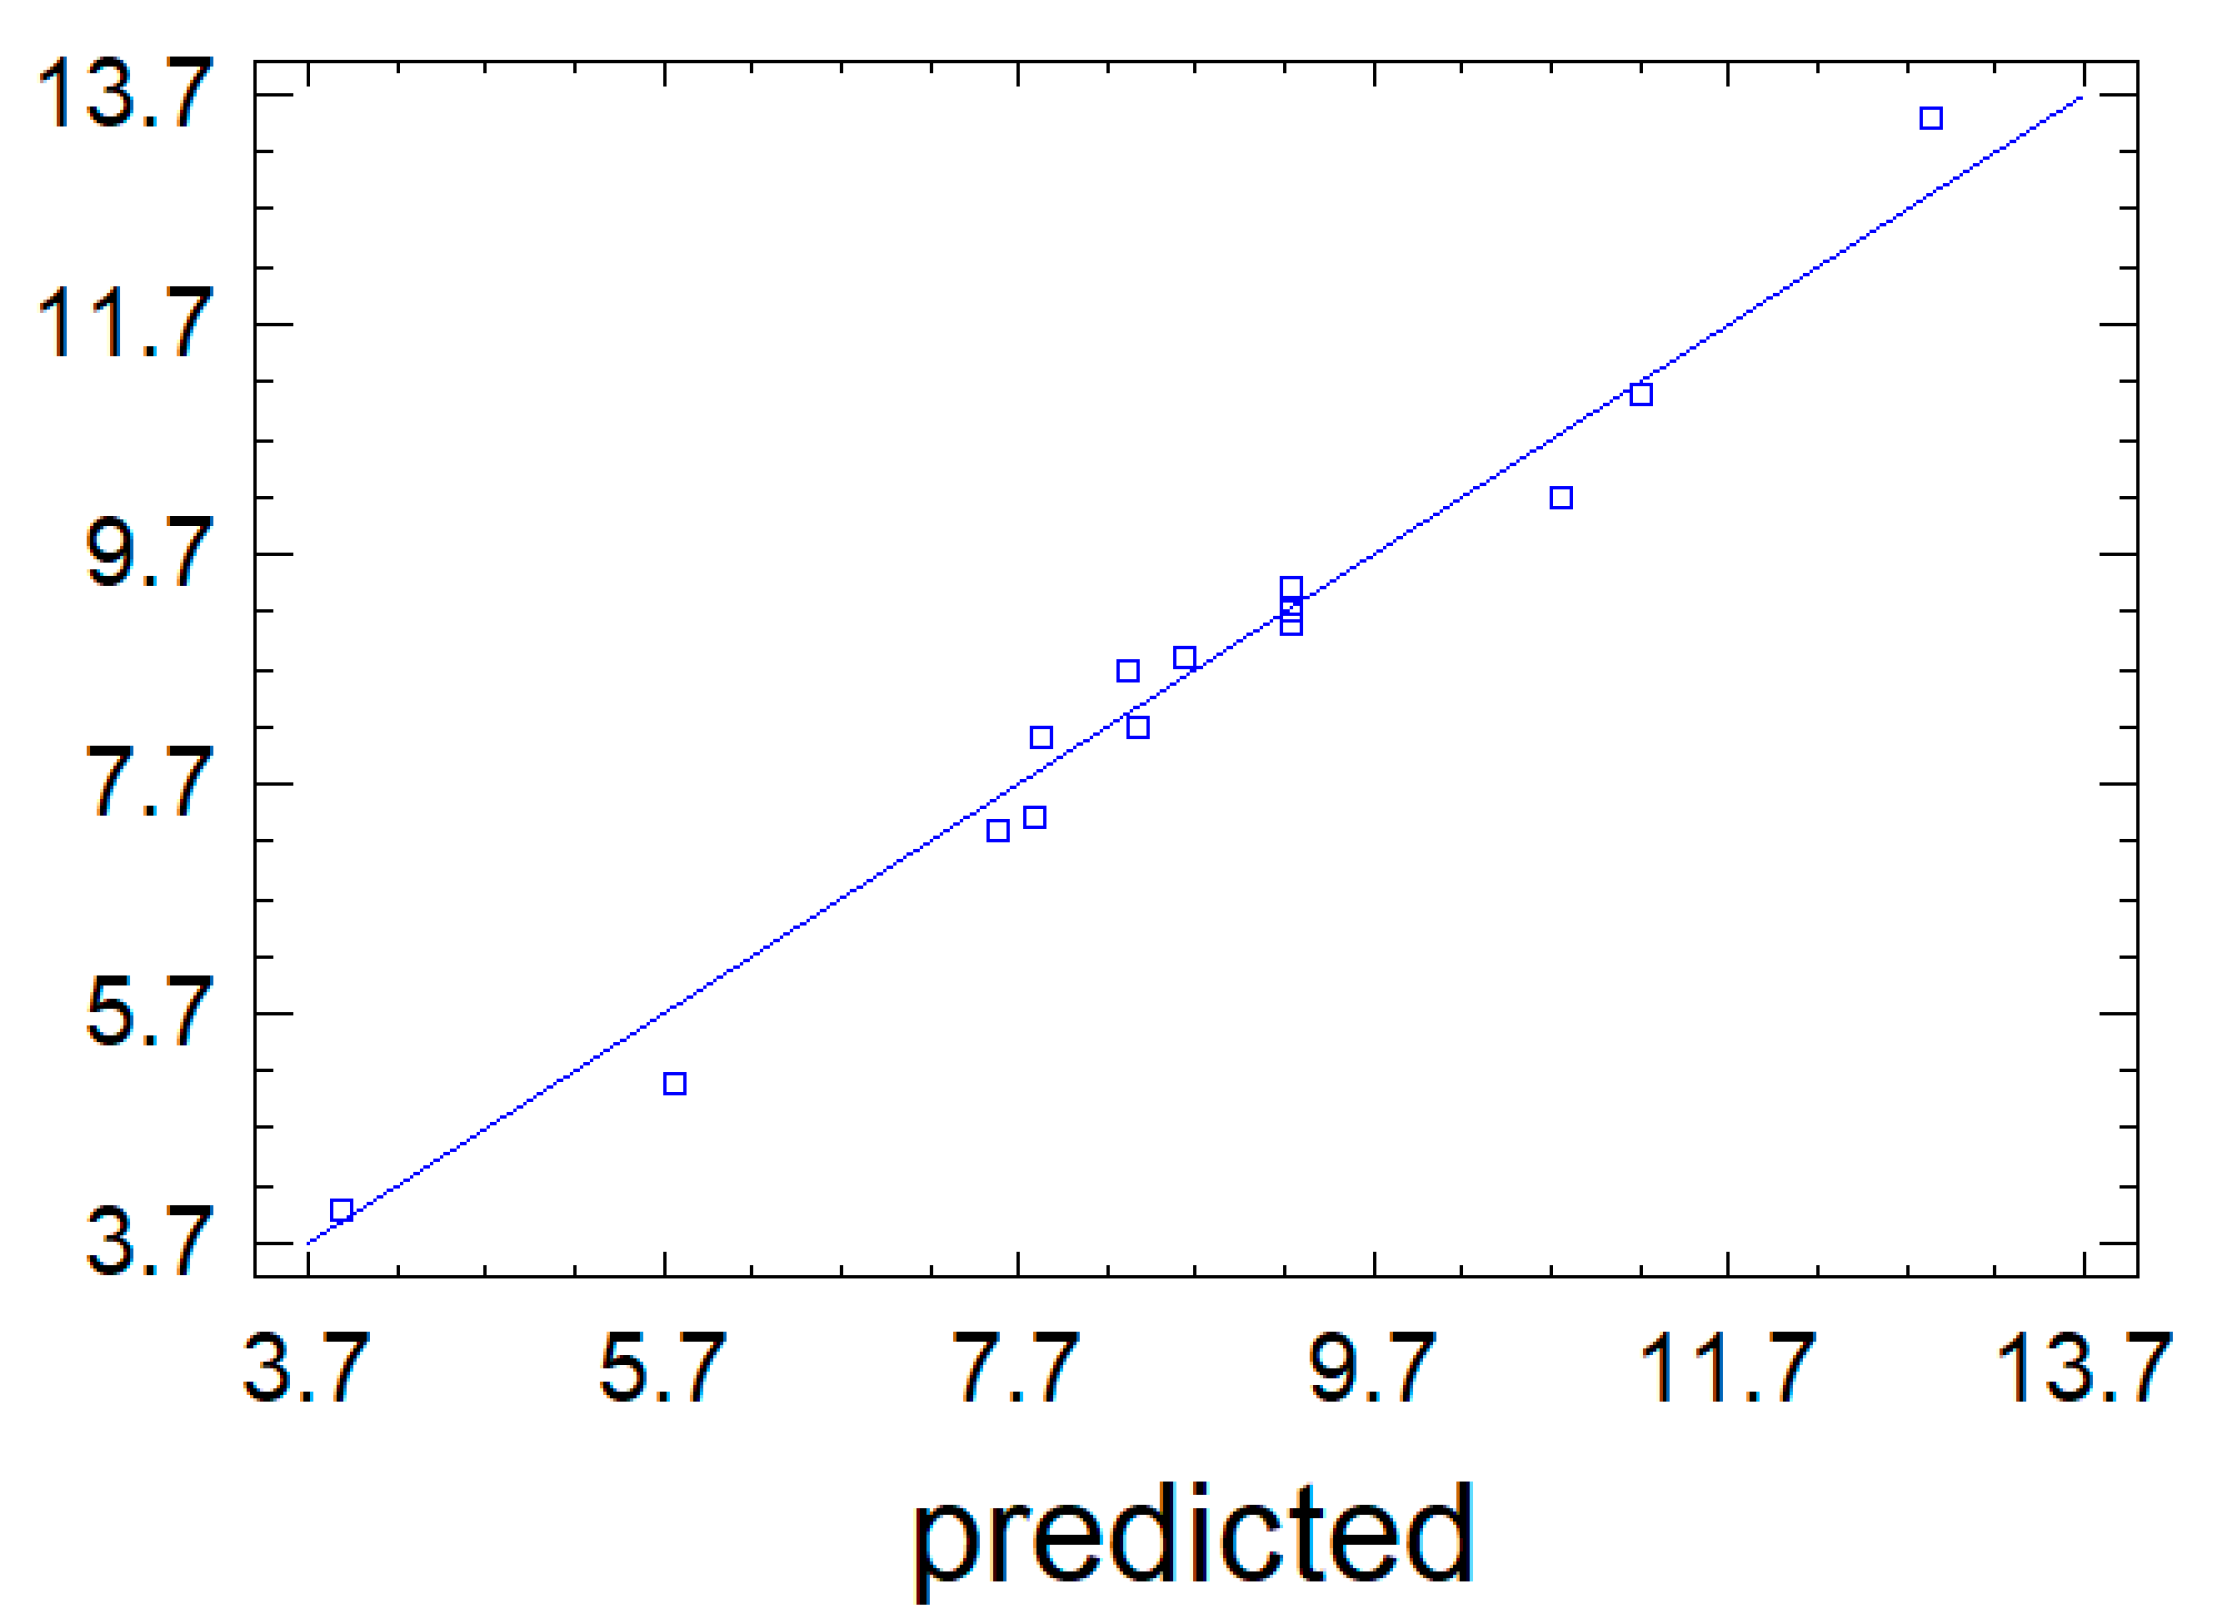
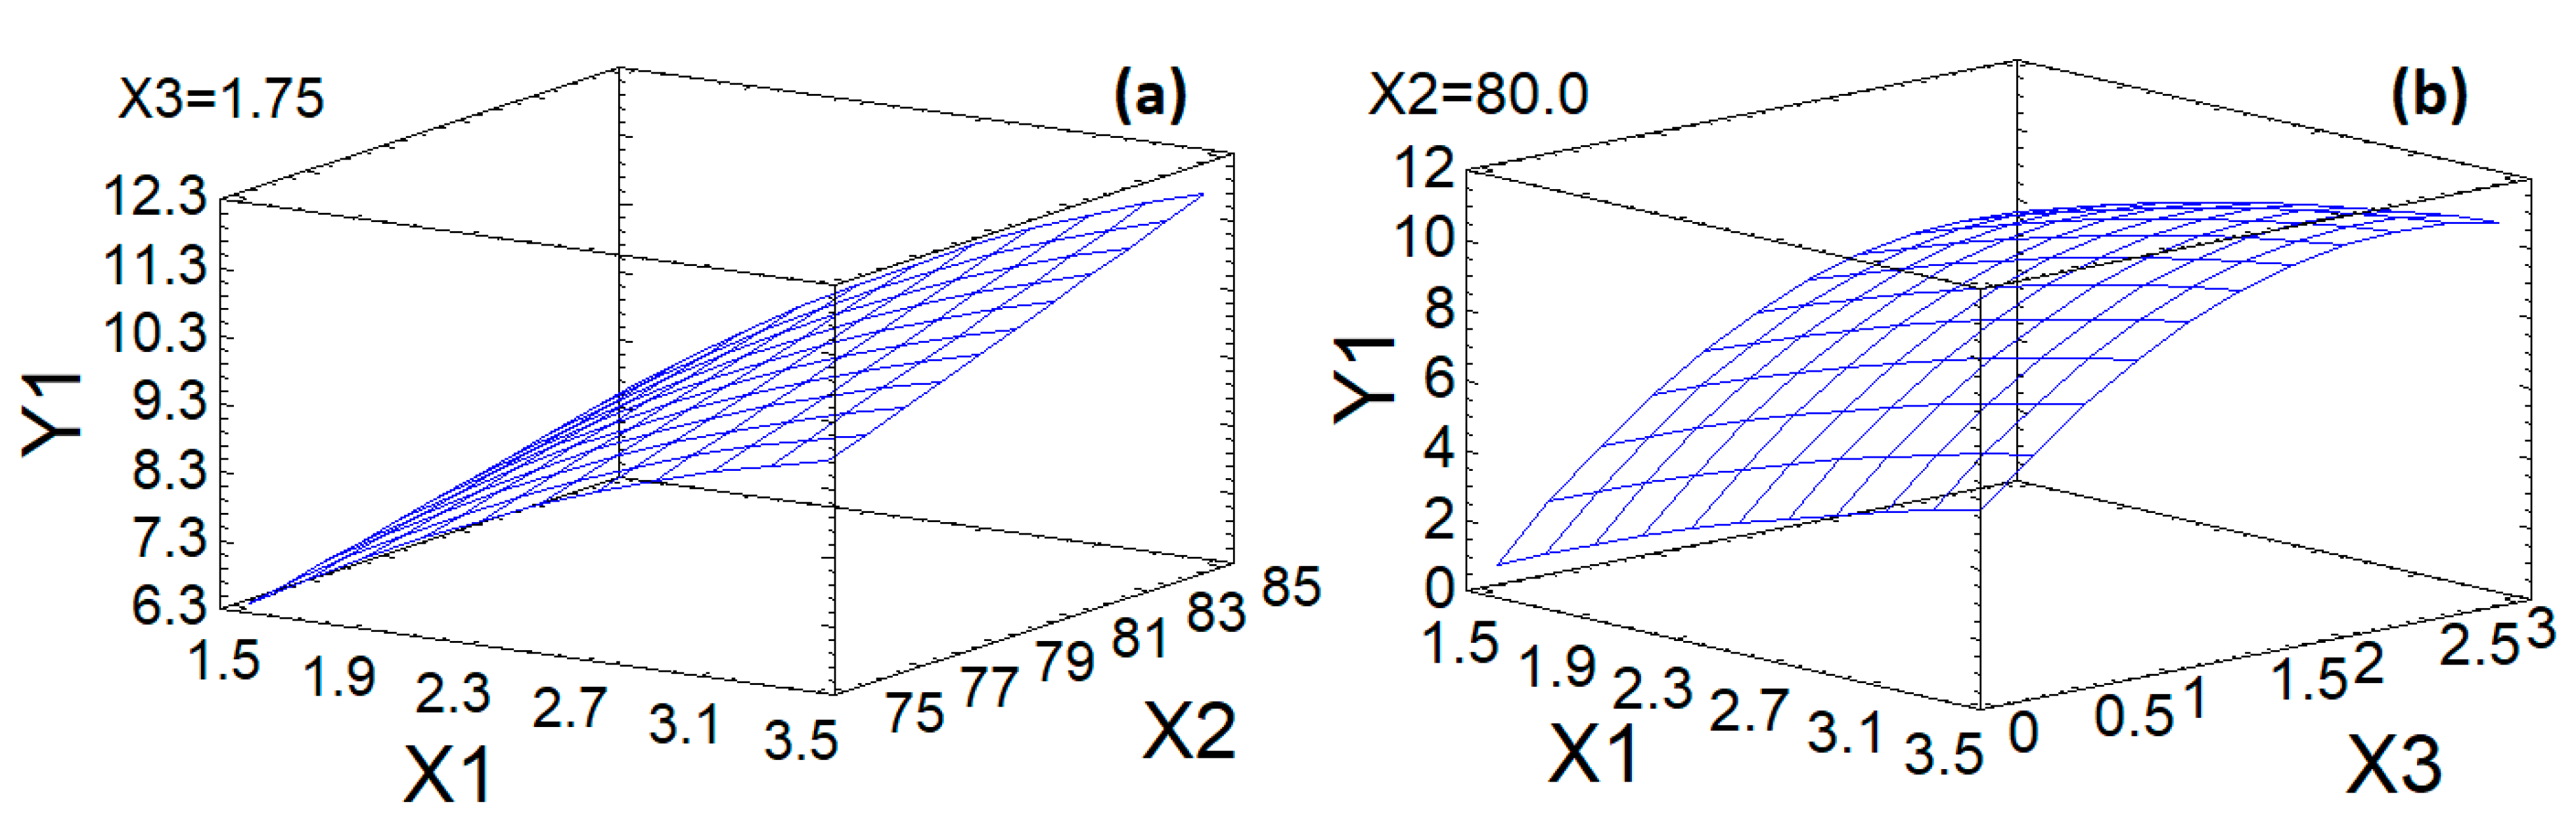
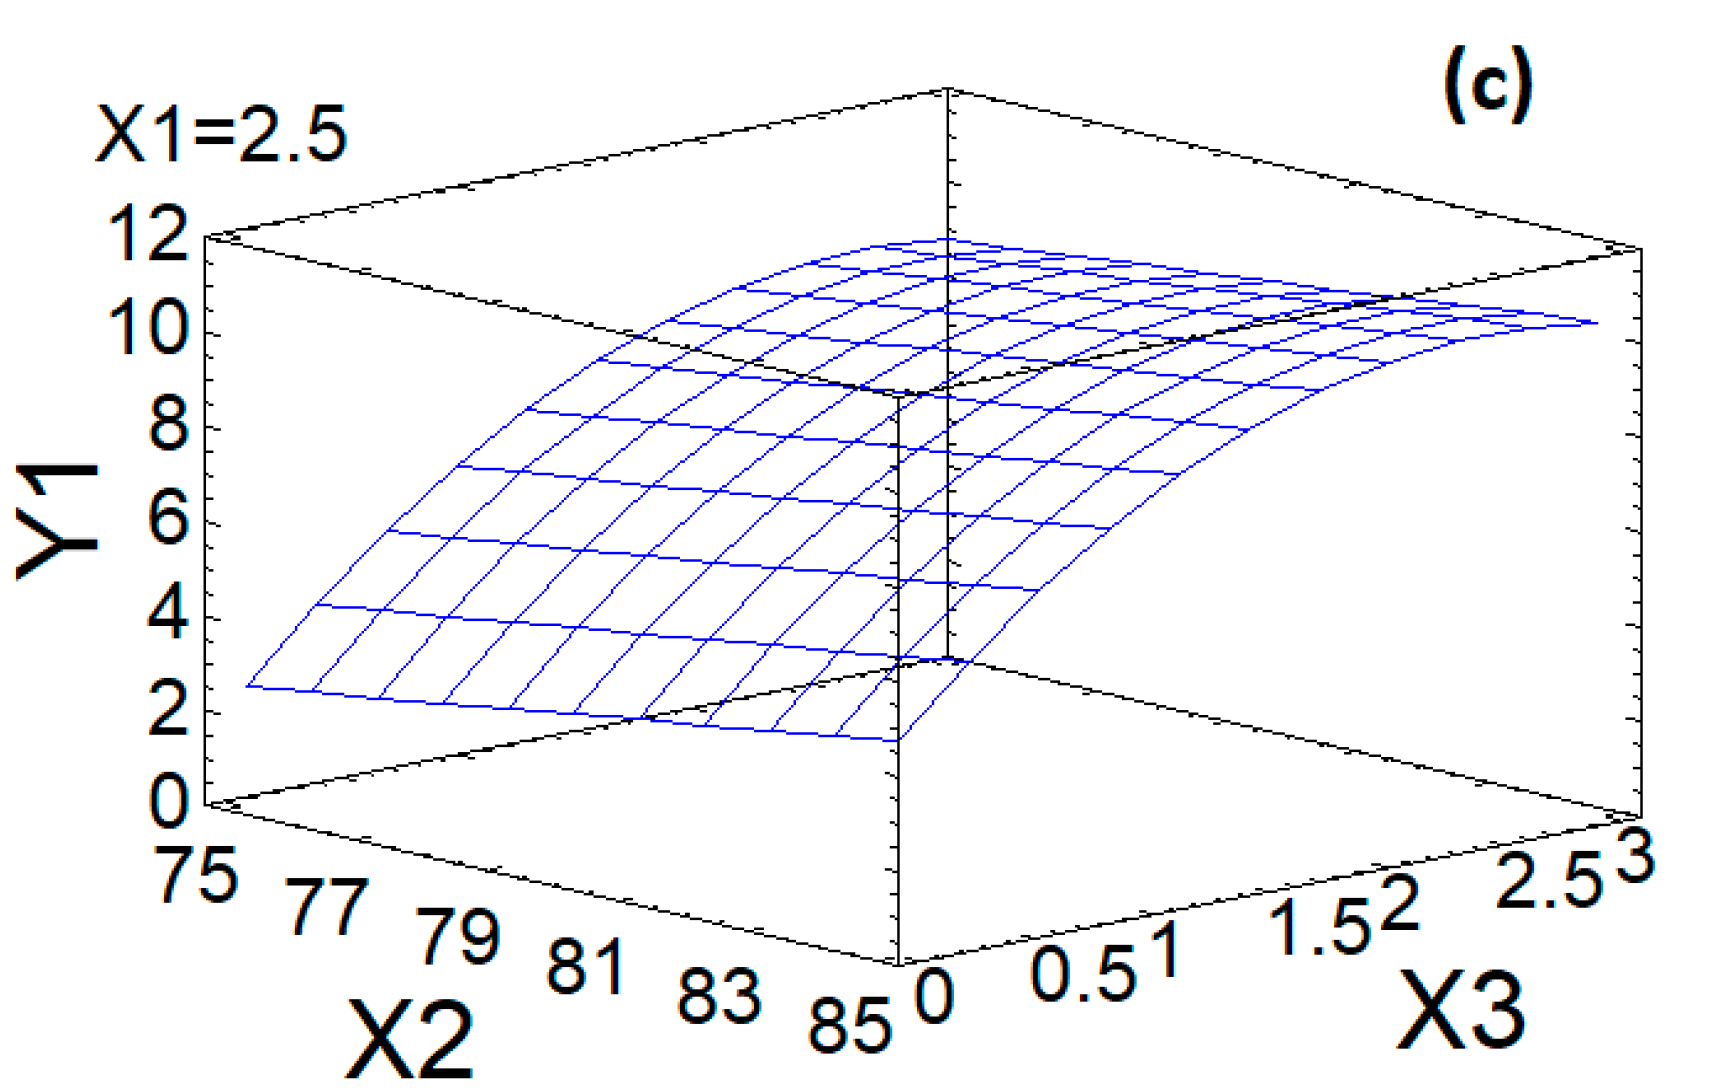
3.2. BBD Analysis of Xanthan Sulfation
0.02X2X3 − 0.962667X32
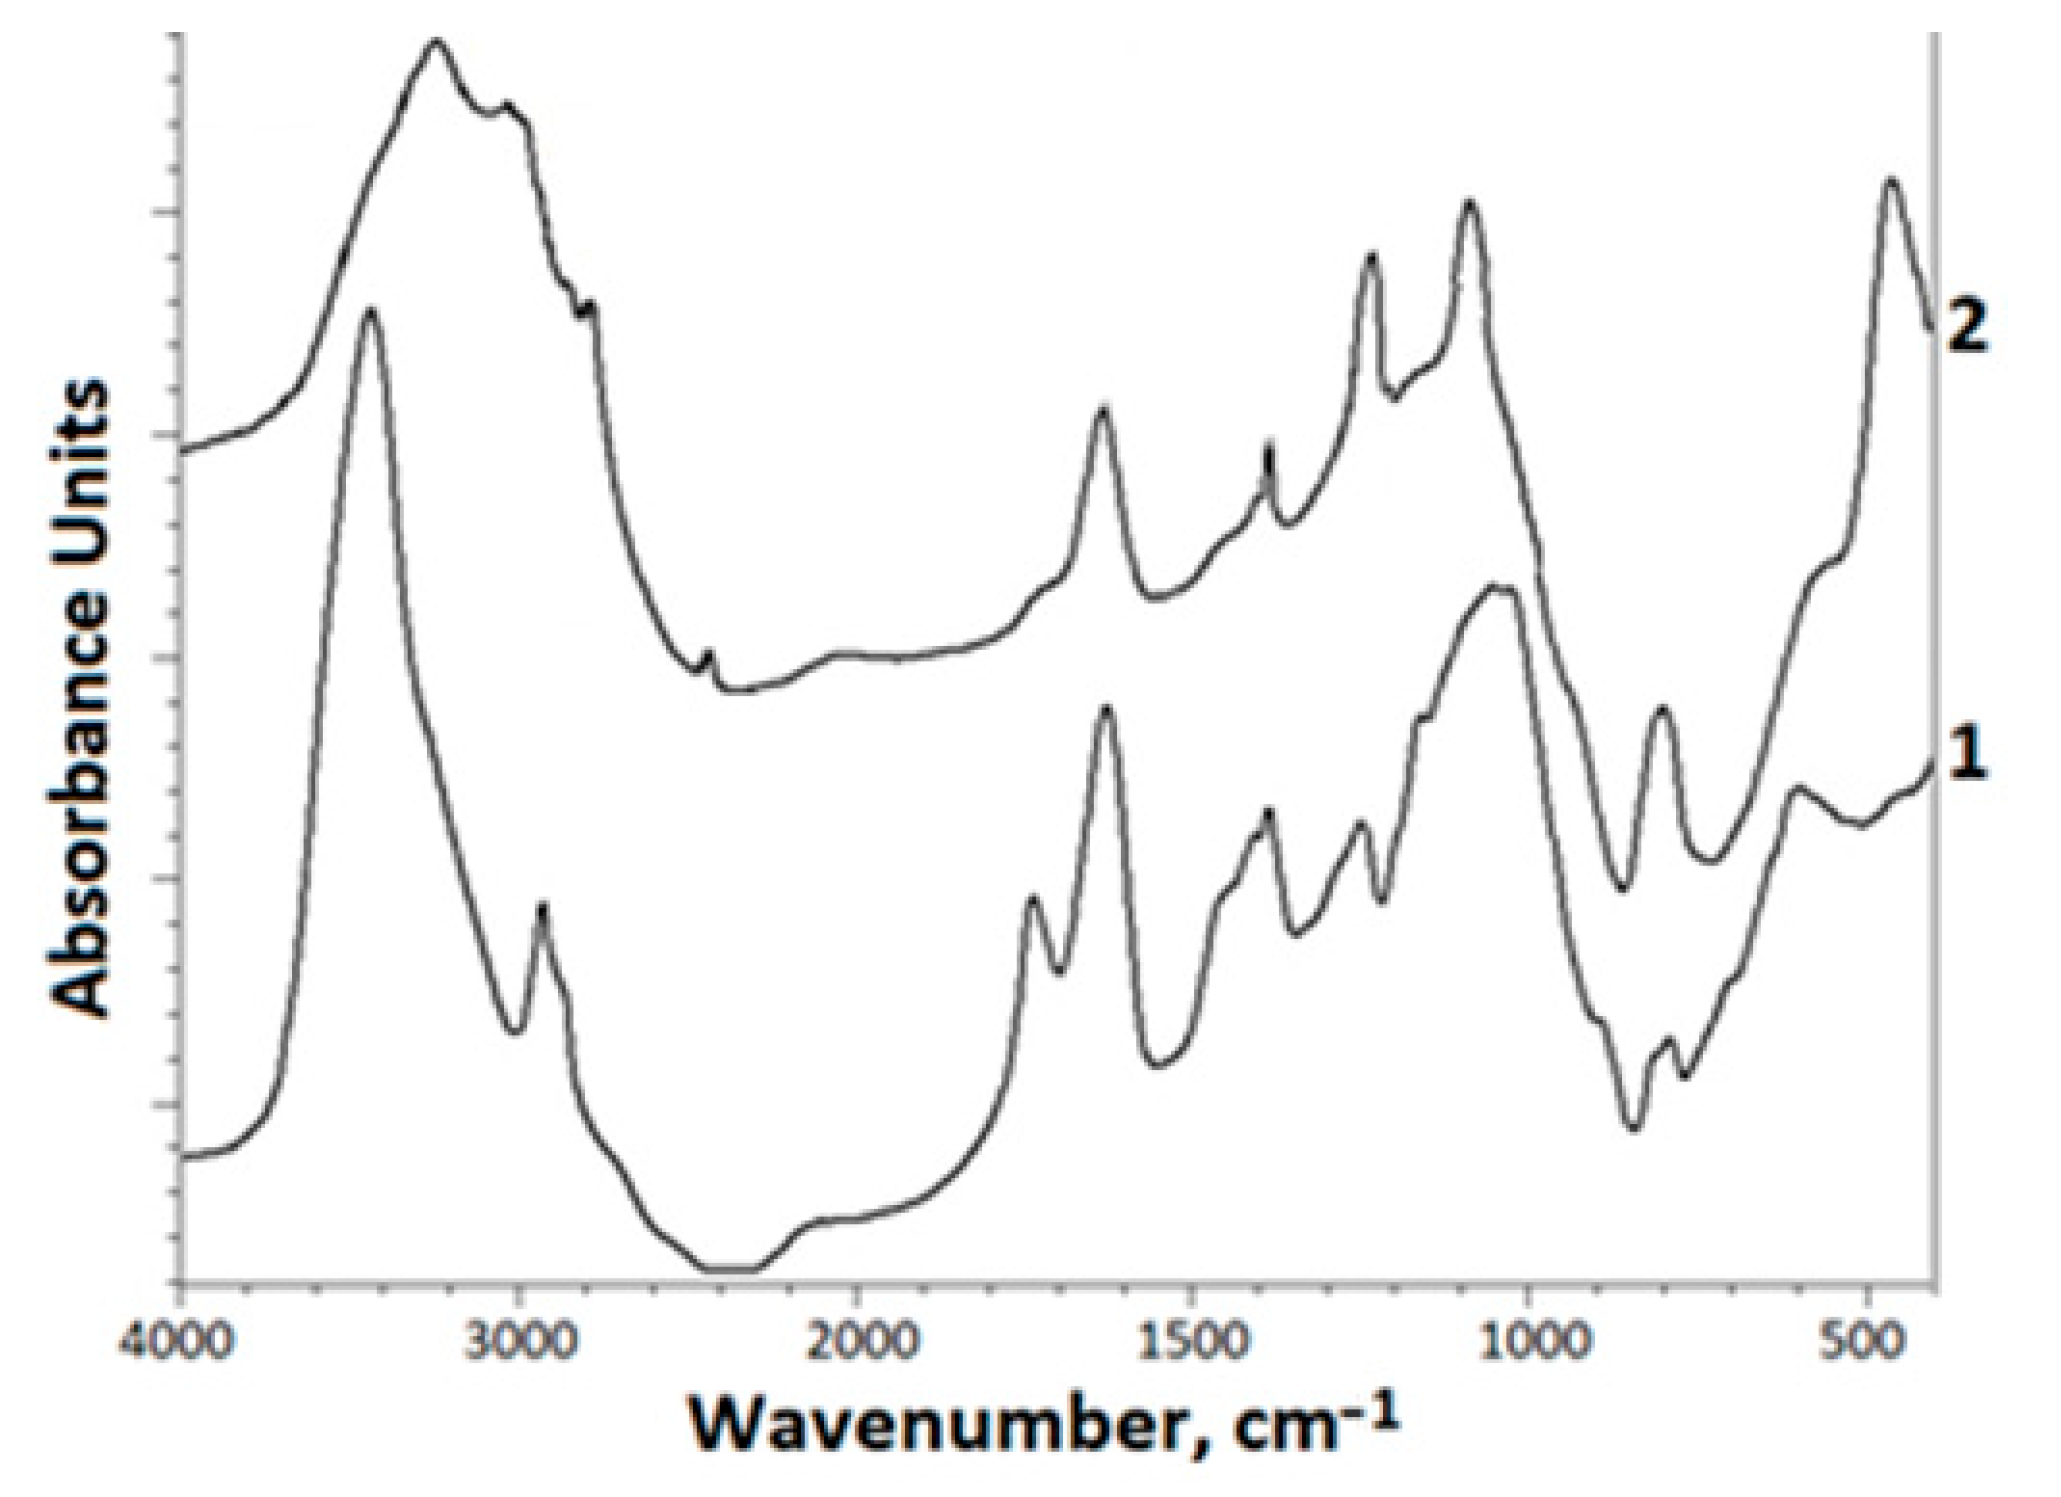
3.3. FTIR Spectroscopy
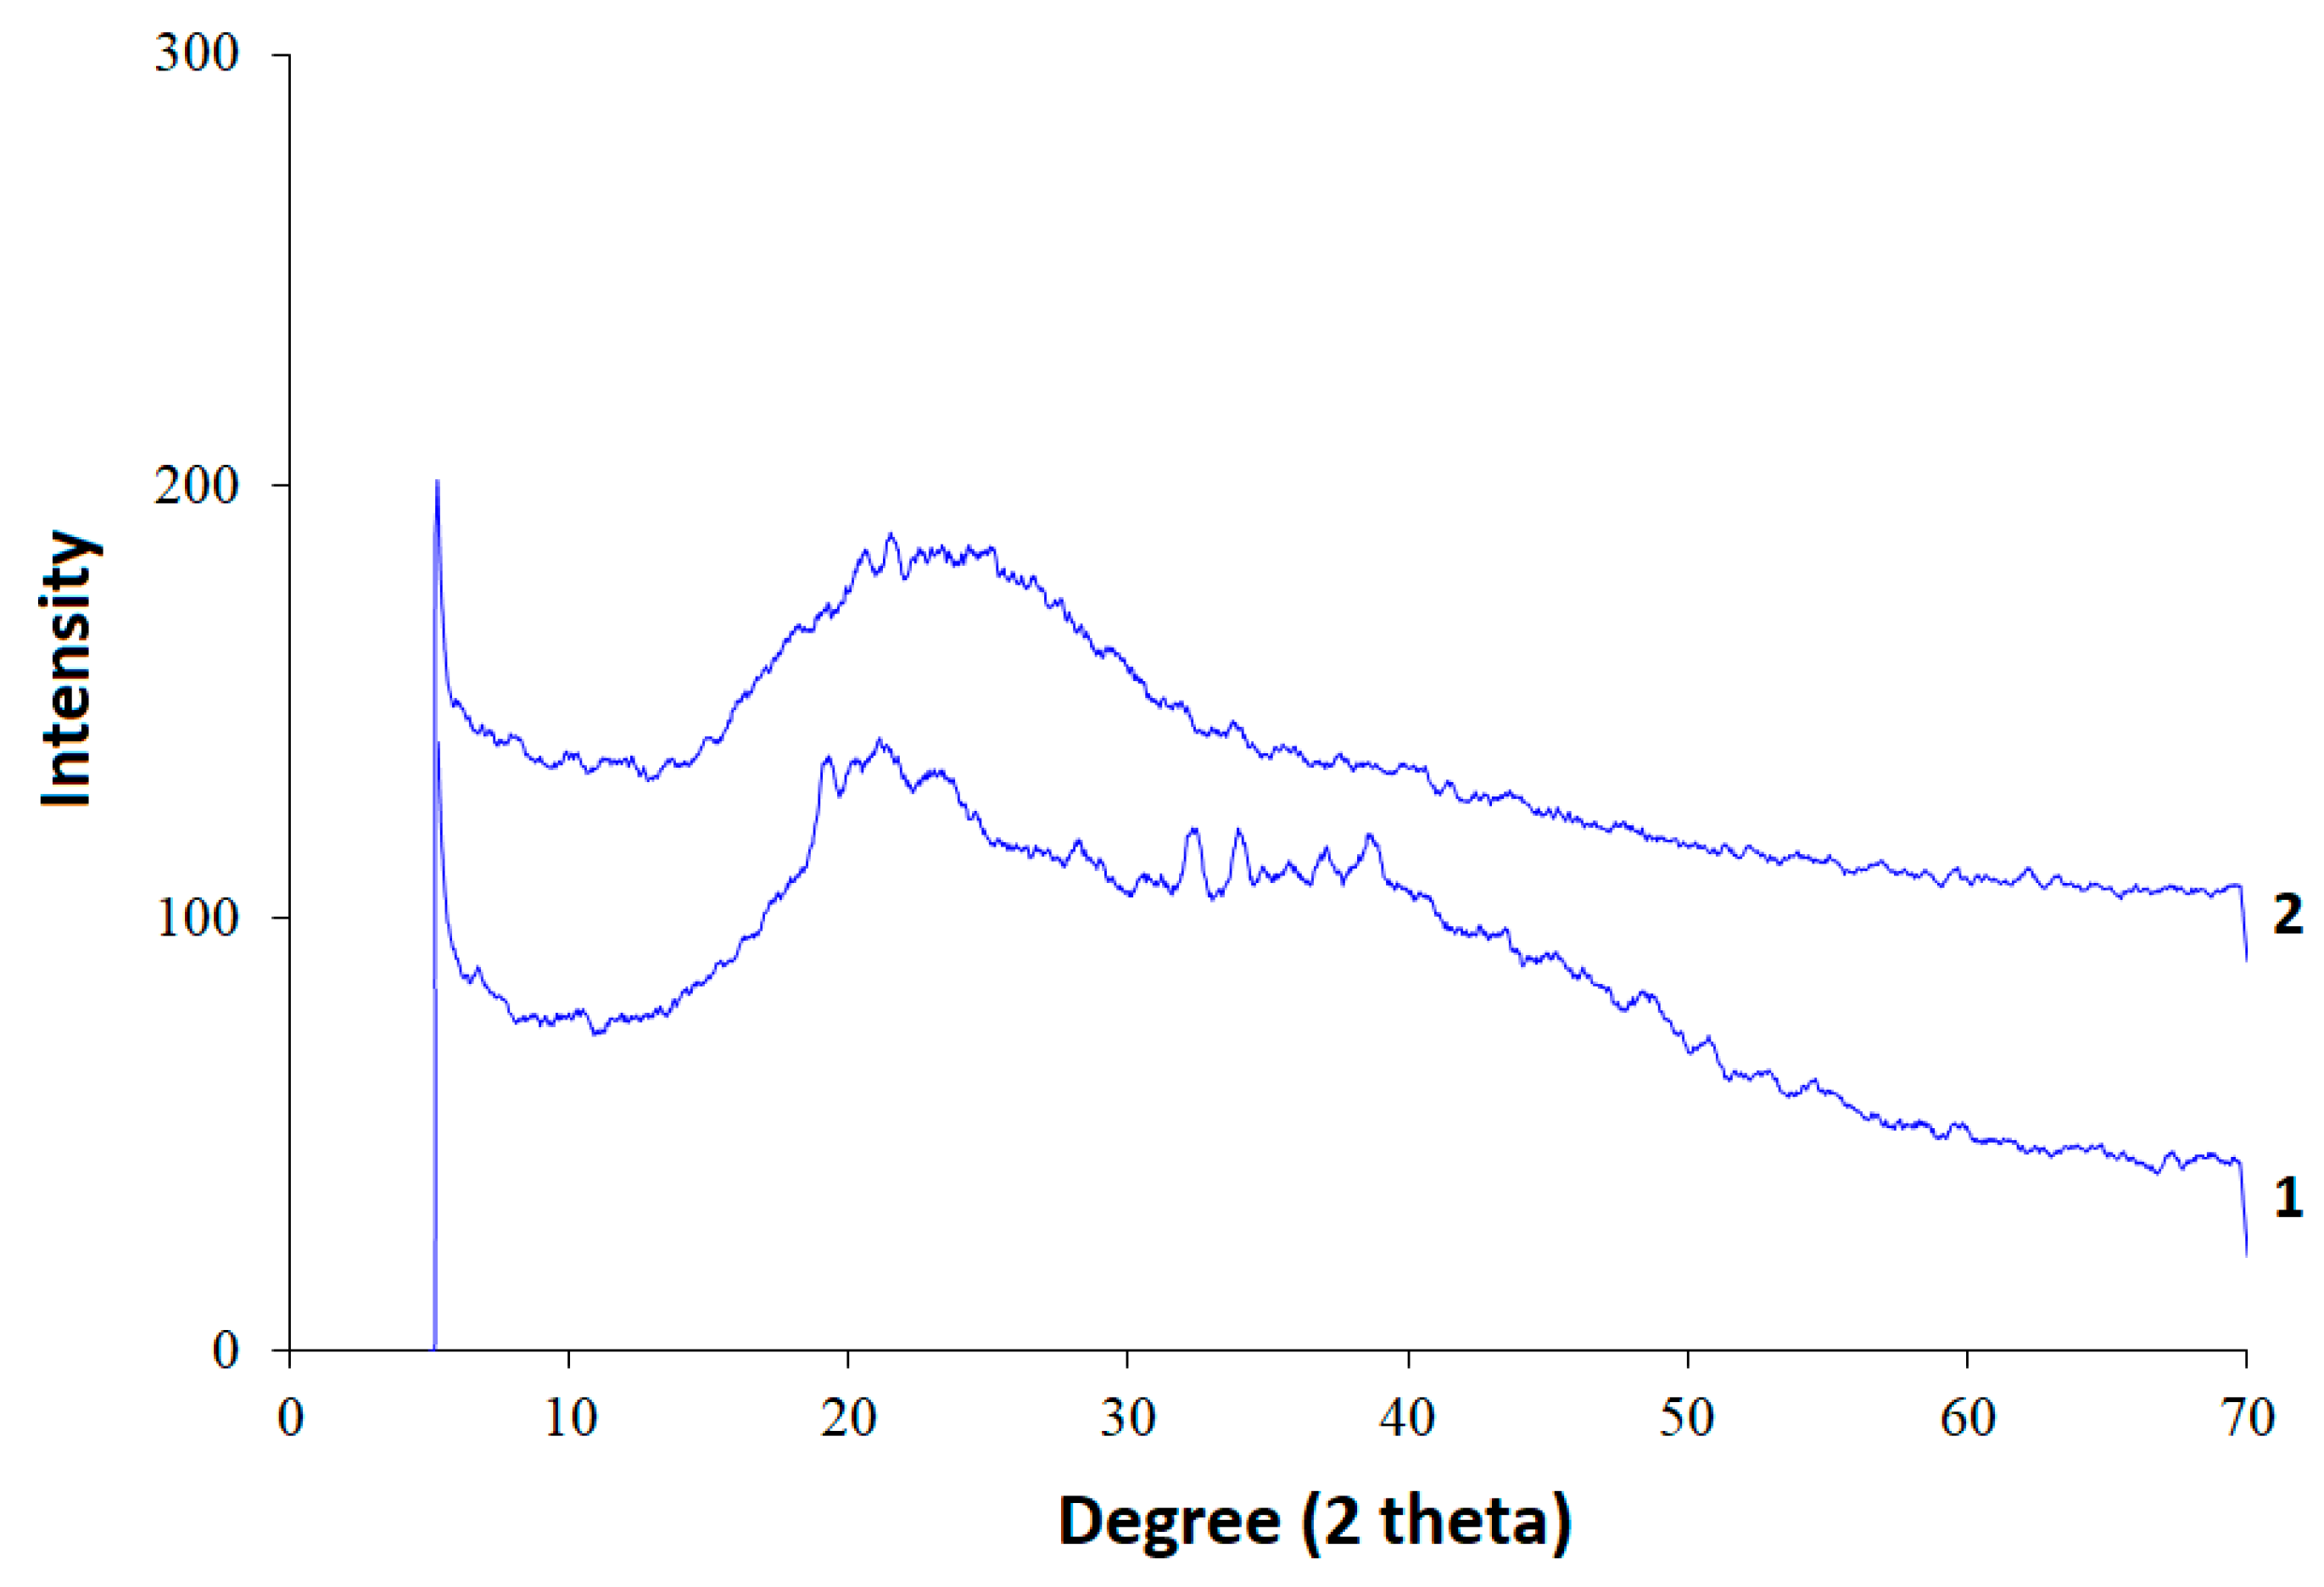
3.4. X-ray Diffractions Analysis
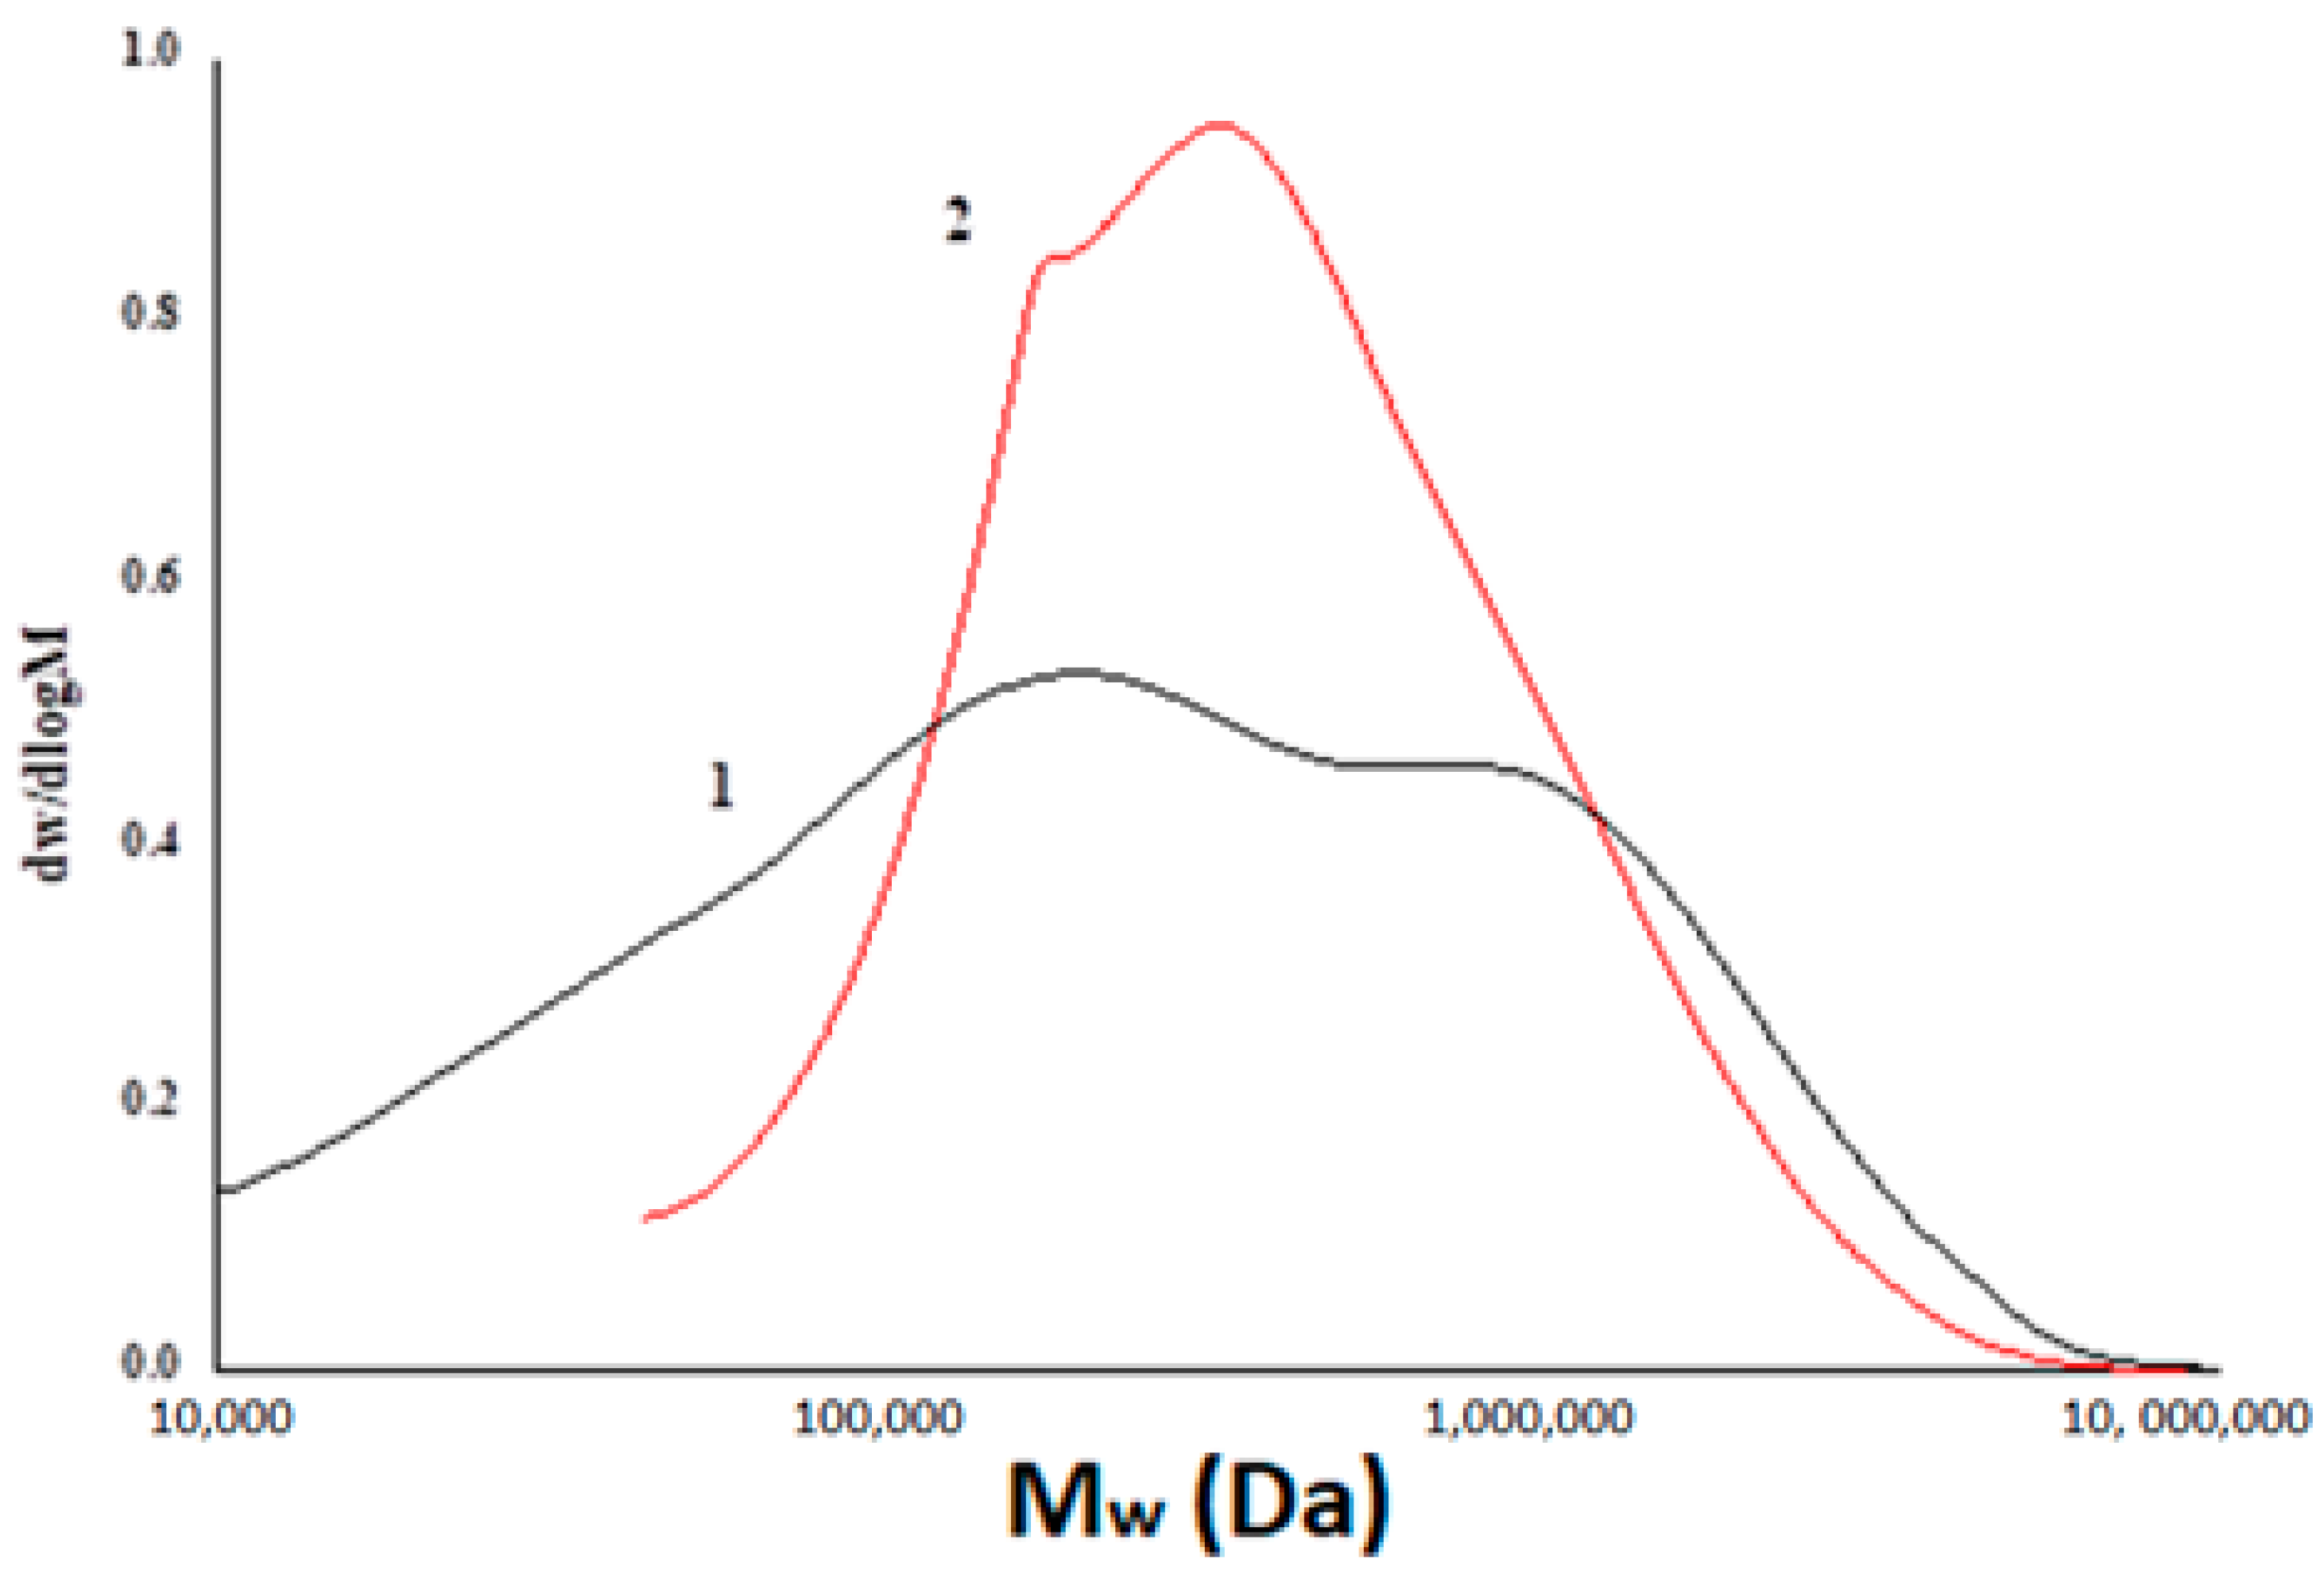
3.5. Gel Permeation Chromatography
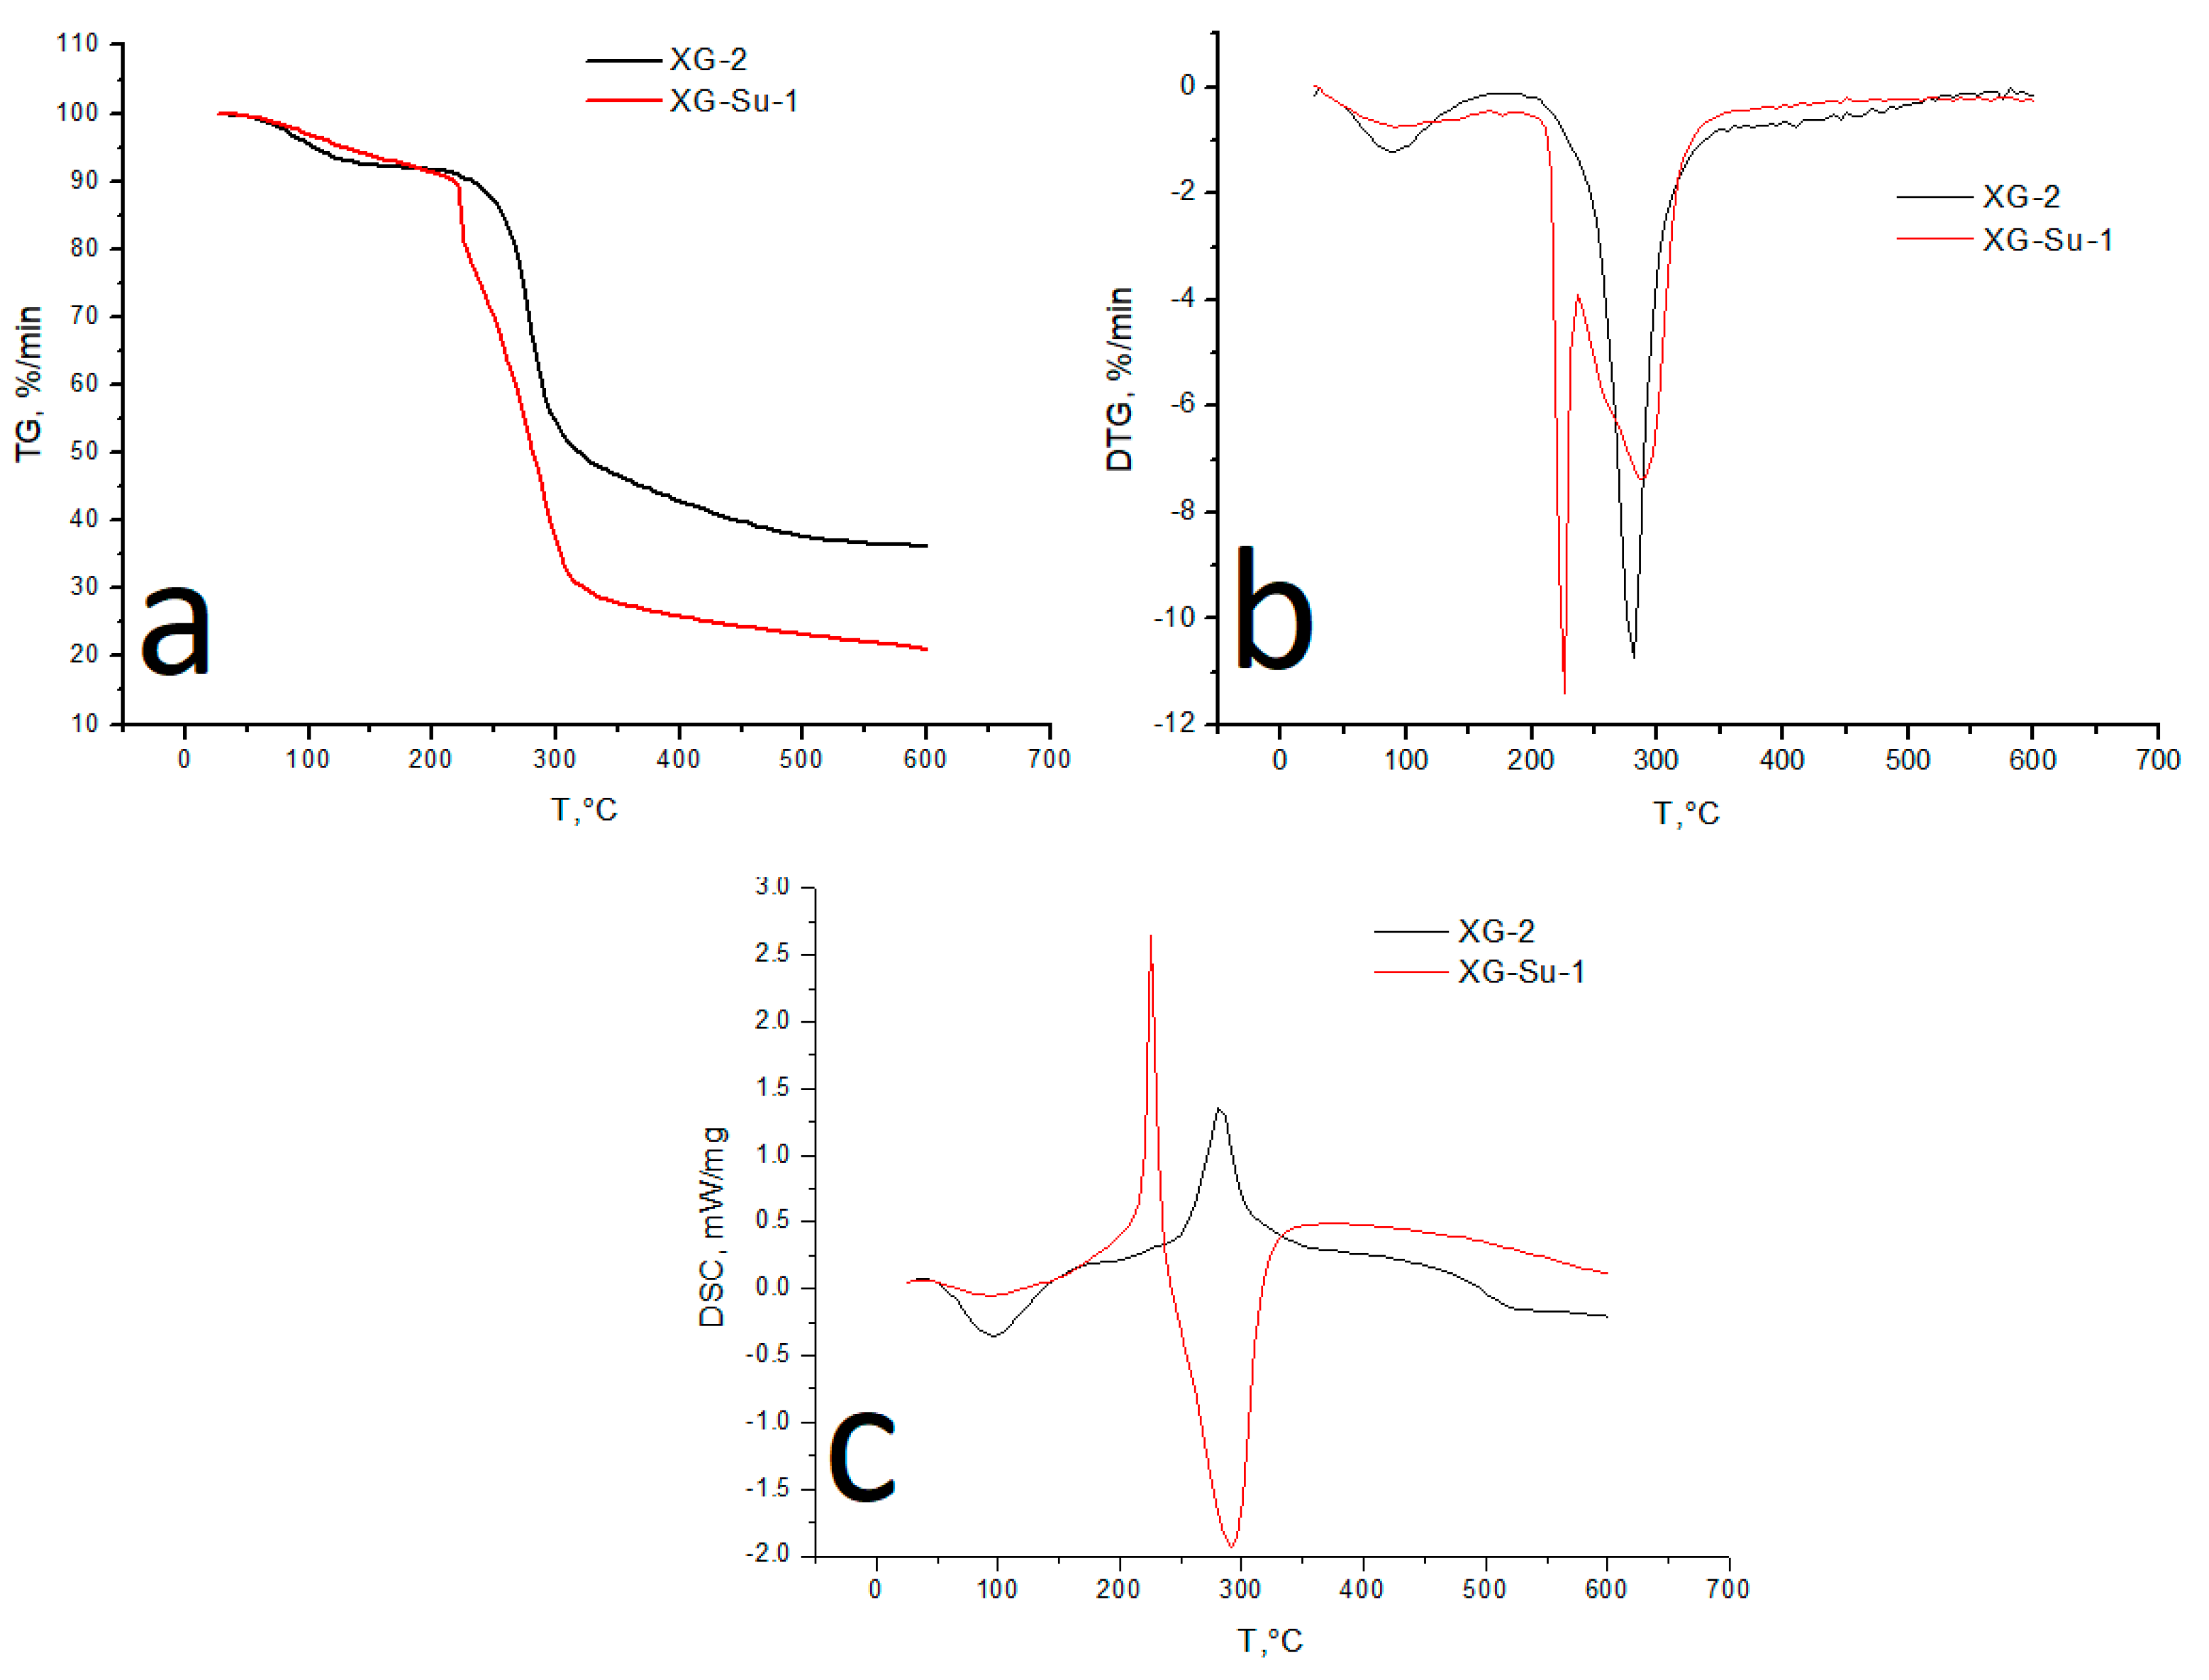
3.6. Thermal Analysis
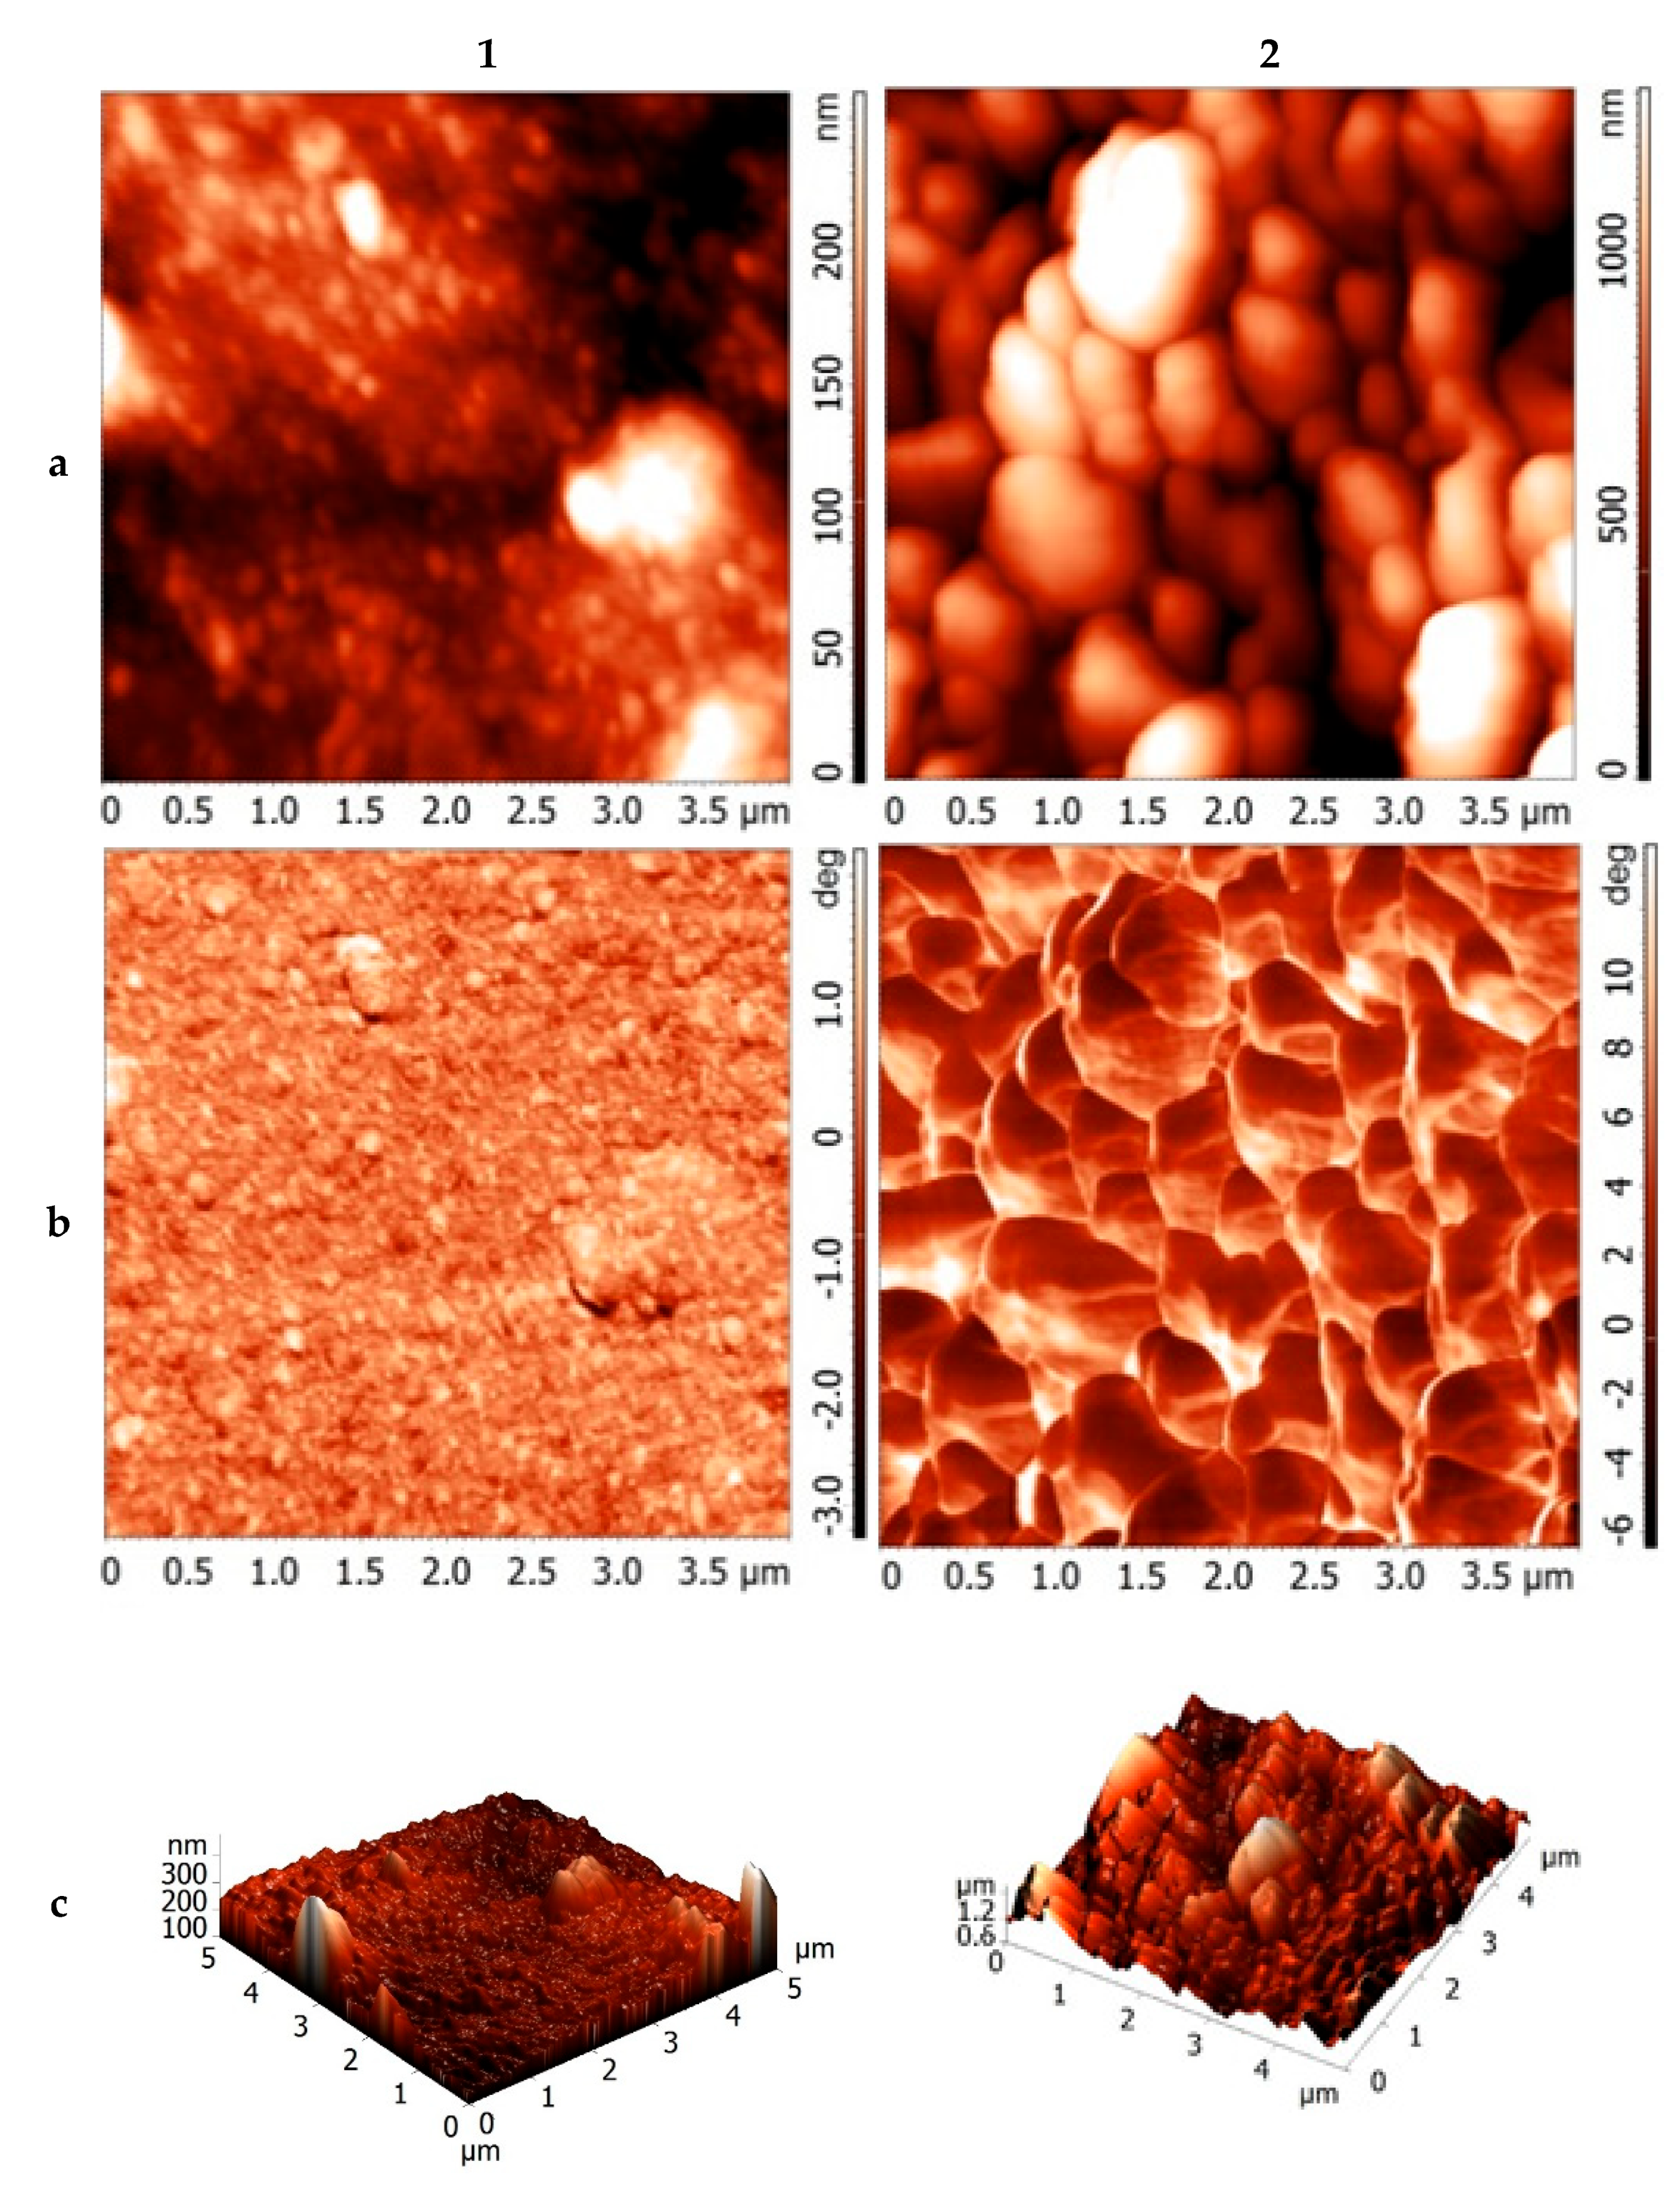
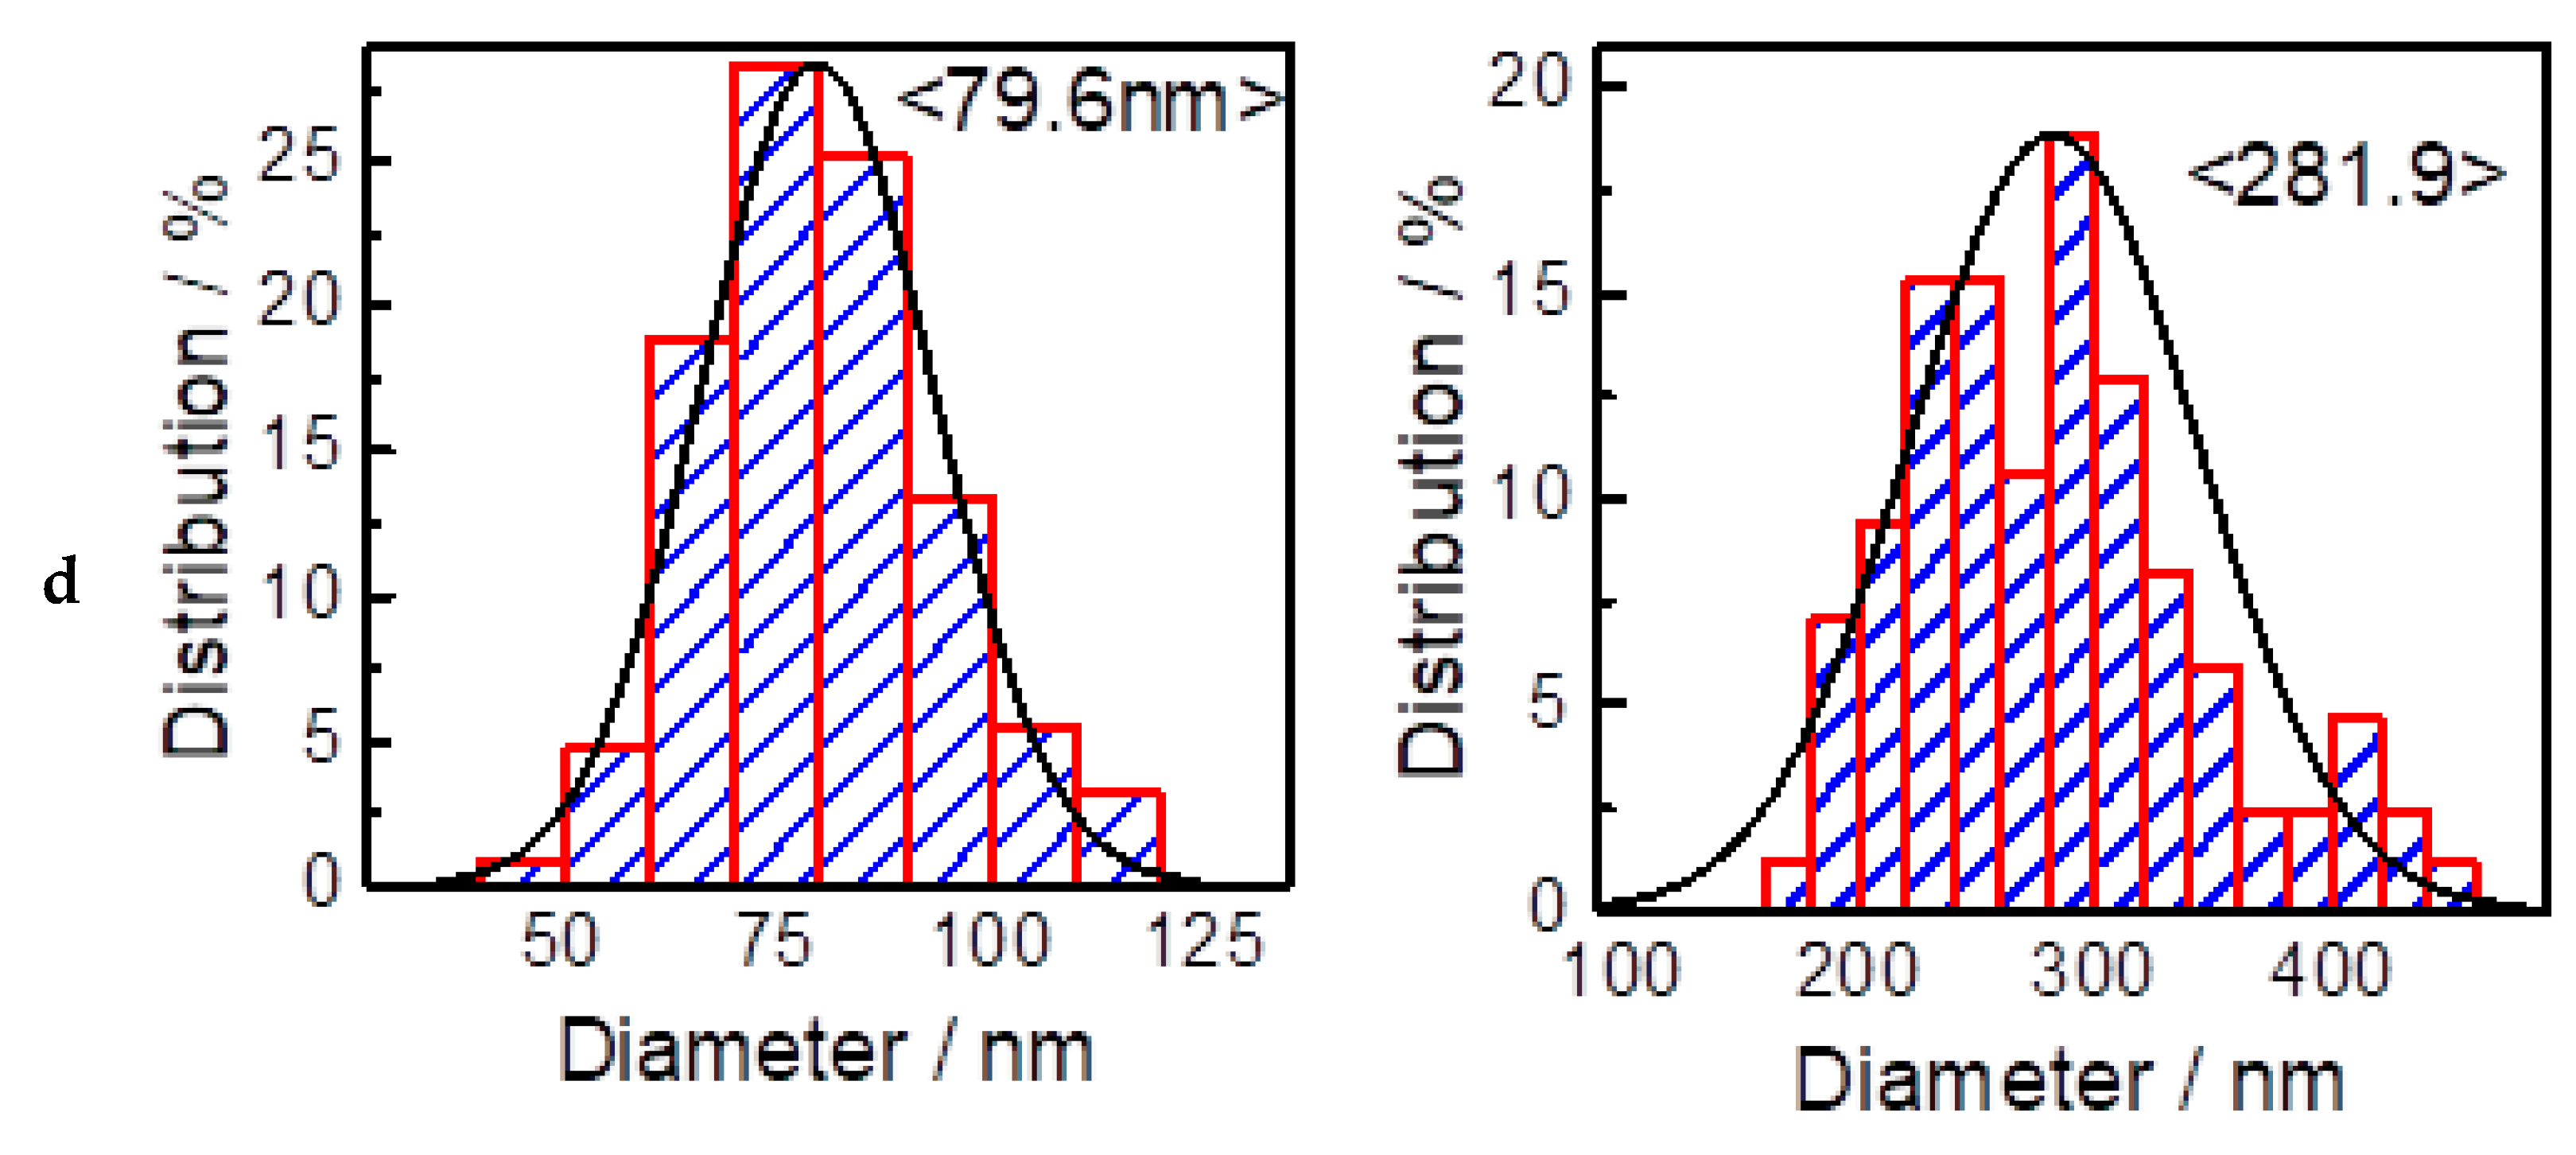
3.7. Atomic Force Microscopy
4. Conclusions
Author Contributions
Funding
Institutional Review Board Statement
Informed Consent Statement
Data Availability Statement
Acknowledgments
Conflicts of Interest
References
- Liu, J.; Willför, S.; Xu, C. A review of bioactive plant polysaccharides: Biological activities, functionalization, and biomedical applications. Bioact. Carbohydr. Diet. Fibre 2015, 5, 31–61. [Google Scholar] [CrossRef]
- Patel, J.; Maji, B.; Moorthy, N.S.H.N.; Maiti, S. Xanthan gum derivatives: Review of synthesis, properties and diverse applications. RSC Adv. 2020, 10, 27103–27136. [Google Scholar] [CrossRef]
- Merino-González, A.; Kozina, A. Influence of aggregation on characterization of dilute xanthan solutions. Int. J. Biol. Macromol. 2017, 105, 834–842. [Google Scholar] [CrossRef]
- Zhang, R.; Tao, Y.; Xu, W.; Xiao, S.; Du, S.; Zhou, Y.; Hasan, A. Rheological and controlled release properties of hydrogels based on mushroom hyperbranched polysaccharide and xanthan gum. Int. J. Biol. Macromol. 2018, 120, 2399–2409. [Google Scholar] [CrossRef] [PubMed]
- Faria, S.; Petkowicz, C.; de Morais, S.A.L.; Terrones, M.G.H.; de Resende, M.M.; de França, F.P.; Cardoso, V.L. Characterization of xanthan gum produced from sugar cane broth. Carbohydr. Polym. 2011, 86, 469–476. [Google Scholar] [CrossRef] [Green Version]
- Yahoum, M.M.; Moulai-Mostefa, N.; Le Cerf, D. Synthesis, physicochemical, structural and rheological characterizations of carboxymethyl xanthan derivatives. Carbohydr. Polym. 2016, 154, 267–275. [Google Scholar] [CrossRef]
- Hong, Z.Y.L.; Bo, F.; Xiaohui, Q.; Liwei, W.; Yuting, L.; Meng, T.; Kejing, L. Synthesis and performance evaluation of cationic xanthan gum. Oilfield Chem. 2017, 34, 34–37. [Google Scholar]
- Shi, L.; Wei, Y.; Luo, N.; Tan, T.; Cao, H. The rheological and thickening properties of cationic xanthan gum. J. Dispers. Sci. Technol. 2018, 39, 55–61. [Google Scholar] [CrossRef]
- Liu, S.; Zhang, H.; Fang, B.; Lu, Y. Preparation and Rheology Evaluation of Hydrophobic Amphoteric Xanthan Gum. Oilfield Chem. 2018, 35, 224–230. [Google Scholar]
- 1Maiti, S.; Mukherjee, S.; Datta, R. Core–shell nano-biomaterials for controlled oral delivery and pharmacodynamic activity of glibenclamide. Int. J. Biol. Macromol. 2014, 70, 20–25. [Google Scholar] [CrossRef]
- Pinto, E.; Furlan, L.; Vendruscolo, C. Chemical Deacetylation Natural Xanthan (Jungbunzlauer (R)). Polímeros 2010, 21, 47–52. [Google Scholar] [CrossRef] [Green Version]
- Qian, X.L.; Su, J.-Z.; Wu, W.-H.; Niu, C.-M. Aqueous solution viscosity properties of hydrophobically modified xanthan gum HMXG-C8. Oilfield Chem. 2007, 24, 154–157. [Google Scholar]
- Kazachenko, A.S.; Fetisova, O.Y.; Antonov, A.V.; Bondarenko, G.N.; Sychev, V.V. Synthesis and physicochemical study of xanthan butyl ether. J. Sib. Fed. Univ. Chem. 2021, 14, 137–146. [Google Scholar] [CrossRef]
- Wang, B.; Han, Y.; Lin, Q.; Liu, H.; Shen, C.; Nan, K.; Chen, H. In vitro and in vivo evaluation of xanthan gum–succinic anhydride hydrogels for the ionic strength-sensitive release of antibacterial agents. J. Mater. Chem. B 2016, 4, 1853–1861. [Google Scholar] [CrossRef]
- Gomez, C.; Rinaudo, M.; Villar, M. Oxidation of sodium alginate and characterization of the oxidized derivatives. Carbohydr. Polym. 2007, 67, 296–304. [Google Scholar] [CrossRef]
- Guo, J.M.; Ge, L.M.; Li, X.Y.; Mu, C.D.; Li, D.F. Periodate oxidation of xanthan gum and its crosslinking effects on gelatin-based edible films. Food Hydrocoll. 2014, 39, 243–250. [Google Scholar] [CrossRef]
- Paiva, D.; Gonçalves, C.; Vale, I.; Bastos, M.M.S.M.; Magalhães, F. Oxidized Xanthan Gum and Chitosan as Natural Adhesives for Cork. Polymers 2016, 8, 259. [Google Scholar] [CrossRef] [Green Version]
- Rafigh, S.M.; Soleymani, A.R.; Heydarinasab, A. Sulfated xanthan: Synthesis, characterization and biological evaluation. Polym. Bull. 2021, 78, 4899–4918. [Google Scholar] [CrossRef]
- Vasil’Eva, N.Y.; Levdansky, A.V.; Kuznetsov, B.N.; Skvortsova, G.P.; Kazachenko, A.S.; Djakovitch, L.; Pinel, C. Sulfation of arabinogalactan by sulfamic acid in dioxane. Russ. J. Bioorg. Chem. 2015, 41, 725–731. [Google Scholar] [CrossRef]
- Kazachenko, A.S.; Levdansky, V.A.; Levdansky, A.V.; Kuznetsov, B.N. Mathematical optimization of the process of birch wood xylan sulfation by sulfamic acid in N,N-dimethylformamide medium. Khimiya Rastit. Syr’ya 2021, 2, 87–94. [Google Scholar]
- Sirviö, J.A.; Ukkola, J.; Liimatainen, H. Direct sulfation of cellulose fibers using a reactive deep eutectic solvent to produce highly charged cellulose nanofibers. Cellulose 2019, 26, 2303–2316. [Google Scholar] [CrossRef] [Green Version]
- Akman, F.; Kazachenko, A.S.; Vasilyeva, N.Y.; Malyar, Y.N. Synthesis and characterization of starch sulfates obtained by the sulfamic acid-urea complex. J. Mol. Struct. 2020, 1208, 127899. [Google Scholar] [CrossRef]
- Kazachenko, A.S.; Malyar, Y.N.; Vasilyeva, N.Y.; Bondarenko, G.N.; Korolkova, I.V.; Antonov, A.V.; Karacharov, A.A.; Fetisova, O.Y.; Skvortsova, G.P. «Green» synthesis and characterization of galactomannan sulfates obtained using sulfamic acid. Biomass Convers. Biorefin. 2020, 1–10. [Google Scholar] [CrossRef]
- Pen, R.Z. Planning an Experiment at Statgraphics Centurion; SibSTU: Krasnoyarsk, Russia, 2014; p. 293. [Google Scholar]
- Kazachenko, A.S.; Vasilyeva, N.Y.; Sudakova, I.G.; Levdansky, V.A.; Lutoshkin, M.A.; Kuznetsov, B.N. Numerical Optimization of the Abies Ethanol Lignin Sulfation Process with Sulfamic Acid in 1,4-Dioxane Medium in the Presence of Urea. J. Sib. Fed. Univ. Chem. 2020, 232–246. [Google Scholar] [CrossRef]
- Kazachenko, A.S.; Malyar, Y.N.; Vasilyeva, N.Y.; Borovkova, V.S.; Issaoui, N. Optimization of guar gum galactomannan sulfation process with sulfamic acid. Biomass Convers. Biorefin. 2021, 1–10. [Google Scholar] [CrossRef]
- Levdansky, V.A.; Vasilyeva, N.Y.; Malyar, Y.N.; Levdansky, A.V.; Kondrasenko, A.A.; Kazachenko, A.S.; Kuznetsov, B.N. Sulfation of ethanol lignin of abies wood by sulfamic acid in N,N-dimethylformamide medium. Biomass Convers. Biorefin. 2020, 1–8. [Google Scholar] [CrossRef]
- Kuznetsov, B.N.; Vasilyeva, N.Y.; Kazachenko, A.S.; Levdansky, V.A.; Kondrasenko, A.A.; Malyar, Y.N.; Skvortsova, G.P.; Lutoshkin, M.A. Optimization of the process of abies ethanol lignin sulfation by sulfamic acid–urea mixture in 1,4-dioxane medium. Wood Sci. Technol. 2020, 54, 365–381. [Google Scholar] [CrossRef]
- Levdansky, A.V.; Vasilyeva, N.Y.; Kondrasenko, A.A.; Levdansky, V.A.; Malyar, Y.N.; Kazachenko, A.S.; Kuznetsov, B.N. Sulfation of arabinogalactan with sulfamic acid under homogeneous conditions in dimethylsulfoxide medium. Wood Sci. Technol. 2021. [Google Scholar] [CrossRef]
- Kazachenko, A.; Akman, F.; Medimagh, M.; Issaoui, N.; Vasilieva, N.; Malyar, Y.N.; Sudakova, I.G.; Karacharov, A.; Miroshnikova, A.; Al-Dossary, O.M. Sulfation of Diethylaminoethyl-Cellulose: QTAIM Topological Analysis and Experimental and DFT Studies of the Properties. ACS Omega. 2021, 6, 22603–22615. [Google Scholar] [CrossRef]
- Malyar, Y.N.; Kazachenko, A.; Vasilyeva, N.Y.; Fetisova, O.Y.; Borovkova, V.; Miroshnikova, A.; Levdansky, A.; Skripnikov, A. Sulfation of wheat straw soda lignin: Role of solvents and catalysts. Catal. Today 2021, in press. [Google Scholar] [CrossRef]
- Kazachenko, A.S.; Akman, F.; Abdelmoulahi, H.; Issaoui, N.; Malyar, Y.N.; Al-Dossary, O.; Wojcik, M.J. Intermolecular hydrogen bonds interactions in water clusters of ammonium sulfamate: FTIR, X-ray diffraction, AIM, DFT, RDG, ELF, NBO analysis. J. Mol. Liq. 2021, 342, 117475. [Google Scholar] [CrossRef]
- Kazachenko, A.S.; Akman, F.; Malyar, Y.N.; Issaoui, N.; Vasilieva, N.Y.; Karacharov, A.A. Synthesis optimization, DFT and physicochemical study of chitosan sulfates. J. Mol. Struct. 2021, 1245, 131083. [Google Scholar] [CrossRef]
- Kuruvilla, T.K.; Muthu, S.; Prasana, J.C.; George, J.; Sevvanthi, S. Spectroscopic (FT-IR, FT-Raman), quantum mechanical and docking studies on methyl[(3S)-3-(naphthalen-1-yloxy)-3-(thiophen-2-yl)propyl]amine. J. Mol. Struct. 2019, 1175, 163–174. [Google Scholar] [CrossRef]
- Fathima, R.B.; Prasana, J.C.; Muthu, S.; Abraham, C.S. Molecular docking studies, charge transfer excitation and wave function analyses (ESP, ELF, LOL) on valacyclovir: A potential antiviral drug. Comput. Biol. Chem. 2019, 78, 9–17. [Google Scholar] [CrossRef]
- Muthu, S.; Renuga, S. Vibrational spectra and normal coordinate analysis of 2-hydroxy-3-(2-methoxyphenoxy) propyl carbamate. Spectrochim. Acta Part A Mol. Biomol. Spectrosc. 2014, 132, 313–325. [Google Scholar] [CrossRef]
- Pandey, M.; Muthu, S.; Gowda, N.N. Quantum mechanical and spectroscopic (FT-IR, FT-Raman,1H,13C NMR, UV-Vis) studies, NBO, NLO, HOMO, LUMO and Fukui function analysis of 5-Methoxy-1H-benzo[d]imidazole-2(3H)-thione by DFT studies. J. Mol. Struct. 2017, 1130, 511–521. [Google Scholar] [CrossRef]
- Al-Horani, R.A.; Desai, U.R. Chemical sulfation of small molecules—Advances and challenges. Tetrahedron 2010, 66, 2907–2918. [Google Scholar] [CrossRef] [PubMed] [Green Version]
- Spillane, W.; Malaubier, J.-B. Sulfamic Acid and Its N- and O-Substituted Derivatives. Chem. Rev. 2014, 114, 2507–2586. [Google Scholar] [CrossRef] [PubMed]
- Kuznetsov, B.N.; Vasilyeva, N.Y.; Kazachenko, A.S.; Skvortsova, G.P.; Levdansky, V.A.; Lutoshkin, M.A. Development of the method of Abies Wood ethanol lignin sulfation using sulfamic acid. J. Sib. Fed. Univ. Chem. 2018, 1, 122–130. [Google Scholar]
- Kuznetsov, B.; Levdansky, V.; Kuznetsova, S.; Garyntseva, N.; Sudakova, I.; Levdansky, A. Integration of peroxide delignification and sulfamic acid sulfation methods for obtaining cellulose sulfates from aspen wood. Holz Als Roh Und Werkst. 2017, 76, 999–1007. [Google Scholar] [CrossRef] [Green Version]
- Volkov, V.A.; Suchkov, V.V. Sulfated Nonionic Surfactants (Rus); NITK: Karnataka, India, 1976; p. 65. [Google Scholar]
- Kazachenko, A.S.; Malyar, Y.N.; Vasilyeva, N.Y.; Fetisova, O.Y.; Chudina, A.I.; Sudakova, I.G.; Antonov, A.V.; Borovkova, V.S.; Kuznetsova, S.A. Isolation and sulfation of galactoglucomannan from larch wood (Larix sibirica). Wood Sci. Technol. 2021, 55, 1091–1107. [Google Scholar] [CrossRef]
- Kazachenko, A.S.; Vasilyeva, N.Y.; Malyar, Y.N.; Kazachenko, A.S. Mathematical Optimization, the Effect of the Catalyst and Solvent on the Process of Starch Sulfation with Sulfamic Acid. Lect. Notes Netw. Syst. 2021, 230, 1–8. [Google Scholar]
- Akman, F.; Issaoui, N.; Kazachenko, A.S. Intermolecular hydrogen bond interactions in the thiourea/water complexes (Thio-(H2O)n) (n = 1, …, 5): X-ray, DFT, NBO, AIM, and RDG analyses. J. Mol. Model. 2020, 26, 1–16. [Google Scholar] [CrossRef] [PubMed]
- Yokoya, M.; Kimura, S.; Yamanaka, M. Urea Derivatives as Functional Molecules: Supramolecular Capsules, Supramolecular Polymers, Supramolecular Gels, Artificial Hosts, and Catalysts. Chemistry 2020, 27, 5601–5614. [Google Scholar] [CrossRef] [PubMed]
- Civera, C.; del Valle, J.C.; Elorza, M.A.; Elorza, B.; Arias, C.; Díaz-Oliva, C.; Catalán, J.; Blanco, F.G. Solvatochromism in urea/water and urea-derivative/water solutions. Phys. Chem. Chem. Phys. 2020, 22, 25165–25176. [Google Scholar] [CrossRef]
- Johny, L.C.; Kudre, T.G.; Suresh, P.V. Production of egg white hydrolysate by digestion with pineapple bromelain: Optimization, evaluation and antioxidant activity study. J. Food Sci. Technol. 2021, 1–12. [Google Scholar] [CrossRef]
- Osiro, D.; Franco, R.W.A.; Colnago, L.A. Spectroscopic characterization of the exopolysaccharide of Xanthomonas axonopodis pv. citri in Cu2+ resistance mechanism. J. Braz. Chem. Soc. 2011, 22, 1339–1345. [Google Scholar] [CrossRef] [Green Version]
- Tang, S.; Wang, T.; Huang, C.; Lai, C.; Fan, Y.; Yong, Q. Sulfated modification of arabinogalactans from Larix principis-rupprechtii and their antitumor activities. Carbohydr. Polym. 2019, 215, 207–212. [Google Scholar] [CrossRef]
- Wang, Z.; Wu, J.; Zhu, L.; Zhan, X. Characterization of xanthan gum produced from glycerol by a mutant strain Xanthomonas campestris CCTCC M2015714. Carbohydr. Polym. 2017, 157, 521–526. [Google Scholar] [CrossRef]
- Bouaziz, F.; Koubaa, M.; Barba, F.J.; Roohinejad, S.; Chaabouni, S.E. Antioxidant Properties of Water-Soluble Gum from Flaxseed Hulls. Antioxidants 2016, 5, 26. [Google Scholar] [CrossRef] [Green Version]
- Santoshi Kumari, A.; Venkatesham, M.; Ayodhya, D.; Veerabhadram, G. Green synthesis, characterization and catalytic activity of palladium nanoparticles by xanthan gum. Appl. Nanosci. 2015, 5, 315–320. [Google Scholar] [CrossRef] [Green Version]
- Hazirah, M.N.; Isa, M.I.N.M.; Sarbon, N. Effect of xanthan gum on the physical and mechanical properties of gelatin-carboxymethyl cellulose film blends. Food Packag. Shelf Life 2016, 9, 55–63. [Google Scholar] [CrossRef]
- Lad, M.; Todd, T.; Morris, G.; MacNaughtan, W.; Sworn, G.; Foster, T. On the origin of sharp peaks in the X-ray diffraction patterns of xanthan powders. Food Chem. 2013, 139, 1146–1151. [Google Scholar] [CrossRef] [PubMed]
- Šimkovic, I.; Tracz, A.; Kelnar, I.; Uhliariková, I.; Mendichi, R. Quaternized and sulfated xylan derivative films. Carbohydr. Polym. 2014, 99, 356–364. [Google Scholar] [CrossRef]
- Kazachenko, A.S.; Akman, F.; Sagaama, A.; Issaoui, N.; Malyar, Y.N.; Vasilieva, N.Y.; Borovkova, V.S. Theoretical and experimental study of guar gum sulfation. J. Mol. Model. 2021, 27, 1–15. [Google Scholar] [CrossRef] [PubMed]
- Kolsi, R.B.A.; Ben Salah, H.; Jardak, N.; Chaaben, R.; Jribi, I.; El Feki, A.; Rebai, T.; Jamoussi, K.; Allouche, N.; Blecker, C.; et al. Sulphated polysaccharide isolated from Sargassum vulgare: Characterization and hypolipidemic effects. Carbohydr. Polym. 2017, 170, 148–159. [Google Scholar] [CrossRef] [PubMed]
- Chen, P.; Xu, Y.; Yang, S.; Chang, Q.; Zheng, B.; Zhang, Y.; Hu, X.; Zeng, H. Application of X-ray diffraction and energy dispersive spectroscopy in the isolation of sulfated polysaccharide from Porphyra haitanensis and its antioxidant capacity under in vitro digestion. J. Sci. Food Agric. 2021. [Google Scholar] [CrossRef]
- Kong, L.; Yu, L.; Feng, T.; Yin, X.; Liu, T.; Dong, L. Physicochemical characterization of the polysaccharide from Bletilla striata: Effect of drying method. Carbohydr. Polym. 2015, 125, 1–8. [Google Scholar] [CrossRef]
- Dang, Z.; Feng, D.; Liu, X.; Yang, T.; Guo, L.; Liang, J.; Liang, J.; Hu, F.; Cui, F.; Feng, S. Structure and antioxidant activity study of sulfated acetamido-polysaccharide from Radix Hedysari. Fitoterapia 2013, 89, 20–32. [Google Scholar] [CrossRef]
- Wang, J.; Bao, A.; Meng, X.; Guo, H.; Zhang, Y.; Zhao, Y.; Kong, W.; Liang, J.; Yao, J.; Zhang, J. An efficient approach to prepare sulfated polysaccharide and evaluation of anti-tumor activities in vitro. Carbohydr. Polym. 2018, 184, 366–375. [Google Scholar] [CrossRef]
- Caputo, H.; Straub, J.E.; Grinstaff, M.W. Design, synthesis, and biomedical applications of synthetic sulphated polysaccharides. Chem. Soc. Rev. 2019, 48, 2338–2365. [Google Scholar] [CrossRef] [PubMed]
- Muthukumar, J.; Chidambaram, R.; Sukumaran, S. Sulfated polysaccharides and its commercial applications in food industries—A review. J. Food Sci. Technol. 2021, 58, 2453–2466. [Google Scholar] [CrossRef] [PubMed]
- Slyusarenko, N.V.; Vasilyeva, N.Y.; Kazachenko, A.S.; Gerasimova, M.A.; Romanchenko, A.S.; Slyusareva, E.A. Synthesis and Properties of Interpolymer Complexes Based on Chitosan and Sulfated Arabinogalactan. Polym. Sci. Ser. B 2020, 62, 272–278. [Google Scholar] [CrossRef]


| No. | Activator | Formula | Sulfur Content % wt. |
|---|---|---|---|
| 1 | Without activator | - | 3.2 |
| 2 | Urea |  | 13.5 |
| 3 | Methyl urea |  | 8.7 |
| 4 | Ethyl urea |  | 7.9 |
| 5 | Hydroxyethyl urea |  | 7.3 |
| Factors and Parameters | Notation in Equations | Range of Variation |
|---|---|---|
| Amount of sulfating complex, mmol | X1 | 1.5–3.5 |
| Temperature, °C | X2 | 75–85 |
| Duration of process, h | X3 | 0.5–3.0 |
| Sulfur content, wt% | Y1 | - |
| No. | Sulfating Complex Amount, mmol | Temperature, °C | Duration of Process, h | Sulfur Content, wt% |
|---|---|---|---|---|
| 1 | 2.5 | 80 | 1.75 | 9.1 |
| 2 | 1.5 | 70 | 1.75 | 5.1 |
| 3 | 3.5 | 70 | 1.75 | 8.8 |
| 4 | 1.5 | 90 | 1.75 | 8.2 |
| 5 | 3.5 | 90 | 1.75 | 13.5 |
| 6 | 1.5 | 80 | 0.5 | 3.7 |
| 7 | 3.5 | 80 | 0.5 | 7.3 |
| 8 | 2.5 | 80 | 1.75 | 9.4 |
| 9 | 1.5 | 80 | 3 | 8.1 |
| 10 | 3.5 | 80 | 3 | 10.2 |
| 11 | 2.5 | 70 | 0.5 | 4.0 |
| 12 | 2.5 | 90 | 0.5 | 7.4 |
| 13 | 2.5 | 70 | 3 | 8.7 |
| 14 | 2.5 | 90 | 3 | 11.1 |
| 15 | 2.5 | 80 | 1.75 | 9.2 |
| Sources of Variance | Statistical Characteristics | |
|---|---|---|
| F-Ratio | p-Value | |
| X1 X2 X3 X12 X1X2 X1X3 X22 X2X3 X33 | 65.59 56.14 74.81 1.46 1.55 1.37 0.04 0.61 20.28 | 0.0005 0.0007 0.0003 0.2803 0.2678 0.2952 0.8404 0.4712 0.0064 |
| Df R2 R2adj | 14 97.8 93.8 | |
| Samples | Mn, Da | Mw, Da | PD |
|---|---|---|---|
| Xanthan | 83,412 | 620,439 | 7.44 |
| Sulfated xanthan | 261,497 | 611,935 | 2.34 |
Publisher’s Note: MDPI stays neutral with regard to jurisdictional claims in published maps and institutional affiliations. |
© 2021 by the authors. Licensee MDPI, Basel, Switzerland. This article is an open access article distributed under the terms and conditions of the Creative Commons Attribution (CC BY) license (https://creativecommons.org/licenses/by/4.0/).
Share and Cite
Kazachenko, A.S.; Vasilieva, N.Y.; Borovkova, V.S.; Fetisova, O.Y.; Issaoui, N.; Malyar, Y.N.; Elsuf’ev, E.V.; Karacharov, A.A.; Skripnikov, A.M.; Miroshnikova, A.V.; et al. Food Xanthan Polysaccharide Sulfation Process with Sulfamic Acid. Foods 2021, 10, 2571. https://doi.org/10.3390/foods10112571
Kazachenko AS, Vasilieva NY, Borovkova VS, Fetisova OY, Issaoui N, Malyar YN, Elsuf’ev EV, Karacharov AA, Skripnikov AM, Miroshnikova AV, et al. Food Xanthan Polysaccharide Sulfation Process with Sulfamic Acid. Foods. 2021; 10(11):2571. https://doi.org/10.3390/foods10112571
Chicago/Turabian StyleKazachenko, Aleksandr S., Natalya Yu. Vasilieva, Valentina S. Borovkova, Olga Yu. Fetisova, Noureddine Issaoui, Yuriy N. Malyar, Evgeniy V. Elsuf’ev, Anton A. Karacharov, Andrey M. Skripnikov, Angelina V. Miroshnikova, and et al. 2021. "Food Xanthan Polysaccharide Sulfation Process with Sulfamic Acid" Foods 10, no. 11: 2571. https://doi.org/10.3390/foods10112571