Article

Research Productivity in Emerging Economies: Empirical Evidence from Kazakhstan

Business School, Kazakh British Technical University, Almaty 050000, Kazakhstan
*
Author to whom correspondence should be addressed.
Publications 2021, 9(4), 51; https://doi.org/10.3390/publications9040051
Submission received: 1 September 2021 / Revised: 23 October 2021 / Accepted: 3 November 2021 / Published: 5 November 2021
(This article belongs to the Special Issue Modern Problems of Scientometric Assessment of Publication Activity)

Abstract

:
The growth of the Higher Education and Science (HES) sector is positively associated with its research productivity and has a high potential in emerging countries. To explore such research productivity, this study offers a comprehensive analysis of the scientific literature from Kazakhstan. Our methods included descriptive analysis, network analysis, and author-based productivity analysis (by Lotka’s law) of 23,371 articles from Scopus, published during 1991–2020, and across 25 subject areas. The results of the descriptive analysis showed a substantial increase in the number of and citations to the literature since 2011 in almost all subject areas. However, the network analysis found that research in natural sciences was more developed in topical relationships and international collaborations than research in arts and humanities, social, and medical sciences. The Lotka’s law application revealed that the overall scientific literature in Kazakhstan did not reach its necessary stage of maturity. Additionally, some subject areas demonstrated greater contribution to the overall knowledge base, while others were less productive or lagging in their development. Our findings, useful for researchers and policymakers in emerging countries, can be exemplary in understanding the results of policy reforms aimed to improve the HES sector in emerging countries.

1. Introduction

The growth of educational and scientific performance is positively associated with the research productivity of a country and contributes to its economic development [1]. One of the crucial reforms that post-Soviet countries undertook in the Higher Education and Science (HES) sector was the financing of the local science and its integration into the international scientific community [2,3]. Among these countries, Kazakhstan is one of the few that has built a relatively robust research infrastructure, including support through grants, access of researchers to research mobility programs, earlier application of the Bologna processes, and other measures to increase its research performance indicators [3]. In turn, such measures have resulted in the improved scientific engagement of local researchers in the international arena [4]. This has all led to increased research published in international peer-reviewed outlets, improved productivity of the local researchers, and raised the scientometric indexes of the country.
A few studies have analyzed the development and trends in research productivity in the HES sector using scientometric approaches in Kazakhstan. To reveal issues related to research productivity and science in selected post-Soviet countries, Suleymenov et al. [5], using publication records in Scopus, performed several types of analysis. They analyzed trends in seven selected research areas with most publications and identified development trends for the Commonwealth of Independent States (CIS) member countries. The CIS members are nine countries: Armenia, Azerbaijan, Belarus, Kazakhstan, Kyrgyzstan, Moldova, Russia, Tajikistan, and Uzbekistan. They revealed the citation rate per paper, average citation rate, publication rate per 10,000 people, and the potential growth for Kazakhstan and other CIS countries compared to the global level. Kuzhabekova and Lee [1] assessed 361 publications to identify available contributions of international faculty employed at the Kazakhstani universities and how they contribute to local research capacity building. Using a combination of bibliometric, social network analysis, and content analysis methods, they found the growing role of global research networks, knowledge development, and research dissemination in the HES sector in the country. Focusing on management literature, Narbaev [6] assessed the productivity of the project management discipline in the country through the application of a co-word analysis on 826 articles sourced from Scopus. The network analysis was applied to visualize the scientometric trends in this field. He found that project management research in the country was in its infancy stage and was correlated to the project orientation of the society.
Applications of scientometric methods to analyze growing literature and research productivity have been gaining researchers’ interest on the global scale. For example, to examine publication patterns of Brazil, Russia, India, and China (BRIC countries), Guevara and Mendoza [7] used a network analysis technique and built maps of authors collaboration and subject area interaction. They revealed that China and Russia are the top publishers of scientific literature and more specialized in physics and astronomy. Brazil was the most collaborative country with a developing economy, while India was grouped with the developed countries and had a more diversified network of research areas. Hinojo-Lucena et al. [8] used several bibliometric tools to evaluate the impact of artificial intelligence (A.I.) in higher education globally. They applied widely used scientometric methods, such as the Price law and Lotka’s law, on the dataset of 132 articles and revealed that A.I. applications and the associated research were growing in the field. Applying productivity analysis, collaboration analysis, and citation analysis methods, Macchi Silva et al. [9] examined more than 700 papers on the competence-based management literature sourced from the Web of Science and Scopus databases. Their findings showed that collaborations between researchers did not necessarily lead to strong co-authorships and that the most cited papers were in diverse areas of the literature, implying the interdisciplinary landscape of the competence-based management literature.
The major findings of the above studies stress the importance of using scientometric approaches to investigate research trends and productivity in a country’s HES sector. Country-wide scientometric studies contribute to understanding a growing body of knowledge and decision-making for its effective research policy [10,11,12]. On the one hand, the studies show that various methods to analyze research productivity exist and that some countries lack applications of advanced scientometric tools. On the other hand, a wide variety of scientometric methods are available that could be used to study research productivity and development trends.
The current state of the scientometric literature shows a lack of studies dedicated to analyzing scholarly literature and research productivity in Kazakhstan, including applications of methods and techniques available for such scientometric studies. To fill this research gap, in this study, we aim to reveal scientific trends and analyze the research productivity of Kazakhstan and provide implications for science management in emerging countries. Using data from 23,371 articles sourced from Scopus and published during 1991–2020, we conduct descriptive analysis, network analysis, and author-based research productivity analysis of the country’s scientific potential. These analyses are performed both at the country level and across numerous subject areas of the collected articles.
The remainder of our paper is structured as follows. Next, we introduce the dataset collected and three types of analytical methods applied. Then, we report and discuss our detailed results. Lastly, we summarize our study with a discussion of significant findings, research limitations, and contributions to the body of knowledge.

2. Materials and Methods

Table 1 presents an outline of our research methodology. We followed a general approach of a review study, applicable also for scientometric research, established by the PRISMA declaration [13]. The scientometric methods used for descriptive analysis, network analysis, and author-based research productivity analysis in this study are similar to those used in previous research [8,14,15].

2.1. Materials Collection and Their Screening

In Step 1 of our methodology (Table 1), we limited our search to articles in English and published in peer-reviewed journals indexed in Scopus. We looked for articles where at least one of the co-author’s affiliation was Kazakhstan. Our search covered the period from 1991 (which marks the independence of Kazakhstan) to 2020.
In Scopus, we used its advanced search function using a field code “AFFILCOUNTRY(KAZAKHSTAN)”. Further, we applied the following filters: year of publication (1991–2020), document type (article and review), source type (journal), and language (English). This search resulted in an initial set of 24,284 articles by 156,405 authors with titles, abstracts, keywords, and bibliographic details. Using the subject area category function of Scopus, we grouped all the articles into 27 subject areas. Then, we excluded 2 subject areas: Dentistry as all authors had published only one article, and Multidisciplinary as it was unrelated to a specific research field. This screening resulted in 23,371 articles by 150,708 authors and representing 25 subject areas. Lastly, we exported our dataset from Scopus in a tab-delimited CSV format and utilized it to conduct the analyses in Steps 2 through 4 (Table 1).

2.2. Methods

2.2.1. Descriptive Analysis

In Step 2 of our methodology, we conducted a descriptive analysis of the articles to identify the overall research trends and productivity in Kazakhstan. This involved the analysis of the distribution of the articles by year of publication, the number of articles, etc., which are presented in Table 1 [16,17]. In the literature, similar studies used such a descriptive analysis on Brazilian scientific output [18], understanding the impact of sustainability performance indicators [19], and introduced a framework to assess the productivity of a research area [20]. In addition to this analysis, based on the bibliographic details of the articles, we performed an analysis of publishers, collaborating countries, and funding sponsors of science.

2.2.2. Network Analysis

The scientometrics research is linked to data visualization [21]. One of the methods to visualize trends in a given research area is a network analysis [22]. This analysis refers to using a network of closely related attributes, such as keywords co-occurrence analysis. A keyword is a critical attribute of a publication that may represent a research topic, and it provides essential information about research trends in a field [23,24]. In our study, a keyword co-occurrence network was built to represent topics, identify the relationships between these topics, and define clusters of closely related topics within a subject area (Step 3 in Table 1). This type of analysis demonstrates the interaction within and between clusters based on keywords in each subject area. A cluster represents a collection of closely related elements (topics) that are homogeneous [25]. In this study, each constructed network represented a subject area (defined by Scopus classification). Each network had several clusters to represent closely related topics. In order to build such networks, we used the VOSViewer package. To perform this technical task, we downloaded the articles from Scopus for each subject area separately and constructed the networks with clusters using the co-word analysis function of VOSViewer. This function is performed using keywords extracted from the Scopus database and applies a counting method in the VOSViewer. The counting method is “full counting” where each keyword has the same weight, without any influence on the number of keywords for each article. Given that some subject areas had a scarcity of articles (with only a few keywords) affiliated with Kazakhstan, we kept the minimum number of co-occurrences for a keyword as 1.

2.2.3. Author-Based Research Productivity Analysis

An analysis of a country’s research productivity is as critical as an assessment of publication and topical trends for a given research field. It is reflected by the number of publications scholars contribute to an overall knowledge base within a specific time frame [26]. Several methods are available to evaluate author-based research productivity, including Lotka’s law [27,28].
In Step 4 (Table 1), we used this law to assess the scholarly productivity of the researchers from Kazakhstan and to evaluate the relative productivity (development) of 25 subject areas. Lotka’s law uses the number of articles and the number of authors in a given subject area and presents the frequency of publication by authors for this area [29]. It is defined as per Equation (1).
f ( x ) = k / x n ,
where f(x) calculates the number of authors contributing x articles each, x is the number of articles by an author, k is a given constant which represents the number of authors who published only one article, and n is the parameter which represents the distribution of the research productivity (articles) by all authors.
In this equation, theoretically, the n-parameter is equal to about 2. If so, according to this law, about 60% of all authors in a given subject area make a single contribution (represented by the k-constant as 0.60), about 25% (1/2^2), 2 contributions, about 11% (1/3^2), 3 contributions, etc. [30,31]. The relationship between the n-parameter and k-constant implies that the number of scholars publishing a given number of articles is fixed to the number of scholars publishing only one article. In the literature, Voos [32] applied Lotka’s law in the information science literature and found that the n-parameter was 3.5. Pao [33] empirically tested this law on the number of research fields and determined that the parameter value ranged from 1.8 to 3.8. Therefore, the case with the n-parameter equal to about 2 is considered a generalization [30,34]. It is regarded that those subject areas with higher n-parameter values are less developed (less maturely represented by fewer researchers), while subject areas with lower n-parameter values are more established (more maturely represented by more researchers).
In this study, we applied Lotka’s law to evaluate the country’s research productivity and calculated the values for the n-parameter and k-constant for all 25 subject areas.
We should note that deciding on which subject areas to analyze has been a long process of learning and trying. The main concern was that Lotka’s law has been primarily applied in engineering and I.T. fields or has rarely been used for several subject areas at once. Initially, we took only a few of the most representative subject areas by the highest number of published articles. However, selecting such subject areas does not mean that the remaining areas are not essential or productive. Moreover, we aimed to reveal the overall trend in the country, which would serve as exemplary for other emerging economies. This was not limited to a few subject areas. Therefore, after a thorough review of the reported literature on using Lotka’s law in different fields and countries, we kept all 25 subject areas defined by Scopus. For this, we downloaded the articles from Scopus in a tab-delimited CSV format into VosViewer. Then, we calculated the number of authors and the number of articles they published by simple counting for each subject area. Lastly, we applied Lotka’s law on Excel to analyze the author-based research productivity.

3. Results and Discussion

3.1. Descriptive Analysis

In this section, we report and discuss the results of our descriptive analysis (Step 2 in Table 1). Figure 1 shows the pattern of published articles from Kazakhstan during 1991–2020. Overall, the trend in the publications was unnoticeable in the first half of the 1990s. During 1996–2010, the research output was about 237.5 articles per year with no apparent changes in the number of publications. However, we can see a stable increase since 2011, with a rate of about 32.0 percent per year. Such an increase is the result of the implementation of a number of essential policies and laws in the HES sector. These include the State Program of Educational Development (2011–2020), the Law on Science (2011), the Law on Commercialization (2015), and the State Program for Education and Science Development (2016–2019). For example, the Law on Science was enacted to reevaluate new scientific directions, improve publication quality, and set standards for awarding academic degrees and titles [35,36]. Additionally, the State Programs (2011–2020, 2016–2019) set key targets relevant to the country’s research performance and contributed to its productivity. Some critical targets are the increase in the number of the local HES institutions in the global Quacquarelli Symonds (Q.S.) World University ranking (2 institutions were in the 2015 ranking, 10 in the 2020 ranking); the percentage of academic staff who publish in non-zero impact factor journals (the target of 3.25% for 2015 was achieved in advance in 2013); and the percent of academic staff who engage in research (8% was in 2011, 27% in 2014) [37]. Other requirements established in 2012 include publishing at least one paper in a journal with the two-year journal impact factor being above zero or indexed in Scopus (to award a Ph.D. degree) and publishing at least two and three articles in journals with a journal impact factor of above zero (to award associate professor and professor titles, respectively) [35]. Additionally, the grant funding scheme by the Ministry of Education and Science started considering the quantity and quality of the applicant’s publications in international journals indexed in the Web of Science or Scopus databases. Based on such policies that promote an increase in the quantity and quality of publications from the local researchers, we can expect that the growth of articles in international journals will continue in the near future.
Table 2 represents a summary of the descriptive analysis for all subject areas. About 11% of all articles were published in Physics and Astronomy, while about 9% were in Social Sciences. A few areas have more than 5% of the articles published—Engineering, Chemistry, Biochemistry, Genetics and Molecular biology, Material Sciences, and Mathematics. This finding demonstrates the high productivity rate of these seven subject areas compared to the others and shows the solid contribution of their authors. Additionally, the overall contribution of authors in natural and engineering sciences is much higher compared to the ones in the subject area of Social Sciences, Economics, Econometrics and Finance, and Business, Management, and Accounting. The most significant number of articles was published in Physics and Astronomy (4522 articles), while the lowest was in Nursing (96 articles).
In terms of the author analysis, the top subject area is Medicine (19,612 authors). Overall, the average number of authors per article across all subject areas is 4.21. The maximum number of authors per article is in Medicine (10.19), while the lowest is in Mathematics (1.36). This demonstrates the collaboration intensity of co-authors in a given subject area.
The citation analysis helps to reveal the most influential subject areas in Kazakhstan. Additionally, it demonstrates the recognition of authors affiliated with Kazakhstan in the research community [38]. The analysis reveals few subject areas where the local scholars are influential in their global research community. The number of citations per article (the citation rate) is a long-term indicator of the quality of research in a published article [4]. Given the importance of this indicator, it could be changed over time and some of the subject areas may see a positive trend in the future [39]. Additionally, to understand the pattern of the distribution of citations by articles in the subject areas, the citation distribution for the top five subject areas with the largest number of articles was constructed, given in Figure A1 in Appendix A. To evaluate the citation impact and distribution, Bornmann and Williams [40] used the percentage of papers that received the largest number of citations. In addition to this, the mean and median numbers of citations per article are given where the former is used to show the average of the citations in the subject area and the latter demonstrates the middle point in the distribution. They can be used to assess the relative dispersion/skewness of the distribution. Overall, we note that the top 10% of the articles in these subject areas received between 57.1% and 66.7% of all citations.
The international rankings of the HES sector, such as by Q.S., look at the citation rate as an indicator of an institution’s performance. Therefore, the growth in the number of articles and citations to the studies of the researchers affiliated with Kazakhstan has a considerable contribution to such rankings. Additionally, collaborations and co-authorship with more countries allow researchers from Kazakhstan to become integrated into the global research community where funding comes from various international sources. The current trends in local research productivity reveal that the areas related to agriculture, engineering, and medicine may experience tremendous growth in the coming years. Moreover, publications in reputed international journals indexed in Scopus and Web of Science and the increase in citation rates are some of the most essential criteria in the evaluation and funding of research proposals, awarding of Ph.D. degrees, and the promotion of faculty and researchers, not only in Kazakhstan [41], but also in other emerging countries [7,42,43]. These are the measures and policies regulated by the Ministry of Education and Science of the Republic of Kazakhstan.
Table 3 provides the details of the top five publishers, collaborating countries, and funding sponsors of the top five subject areas of science in Kazakhstan. The results of this analysis for the remaining subject areas are given in Table S1 in Supplementary Materials. Among the major publishers of research from Kazakhstan are Elsevier, Springer, and al-Farabi Kazakh State National University. It is noted that the choice of a publisher also depends on the specificity of a subject area. The analysis of collaborating countries shows the variety of partnerships, although most papers are published in collaboration with the Russian Federation, United States of America, United Kingdom, and Germany. Based on the analysis of the number of the collaborating countries for each subject area, we observe that international collaboration is higher in the subject areas representing natural sciences than in the subject areas representing arts and humanities, social, and medical sciences. In part, this can be due to the fact that the researchers in natural sciences participate in more projects funded by international donor organizations or foreign partner universities [44]. The most recognized sources of science funding in Kazakhstan are the Ministry of Education and Science of the Republic of Kazakhstan, the Russian Foundation for Basic Research, and Nazarbayev University. Overall, along with the increase in the funding of science, an increased interest in research globalization contributed to the growth in the number of researchers who publish in international journals.

3.2. Network Analysis

This section presents the results and findings of our network analysis (Step 3 in Table 1). As noted in Section 2.2.2, the network analysis included construction and visualization of the keyword co-occurrence networks for all subject areas. Each network comprised several clusters with closely related keywords that represented some topics. Figure 2 presents a sample network for the subject area Physics and Astronomy. This network has eight clusters that represent independent streams of research in this subject area. Close links in the network demonstrate interconnections that exist between clusters. Some of the keywords belong to several clusters. Based on the network visualization, the most representative keywords are ions, irradiation, temperature, scanning electron microscopy, silicon, hydrogen, carbon, mathematical models, crystal structure, and electrons. Similar networks for all 25 subject areas are provided in Figures S1–S25 in Supplementary Materials.
Table 4 summarizes the key attributes of the keyword co-occurrence networks in our study. We note that Physics and Astronomy, Biochemistry, Genetics and Molecular biology, and Medicine are characterized by a large number of keywords in comparison to other subject areas and those with stronger links.
Medicine has the largest number of collaboration links (153,993), which implies strong collaboration in this subject area. The areas close in research scope to Medicine, such as Immunology and Microbiology and Pharmacology, Toxicology, and Pharmaceutics, have comparatively fewer links.
Business, Management, and Accounting is characterized by uneven sporadic interconnections between words, which means that this area is comparatively less productive and collaborative in Kazakhstan. A related subject area Economics, Econometrics, and Finance demonstrates a low level of interconnectivity among its keywords, and therefore a low level of interconnections and links. The subject areas Arts and Humanities, Energy, and Decision Sciences demonstrate a similar number of keywords, although Energy has more links and fewer clusters compared to the other mentioned subject areas. There are more links in Energy, which means keywords are more interconnected; therefore, the number of clusters is lower.
Materials science demonstrates a high level of interconnections among its keywords and their relation to each other. The size of the clusters in Chemistry is quite large with close connections inside the clusters and among its keywords. We report the same pattern also for Chemical Engineering. Some major topics in these subject areas are similar or occur concurrently. Biochemistry, Genetics, and Molecular Biology shows more developed collaboration and interconnection between its keywords, similar to Environmental Science and Agriculture and Biological Sciences.
Overall, our network analysis in this step reveals the overall development and current trends in these subject areas. Overall, such subject areas as Physics and Astronomy, Biochemistry, Genetics, and Molecular biology, Medicine, and Chemistry are more developed, while such areas as Social Sciences, Business, Management, and Accounting, Arts and Humanities, Neuroscience, and Psychology are less developed. Overall, the subject areas representing natural sciences are well developed, with dense clusters and topical relationships. This can be noted from the number of keywords and links in Table 4 where each keyword may represent a topic or line of research and each link represents a relationship between such two keywords. Overall, such a finding can be corroborated by the contributions of the Soviet school of science in natural sciences, which had a profound impact on the global scientific community which continue in present Kazakhstan.

3.3. Author-Based Research Productivity Analysis

This section provides the results and findings of our author-based research productivity analysis (Step 4 in Table 1). Lotka’s law (Equation (1)) was used to assess the research productivity of the scholars from Kazakhstan. As introduced in Section 2.2.3, it was assessed using the frequency distribution of the number of articles published by unique author names. We demonstrate the subject area Art and Humanities as an example. For this subject area, overall, 1539 articles were published by 4520 unique authors (Table 5). This altogether gives 5716 co-author occurrences in 1539 articles since one author may publish more than one article or multiple authors (co-authorship) may represent one article. Such distribution represents the overall authorship pattern for this subject area. The range for the frequency distribution is such that 3711 authors published one article each, 584 authors published two articles each, and so on. In the limit of this range, there is only one unique author who published 15 articles. The aim from building this distribution table is to find the value for the n-parameter, which ideally should fit the predicted number of authors to the actual number of authors. For this, the difference between the total number of authors (actual) and the total number of authors (predicted) must be equal or close to 0. For the subject area Art and Humanities, the n-parameter is equal to 2.89. The other results in Table 5 when the n-parameter is equal to 2 are given for demonstration purposes only since this is the theoretical (benchmark) value of the n-parameter reported in the literature.
Table 6 presents the summary results of the application of Lotka’s law for all 25 subject areas. We can observe that the values for the n-parameter range from 2.05 in Medicine to 3.85 in Neuroscience. Overall, the subject areas are categorized into four groups, with an increment of 0.50 for the parameter value. Along with the results of the n-parameter, we report the results for the k-constant, which represents the associated percentage of the authors who published only one article for each subject area. We note the relative correlation between these two measures: the higher the n-parameter value, the higher the k-constant value, which implies a given subject area is less mature, represented by the smaller number of researchers (check in Table 2).
The subject area Medicine with the low n-parameter = 2.05 has the lowest percentage of authors (63.73%) who published one article, which suggests it is the most established subject area with the largest number of researchers (19,612 authors in Table 2) in Kazakhstan. The average percentage for the subject areas in Group 1 is 71.03%, which is higher than the average percentage for overall Kazakhstan, 82.36%.
There are more subject areas in Group 2 whose n-parameter range is 2.51–3.00. Compared to the previous group, related more to natural and pure sciences, this group is represented by the subject areas related to social sciences, arts, humanities, and computer science. This group is less mature than the previous one, with the n-parameter = 2.84 and the percentage of the authors who published only one article being 82.34%. An exception is the subject area Energy, with a percentage of 90.79%.
Groups 3 and 4 have only three subject areas each. Group 3 has the percentage of authors publishing only one article close to Group 2. The percentage for Group 4 is much higher, suggesting 91.24% of all the researchers in the subject areas Decision sciences, Health professions, and Neuroscience published only one article.
Overall, we can observe the following findings from the application of Lotka’s law. First, the results of its application to evaluate the research productivity of the scholars across the subject areas in Kazakhstan confirm that the n-parameter = 2.00 is a benchmark. The closer the subject area’s n-parameter value to 2.00 (Table 6), the more developed the subject area is. Second, the finding from this law’s application can be corroborated by the finding from the other two analyses in our study (reported in Section 3.1 and Section 3.2). For example, we can observe that the subject areas in Group 1 are more developed as per the results of the Lotka’s law application (Table 6) than the other subject areas in our study. Apparently, these subject areas are also more productive (in the number of articles), impactful (by the number of citations), and collaborative/networked (see Table 2 and Table 4, Table S1 in Supplementary Materials, Figures S1–S25 in Supplementary Materials). Similar analysis of the subject areas in the other groups reaffirms this finding. Third, Lotka’s law application also suggests that the number of authors who published only one article in a given subject area is not enough to ensure the overall productivity of this area. Overall, we observe that the overall science sector in Kazakhstan did not reach its necessary stage of maturity, as shown by the average value of the n-parameter of 3.01 for all the subject areas in Table 6. Recalling from Section 2.2.3 of the current paper, the higher n-parameter value implies less developed areas (less maturely represented by fewer researchers), while the lower n-parameter value implies the more established area (more maturely represented by more researchers). On the other hand, this also implies an opportunity for research growth in the near future that may fill the current gap in the development of the listed subject areas in Kazakhstan.

4. Conclusions

The development of a country’s scientific potential is based on its research productivity and quality. Recent trends in the HES sector of Kazakhstan, such as an increase in science funding, access of researchers to research mobility programs, and globalization of the local research, have resulted in the country’s improved research performance. To reveal associated trends and characteristics of the research productivity of the country, in this study, we offered a comprehensive analysis of scientific literature from Kazakhstan. Our research scope included the descriptive analysis, network analysis, and author-based research productivity analysis of 23,371 articles sourced from Scopus, published during 1991–2020, and across 25 subject areas.
The results of the descriptive analysis revealed substantial growth in research publications in Scopus since 2011. The average annual growth rate of 32 percent in the past 10 years indicates a stable and robust contribution of researchers affiliated with Kazakhstan. In terms of research quality, the results of the citation analysis showed the subject areas that contribute more to the research body of knowledge. These are Physics and Astronomy, Engineering, Medicine, and Immunology and Microbiology subject areas, which are recognized by the research community on the global scale. Moreover, the collaboration patterns as co-authorship with counterparts from other countries showed that local researchers in the subject areas related to agriculture, engineering, and medicine may experience tremendous growth in the coming years. The increase in the number of such publications in English and since 2011 results from the implementation of some crucial policies and requirements of the government in the HES sector. In particular, this includes the State Program of Educational Development (2011–2020), the Law on Science (2011), the Law on Commercialization (2015), and the State Program for Education and Science Development (2016–2019). For example, the Law on Science was enacted to reevaluate new scientific directions, improve publication quality, and set standards for awarding academic degrees and titles. The State Programs (2011–2020, 2016–2019) set key targets which were relevant to the country’s research performance and contributed to its productivity. Other policies include publishing at least one paper in a journal with a two-year journal impact factor above zero or indexed in Scopus (to award a Ph.D. degree) and publishing at least two and three articles in journals with a journal impact factor above zero (to award associate professor and professor titles, respectively). Publications in international journals indexed in Scopus and Web of Science and the increase in citation rates are essential criteria for funding research proposals, awarding Ph.D. degrees, and promoting faculty and researchers in HES institutions in Kazakhstan. In addition, implementing a set of requirements for research grant holders and rigid rules in competitions (e.g., the country’s best university or faculty member) continues to both push and motivate the HES institutions and local researchers to increase their research output.
The findings from the network analysis showed that the topical relationships and research collaborations in some subject areas are stronger and denser (e.g., Physics and Astronomy, Biochemistry, Genetics, and Molecular Biology, Medicine, Chemistry), while other areas (e.g., Social Sciences, Business, Management, and Accounting, Arts and Humanities, Neuroscience, and Psychology) are less established. We found that, on average, the subject areas representing natural sciences are more developed than the subject areas representing social and medical sciences. We corroborate this finding with the development of the Soviet school of science that had a crucial impact in the former areas than the latter, which continues in present Kazakhstan. The findings from this analysis can help understand the scientometric characteristics of the science sector and identify the areas for prospect growth through a more profound analysis of the factors that enable their development.
Lastly, we assessed the research productivity of local scholars and evaluated the relative research maturity of all subject areas. Applying Lotka’s model with its n-parameter (with the value of 2.00 as a theoretical benchmark) and k-constant (representing an associated percentage of the authors who published only one article in a given subject area), we found that the overall science sector in Kazakhstan did not reach its necessary stage of productivity. On the other hand, this suggests that the country has potential in its publication output which would lead to its scientific maturity. Additionally, based on the associated values of their n-parameter, we grouped the 25 subject areas into four distinct groups. Some subject areas demonstrated greater productivity and contribution to the HES sector in Kazakhstan, while the others were less productive. This all implies an opportunity for research growth in the near future which may fill the current gap in the development of lagging subject areas in the country.
We acknowledge some limitations that can be considered in future research. A single article in our study may have represented more than one subject area. This is because articles in Scopus may be indexed in more than one subject area, which is especially true for allied areas, e.g., Chemistry and Materials science. Additionally, in this study, we used quantitative methods and our findings are based on statistical analysis. In future research, the scope of this study can be extended, or findings can be confirmed by using qualitative approaches (e.g., interviews) or by analyzing non-academic policy materials or reports.
The findings and implications from our study can be helpful for the international research community, policymakers in the HES sector, and serve as exemplary for other emerging countries. They can be used to understand the results of structural and policy reforms aimed to improve the country’s HES sector. Additionally, understanding the current state of the research productivity and scientific maturity is crucial in building a more sustainable research environment for a country.

Supplementary Materials

The following are available online at https://www.mdpi.com/article/10.3390/publications9040051/s1, Figures S1–S25: A keywords co-occurrence networks for all 25 subject areas, Table S1: Top 5 publishers, collaborating countries, and funding sponsors of the remaining 20 subject areas.

Author Contributions

Conceptualization, T.N.; methodology, T.N. and D.A.; software, D.A.; validation, T.N. and D.A.; formal analysis, T.N. and D.A.; investigation, T.N. and D.A.; resources, T.N. and D.A.; data curation, D.A.; writing—original draft preparation, D.A.; writing—review and editing, T.N.; visualization, D.A.; supervision, T.N.; project administration, T.N.; funding acquisition, T.N. All authors have read and agreed to the published version of the manuscript.

Funding

This research was funded by the Science Committee of the Ministry of Education and Science of the Republic of Kazakhstan, grant number AP08856031.

Data Availability Statement

The data presented in this study are available in the article and the Supplementary Material.

Acknowledgments

The authors are thankful to Damina Sabi (a researcher at Business School, Kazakh-British Technical University, Almaty, Kazakhstan) for helping with data collection and analysis in the earlier drafts of this project.

Conflicts of Interest

The authors declare no conflict of interest.

Appendix A

Figure A1. Citation distribution for the top five subject areas with the largest number of articles. The subject areas are: (a) Physics and Astronomy; (b) Social Sciences; (c) Engineering; (d) Chemistry; (e) Materials Science.
Publications 09 00051 g0a1aPublications 09 00051 g0a1b

References

  1. Kuzhabekova, A.; Lee, J. International Faculty Contribution to Local Research Capacity Building: A View from Publication Data. High. Educ. Policy 2017, 31, 423–446. [Google Scholar] [CrossRef]
  2. Vasiljeva, M.; Osipov, G.; Ponkratov, V.; Ivlev, V.; Ivleva, M.; Karepova, S.; Gardanova, Z.; Dudnik, O. Factors to Improve Publication Productivity in Russian Universities. Publicaitons 2021, 9, 21. [Google Scholar] [CrossRef]
  3. Kuzhabekova, A.; Ruby, A. Raising Research Productivity in a Post-Soviet Higher Education System:A Case From Central Asia. Eur. Educ. 2018, 50, 266–282. [Google Scholar] [CrossRef]
  4. Zhanbayev, R.; Sagintayeva, S.; Ainur, A.; Nazarov, A. The Use of the Foresight Methods in Developing an Algorithm for Conducting Qualitative Examination of the Research Activities Results on the Example of the Republic of Kazakhstan. Mathematics 2020, 8, 2024. [Google Scholar] [CrossRef]
  5. Suleymenov, E.Z.; Ponomareva, N.I.; Dzhumabekov, A.K.; Kubieva, T.S.; Kozbagarova, G.A. An assessment of the contributions of Kazakhstan and other CIS countries to global science: The Scopus database. Sci. Tech. Inf. Process. 2011, 38, 159–165. [Google Scholar] [CrossRef]
  6. Narbaev, T. Project Management Knowledge Discovery in Kazakhstan: Co-Word Analysis of the Field. In Proceedings of International Conference on Intellectual Capital, Knowledge Management & Organisational Learning; IKI-SEA of Bangkok University: Bangkok, Thailand, 2015. [Google Scholar]
  7. Guevara, M.R.; Mendoza, M. Publishing Patterns in BRIC Countries: A Network Analysis. Publications 2016, 4, 20. [Google Scholar] [CrossRef] [Green Version]
  8. Hinojo-Lucena, F.-J.; Aznar-Díaz, I.; Cáceres-Reche, M.-P.; Romero-Rodríguez, J.-M. Artificial Intelligence in Higher Education: A Bibliometric Study on its Impact in the Scientific Literature. Educ. Sci. 2019, 9, 51. [Google Scholar] [CrossRef] [Green Version]
  9. Silva, V.V.M.; Ribeiro, J.L.D.; Alvarez, G.R.; Caregnato, S.E. Competence-Based Management Research in the Web of Science and Scopus Databases: Scientific Production, Collaboration, and Impact. Publications 2019, 7, 60. [Google Scholar] [CrossRef] [Green Version]
  10. Pouris, A. Scientometric research in South Africa and successful policy instruments. Scientometrics 2011, 91, 317–325. [Google Scholar] [CrossRef] [Green Version]
  11. Shelton, R.D. Scientometric laws connecting publication counts to national research funding. Scientometrics 2020, 123, 181–206. [Google Scholar] [CrossRef]
  12. Gümüş, S.; Bellibaş, M.; Şükrü; Gümüş, E.; Hallinger, P. Science mapping research on educational leadership and management in Turkey: A bibliometric review of international publications. Sch. Leadersh. Manag. 2019, 40, 23–44. [Google Scholar] [CrossRef]
  13. Urrútia, G.; Bonfill, X. Declaración PRISMA: Una propuesta para mejorar la publicación de revisiones sistemáticas y metaanálisis. Med. Clin. 2010, 135, 507–511. [Google Scholar] [CrossRef]
  14. Guskov, A.; Kosyakov, D.; Selivanova, I. Scientometric research in Russia: Impact of science policy changes. Scientometrics 2016, 107, 287–303. [Google Scholar] [CrossRef]
  15. Glänzel, W.; Leta, J.; Thijs, B. Science in Brazil. Part 1: A macro-level comparative study. Scientometrics 2006, 67, 67–86. [Google Scholar] [CrossRef]
  16. Calma, A.; Davies, M. Academy of Management Journal, 1958–2014: A citation analysis. Scientometrics 2016, 108, 959–975. [Google Scholar] [CrossRef]
  17. Rossetto, D.E.; Bernardes, R.C.; Borini, F.M.; Gattaz, C.C. Structure and evolution of innovation research in the last 60 years: Review and future trends in the field of business through the citations and co-citations analysis. Scientometrics 2018, 115, 1329–1363. [Google Scholar] [CrossRef]
  18. Perlin, M.S.; Santos, A.; Imasato, T.; Borenstein, D.; Da Silva, S. The Brazilian scientific output published in journals: A study based on a large CV database. J. Inf. 2017, 11, 18–31. [Google Scholar] [CrossRef] [Green Version]
  19. Orazalin, N.; Mahmood, M.; Narbaev, T. The impact of sustainability performance indicators on financial stability: Evidence from the Russian oil and gas industry. Environ. Sci. Pollut. Res. 2019, 26, 8157–8168. [Google Scholar] [CrossRef]
  20. Keathley-Herring, H.; Van Aken, E.; Gonzalez-Aleu, F.; Deschamps, F.; Letens, G.; Orlandini, P.C. Assessing the maturity of a research area: Bibliometric review and proposed framework. Scientometrics 2016, 109, 927–951. [Google Scholar] [CrossRef]
  21. Shibata, N.; Kajikawa, Y.; Takeda, Y.; Matsushima, K. Detecting emerging research fronts based on topological measures in citation networks of scientific publications. Technovation 2008, 28, 758–775. [Google Scholar] [CrossRef]
  22. Moldabekova, A.; Zhidebekkyzy, A.; Baimukhanbetova, E.; Akhmetkaliyeva, S. Advanced technologies in improving the management of logistics services: Bibliometric network analysis. Pol. J. Manag. Stud. 2020, 21, 211–223. [Google Scholar] [CrossRef]
  23. Wang, L.; Chen, X.; Bao, A.; Zhang, X.; Wu, M.; Hao, Y.; He, J. A bibliometric analysis of research on Central Asia during 1990–2014. Scientometrics 2015, 105, 1223–1237. [Google Scholar] [CrossRef]
  24. Narbaev, T.; De Marco, A.; Orazalin, N. A multi-disciplinary meta-review of the public–private partnerships research. Constr. Manag. Econ. 2020, 38, 109–125. [Google Scholar] [CrossRef]
  25. Fernandes, C.; Ferreira, J.; Raposo, M.; Estevão, C.; Peris-Ortiz, M.; Rueda-Armengot, C. The dynamic capabilities perspective of strategic management: A co-citation analysis. Scientometrics 2017, 112, 529–555. [Google Scholar] [CrossRef]
  26. Heilig, L.; Voß, S. A Scientometric Analysis of Public Transport Research. J. Public Transp. 2015, 18, 111–141. [Google Scholar] [CrossRef] [Green Version]
  27. Sudhier, K.P. Lotka’s Law and Pattern of Author Productivity in the Area of Physics Research. DESIDOC J. Libr. Inf. Technol. 2013, 33, 457–464. [Google Scholar] [CrossRef] [Green Version]
  28. Su, Y.-S.; Lin, C.-L.; Chen, S.-Y.; Lai, C.-F. Bibliometric study of social network analysis literature. Libr. Hi Tech 2019, 38, 420–433. [Google Scholar] [CrossRef]
  29. Lotka, A.J. The Frequency Distribution of Scientific Productivity. J. Wash. Acad. Sci. 1926, 16, 317–323. [Google Scholar]
  30. Coile, R.C. Lotka’s frequency distribution of scientific productivity. J. Am. Soc. Inf. Sci. 1977, 28, 366–370. [Google Scholar] [CrossRef]
  31. Kumar, S.; Senthilkumar, R. Applicability of Lotka’s Law in Astronomy & Astrophysics Research of India. Libr. Philos. Pract. 2019, 1–13. Available online: https://digitalcommons.unl.edu/libphilprac/2129/ (accessed on 31 August 2021).
  32. Voos, H. Lotka and information science. J. Am. Soc. Inf. Sci. 1974, 25, 270–272. [Google Scholar] [CrossRef]
  33. Pao, M.L. An empirical examination of Lotka’s law. J. Am. Soc. Inf. Sci. 1986, 37, 26–33. [Google Scholar] [CrossRef]
  34. Gupta, B.M.; Kumar, S.; Aggarwal, B.S. A comparision of productivity of male and female scientists of CSIR. Scientometrics 1999, 45, 269–289. [Google Scholar] [CrossRef]
  35. Yessirkepov, M.; Nurmashev, B.; Anartayeva, M. A Scopus-Based Analysis of Publication Activity in Kazakhstan from 2010 to 2015: Positive Trends, Concerns, and Possible Solutions. J. Korean Med. Sci. 2015, 30, 1915–1919. [Google Scholar] [CrossRef] [PubMed]
  36. Kudaibergenova, R.; Uzakbay, S.; Makanova, A.; Ramadinkyzy, K.; Kistaubayev, E.; Dussekeev, R.; Smagulov, K. Managing publication change at Al-Farabi Kazakh National University: A case study. Scientometrics 2021, 1–27. [Google Scholar] [CrossRef]
  37. OECD. Higher Education in Kazakhstan 2017; Organisation for Economic Co-Operation and Development (OECD): Paris, France, 2017. [Google Scholar]
  38. Gasparyan, A.Y.; Yessirkepov, M.; Duisenova, A.; Trukhachev, V.I.; Kostyukova, E.I.; Kitas, G.D. Researcher and Author Impact Metrics: Variety, Value, and Context. J. Korean Med. Sci. 2018, 33, e139. [Google Scholar] [CrossRef] [PubMed]
  39. Muhamedyev, R.; Aliguliyev, R.; Shokishalov, Z.; Mustakayev, R. New Bibliometric Indicators for Prospectivity Estimation of Research Fields. Ann. Libr. Inf. Stud. 2018, 65, 62–69. [Google Scholar]
  40. Bornmann, L.; Williams, R. An evaluation of percentile measures of citation impact, and a proposal for making them better. Scientometrics 2020, 124, 1457–1478. [Google Scholar] [CrossRef]
  41. Smagulov, K.; Makanova, A.; Burshukova, G. Analysis of Scientometric Indicators of Kazakhstani Authors’ Publication Ac-tivity in Journals, Included in the Scopus Database. Bulletin of the Kazakh National University named after al-Farabi. Econ. Ser. 2018, 1, 233–253. [Google Scholar]
  42. Grinëv, A.; Bylieva, D.; Lobatyuk, V. Russian University Teachers’ Perceptions of Scientometrics. Publications 2021, 9, 22. [Google Scholar] [CrossRef]
  43. Konar, T. Author-Suggested, Weighted Citation Index: A Novel Approach for Determining the Contribution of Individual Researchers. Publications 2021, 9, 30. [Google Scholar] [CrossRef]
  44. NAS; RK. National Report on Science 2020; National Academy of Science of the Republic of Kazakhstan (NAS RK): Almaty, Kazakhstan, 2020. [Google Scholar]
Figure 1. Research publication trend of Kazakhstan during 1991–2020.
Publications 09 00051 g001
Figure 2. A keyword co-occurrence network for the subject area Physics and Astronomy.
Publications 09 00051 g002
Table 1. Outline of the research methodology.
StepsActions and Outputs
1. Materials collection and their screeningAction: Search for papers with authors’ country affiliation “Kazakhstan” in Scopus. Select articles and reviews in English published in journals during 1991–2020. Disregard irrelevant subject areas
Output: Returned 23,371 articles by 150,708 authors and representing 25 subject areas
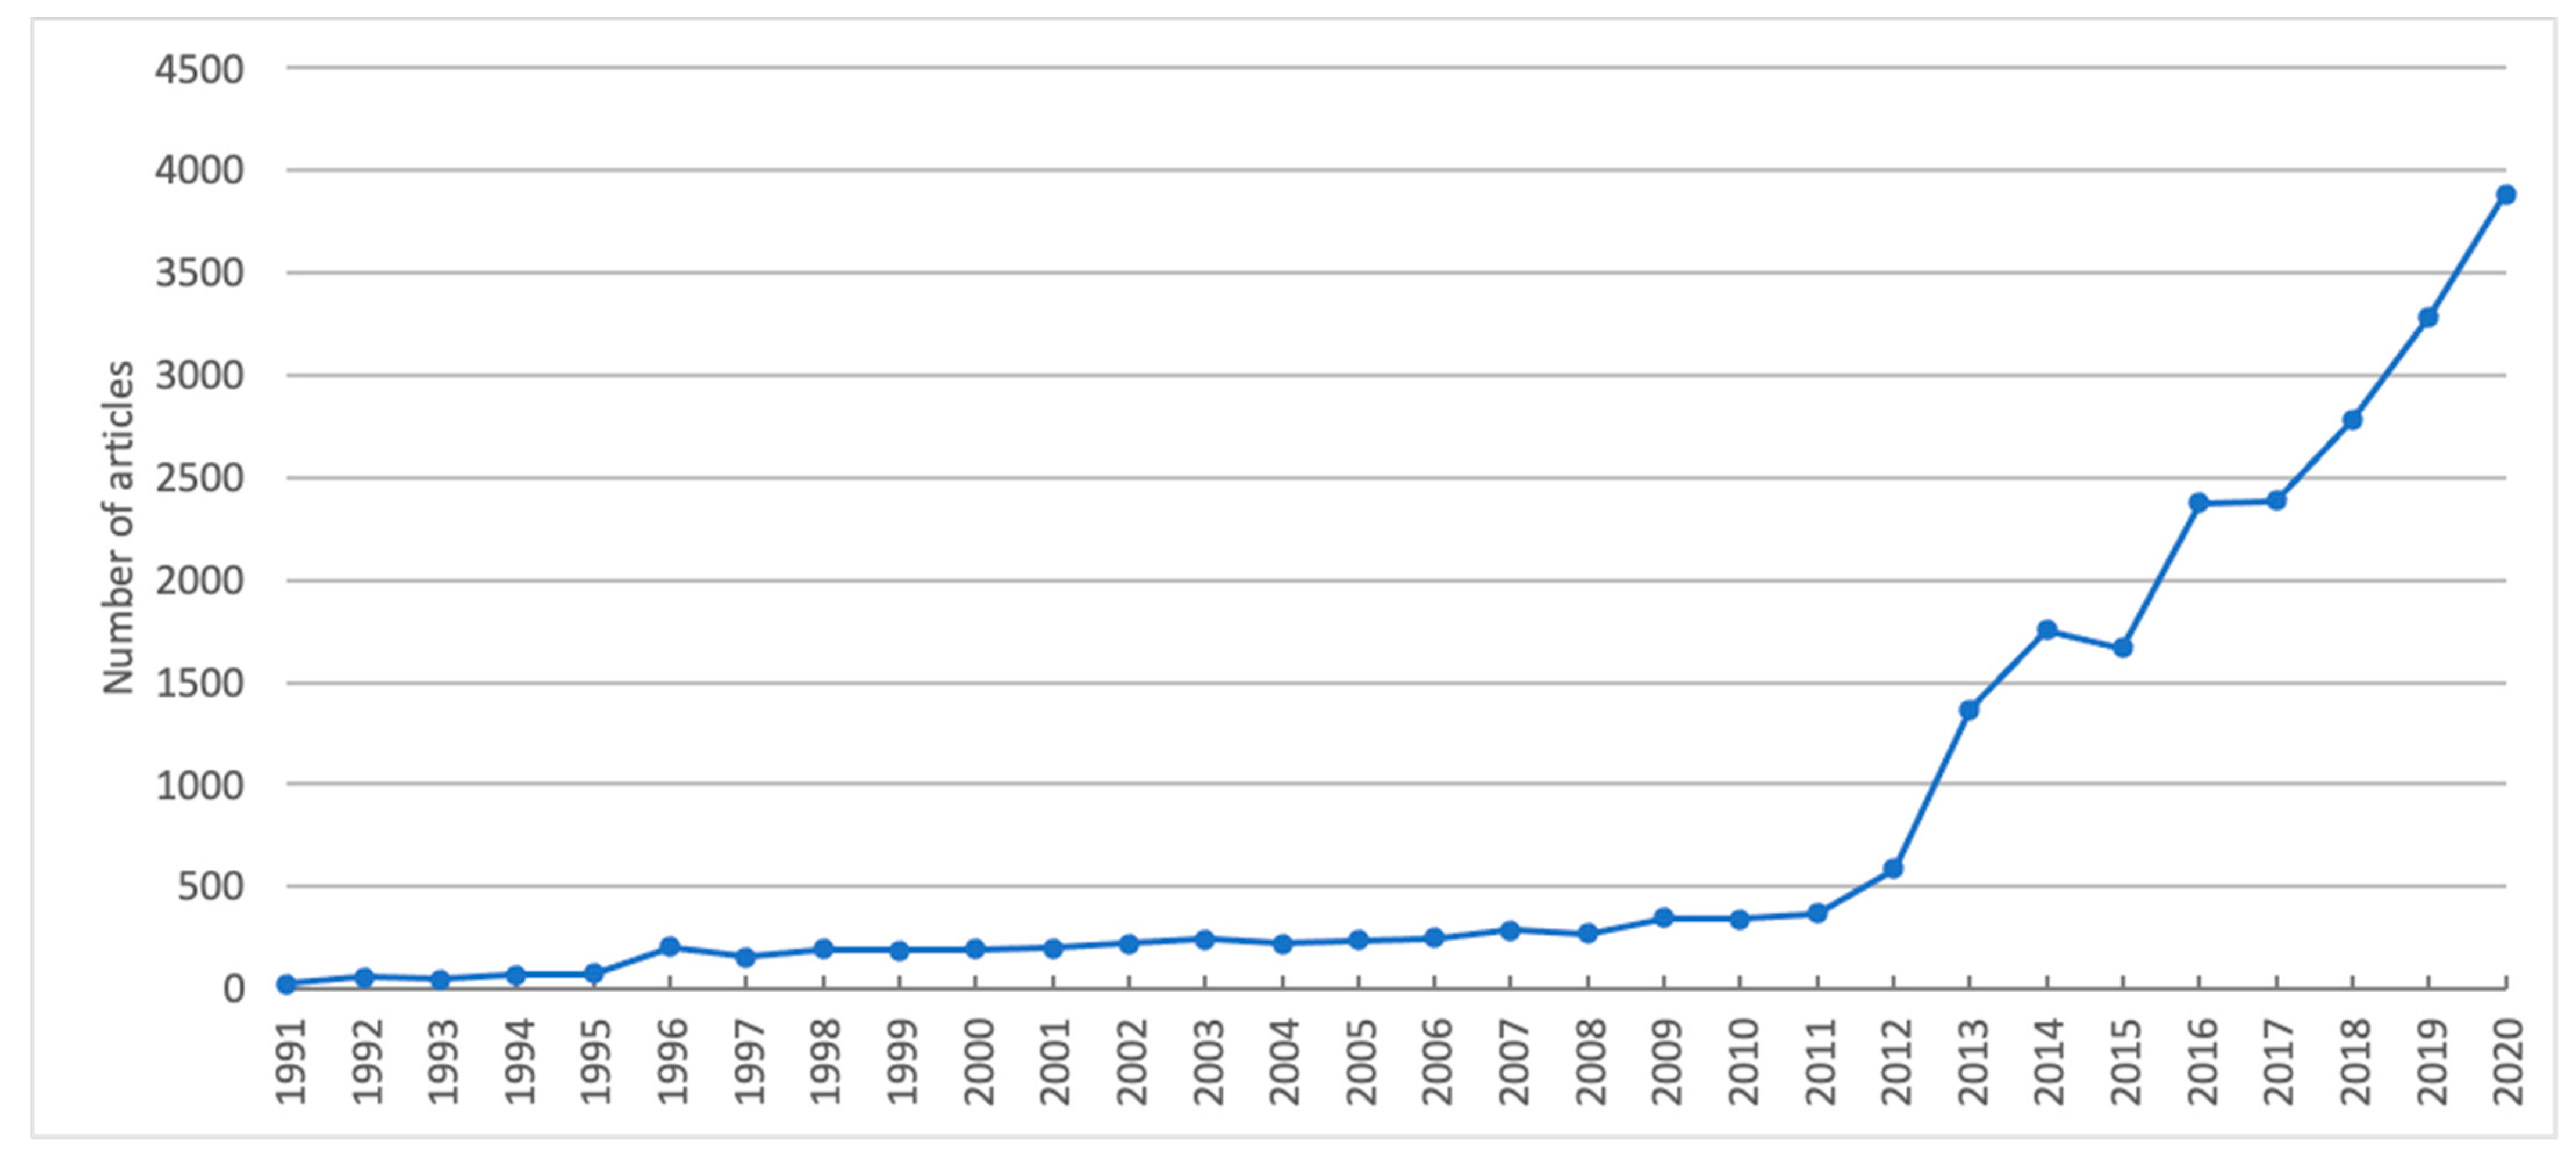
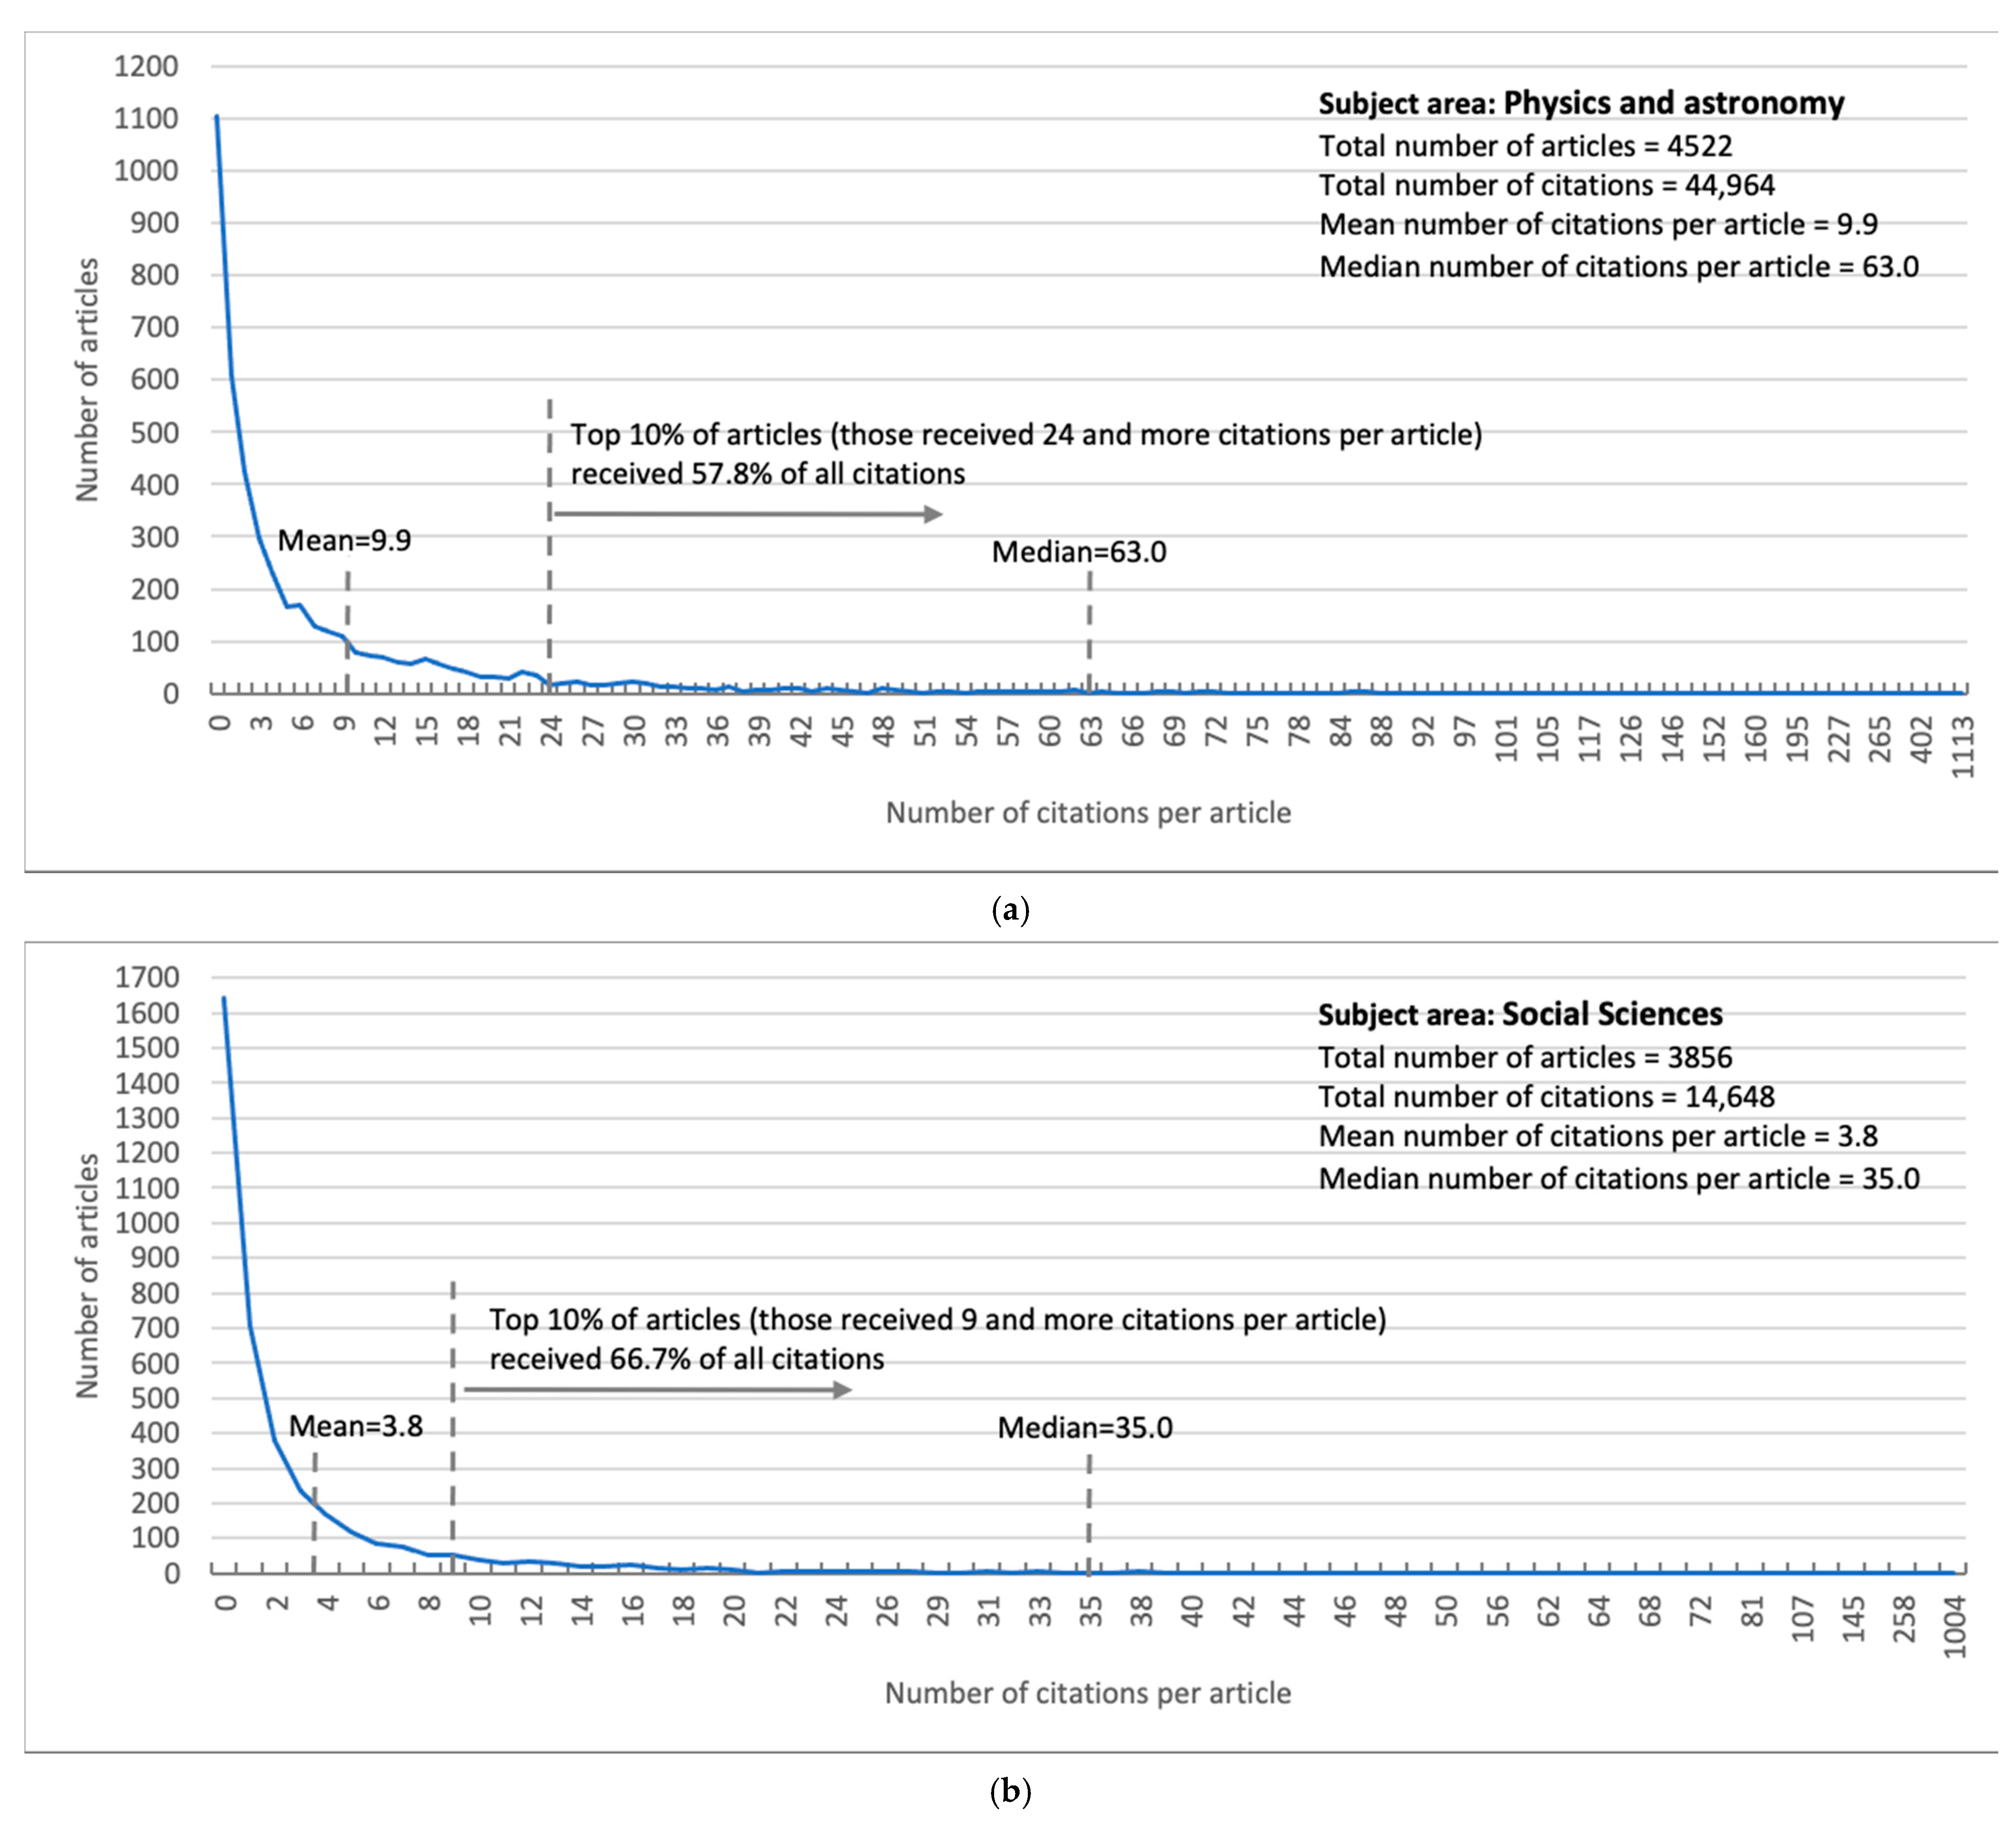
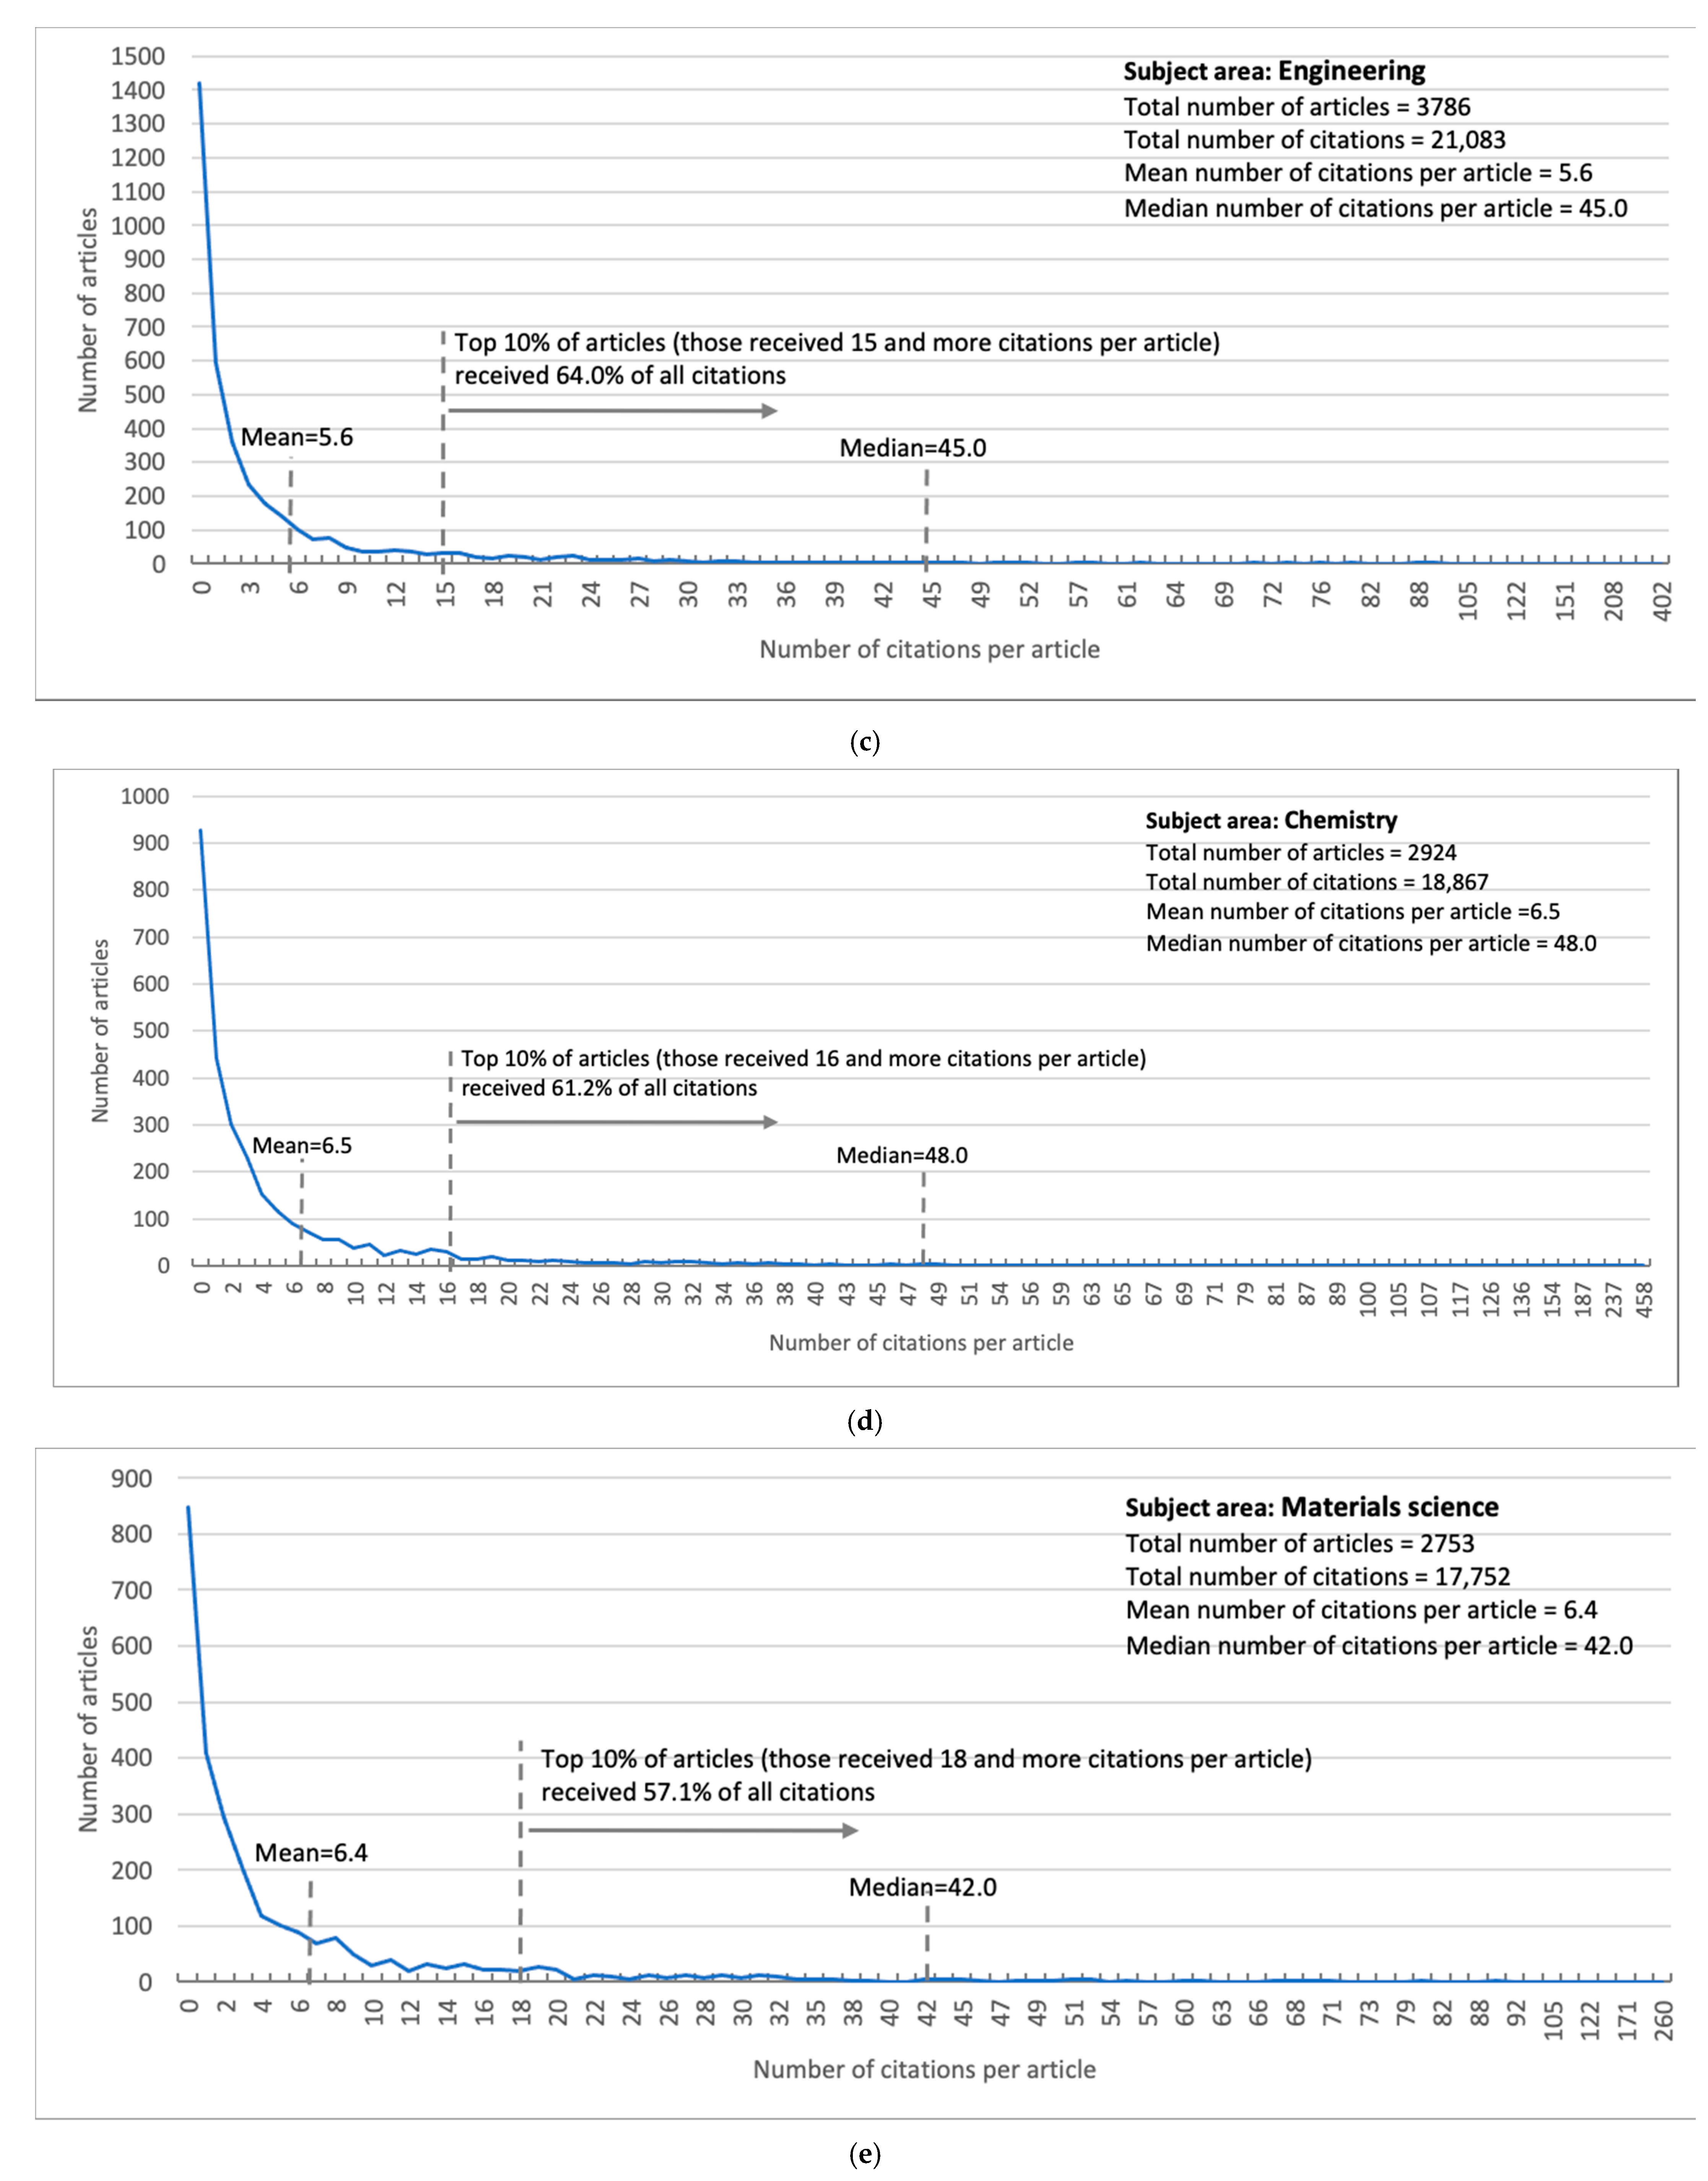
2. Descriptive analysisAction: Present the distribution of articles by year of publication. Analyze their distribution by the number of articles, number of authors, number of authors per article, number of citations, and number of citations per article for all subject areas. Analyze their distribution by publishers, collaborating countries, and funding sponsors for all subject areas
Output: The distribution of 23,371 articles published during 1991–2020 (Figure 1); the distribution of the articles, authors, and citations across all subject areas (Table 2); the top 5 publishers, collaborating countries, and funding sponsors of the top 5 subject areas (Table 3); the top 5 publishers, collaborating countries, and funding sponsors of the remaining 20 subject areas (see Table S1 in Supplementary Materials)
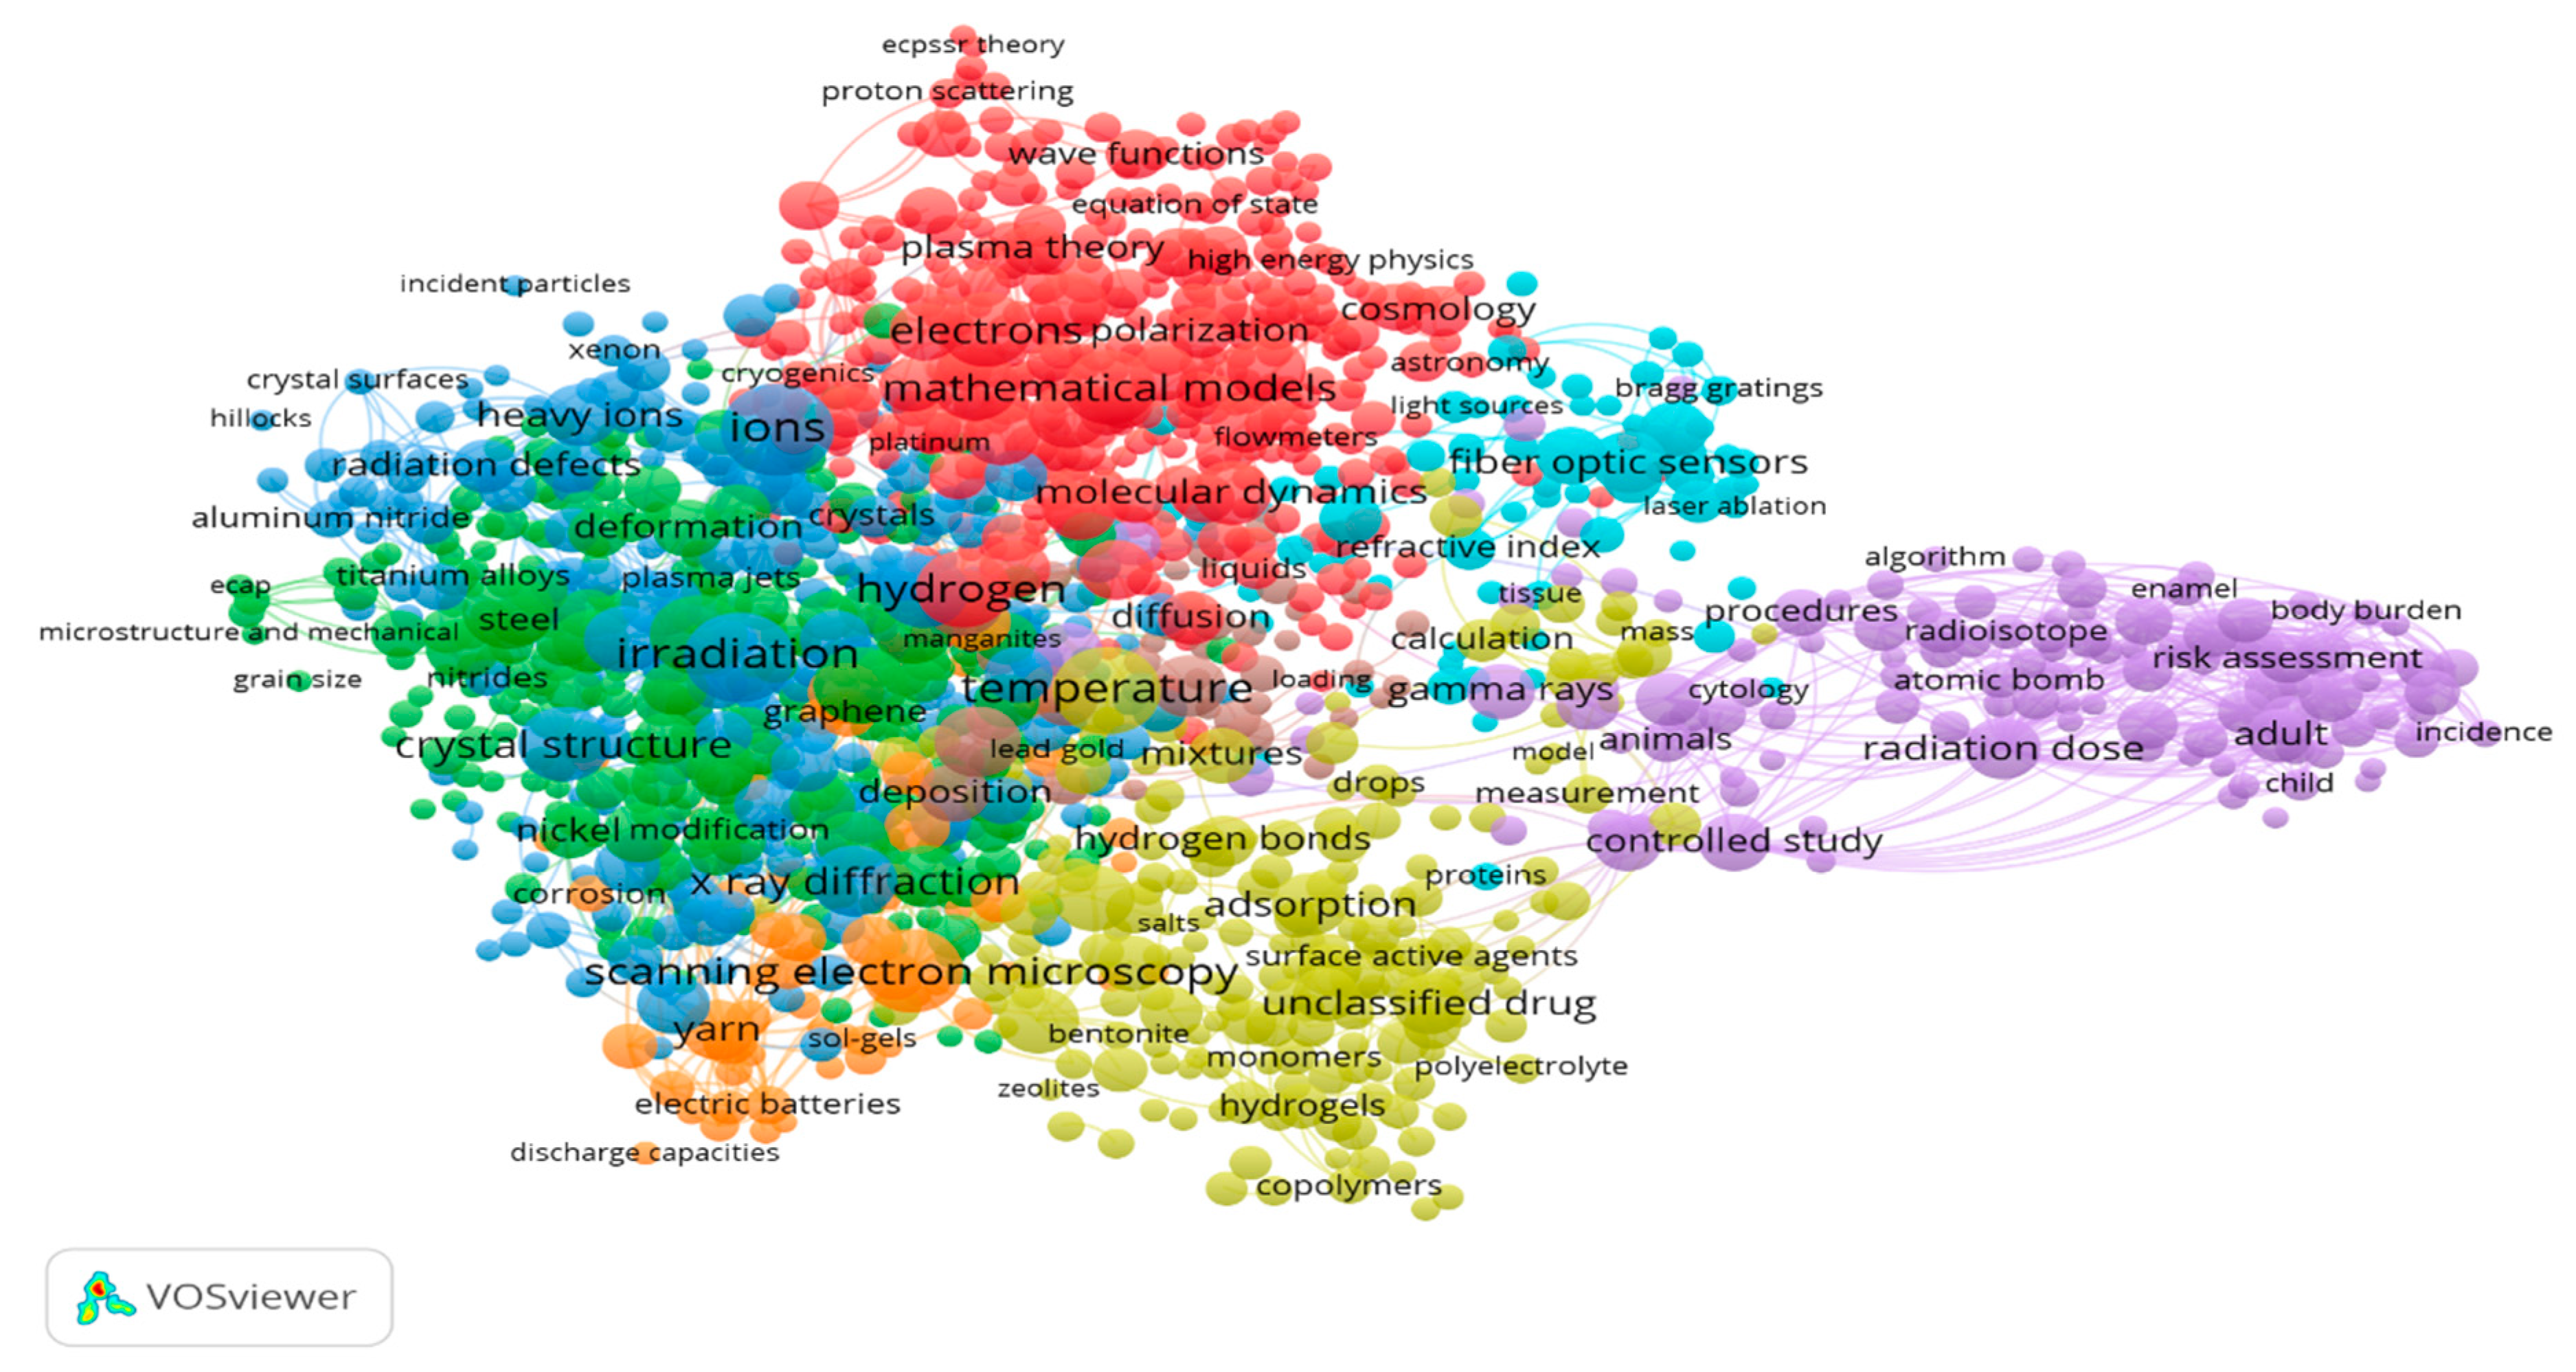
3. Network analysisAction: Create a keyword co-occurrence network for all subject areas. Define their critical attributes, including the number of keywords, links, clusters, and most representative keywords
Output: A keyword co-occurrence network for all 25 subject areas (see Figures S1–S25 in Supplementary Materials); a keyword co-occurrence network for the subject area Physics and Astronomy as an example (Figure 2); the summary results of the network analysis for all subject areas including the number of keywords, links, clusters, and most representative keywords (Table 4)
4. Author-based research productivity analysisAction: Apply Lotka’s law to evaluate the author-based research productivity. Find the values for Lotka’s equation to evaluate the relative development of 25 subject areas.
Output: The detailed results of the Lotka’s law application for the subject area Art and Humanities as an example (Table 5); the summary results of the Lotka’s law applications with their n-parameter and k-constant values for all 25 subject areas (Table 6)
Table 2. Distribution of the number of articles, authors, and citations by subject area.
NoSubject AreaNumber of ArticlesNumber of AuthorsNumber of Authors per ArticleNumber of CitationsNumber of Citations per Article
1Physics and astronomy452216,7753.7044,9649.94
2Social sciences385690142.3314,6484.31
3Engineering378611,6173.0621,0835.56
4Chemistry292478642.6818,8676.45
5Materials science275360122.1817,7526.44
6Biochemistry, genetics, and molecular biology260213,5925.2216,8996.49
7Mathematics232031661.3688733.82
8Environmental science206078683.8114,6057.08
9Agricultural and biological sciences195170953.6014,5217.44
10Earth and planetary sciences179996675.3715,8788.82
11Chemical engineering179351262.8510,1785.67
12Medicine192419,61210.1952,92627.5
13Economics, econometrics, and finance166342202.5334412.06
14Art and humanities153945202.9330992.01
15Computer science120639623.2861005.05
16Business, management, and accounting119039683.3343753.67
17Energy114937273.2468095.92
18Pharmacology, toxicology, and pharmaceutics92740304.3437844.08
19Immunology and microbiology44834757.75531911.87
20Decision sciences37213563.6412673.40
21Veterinary1769165.209805.56
22Psychology16210016.1713498.32
23Neuroscience1537925.1711087.24
24Health professions1536674.354342.83
25Nursing966666.938468.81
Total41,524 1150,7084.21290,1056.81
1 The total number of articles in this table (41,524) is different from the total number of articles in the study (23,371). This is because a single article in Scopus may be indexed in more than one subject area, e.g., in Chemistry and Materials science, simultaneously.
Table 3. Top 5 publishers, collaborating countries, and funding sponsors of the top 5 subject areas.
NoSubject AreaNumber of ArticlesTop 5 Publishers (Percentage of Total)Top 5 Collaborating Countries (Number of Articles, Percentage of Total)Top 5 Funding Sponsors (Number of Articles, Percentage of Total Funding for a Subject Area)
1Physics and astronomy4522Elsevier (12.70%)
Springer (10.90%)
al-Farabi Kazakh State National University (5.46%)
American Physical Society (4.15%)
Pleiades Publishing (4.09%)
The Russian Federation (1,404, 31%), The United States of America (623, 13.70%), Germany (490, 10%), Italy (351,7.76%), Japan (325,7.18%)Ministry of Education and Science of the Republic of Kazakhstan (710, 15.70%), Russian Foundation for Basic research (153, 3.38%), Nazarbayev University (126, 2.78%), United Kingdom Research and Innovation (110, 2.43%), Science and Technologies Facilities Council (103, 2.27%),
2Social sciences3856ASERS Publishing House (10.60%)
Universidad del Zulia (9.46%)
IJESE (6.19%)
Serials Publications (4.90%)
Routledge (4.09%)
The Russian Federation (391, 10.10%), The United States of America (190, 4.92%), The United Kingdom (112, 2.9%), Turkey (62, 1.60%), China (47, 1.21%)Ministry of Education and Science of the Republic of Kazakhstan (130, 15.70%), Nazarbayev University (26, 0.93%), Kazan Federal University (30, 0.77%), European Commission (19, 0.49%), Chinese Academy of Sciences (10, 0.25%)
3Engineering3786Springer (8.90%)
Elsevier (9.03%)
IJESE (6.44%)
Institute of Electrical and Electronics Engineers Inc. (5.49%)
Wydawnictwo SIGMA-NOT (2.53%)
The Russian Federation (633, 16.70%), The United States of America (253, 6.68%), Poland (238, 6.28%), Ukraine (217, 5.73%), The United Kingdom (153, 4.04%)Ministry of Education and Science of the Republic of Kazakhstan (403, 10.60%), Nazarbayev University (159, 4.19%), National Natural Science Foundation of China (48, 1.26%), Ministry of Education and Science of the Russian Federation (44, 1.16%), European Commission (40, 1.05%)
4Chemistry2924Elsevier (10.94%)
al-Farabi Kazakh State National University (8.44%)
Maik Nauka Publishing (8.07%)
Pleiades Publishing (5.19%)
Springer (4.68%)
The Russian Federation (597, 20.40%), The United States of America (229, 7.83%), Germany (123, 4.20%), China (119, 4.06%), The United Kingdom (110, 3.76%)Ministry of Education and Science of the Republic of Kazakhstan (397, 13.50%), Nazarbayev University (68, 2.32%), Russian Foundation for Basic Research (63, 2.15%), Natural National Science Foundation of China (61, 2.08%), Ministry of Education and Science of the Russian Federation (40, 1.36%)
5Materials science2753Elsevier (12.78%)
al-Farabi Kazakh State National University (8.97%)
Springer (8.79%)
Maik Nauka Publishing (4.54%)
MDPI AG (4.21%)
The Russian Federation (700, 25.42%), The United States of America (228, 8.28%), The United Kingdom (122, 4.43%), China (112, 4.06%), Ukraine (107, 3.88%)Ministry of Education and Science of the Republic of Kazakhstan (412, 14.90%), Nazarbayev University (110, 3.99%), Ministry of Education and Science of the Russian Federation (65, 2.36%), Russian Foundation for Basic Research (59, 2.14%), European Commission (49, 1.77%)
Table 4. Summary of the network analysis of science in Kazakhstan, by subject areas.
NoSubject AreaKeywordsLinksClustersThe Most Representative Keywords (Top 10 Occurrences)
1Physics and astronomy132749,9988Ions, irradiation, temperature, scanning electron microscopy, silicon, hydrogen, carbon, mathematical models, crystal structure, electrons
2Social Sciences 169 18756Questionnaire, human experiment, cross-sectional study, cross-sectional studies, major clinical study, Russian Federation, climate change, psychology, surveys and questionnaires, Asia, China
3Engineering112828,8507Microstructure, scanning electron microscopy, silicon, slags, carbon, optimization, mechanical properties, numerical methods, silica, temperature
4Chemistry103543,1079Unclassified drug, chemistry, synthesis (chemical), adsorption, catalysts, carbon, thermodynamics, crystal structure, electrodes, ions
5Materials Science 1181 49,14310Scanning electron microscopy, x-ray diffraction, synthesis (chemical), microstructure, irradiation, carbon, silicon, ions, temperature, slags
6Biochemistry, genetics, and molecular biology136276,5367Genetics, unclassified drug, metabolism, chemistry, major clinical study, human cell, genotype, animal experiment, pathology, genetic variability
7Mathematics 148 18907Differential equations, boundary value problems, inverse problems, algorithms, problem-solving, partial differential equations, mathematical models, computer simulation, mathematical operators, boundary conditions
8Environmental science84040,4856Central Asia, concentration (composition), risk assessment, Asia, climate change, environmental monitoring, Eurasia, soil pollution, Russian Federation, chemistry
9Agricultural and biological sciences65320,9478Non-human, genetics, Asia, triticum aestivum, Central Asia, physiology, Eurasia, Chemistry, Wheat, Metabolism
10Earth and planetary sciences 391 64147Eurasia, Asia, Tien Shan, Central Asia, West Asian, climate change, rocks, ore deposit, deposits, ionosphere
11Chemical engineering55417,3126Unclassified drug, scanning electron microscopy, catalyst, coal, carbon, catalyst activity, synthesis, adsorption, oxidation, combustion
12Medicine 1907 153,9938Risk factor, genetics, unclassified drug, metabolism, mortality, incidence, pathology, pathophysiology, human immunodeficiency virus infection, genotype
13Economics, econometrics, and finance 716 708621Developing world, European Union, cathodes, India, economic growth, Eurasia, United States, chemistry, scanning electron microscopy, stochastic systems
14Art and humanities338261515Archaeology, pastoralism, Central Asia, bronze age, Eurasia, iron age, Russian Federation, prehistoric, archaeological evidence, carbon isotope
15Computer science 197 20846Algorithms, optimization, internet of things, robots, network security, numerical methods, mathematical methods, genetics, procedures, energy efficiency
16Business, management, and accounting 579 500121Sustainable development, silica, environmental protection, costs, economics, regression analysis, sales, water absorption, lime, remote sensing
17Energy38965208Coal, hydrogen, sustainable development, energy efficiency, neutron irradiation, catalyst activity, catalysts, combustion, carbon, deposits
18Pharmacology, toxicology, and pharmaceutics 632 21,7835Unclassified drug, metabolism, chemical composition, drug structure, plant extract, chemical structure, physical chemistry, drug effect, drug synthesis, human cell
19Immunology and microbiology 404 16,6296Genetics, unclassified drug, immunology, nucleotide sequence, isolation and purification, phylogeny, metabolism, virology, microbiology, genotype
20Decision sciences245171715Risk assessment, decision support systems, assessment approaches, decision theory, optimization, risk perception, biomass, vegetation cover, fault-trees, safety engineering
21Veterinary 79 15694Vaccination, cattle, brucellosis, unclassified drug, animal tissue, immunology, animal model, veterinary, brucella abortus, bovine
22Psychology11281Human experiment, adolescent, major clinical study, hiv infections, human immunodeficiency virus infection, psychology, education, learning, cross-sectional study, longitudinal study
23Neuroscience473282Physiology, unclassified drug, drug effect, metabolism, animal behavior, in vitro study, antelopes, gazelle, rat, animal tissue
24Health professions 567 10,59014Radiation dose, chemistry, radiation monitoring, radioactive waste, ionizing radiation, radiation dosage, sensitivity and specificity, radiation response, radioisotopes, electronic spin resonance
25Nursing 1221 25,84423Human experiment, Saudi Arabia, psychology, metabolism, physiology, randomized controlled trial, blood, vegetable, body mass, physical activity
Table 5. Results of the author-based research productivity analysis by the Lotka’s law. A sample calculation for the subject area Art and Humanities.
Number of Publications by an Author (x)Number of Authors (Actual)Total Co-Author OccurrencesNumber of Authors (Predicted), When n = 2.00 (Theoretical)Difference of Actual and Predicted, When n = 2.00Number of Authors (Predicted) When n = 2.89Difference of Actual and Predicted, When n = 2.89
13711371137110.0037110.00
25841168927.75−343.75498.8985.10
3141423412.33−271.33154.24−13.24
448192231.93−183.9367.06−19.06
522110148.44−126.4435.15−13.15
6530103.08−98.0820.73−15.73
742875.73−71.7313.27−9.27
81857.98−56.989.01−8.01
921845.81−43.816.41−4.41
1311321.95−20.952.21−1.21
1511516.49−15.491.46−0.46
Total452057165752.53−1232.534519.480.52
Table 6. Summary of the author-based research productivity analysis by Lotka’s law.
NumberSubject AreaValue of the n-ParameterValue of the k-Constant (Percent of Authors Publishing Only 1 Article)
Group 1. Range for the value of the n-parameter (2.00–2.50)2.3371.03
1Medicine2.0563.73
2Immunology and microbiology2.2469.78
3Physics and astronomy2.2769.2
4Engineering2.3771.79
5Chemistry2.3872.15
6Materials science2.4172.78
7Mathematics2.4874.44
8Chemical engineering2.4874.40
Group 2. Range for the value of the n-parameter (2.51–3.00)2.8482.34
1Energy2.6990.79
2Nursing2.7080.78
3Social sciences2.7479.67
4Agricultural and biological sciences2.7880.03
5Economics, econometrics, and finance2.8180.66
6Biochemistry, genetics, and molecular biology2.8781.46
7Art and humanities2.8982.10
8Environmental science2.9182.02
9Business, management, and accounting2.9282.40
10Computer science2.9582.76
11Pharmacology, toxicology, and pharmaceutics2.9883.12
Group 3. Range for the value of the n-parameter (3.01–3.50)3.1184.86
1Veterinary3.0584.17
2Earth and planetary sciences3.0984.42
3Psychology3.2086.01
Group 4. Range for the value of the n-parameter (3.51–4.00)3.7791.24
1Decision sciences3.6890.48
2Health professions3.8091.60
3Neuroscience3.8591.66
Average of all subject areas3.0182.36
Publisher’s Note: MDPI stays neutral with regard to jurisdictional claims in published maps and institutional affiliations.

