Article

Investigation of O/N Ordering in Perovskite-Type Oxynitrides La1−xYxTa(O,N)3 on Long Range and Short Scale

1
Department of Materials- and Geosciences, Materials and Resources, Technische Universität Darmstadt, Peter-Grünberg-Str. 2, 64287 Darmstadt, Germany
2
Department of Materials- and Geosciences, Theory of Magnetic Materials, Technische Universität Darmstadt, Otto-Berndt-Str. 3, 64287 Darmstadt, Germany
3
Department of Chemistry, University of Milan, Via C. Golgi 19, 20133 Milan, Italy
4
Institut Laue Langevin, 71 Avenue des Martyrs, 38047 Grenoble, France
5
Fraunhofer Research Institution for Materials Recycling and Resource Strategies IWKS, Aschaffenburger Str. 121, 63457 Hanau, Germany
*
Author to whom correspondence should be addressed.
Inorganics 2024, 12(3), 90; https://doi.org/10.3390/inorganics12030090
Submission received: 17 February 2024 / Revised: 10 March 2024 / Accepted: 15 March 2024 / Published: 18 March 2024
(This article belongs to the Section Inorganic Solid-State Chemistry)

Abstract

:
Oxynitrides such as LaTa(O,N)3 are attractive materials as photoelectrodes for photoelectrocatalytic solar water splitting. The potential anionic ordering in their perovskite-type structure has been shown to impact the materials’ properties. Given the importance attributed to it, the present study reports a detailed experimental analysis supported by simulations of the anionic ordering of La1−xYxTa(O,N)3. The influence of O/N and yttrium content on the anionic order was assessed. Neutron diffraction analysis was performed on four different nominal compositions—LaTaON2, LaTaO2N, La0.9Y0.1TaON2, and La0.9Y0.1TaO2N—at 10 K and 300 K to study potential long-range ordering. Neutron pair distribution function (PDF) analysis was performed on all samples at 10 K and on non-Y-substituted samples at 300 K to evaluate short-range ordering. There was no evidence of long-range O/N order in any of the compounds. In contrast, at a short range (1.5 Å ≤ r < 6 Å), a Pnma (ab+a) tilting pattern and local cis-ordering of the anions were seen. The latter faded rapidly, leaving the Pnma tilting pattern in a 6 Å ≤ r ≤ 11 Å range. At higher distances, the PDF analysis agreed with the Imma (ab0a) O/N disordered long-range structure. As the O/N content changed, not much difference in behavior was observed. Yttrium substitution introduced some disorder in the structure; nonetheless, it showed marginal influence on octahedral tilting and anionic ordering.

1. Introduction

The conversion of solar energy into a chemical fuel such as hydrogen is attracting attention as a sustainable way to satisfy the world’s energy demand. One possible way to achieve it is through photoelectrocatalytic solar water splitting (SWS). The SWS mechanism entails many steps, with the first of them being photon absorption, which requires visible-light-responsive semiconductor materials [1,2].
Mixed anion compounds, especially oxynitrides, are highly interesting because of their diversity of properties such as superconductivity, high dielectric constant, photoluminescence, and photocatalytic activity [3,4,5]. By (partially) substituting oxygen in precursor oxides, there is a lift of the valence band maximum (VBM) of the materials given that N 2p orbitals have higher energy than the O 2p ones [1,6]. Thus, oxynitrides typically possess a lower band gap than their corresponding oxides, making them attractive materials as electrodes for SWS [3]. Such an anionic doping process also leads to charge compensation mechanisms, since N3− is introduced in the lattice where only O2− anions are present. Consequently, a change in the Fermi level and defects in the crystal structure, such as oxygen vacancies, can come as an effect of the partial substitution of oxygen by nitrogen [7]. What results is a link between anionic doping—and hence the anionic ordering—and the electronic structure, which is highly important to understand.
Many oxynitrides, as in the case of LaTa(O,N)3, have a perovskite-type crystal structure and characteristic formulas such as ABO2N and ABON2, in which A is usually a lanthanide, an alkaline, or an alkaline earth cation, and B is a transition metal cation. In the case of a cubic lattice, cation A is coordinated by 12 anions, and cation B is coordinated by six anions, forming a corner-sharing octahedral B(O,N)6 building block [2,8]. Whether the anions in the ABO2N and ABON2 structures are ordered, and if so, what that order is, remain key questions that are being more and more investigated nowadays, as they can largely alter physical properties [3,4].
There are several properties that influence the band gap of oxynitrides, such as the nitrogen content, oxidation state of the cations, and distortion of the octahedral network [3,9,10,11]. In addition to these factors, strain and anionic ordering are also known to control the band gap [2,12,13]. Thus, the degree of O/N ordering has been gaining attention as a way to tailor oxynitride crystal structures and electric properties [4]. The arrangement of N3− and O2− in the crystal structure highly impacts its material properties, especially the optical and dielectric ones [3], entailing more thorough studies on anionic ordering. According to the literature, anion distributions in oxynitrides have been shown to go from fully ordered [14], to partially ordered [15,16], to completely disordered [17].
LaTaON2 has been initially reported to show a trans-ordering of the anions on a long range [18]. Later studies confirmed the absence of long-range O/N ordering, also based on neutron diffraction data, but a local anionic ordering where layers of disordered cis-anion chains are formed in 2D planes, indicating partial O/N ordering as observed, e.g., for BaTaO2N [19,20], could not be ruled out [3].
This type of ordering has also commonly been observed in the more extensively studied SrTaO2N, where there is a preferential partial ordering with the –B–(O,N)– bonds forming cis-oriented chains in the equatorial planes of the BO4N2 octahedra [5,8,21,22].
One of the motivations of the present paper was to better understand the long-range and short-range anionic ordering of LaTa(O,N)3, to verify whether there is similar behavior between ABO2N and ABON2, and to gain insight into whether the oxygen and nitrogen content has an influence on the ordering. LaTaO2N is accessible from nanocrystalline LaTaO4, while the ammonolysis of microcrystalline LaTaO4 results in the formation of LaTaON2 [23]. However, X-ray diffraction shows a poor contrast between neighboring elements in the periodic table, as is the case of oxygen and nitrogen [24]. Thus, powder neutron diffraction (ND) analysis was performed on LaTaO2N and LaTaON2 at temperatures of 10 K and 300 K (room temperature (RT)), and the data were refined using the Rietveld method to identify the best fitting O/N distribution pattern.
Furthermore, in a prior study [10], the potential for band gap tunability was demonstrated in Y-substituted LaTaO2N, making it the next logical step to analyze the O/N ordering of the material, both on long and short ranges. This would make it possible to understand the impact of ordering on band gap tailoring and the potential correlation between yttrium content and anionic ordering. Thus, powder ND measurements were performed on La0.9Y0.1Ta(O,N)3 at 10 K and RT for the study of anionic ordering in the long range. Additionally, the pair distribution function (PDF) analysis was conducted on LaTaO2N and LaTaON2 at 10 K and RT, as well as on La0.9Y0.1Ta(O,N)3 at 10 K, to investigate the short-range O/N ordering.
Moreover, density-functional theory (DFT) calculations were performed to further elucidate the experimental findings. For this, the cluster expansion (CE) method was used, where the energies of representative configurations obtained by DFT are parameterized. Consequential Monte Carlo (MC) simulations were utilized to examine possible phase transitions and associated changes in the anionic ordering with varying temperatures. The focus of the DFT analysis was the experimental crystal structures of the LaTaON2 perovskite-type oxynitride, specifically in the space groups Imma, Pnma, and Pmn21, selected based on the findings of the PDF analysis.

2. Results and Discussion

2.1. Long-Range Structural Analysis of (La,Y)Ta(O,N)3

Neutron diffraction analysis was performed on the four samples at both 10 K and 300 K to investigate the presence of anionic ordering in the long range. The measurements at 300 K allowed us to analyze the samples at room temperature in their usual state. The measurements at 10 K were performed to minimize any thermal effects on the lattice, such as thermal vibrations, which can cause atomic displacement. For X-rays, it is well known that such effects can decrease the intensity of the diffracted beams [25]. For neutrons, the coherent scattering length bc is typically considered to be Q-independent. However, thermal vibrations and atomic displacement/disorder leads to a Debye-Waller-type dampening of the diffraction intensity, as described by B values [26]. Moreover, we aimed to ascertain whether cooling had any influence on the crystal structure before proceeding with pair distribution function analysis at 10 K.
All the neutron diffraction patterns obtained were refined by the Rietveld method [27,28] using the Fullprof.2k software (version 6.30) [29] for a better understanding of the long-range O/N order, testing various structural models involving different anionic ordering patterns. Two trans-ordered structural models, in space groups C2/m and Imma, two cis-ordered models, I21212 and Ima2, and one random-order model, Imma, were used. These models were chosen according to Porter et al. [3], who have indicated that LaTaON2 shows an ab0a pattern of octahedral tilting and therefore can adopt any of these anion-ordering models. Additionally, the latter model is in agreement with synchrotron diffraction data presented in a previous study [23]. Firstly, all collected neutron diffraction patterns at 300 K were refined as a random-ordered model in Imma using free refinements of the O and N content, while having an overall constraint to an anionic content of 3 and respecting the maximum possible site occupation factor of 1. The results are summarized in Table 1. For LaTaON2 and La0.9Y0.1TaON2, within experimental uncertainty, the nominal compositions were confirmed by the refinements. It is important to note that the refinements of the La0.9Y0.1TaO2N compound revealed that the real composition was La0.9Y0.1TaO1.58(7)N1.42(7). For LaTaO2N, the situation remained somewhat unclear as the free refinements strongly pointed to the presence of a N-rich composition. However, in parallel, the Biso values of O(1)/N(1) and O(2)/N(2) were significantly enlarged at the same time, indicating the presence of too much scattering density. This behavior is also in contrast to the observed behavior of LaTaON2 and La0.9Y0.1TaON2, where the free refinements of O and N content resulted in significantly lower B values compared to the refinements using fixed compositions. For simplification purposes, the compounds are hereafter solely referred to by their nominal compositions. Secondly, the above-described O/N long-range ordered models were tested and the best-fitting models were determined based on the lowest χ2 values obtained from the Rietveld refinements, provided that the refinements could be based on physically meaningful parameters.
As an example, the refined neutron diffraction patterns of the 300 K measurements are illustrated in Figure 1a–d. The refined patterns of the 10 K measurements can be found in the Supplementary Materials (Figure S1a–d). The refined results are summarized in Table S1.
The nominal compositions of the materials and the different tested structural models used for refinements at 10 K and 300 K are summarized in Table 2, along with the corresponding χ2 values.
By observation of the χ2 values presented in Table 2, it is evident that the disordered structural refinements using the Imma random structural model provided the best fit for all compositions as indicated by the lowest numbers. This is evidence that there is no long-range O/N order in the measured (La,Y)Ta(O,N)3 materials. It is important to note that although some of the χ2 values are lower for other structural models on some of the samples, these values were obtained by refinements that involved non-physically meaningful parameters, such as a negative Biso-value, which is the isotropic, temperature-dependent Debye-Waller atomic displacement parameter. Nevertheless, these refinements of alternative structural models have been included for completeness. All refinements were carried out in a manner to maintain consistency in the number of free parameters, ensuring a reasonable comparison between the different refinement models.
However, it has been shown that in some materials, although there is no long-range O/N order, there is intermediate anionic ordering characterized by local clustering that can generate well-ordered local anion arrangements [2]. An example of such local ordering, most frequently observed in SrTaO2N and some LaTaON2 studies, is the formation of layers of zig-zag Ta–N chains that lead to local cis-N–Ta–N configurations. Porter et al. [3] explained that cis-configurations are favored over trans-configurations because of lower lattice enthalpies in the former. Additionally, the propensity for a cis-configuration does not result in long-range anionic ordering because there are numerous distinct cis-ordered structures with similar enthalpies.
To shed light on the experimental findings, we performed theoretical investigations combining DFT calculations, CE modelling, and Monte Carlo simulations. Focusing on the experimental crystal structures of LaTaON2, a set of 300 configurations was generated, featuring randomly distributed O/N atoms within a 40-atom supercell. These configurations were uniquely crafted to ensure energetic distinctiveness, eliminating the possibility of symmetrical equivalence between any two randomly created configurations. Figure 2 depicts the Imma crystal structure of LaTaON2, where orbit indices 2, 3, 4, and 5 represent the possible first-nearest-neighbor (1NNs) configurations of N–N, N–O, and O–O; while orbit indices 8, 9, and 10 represent the possible second-nearest-neighbor (2NNs) configurations of N–N, N–O, and O–O. The experimental lattice parameters were aexp = 5.701 Å, bexp = 8.041 Å, and cexp = 5.736 Å and the calculated lattice parameters were identical, except for ccalc = 5.707 Å.
Our DFT calculations were performed using the augmented plane wave method as implemented in the Vienna Ab initio Simulation Pack (VASP) [30,31], where the total energies of all 300 configurations were evaluated after full geometric optimization. The DFT-calculated energies of the randomly generated configurations were then fed into the CE models through linear fitting, utilizing the automatic relevance detection regression (ARDR) algorithm implemented within the integrated cluster expansion toolkit (ICET) [32]. The results of this fitting of the elective cluster interactions can be seen in Figure S2. The Monte Carlo simulations were conducted using the MCHAMMER module of ICET. A significantly larger 12 × 12 × 12 supercell was employed for these simulations, operating in the canonical ensemble. We adopted a simulated annealing procedure, where the temperature was gradually decreased from 2000 K to 0 K at a rate of 100 K per 100,000 MC cycles. Throughout these simulations, monitoring of cluster counts was maintained to provide statistical insight into the distribution and interaction between O and N occupations. Moreover, it facilitated the characterization of the temperature-dependent behavior of the nearest neighbors for specific species.
The Monte Carlo results displayed in Figure 3a indicate that there is no preference for the nitrogen ions to occupy a specific Wyckoff position in the structure of LaTaON2. This supports the observation based on the neutron diffraction analysis above, which indicates that the disordered Imma structure is preferred in LaTaON2. Furthermore, as seen in Figure 3b, the number of two-body N–N clusters in the second-nearest-neighbor configuration—represented by indices 8, 9, and 10—approaches much lower numbers when compared to the number of two-body N–N clusters in the first-nearest-neighbor configuration—represented by indices 2, 3, and 4—including at our material’s synthesis temperature of T = 1275 K. This indicates that the propensity for a cis-configuration in LaTaON2 was confirmed by the MC simulations.
Thus, a pair distribution function (PDF) analysis was performed for a better understanding of the anionic order in (La,Y)Ta(O,N)3. Various structural models were tested for all samples at 10 K and for the LaTa(O,N)3 ones at 300 K. Different tilting and O/N ordering patterns at diverse length scales were tested. The best-fitting models were chosen based on the lowest Rw values obtained from the pattern refinements.

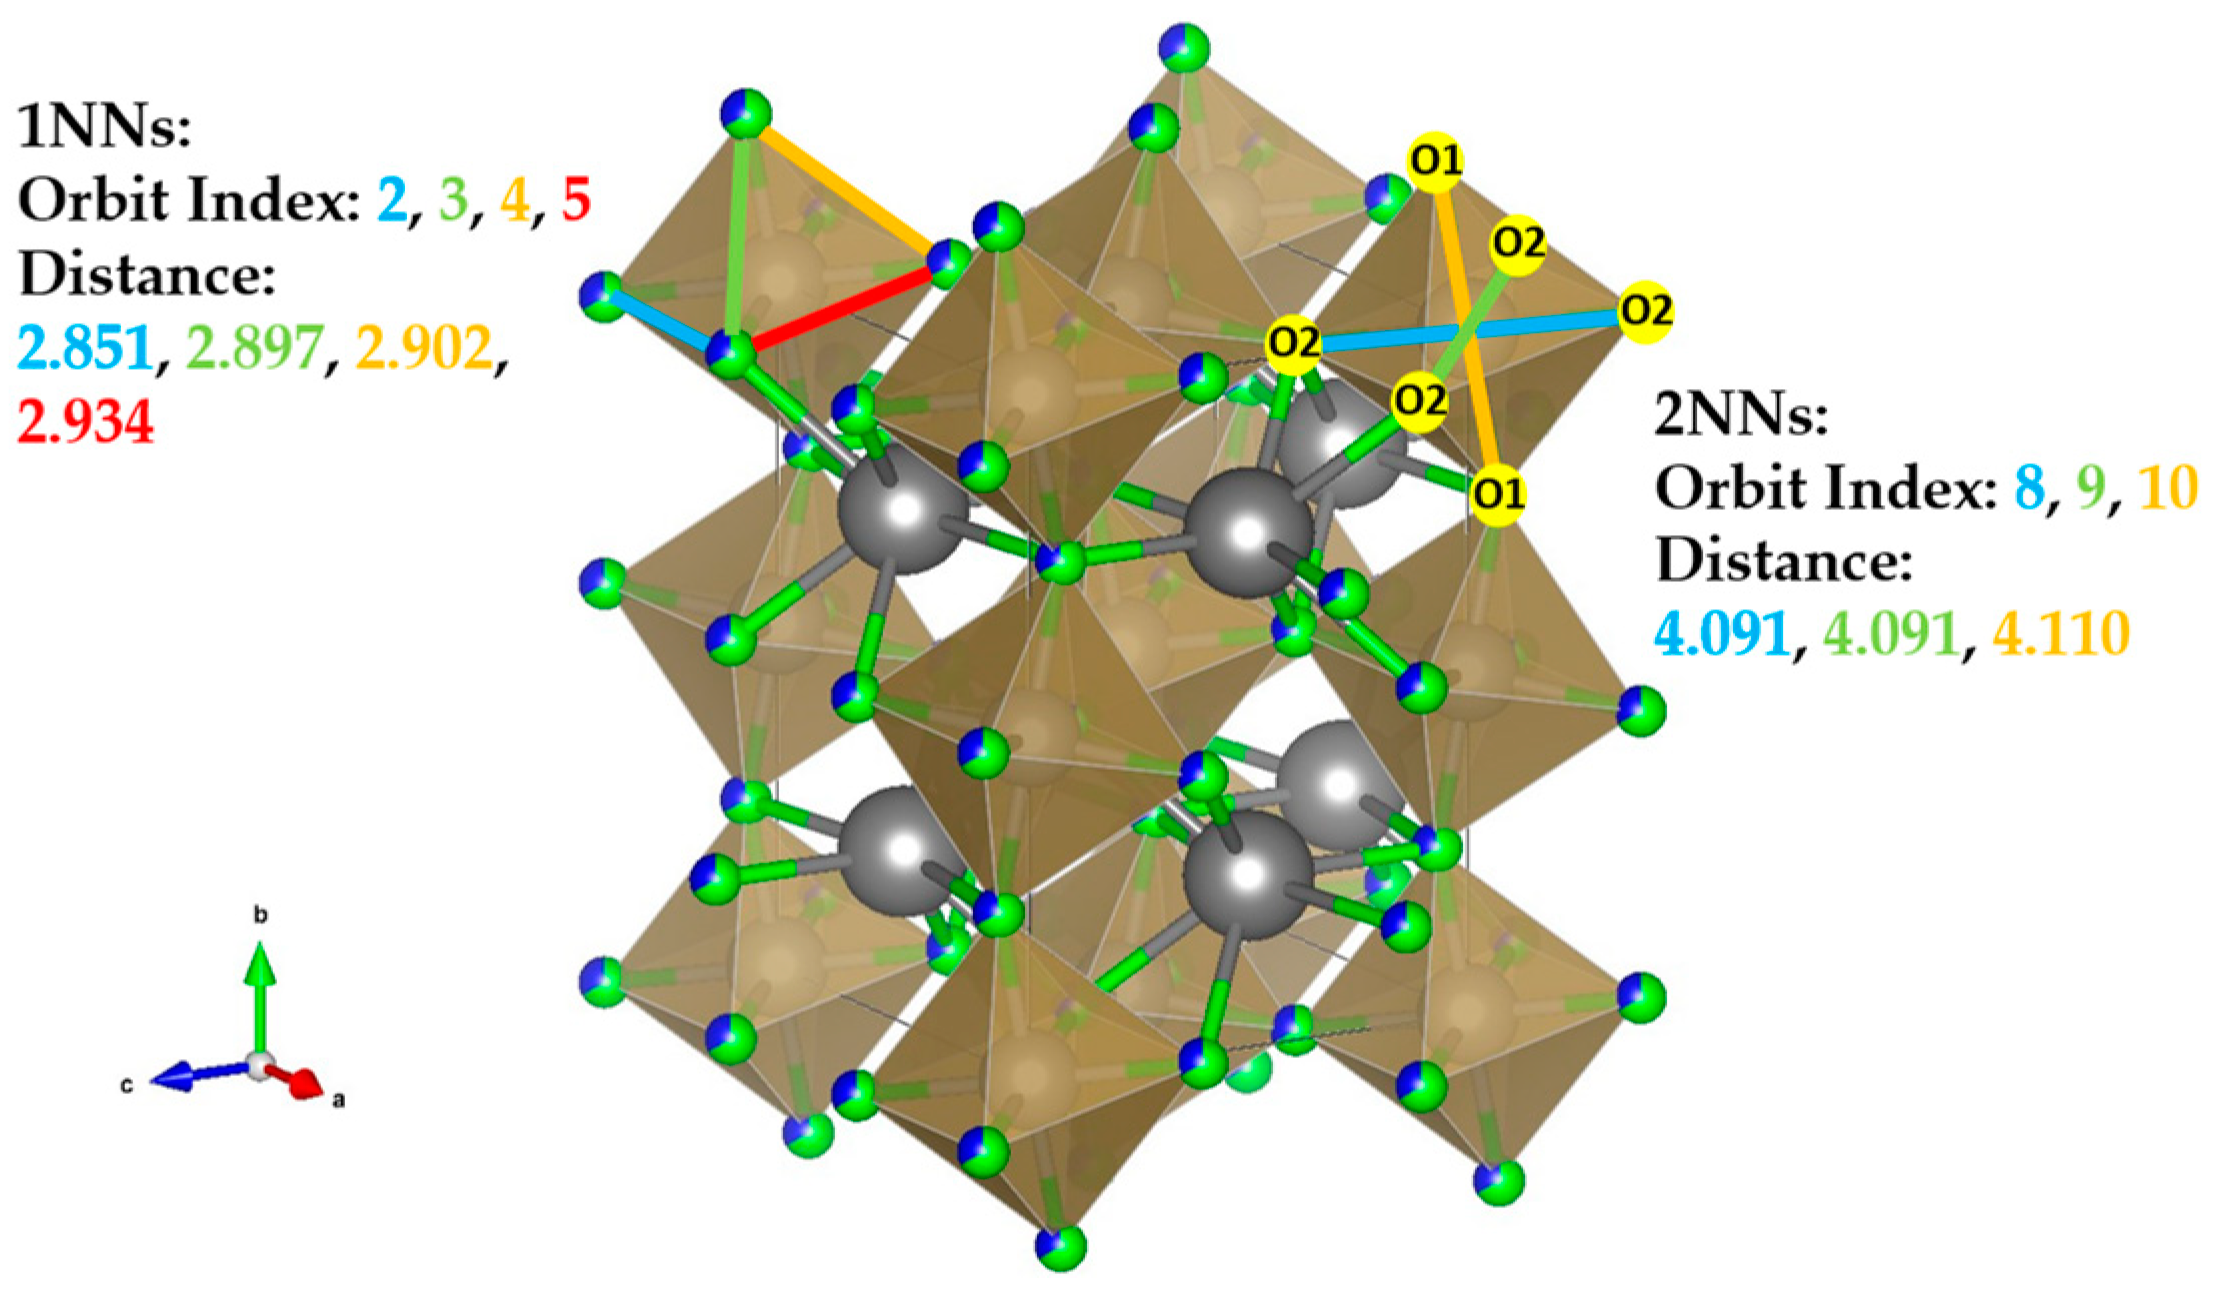
2.2. Short-Range Structural Analysis of (La,Y)Ta(O,N)3

2.2.1. LaTaON2 and LaTaO2N

First, a definition of three models is vital for the analysis of the PDF data. A “disordered” model as observed from the neutron diffraction refinements on a long range is one where O and N share both sites with a 0.333/0.667 ratio in the case of LaTaON2 and a ~0.667/0.333 ratio in the case of LaTaO2N; an “ordered” model corresponds to one where the N(1) site is occupied only by oxygen; and an “inverse-ordered” model describes a situation where the N(1) site is occupied only by nitrogen atoms.
The best fit in LaTaON2 at 10 K for the average structure (space group: Imma) with a disordered model can be seen in Figure 4a.
Then, different models were tested, setting selected (or all) U values as anisotropic. The fit quality improved only when the U(La) and U(O(2)/N(2)) thermal parameters were considered anisotropic, different to the U(Ta) and U(O(1)/N(1)) case. In addition, no ellipsoid elongation was observed in the last two cases. To avoid having too many parameters and correlations among them, in the following refinements only, the U(La) and U(O(2)/N(2)) thermal parameters were set as anisotropic. This fit resulted in the Rw values seen in Table 3, for both LaTaON2 and LaTaO2N. When trying to introduce other models or other kinds of thermal parameters, no significant improvements in Rw values were observed, as shown in Table S2.
By observation of the crystal structure of LaTaON2 with the U(La,O(2)/N(2))aniso thermal parameters and space group Imma, seen in Figure 4b, it was possible to distinguish elongated ellipsoids of the (O(2)/N(2)) sites along the b-axis. This could indicate either a positional disorder on the O(2)/N(2) site, implying different N–Ta–N, N–Ta–O, and O–Ta–O bond angles in the structure, or tilting along the b-axis.
All the anionic ordering patterns, both trans-(Imma and C2/m) and cis-(Ima2 and I212121), as described in Porter et al. [3], were tested, resulting in higher Rw values and indicating a lack of order in the fitting range of up to 11 Å in any of these models. This, along with the disordered Imma structure Rw values shown in Table 4 for more expanded r ranges, corroborates the previous conclusion drawn from the neutron diffraction analysis, which ruled out the possibility of long-range ordering.
For both compositions, LaTaON2 and LaTaO2N, at 10 K, the addition of in-phase rotation of the octahedra in the perovskite-type structure along the b-axis brought a good fit, as depicted in Figure 5a,b.
The N/O site occupation was allowed to fluctuate, resulting in inverse-ordered models. After introducing tilting along the b-axis, only isotropic thermal parameters were necessary, and the difference between the O(1)/N(1) and O(2)/N(2) thermal parameters was the smallest using this model, with U(O(1)/N(1))iso = 0.004(1) Å2 and U(O(2)/N(2))iso = 0.010(2) Å2 for LaTaON2, and U(O(1)/N(1))iso = 0.003(1) Å2 and U(O(2)/N(2))iso = 0.008(2) Å2 for LaTaO2N. This fit revealed a Pnma (ab+a) tilting pattern, with Rw values that can be seen in Table 3 for both compositions.
However, noticeable differences can be seen in the fit in the 2.2 Å ≤ r ≤ 3 Å interval, which could indicate the confinement of oxygen at the N(2) site; leading to a hidden order at a local scale. Applying, in LaTaON2, local O/N ordering along the c-axis, with the formation of alternate …–N–N–N–… and …–O–O–O–… rows running along either the c- or the a-axis, as shown in Figure 6a, resulted in the best fit in the local range. With this model, each octahedron had an edge formed by two oxygen ions in the ac plane, and the lattice symmetry should be changed to Pmn21. However, to reduce the number of variable parameters, the symmetry constraints and axis orientations of Pnma were maintained and only the shift of the tantalum atom towards the N–N edge was introduced here as one degree of freedom.
For LaTaO2N, the same structure was applied by simply exchanging the O/N ratio and turning positions 22 and 28 from nitrogen atoms into oxygen atoms, as seen in Figure 6b, and this model also resulted in the best fit.
The fits obtained after applying the aforementioned models can be seen in Figure 7b and Figure 8b. The Rw values obtained are represented in Table 3, and U(O(1)/N(1)) = U(O(2)/N(2)) was introduced as a constraint for both compositions to reduce the number of fluctuating parameters, implying equal disorder on both sites.
Figure 7a and Figure 8a represent a scaling down of the fits using the Pnma model seen in Figure 5a,b to the 1.5 Å ≤ r ≤ 5.5 Å range for better comparison.
By putting the Pnma inverse-ordered models side by side with the models ordered along the c-axis, a fit improvement was observed in the 2.2 Å ≤ r ≤ 3 Å interval of the latter model (Figure 7b and Figure 8b) for both compounds. Furthermore, although there was a lower improvement in the fit in the widest range of LaTaON2, the Rw of both materials was clearly lower in the shortest range when compared, as seen in Table 3.
As an overview, for both LaTaON2 and LaTaO2N, the best fit expressed by the lowest Rw values for the wider (r < 11 Å) and shorter (r < 5.5 Å) ranges was obtained by the Pmn21 model, which indicated a Pnma (ab+a) tilting pattern and local cis-ordering of the anions along the c-axis. However, in both cases, the Rw values of the Pnma and Pmn21 models became closer in the widest fitting range, indicating a dampening of the cis-ordering along the c-axis in the wider range.
The content of oxygen and nitrogen has little influence on O/N ordering since both materials present a preference for cis-anionic ordering in a local range, and no anionic ordering in the long range. Only the coherence of the cis-ordering in LaTaO2N is affected by the O/N content.
When it comes to the coherence length of the in-phase tilting along the b-axis in LaTaON2, as seen in Table 4, the best fit up to 11 Å was always the one that took tilting into account. However, above 11 Å, the experimental data were best fitted by the Imma disordered structure. This may be an indication that the coherence length of tilting is about 1 nm, which may then be limited by antiphase boundaries that break the tilting correlation.
As for the fits of both compositions at 300 K, the conclusion is much the same as for the fits of the samples at 10 K: there is octahedral tilting along the b-axis and localized cis-ordering of the anions. Overall, the Rw values are lower (Rw(LaTaON2) = 0.075; Rw(LaTaO2N) = 0.064 at 1.5 Å ≤ r ≤ 5.5 Å); however, the peak broadening due to thermal vibrations makes it harder to distinguish between the different tested models.
A theoretical analysis was performed using the same approach described in the previous section. Figures S3 and S4 display the results for the obtained Pnma and Pmn21 crystal structures of LaTaON2, respectively, in which the specific orbit indices representing the existing first-nearest-neighbor and second-nearest-neighbor configurations in each structure can be distinguished. The lattice parameters are summarized in Table S3. The results of the fittings of the elective cluster interactions of Pnma and Pmn21 LaTaON2 can be seen in Figure S5 and Figure S6, respectively.
The Monte Carlo results depicted in Figure 9 support the results obtained by the PDF analysis, as they indicate a preference for a cis-configuration in LaTaON2. Since the number of two-body N–N clusters in the second-nearest-neighbor configuration—represented by indices 11, 12, and 13 in Figure 9a and indices 21, 22, and 23 in Figure 9b—is lower than the number of two body N–N clusters in the first-nearest-neighbor configuration—represented by indices 2, 3, and 4 in Figure 9a and indices 7, 8, and 9 in Figure 9b—including at our materials synthesis temperature of T = 1275 K, this indicates that for both Pnma and Pmn21 LaTaON2, there is a cis-configuration preference.
In order to incorporate the effect of anionic ordering, a 40-atom special quasi-random-ordered (SQoS) [33,34] supercell was constructed by cluster correlation functions calculated at T = 1750 K, 1500 K, 1250 K, 1000 K, 750 K, and 500 K, as a representative structure in the space groups Imma, Pnma, and Pmn21 LaTaON2 at finite temperature. These temperatures were selected for the construction of the SQoS to cover a range from well above the synthesis temperature to well below it, providing insight into the ordering behavior across different thermal conditions, so as to simulate an annealing procedure.
The structurally relaxed SQoS energies of space groups Imma, Pnma, and Pmn21 of LaTaON2, which are temperature-dependent, are represented in Figure 10, and simulate representative structures characterized by a short-range order. As a reference, the special quasi-random (SQS) Imma supercell structure, depicted in a black dashed line in Figure 10, simulates a configurationally fully disordered system. The fundamental idea consisted of identifying a specific configuration within a given supercell, wherein the component atoms were distributed as randomly as possible. The SQS is temperature-independent. The energy comparison revealed that the ordered Imma structure had a significantly higher energy (~30 meV) compared to the SQS Imma supercell structure at T = 1750 K, indicating that the disordered Imma structure (represented by the SQS) is favored at very high temperatures, as observed in Figure 10. The energies of the SQoS Pnma and Pmn21 structures are comparable to the disorder energy. As the temperature decreased towards 1000 K, the SQoS structure of Imma became progressively more stable. Overall, the three phases coexist at low temperatures and the energy difference (~30 meV) was of the same magnitude as the thermal fluctuation. At the synthesis temperature, T = 1275 K, the energies of all SQoS structures were comparable to the energy of the Imma disordered structure. This suggests no clear preference for either structure.

2.2.2. La0.9Y0.1Ta(O,N)3

The same fitting process was applied to the PDF data of the Y-substituted compounds, La0.9Y0.1TaON2 and La0.9Y0.1TaO2N, and the overall features presented minimal change from the non-substituted to the isovalently substituted samples.
The addition of in-phase rotation of the octahedral network along the b-axis yielded good fits, as depicted in Figure 11a and Figure 12a. A disordered model was observed in La0.9Y0.1TaON2, whereas an inverse-ordered model was noted in La0.9Y0.1TaO2N. The latter might have been caused by the 1:1 O/N ratio, as observed from the neutron diffraction data. Both compositions exhibited a Pnma (ab+a) tilting pattern, with corresponding Rw values that are summarized in Table 5. By applying local O/N ordering along the c-axis, the best fits in the local range were achieved, as illustrated in Figure 11b and Figure 12b. These fits resulted in Rw values that are presented in Table 5.
When comparing the Pnma models with the models ordered along the c-axis, a slight fit improvement was observed for both compounds in the latter model. Furthermore, the Rw values of both materials slightly decreased in the shortest range when comparing the two different models.
Yttrium substitution did not alter the tilting pattern along the b-axis, which remained as Pnma (ab+a), nor did it affect the ordering patterns, as the local cis-ordering of the anions remained. However, as shown by the fits represented in Figure 11 and Figure 12, isovalent substitution did introduce some additional disorder in the structure, affecting the quality of the fit and making the PDF analysis more challenging. This may indicate a dampening of the cis-ordering of the anions with the introduction of yttrium into the compounds, as is confirmed by the Rw values presented in Table 5, since in the 1.5 Å ≤ r ≤ 11 Å range, the Rw gets higher when compared to the shorter range and, in the case of La0.9Y0.1TaON2, the lower Rw value was obtained by the Pnma space group model in the widest range compared to Pmn21 in the shortest (1.5 Å ≤ r ≤ 5.5 Å) range.

3. Materials and Methods

3.1. Synthesis of LaTaO2N and LaTaON2

The oxynitrides LaTaO2N and LaTaON2 were synthesized from the respective precursor oxides via thermal ammonolysis, at 900 °C for 10 h, with an NH3 gas flow rate of 300 mL/min (>99.98%; Westfalen AG, Münster, Germany). A second ammonolysis cycle was carried out at 1000 °C for 14 h, using a KCl flux (≥99%, Ph. Eur.; Carl Roth GmbH & Co. KG, Karlsruhe, Germany) with a sample-to-flux weight ratio of 1:1, as a way of contributing to a more homogeneous material and to a lower defect concentration, which enhances the material’s purity and crystallinity [35,36]. Further details regarding the synthesis of the precursor oxides and the oxynitrides can be found in the study by Bubeck et al. [23].

3.2. Synthesis of La0.9Y0.1Ta(O,N)3

The oxide precursors for La0.9Y0.1Ta(O,N)3 were prepared by a sol-gel-related method with the addition of the appropriate amount of Y(NO3)3·6H2O (99.9%; Alfa Aesar, Kandel, Germany) according to the 10 mol% fraction, as previously described in [10]. The oxynitride material was then synthesized from the respective precursor oxide via ex situ thermal ammonolysis, following the detailed procedure outlined in prior work [10]: at 950 °C for 10 h, under an NH3 gas flow rate of 300 mL/min (>99.98%; Westfalen AG, Münster, Germany), followed by repeated ammonolysis cycles with KCl flux addition (weight ratio 1:1) at 1000 °C for 14 h until phase purity was achieved. Further information regarding the synthesis of the precursor oxides can be found in the study by Bubeck et al. [10].

3.3. Sample Characterization

Neutron diffraction experiments were performed using the D2B high-resolution powder diffractometer of the Institut Laue-Langevin in Grenoble, France, at both 10 K and 300 K, utilizing a Ge (335) monochromator and a take-off angle of 135°. The refined wavelength using a Si standard sample was 1.59417(2) Å. Samples were measured in 6 mm diameter vanadium cans at room temperature and at 10 K using a cryofurnace. All the neutron diffraction patterns obtained were refined by the Rietveld method [27,28], using the Fullprof.2k software (version 6.30) [29]. For the refinement, a pseudo-Voigt profile function was used with the Caglioti formula for the full width at half maximum (FWHM) determination, and the background was calculated using selected points with linear interpolation between them.
Data collection for pair distribution function analysis was carried out using the disordered-materials diffractometer D4c at the Institut Laue-Langevin (ILL) in Grenoble, France [37], at 10 K and 300 K, covering a Q-range up to 23.6 Å−1. Each pattern summed up different scans for total counting times of ≈6 h. Empty cryostat, vanadium rod, empty cans, and boron powder patterns were also measured in order to properly subtract the background and normalize the data. The incident neutron wavelength λ = 0.4959(3) Å was calculated using a Ni standard.
The local structural evolution was investigated through the PDF analysis, adopting the G(r) formalism as described by Egami et al. [38]. The G(r) was experimentally determined via sine Fourier transform of the total scattering function S(Q), utilizing the proprietary software of D4c beamline [37]; and it indicates the probability of finding a pair of atoms separated by a distance r with an integrated intensity dependent on the pair multiplicity and the coherence scattering lengths of the elements involved. The data analysis took advantage of the large bound coherent scattering lengths of the “light” elements, nitrogen (bc = 9.36(2) fm) and oxygen (bc = 5.803(4) fm) [26], for neutron scattering and of the contrast between their two values. Modelling of PDF data was performed via PDFgui [39].

3.4. Density-Functional Theory Analysis

Density-functional theory analysis was performed using the cluster expansion method. Monte Carlo simulations based on the CE models were utilized. For each space group, a set of 300 configurations was generated, featuring O/N atoms randomly distributed within a 40-atom supercell.
The Kohn–Sham DFT, as implemented in the Vienna Ab initio Simulation Pack (VASP) was employed to ascertain the total energy of each configuration in their fully relaxed geometry. The interaction between valence and core electrons was addressed using the projector augmented wave (PAW) [40] method, in which the 5s and 5p states of La and the 5p states of Ta were used as valence electrons. A plane wave basis energy cutoff of 520 eV was established. The Perdew–Burke–Ernzerhof-for-solids (PBEsol) [41] density-functional approximation was applied for a better equilibrium lattice properties description. The Brillouin zone was densely sampled with 1000 k-points per reciprocal atom. The energy convergence criterion for self-consistent field iterations was meticulously set at 10−5 eV. Both unit cell parameters and internal atomic positions underwent optimization through the conjugate gradient algorithm until the residual forces reached a threshold below 10 meV Å−1.
The DFT-calculated energies from the randomly generated configurations were calculated and then integrated into the CE models through linear fitting, utilizing the automatic relevance detection regression (ARDR) algorithm implemented within the integrated cluster expansion toolkit (ICET) [32]. The Monte Carlo simulations were conducted using the MCHAMMER module of ICET. A significantly larger 12 × 12 × 12 supercell was employed for these simulations, operating in the canonical ensemble. A simulated annealing procedure was adopted, where the temperature was gradually decreased from 2000 K to 0 K at a rate of 100 K per 100,000 MC cycles.
A 40-atom SQoS [33,34] supercell was constructed by using cluster correlation functions calculated at T = 1750 K, 1500 K, 1250 K, 1000 K, 750 K, and 500 K, serving as a representative structure of Imma, Pnma, and Pmn21 LaTaON2 at finite temperature. Additionally, the SQS [42,43] supercell was considered to explore the possible configurational dependence of electronic properties of LaTaON2. The construction of the SQS and SQoS was accomplished by the ICET.

4. Conclusions

The neutron diffraction analysis conducted on the (La,Y)Ta(O,N)3 materials at 10 K and RT revealed that the best fit using the Imma random structural model indicated the absence of long-range O/N order in all of the compositions.
Pair distribution function analysis conducted on LaTa(O,N)3 at 10 K and RT, as well as on La0.9Y0.1Ta(O,N)3 at 10 K, revealed that starting with the long-range model, the best fit for r > 11 Å corresponded to the Imma average structure disordered model. When various anionic ordering patterns, including trans- and cis-orderings, were tested, the fits worsened, corroborating the conclusion drawn from the neutron diffraction analysis.
The summarized model of the anionic ordering suggests that in a longer distance range (r > 11 Å), there is no discernible ordering of the anions; within the range of 1.5 Å ≤ r ≤ 11 Å, a Pnma tilting pattern along the b-axis is observed, without any anionic ordering, and at a shorter range of 1.5 Å ≤ r < 6 Å, both the Pnma (ab+a) tilting pattern and local cis-ordering of the anions are present. This conclusion was the same for all compositions studied, indicating that O/N content does not significantly influence anionic ordering, except for a wider ordering coherence observed in LaTaO2N compared to LaTaON2. These experimental findings are corroborated by the simulation experiments, which point as well to the absence of O/N ordering on the long range, in particular at higher temperatures, while the simulated annealing procedure using a MC approach revealed a preference for cis-ordering of the O and N on a local scale.
Yttrium substitution appeared to have minimal impact on octahedral tilting and O/N ordering in the structure. However, it did introduce some degree of disorder, as evidenced by the lower quality of fits obtained in the structural analysis. This suggested a dampening effect, especially on the anionic ordering.
The present study demonstrates that both LaTaON2 and LaTaO2N show similar behavior, characterized by the presence of local cis-ordering of the anions. Moreover, it suggests that anionic ordering does not significantly influence the band gap tunability resulting from Y-substitution. This finding emphasizes the stability of the band gap properties despite variations in anionic ordering, and might provide valuable insights into the future potential applications of these materials in optoelectronic devices.

Supplementary Materials

The following supporting information can be downloaded at: https://www.mdpi.com/article/10.3390/inorganics12030090/s1, Figure S1: Refined neutron diffraction patterns of (a) LaTaON2, (b) LaTaO2N, (c) La0.9Y0.1TaON2, and (d) La0.9Y0.1TaO2N at 10 K using the Imma random structural model; Figure S2: (a) ECIs for the cluster expansion energy of DFT energies, and (b) calculated and fitted DFT energies of the configurations of Imma LaTaON2; Figure S3: Symmetrically non-equivalent two-body clusters in the cluster expansion of the total energy as a function of O/N occupation in Pnma LaTaON2; Figure S4: Symmetrically non-equivalent two-body clusters in the cluster expansion of the total energy as a function of O/N occupation in Pmn21 LaTaON2; Figure S5: (a) ECIs for the cluster expansion energy of DFT energies, and (b) calculated and fitted DFT energies of the configurations of Pnma LaTaON2; Figure S6: (a) ECIs for the cluster expansion energy of DFT energies, and (b) calculated and fitted DFT energies of the configurations of Pmn21 LaTaON2; Table S1: Rietveld refinement results of ND patterns at 300 K and 10 K of (a) LaTaON2, (b) LaTaO2N, (c) La0.9Y0.1TaON2, and (d) La0.9Y0.1TaO2N; Table S2: Rw values using distinct anisotropic thermal parameters in the PDF analysis for Imma LaTaON2 at 10 K; Table S3: Experimental and calculated lattice parameters of Pnma and Pmn21 LaTaON2, as determined by DFT analysis.

Author Contributions

Conceptualization, M.S., H.Z. and M.W.; data curation, C.B. and M.S.; formal analysis, M.D., C.B., M.S., G.J.C. and M.W.; funding acquisition, H.Z. and A.W.; investigation, M.D., C.B., M.S., G.J.C. and M.W.; methodology, M.B., M.D., C.B., M.S., G.J.C., H.Z. and M.W.; project administration, M.W.; resources, H.Z.; software, M.D.; supervision, H.Z., A.W. and M.W.; validation, M.D., H.Z. and M.W.; visualization, M.B.; writing—original draft, M.B.; writing—review and editing, M.D., C.B., M.S., H.Z., A.W. and M.W. All authors have read and agreed to the published version of the manuscript.

Funding

This research was funded by the German Research Council (DFG) within CRC 1548 (FLAIR), Grant No. 463184206 and SPP 1613 (SolarH2), Grant No. 198634447. M.S. acknowledges the financial support from the Università degli Studi di Milano (PSR2022_DIP_005_PI_AVERT_01 projects “Piano di Sostegno alla Ricerca 2022, Linea 2, Azione A”).

Data Availability Statement

All involved measurement and analysis data can be accessed from the corresponding authors upon justified request. The raw data collected on D2B and D4c at the ILL, Grenoble, France, are available under https://doi.ill.fr/10.5291/ILL-DATA.6-06-482 accessed on 10 March 2024.

Acknowledgments

The authors kindly acknowledge the granted beam time by the ILL and the financial support received during the experiment. M.W. expresses his sincere thanks to Achim Diem, Christian Bäucker, and Lukas Link (University of Stuttgart) for their kind support during the sample preparation and the neutron diffraction experiments.

Conflicts of Interest

The authors declare no conflicts of interest.

References

  1. Kubo, A.; Giorgi, G.; Yamashita, K. Anion Ordering in CaTaO2N: Structural Impact on the Photocatalytic Activity. Insights from First-Principles. Chem. Mater. 2017, 29, 539–545. [Google Scholar] [CrossRef]
  2. Ziani, A.; Le Paven, C.; Le Gendre, L.; Marlec, F.; Benzerga, R.; Tessier, F.; Cheviré, F.; Hedhili, M.N.; Garcia-Esparza, A.T.; Melissen, S.; et al. Photophysical Properties of SrTaO2N Thin Films and Influence of Anion Ordering: A Joint Theoretical and Experimental Investigation. Chem. Mater. 2017, 29, 3989–3998. [Google Scholar] [CrossRef]
  3. Porter, S.H.; Huang, Z.; Woodward, P.M. Study of Anion Order/Disorder in RTaN2O (R = La, Ce, Pr) Perovskite Nitride Oxides. Cryst. Growth Des. 2014, 14, 117–125. [Google Scholar] [CrossRef]
  4. Attfield, J.P. Principles and Applications of Anion Order in Solid Oxynitrides. Cryst. Growth Des. 2013, 13, 4623–4629. [Google Scholar] [CrossRef]
  5. Clark, L.; Oró-Solé, J.; Knight, K.S.; Fuertes, A.; Attfield, J.P. Thermally Robust Anion-Chain Order in Oxynitride Perovskites. Chem. Mater. 2013, 25, 5004–5011. [Google Scholar] [CrossRef]
  6. Ninova, S.; Aschauer, U. Anion-Order Driven Polar Interfaces at LaTiO2N Surfaces. J. Mater. Chem. A Mater. 2019, 7, 2129–2134. [Google Scholar] [CrossRef]
  7. Klein, A.; Albe, K.; Bein, N.; Clemens, O.; Creutz, K.A.; Erhart, P.; Frericks, M.; Ghorbani, E.; Hofmann, J.P.; Huang, B.; et al. The Fermi Energy as Common Parameter to Describe Charge Compensation Mechanisms: A Path to Fermi Level Engineering of Oxide Electroceramics. J. Electroceram. 2023, 51, 147–177. [Google Scholar] [CrossRef]
  8. Young, S.D.; Chen, J.; Sun, W.; Goldsmith, B.R.; Pilania, G. Thermodynamic Stability and Anion Ordering of Perovskite Oxynitrides. Chem. Mater. 2023, 35, 5975–5987. [Google Scholar] [CrossRef]
  9. Jansen, M.; Letschert, H.P. Inorganic Yellow-Red Pigments without Toxic Metals. Nature 2000, 404, 980–982. [Google Scholar] [CrossRef]
  10. Bubeck, C.; Bubeck, C.; Widenmeyer, M.; De Denko, A.T.; Richter, G.; Coduri, M.; Coduri, M.; Colera, E.S.; Colera, E.S.; Goering, E.; et al. Bandgap-Adjustment and Enhanced Surface Photovoltage in Y-Substituted LaTaIVO2N. J. Mater. Chem. A Mater. 2020, 8, 11837–11848. [Google Scholar] [CrossRef]
  11. Wang, C.H.; Kennedy, B.J.; Menezes De Oliveira, A.L.; Polt, J.; Knight, K.S. The Impact of Anion Ordering on Octahedra Distortion and Phase Transitions in SrTaO2N and BaTaO2N. Acta Crystallogr. B Struct. Sci. Cryst. Eng. Mater. 2017, 73, 389–398. [Google Scholar] [CrossRef]
  12. Zhao, Z.C.; Yang, C.L.; Meng, Q.T.; Wang, M.S.; Ma, X.G. Strain Effect on the Electronic and Optical Properties of ATaO2N (A = Ca, Sr, and Ba): Insights from the First-Principles. Appl. Phys. A Mater. Sci. Process 2019, 125, 789. [Google Scholar] [CrossRef]
  13. Vonrüti, N.; Aschauer, U. Epitaxial Strain Dependence of Band Gaps in Perovskite Oxynitrides Compared to Perovskite Oxides. Phys. Rev. Mater. 2018, 2, 105401. [Google Scholar] [CrossRef]
  14. Yang, M.; Oró-Solé, J.; Kusmartseva, A.; Fuertes, A.; Attfield, J.P. Electronic Tuning of Two Metals and Colossal Magnetoresistances in EuWO1+xN2−x Perovskites. J. Am. Chem. Soc. 2010, 132, 4822–4829. [Google Scholar] [CrossRef]
  15. Johnston, H.; Black, A.P.; Kayser, P.; Oró-Solé, J.; Keen, D.A.; Fuertes, A.; Paul Attfield, J. Dimensional Crossover of Correlated Anion Disorder in Oxynitride Perovskites. Chem. Commun. 2018, 54, 5245–5247. [Google Scholar] [CrossRef]
  16. Ebbinghaus, S.G.; Weidenkaff, A.; Rachel, A.; Reller, A. Powder Neutron Diffraction of SrNbO2N at Room Temperature and 1.5 K. Acta Crystallogr. C 2004, 60, i91–i93. [Google Scholar] [CrossRef] [PubMed]
  17. Clarke, S.J.; Hardstone, K.A.; Michie, C.W.; Rosseinsky, M.J. High-Temperature Synthesis and Structures of Perovskite and n = 1 Ruddlesden-Popper Tantalum Oxynitrides. Chem. Mater. 2002, 14, 2664–2669. [Google Scholar] [CrossRef]
  18. Günther, E.; Hagenmayer, R.; Jansen, M. Strukturuntersuchungen an Den Oxidnitriden SrTaO2N, CaTaO2N Und LaTaON2 Mittels Neutronen- Und Röntgenbeugung. J. Inorg. Gen. Chem. 2000, 626, 1519–1525. [Google Scholar] [CrossRef]
  19. Page, K.; Stoltzfus, M.W.; Kim, Y.I.; Proffen, T.; Woodward, P.M.; Cheetham, A.K.; Seshadri, R. Local Atomic Ordering in BaTaO2N Studied by Neutron Pair Distribution Function Analysis and Density Functional Theory. Chem. Mater. 2007, 19, 4037–4042. [Google Scholar] [CrossRef]
  20. Wolff, H.; Dronskowski, R. First-Principles and Molecular-Dynamics Study of Structure and Bonding in Perovskite-Type Oxynitrides ABO2N (A = Ca, Sr, Ba; B = Ta, Nb). J. Comput. Chem. 2008, 29, 2260–2267. [Google Scholar] [CrossRef] [PubMed]
  21. Kikkawa, S.; Sun, S.; Masubuchi, Y.; Nagamine, Y.; Shibahara, T. Ferroelectric Response Induced in Cis-Type Anion Ordered SrTaO2N Oxynitride Perovskite. Chem. Mater. 2016, 28, 1312–1317. [Google Scholar] [CrossRef]
  22. Hinuma, Y.; Moriwake, H.; Zhang, Y.-R.; Motohashi, T.; Kikkawa, S.; Tanaka, I. First-Principles Study on Relaxor-Type Ferroelectric Behavior without Chemical Inhomogeneity in BaTaO2N and SrTaO2N. Chem. Mater. 2012, 24, 2023. [Google Scholar] [CrossRef]
  23. Bubeck, C.; Widenmeyer, M.; Richter, G.; Coduri, M.; Goering, E.; Yoon, S.; Weidenkaff, A. Tailoring of an Unusual Oxidation State in a Lanthanum Tantalum(IV) Oxynitride via Precursor Microstructure Design. Commun. Chem. 2019, 2, 134. [Google Scholar] [CrossRef]
  24. Kageyama, H.; Hayashi, K.; Maeda, K.; Attfield, J.P.; Hiroi, Z.; Rondinelli, J.M.; Poeppelmeier, K.R. Expanding Frontiers in Materials Chemistry and Physics with Multiple Anions. Nat. Commun. 2018, 9, 772. [Google Scholar] [CrossRef]
  25. Coppens, P. The Effect of Thermal Vibrations on the Intensities of the Diffracted Beams. In X-ray Charge Densities and Chemical Bonding; Oxford Academic Press: New York, NY, USA, 1997. [Google Scholar] [CrossRef]
  26. Prince, E. (Ed.) International Tables for Crystallography, 3rd ed.; Kluwer Academic Publishers: Dordrecht, The Netherlands, 2004; Volume C, ISBN 978-0-470-71029-6. [Google Scholar]
  27. Rietveld, H.M. Line Profiles of Neutron Powder-Diffraction Peaks for Structure Refinement. Acta Cryst. 1967, 22, 151–152. [Google Scholar] [CrossRef]
  28. Rietveld, H.M. A Profile Refinement Method for Nuclear and Magnetic Structures. J. Appl. Cryst. 1969, 2, 65–71. [Google Scholar] [CrossRef]
  29. FullProf Suite Homepage. Available online: https://www.ill.eu/sites/fullprof/ (accessed on 9 February 2024).
  30. Kresse, G.; Furthmüller, J. Efficiency of Ab-Initio Total Energy Calculations for Metals and Semiconductors Using a Plane-Wave Basis Set. Comput. Mater. Sci. 1996, 6, 15–50. [Google Scholar] [CrossRef]
  31. Kresse, G.; Furthmüller, J. Efficient Iterative Schemes for Ab Initio Total-Energy Calculations Using a Plane-Wave Basis Set. Phys. Rev. B 1996, 54, 11169. [Google Scholar] [CrossRef]
  32. Ångqvist, M.; Muñoz, W.A.; Rahm, J.M.; Fransson, E.; Durniak, C.; Rozyczko, P.; Rod, T.H.; Erhart, P. ICETA Python Library for Constructing and Sampling Alloy Cluster Expansions. Adv. Theory Simul. 2019, 2, 1900015. [Google Scholar] [CrossRef]
  33. Saitta, A.M.; de Gironcoli, S.; Baroni, S. Structural and Electronic Properties of a Wide-Gap Quaternary Solid Solution: (Zn, Mg) (S, Se). Phys. Rev. Lett. 1998, 80, 4939. [Google Scholar] [CrossRef]
  34. Liu, J.; Fernández-Serra, M.V.; Allen, P.B. First-Principles Study of Pyroelectricity in GaN and ZnO. Phys. Rev. B 2016, 93, 081205. [Google Scholar] [CrossRef]
  35. Fuertes, A. Synthetic Approaches in Oxynitride Chemistry. Prog. Solid State Chem. 2018, 51, 63–70. [Google Scholar] [CrossRef]
  36. Kim, Y. Il Effects of KCl Flux on the Morphology, Anion Composition, and Chromaticity of Perovskite Oxynitrides, CaTaO2N, SrTaO2N, and LaTaON2. Ceram. Int. 2014, 40, 5275–5281. [Google Scholar] [CrossRef]
  37. Fischer, H.E.; Cuello, G.J.; Palleau, P.; Feltin, D.; Barnes, A.C.; Badyal, Y.S.; Simonson, J.M. D4c: A Very High Precision Diffractometer for Disordered Materials. Appl. Phys. A Mater. Sci. Process 2002, 74, s160–s162. [Google Scholar] [CrossRef]
  38. Egami, T.; Billinge, S.J.L. Underneath the Bragg Peaks-Structural Analysis of Complex Materials, 2nd ed.; Elsevier: Oxford, UK, 2012; Volume 16. [Google Scholar]
  39. Farrow, C.L.; Juhas, P.; Liu, J.W.; Bryndin, D.; Boin, E.S.; Bloch, J.; Proffen, T.; Billinge, S.J.L. PDFfit2 and PDFgui: Computer Programs for Studying Nanostructure in Crystals. J. Phys. Condens. Matter 2007, 19, 335219. [Google Scholar] [CrossRef]
  40. Blöchl, P.E.; Jepsen, O.; Andersen, O.K. Improved Tetrahedron Method for Brillouin-Zone Integrations. Phys. Rev. B 1994, 49, 16223. [Google Scholar] [CrossRef]
  41. Perdew, J.P.; Ruzsinszky, A.; Csonka, G.I.; Vydrov, O.A.; Scuseria, G.E.; Constantin, L.A.; Zhou, X.; Burke, K. Restoring the Density-Gradient Expansion for Exchange in Solids and Surfaces. Phys. Rev. Lett. 2008, 100, 136406. [Google Scholar] [CrossRef]
  42. Wei, S.H.; Ferreira, L.G.; Bernard, J.E.; Zunger, A. Electronic Properties of Random Alloys: Special Quasirandom Structures. Phys. Rev. B 1990, 42, 9622. [Google Scholar] [CrossRef]
  43. Zunger, A.; Wei, S.H.; Ferreira, L.G.; Bernard, J.E. Special Quasirandom Structures. Phys. Rev. Lett. 1990, 65, 353. [Google Scholar] [CrossRef]
Figure 1. Refined neutron diffraction (λ = 1.59417(2) Å) patterns of (a) LaTaON2, (b) LaTaO2N, (c) La0.9Y0.1TaON2, and (d) La0.9Y0.1TaO2N at 300 K using the Imma random anionic ordering structural model. The red dots represent the experimental data, the black line the calculated pattern, and the blue line the difference curve. Green hash marks represent the indexed reflections of the oxynitrides and gray hash marks the indexed reflections of the vanadium sample holder. Pink hash marks in (c) represent the indexed reflections of Ta3N5, and yellow hash marks the indexed reflections of Y2O3. Additionally, the reflections of Ta3N5 and Y2O3 are marked with * and ∇, respectively, in (c), for consistency with Figure S1c.
Inorganics 12 00090 g001
Figure 2. Symmetrically non-equivalent two-body clusters in the cluster expansion of the total energy as a function of O/N occupation in Imma LaTaON2. Orbit indices 2, 3, 4, and 5 represent the N–N, N–O, and O–O possible first-nearest-neighbor (1NNs) configurations, and orbit indices 8, 9, and 10 represent the N–N, N–O, and O–O possible second-nearest-neighbor (2NNs) configurations. The gray ions represent lanthanum, the blue/green ions represent the anions, oxygen and nitrogen, and the ions inside the octahedral structure represent tantalum. O1 and O2 represent, respectively, the N(1)/O(1) and N(2)/O(2) positions of the anions, oxygen and nitrogen.
Inorganics 12 00090 g002
Figure 3. (a) The N site occupancy factors at two non-equivalent sites at different temperatures; (b) numbers of specific two-body clusters of Imma LaTaON2 at different temperatures.
Inorganics 12 00090 g003
Figure 4. (a) Best fitting PDF pattern for the average structure of LaTaON2 at 10 K, with the space group Imma, a disordered model, and using the U(La,O(2)/N(2))aniso thermal parameters, where the red dots represent experimental data, the black line the calculated pattern, the blue line the difference curve, and the gray line is the offset zero line of the difference curve as serves as a guide to the eye; (b) section of the crystal structure of LaTaON2 at 10 K using the same model, where the light gray ellipsoid ions represent lanthanum, the purple ions represent the tantalum, the small spherical green ions represent the N(1)/O(1) positions of the anions, oxygen and nitrogen, and the large ellipsoid green ions represent the N(2)/O(2) positions of the anions.
Inorganics 12 00090 g004
Figure 5. PDF pattern fits of (a) LaTaON2 at 10 K and (b) LaTaO2N at 10 K, in the 1.5 Å ≤ r ≤ 11 Å range, obtained after the addition of in-phase rotation of the octahedra along the b-axis, leading to the space group Pnma and inverse-ordered models. The red dots represent experimental data, the black line the calculated pattern, the blue line the difference curve, and the gray line is the offset zero line of the difference curve as serves as a guide to the eye.
Inorganics 12 00090 g005
Figure 6. Representations of the atomic structures of (a) LaTaON2 and (b) LaTaO2N ordered along the c-axis. Space group: Pmn21. The dashed lines represent the equatorial planes of the octahedra.
Inorganics 12 00090 g006
Figure 7. PDF pattern fits of (a) LaTaON2 at 10 K, with in-phase rotation of the octahedra along the b-axis, space group Pnma, and an inverse-ordered model, and (b) LaTaON2 at 10 K, with the addition of local O/N ordering along the c-axis and space group Pmn21. Both were in a 1.5 Å ≤ r ≤ 5.5 Å range. The red dots represent experimental data, the black line the calculated pattern, the blue line the difference curve, and the gray line is the offset zero line of the difference curve as serves as a guide to the eye.
Inorganics 12 00090 g007
Figure 8. PDF pattern fits of (a) LaTaO2N at 10 K, with in-phase rotation of the octahedra along the b-axis, space group Pnma, and an inverse-ordered model, and (b) LaTaO2N at 10 K, with the addition of local O/N ordering along the c-axis and space group Pmn21. Both were in a 1.5 Å ≤ r ≤ 5.5 Å range. The red dots represent experimental data, the black line the calculated pattern, the blue line the difference curve, and the gray line is the offset zero line of the difference curve as serves as a guide to the eye.
Inorganics 12 00090 g008
Figure 9. (a) Numbers of specific two-body clusters of Pnma LaTaON2 at different temperatures and (b) numbers of specific two-body clusters of Pmn21 LaTaON2 at different temperatures.
Inorganics 12 00090 g009
Figure 10. DFT energies of a special quasi-random-ordered (SQoS) supercell constructed for LaTaON2 in the space groups Imma, Pnma, and Pmn21. The dashed line shows the special quasi-random (SQS) supercell energy of the Imma structure.
Inorganics 12 00090 g010
Figure 11. PDF pattern fits of (a) La0.9Y0.1TaON2 at 10 K, with in-phase rotation of the octahedra along the b-axis, space group Pnma, and a disordered model, and (b) La0.9Y0.1TaON2 at 10 K, with the addition of local O/N order along the c-axis and space group Pmn21. Both were in a 1.5 Å ≤ r ≤ 5.5 Å range. The red dots represent experimental data, the black line the calculated pattern, the blue line the difference curve, and the gray line is the offset zero line of the difference curve as serves as a guide to the eye.
Inorganics 12 00090 g011
Figure 12. PDF pattern fits of (a) La0.9Y0.1TaO2N at 10 K, with in-phase rotation of the octahedra along the b-axis, space group Pnma, and an inverse-ordered model, and (b) La0.9Y0.1TaO2N at 10 K, with the addition of local O/N order along the c-axis and space group Pmn21. Both were in a 1.5 Å ≤ r ≤ 5.5 Å range. The red dots represent experimental data, the black line the calculated pattern, the blue line the difference curve, and the gray line is the offset zero line of the difference curve as serves as a guide to the eye.
Inorganics 12 00090 g012
Table 1. Summary of the nominal compositions and refined O and N content at 300 K using the randomly ordered Imma structural model.
Nominal CompositionRefined Composition
LaTaO2NN/A *
LaTaON2LaTaO1.03(6)N1.97(6)
La0.9Y0.1TaO2NLa0.9Y0.1TaO1.58(7)N1.42(7)
La0.9Y0.1TaON2La0.9Y0.1TaO0.98(5)N2.02(5)
* The refinements were not fully conclusive as they indicated a N-rich composition, while simultaneously, the Biso values of O(1)/N(1) and O(2)/N(2) pointed to a scattering density that was too high.
Table 2. Summary of the χ2 values obtained in Rietveld refinements of the neutron diffraction patterns of all samples at 10 K and 300 K using different structural models. The lowest values obtained by refinements based on physically meaningful parameters are highlighted in bold. N/A refers to the fact that since the real composition of the compound was La0.9Y0.1TaO1.58(7)N1.42(7), the structural model was non-applicable.
Nominal CompositionT (K)C2/m
(trans-Ordered)
I212121
(cis-Ordered)
Ima2
(cis-Ordered)
Imma
(Random)
Imma
(trans-Ordered)
LaTaO2N103.39 #6.19 #3.872.583.67
3003.09 #8.42 #3.31 #2.142.78
LaTaON2101.25 #2.33 #1.35 #0.131.27 #
3000.999 #1.65 #0.995 #1.040.945 #
La0.9Y0.1TaO2N10N/AN/AN/A2.58N/A
300N/AN/AN/A2.14N/A
La0.9Y0.1TaON2104.04 #8.733.913.293.64 #
3004.65 #9.615.273.723.99 #
# The refinements involved non-physically meaningful parameters.
Table 3. Rw values obtained using three distinct models in the PDF analysis for both LaTaON2 and LaTaO2N at 10 K, in the short (1.5 Å ≤ r ≤ 5.5 Å) and wider (1.5 Å ≤ r ≤ 11 Å) ranges. The lowest values obtained for each composition are highlighted in bold.
CompoundModelRw
(1.5 Å–5.5 Å)
Rw
(1.5 Å–11 Å)
LaTaON2Imma_disordered0.1170.144
Pnma_inverse-ordered0.1020.132
Pmn21_along-c-axis0.0920.129
LaTaO2NImma_disordered0.1380.181
Pnma_inverse-ordered0.1210.156
Pmn21_along-c-axis0.1070.151
Table 4. Rw values obtained using three distinct models in the PDF analysis for LaTaON2 at 10 K, in 6 different ranges, going from shorter to longer ranges. The lowest obtained values for each range are highlighted in bold.
ModelRw
(1.5 Å–5.5 Å)
Rw
(1.5 Å–8.2 Å)
Rw
(1.5 Å–11 Å)
Rw
(5 Å–15 Å)
Rw
(10 Å–20 Å)
Rw
(15 Å–25 Å)
Imma_disordered_Uiso0.1460.2110.1950.1880.268
Imma_disordered
_Uaniso(La,N(2))
0.1170.1430.1440.1320.1850.179
Pnma_inverse-ordered_Uiso0.1020.1370.1320.1490.1920.214
Table 5. Rw values obtained using three distinct models in the PDF analysis for both La0.9Y0.1TaON2 and La0.9Y0.1TaO2N at 10 K, in the short (1.5 Å ≤ r ≤ 5.5 Å) and wider (1.5 Å ≤ r ≤ 11 Å) ranges. The lowest values obtained for each composition are highlighted in bold.
CompoundModelRw
(1.5 Å–5.5 Å)
Rw
(1.5 Å–11 Å)
La0.9Y0.1TaON2Imma_disordered0.1240.140
Pnma_disordered0.1070.130
Pmn21_along-c-axis0.1010.132
La0.9Y0.1TaO2NImma_disordered0.1240.152
Pnma_inverse-ordered0.1080.133
Pmn21_along-c-axis0.1050.127
Disclaimer/Publisher’s Note: The statements, opinions and data contained in all publications are solely those of the individual author(s) and contributor(s) and not of MDPI and/or the editor(s). MDPI and/or the editor(s) disclaim responsibility for any injury to people or property resulting from any ideas, methods, instructions or products referred to in the content.

