Article

Self-Cleaning and Charge Transport Properties of Foils Coated with Acrylic Paint Containing TiO2 Nanoparticles

by
Sanja J. Armaković
1,*,
Maria M. Savanović
1,
Mirjana V. Šiljegović
2,
Milica Kisić
3,
Maja Šćepanović
4,
Mirjana Grujić-Brojčin
4,
Nataša Simić
2,
Lazar Gavanski
2 and
Stevan Armaković
2
1
University of Novi Sad, Faculty of Sciences, Department of Chemistry, Biochemistry and Environmental Protection, 21000 Novi Sad, Serbia
2
University of Novi Sad, Faculty of Sciences, Department of Physics, 21000 Novi Sad, Serbia
3
University of Novi Sad, Faculty of Technical Sciences, Department of Electronics, 21000 Novi Sad, Serbia
4
Center for Solid State and New Materials, Institute of Physics Belgrade, 11000 Belgrade, Serbia
*
Author to whom correspondence should be addressed.
Inorganics 2024, 12(1), 35; https://doi.org/10.3390/inorganics12010035
Submission received: 26 December 2023 / Revised: 13 January 2024 / Accepted: 19 January 2024 / Published: 22 January 2024
(This article belongs to the Special Issue Recent Advances in Ceramic Materials)

Abstract

:
The study comprehensively investigates the design and performance of self-cleaning surfaces fabricated by coating aluminum foil with an acrylic paint matrix enriched with different content of titanium dioxide (TiO2) nanoparticles. The main goal was to assess the self-cleaning characteristics of the surfaces obtained. This study employs scanning electron microscopy (SEM) to analyze the morphology of TiO2-modified acrylic surfaces, revealing spherical particles. Raman spectroscopy elucidates signatures characterizing TiO2 incorporation within the acrylic matrix, providing comprehensive insights into structural and compositional changes for advanced surface engineering. Alternating current (AC) impedance spectroscopy was used to assess selected charge transport properties of produced self-cleaning surfaces, allowing us to gain valuable insights into the material’s conductivity and its potential impact on photocatalytic performance. The self-cleaning properties of these tiles were tested against three frequently used textile dyes, which are considered to pose a serious environmental threat. Subsequently, improving self-cleaning properties was achieved by plasma treatment, utilizing a continuous plasma arc. The plasma treatment led to enhanced charge separation and surface reactivity, crucial factors in the self-cleaning mechanism. To deepen our comprehension of the reactive properties of dye molecules and their degradation dynamics, we employed a combination of density functional tight binding (DFTB) and density functional theory (DFT) calculations. This investigation lays the foundation for advancing self-cleaning materials with extensive applications, from architectural coatings to environmental remediation technologies.

Graphical Abstract

1. Introduction

According to the most recent report from the World Health Organization, approximately 850 million people worldwide lack access to potable water [1]. The issue of water pollution has garnered significant attention. Various industries, including textile dyeing, food processing, papermaking, cosmetics, and paints, discharge effluents containing dyes into the environment, leading to dye-contaminated wastewater [2]. The textile industry poses a huge threat since dye effluents are released into water bodies. Therefore, various pollutants, such as synthetic azo dyes, enter the wastewater [3]. Effluents containing dyes are high in color, suspended solids, pH [4], biochemical and chemical oxygen demand, metals, and salts [5].
Various methods, such as advanced oxidation processes, have been employed to treat wastewater contaminated with dyes [6] to promote their reaction kinetics [7]. Photocatalysis with TiO2 is an environmentally friendly process consisting of reduction/oxidation complex reactions wherein electron–hole pairs are generated by semiconductors activated under irradiation through the absorption of light energy [8]. In the construction industry, the application of TiO2 photocatalysis has promoted several new materials [9] whose surfaces are functionalized with self-cleaning [10], depolluting [11], and antimicrobial properties [12]. Photocatalytic active aluminum films [13], ceramics [14,15], glass [16], mortars, and cement [17,18] have been synthesized using TiO2 nanoparticles as a surface coating or embedded in the bulk [6].
The application of TiO2 nanoparticles to various materials is achieved exclusively through coating, as opposed to being blended with the base material (e.g., mortar, cement, or ceramic paste). This technique facilitates the utilization of the entire radiation-activated TiO2 within a singular, efficient surface layer [19,20,21]. The advantage of applying TiO2 as a deposited layer is that the difficulties of removing the catalyst from the solution are eliminated, significantly reducing the process’s cost. Also, applying TiO2 as a coating allows the use of the complete amount of TiO2 activated through irradiation, and the possibility of reusing self-cleaning surfaces favors their use [22,23]. The substrate contributes to the stability of the coating [24] and performance in photocatalysis [25,26], influencing the enduring characteristics of the coated surface. Consequently, limited information is available regarding the long-term implementation of coatings applied to different substrates [27]. Given their potential variation in internal characteristics, this is an urgent requirement for enhanced comprehension of the durability challenges associated with diverse substrate types [28].
However, significant challenges persist in the photocatalytic active surfaces’ production technology, encompassing the coating durability assessment for practical utilization in outdoor conditions [29]. These films directly interface with the environment in routine applications on external building surfaces or within wastewater treatment facilities. They are regularly exposed to diverse weathering processes capable of altering the support characteristics and stability of the coatings themselves [30]. Critical issues related to coating durability involve the extended performance of photocatalytic material surfaces and the potential release of TiO2 into the environment [6,31].
The commercially leveraged photoinduced hydrophilic conversion of the TiO2 surface has created self-cleaning, anti-fogging surfaces applicable in various sectors, including paints, textiles, glass, cement, and tiles [2]. The widespread use of TiO2 coatings to modify glass and tiles has been instrumental in constructing building materials with photocatalytic self-cleaning properties [32]. Japan, for instance, widely employs self-cleaning, eco-friendly windows, facades, and roof tiles [33]. The automotive industry has also embraced self-cleaning coatings to develop clear, glare-free windows, automotive mirrors, headlights, and mirrors [34]. While numerous reviews have discussed the functionalization and application of self-cleaning surfaces with TiO2 nanoparticles and their inherent self-cleaning properties [35], there remains a notable gap in the data regarding their potential use in wastewater treatment plants.
Electrical conductivity measurements show great potential for future developments in self-cleaning tiles. They could help to monitor surface contamination, create clean surfaces more effectively, develop electrochemical cleaning methods, and innovate new materials [36].
Applying atomistic calculations to understand different properties of materials is an essential task in computational materials science. Different methods based on atomistic calculations allow researchers to gain an understanding of materials at the atomic level and predict their macroscopic properties. Various computational methods are crucial for designing materials, allowing scientists to predict essential properties before synthesis or production [37,38,39,40]. When computational methods for materials modeling are combined with experimental findings, a comprehensive understanding of underlying mechanisms is enabled, pawing the way to develop new materials [41,42,43,44,45]. Thanks to rapid development, different computational methods are now available for the theoretical investigation of molecules and periodic structures, which enables scientists to design new materials and products with finely tuned properties [46,47,48,49,50].
Coating with materials in which different photocatalytic nanoparticles are incorporated can efficiently produce photoactive surfaces with self-cleaning properties. This study aimed to employ a strategy to produce tiles with significant self-cleaning properties by coating the aluminum foil with white acrylic paint mixed with Hombikat TiO2 nanoparticles. Self-cleaning properties of such obtained tiles were tested against three dyes that are frequently used in industry and pose a significant environmental threat—methylene blue (MB), methyl orange (MO), and rhodamine b (RB). While testing the self-cleaning properties, dyes were dropped on coated surfaces, after which the samples were exposed to two types of irradiation to activate photocatalytic nanoparticles and initiate the degradation of dyes. This simple approach yielded highly affordable self-cleaning surfaces. We used several experimental techniques to characterize these samples’ charge transport properties using impedance spectroscopy and measurements of electrical conductivity. To enhance the self-cleaning properties, surfaces were treated with a continuous plasma arc to improve activation of the acrylic paint layer modified with TiO2. Plasma-activated tiles showed significant self-cleaning efficiency, leading to removing RB, MO, and MB from the tiles’ surface under SS irradiation. The overall results support the idea that self-cleaning tiles are a promising solution for water purification treatment owing to their activity, simplicity, and low processing cost.

2. Results and Discussion

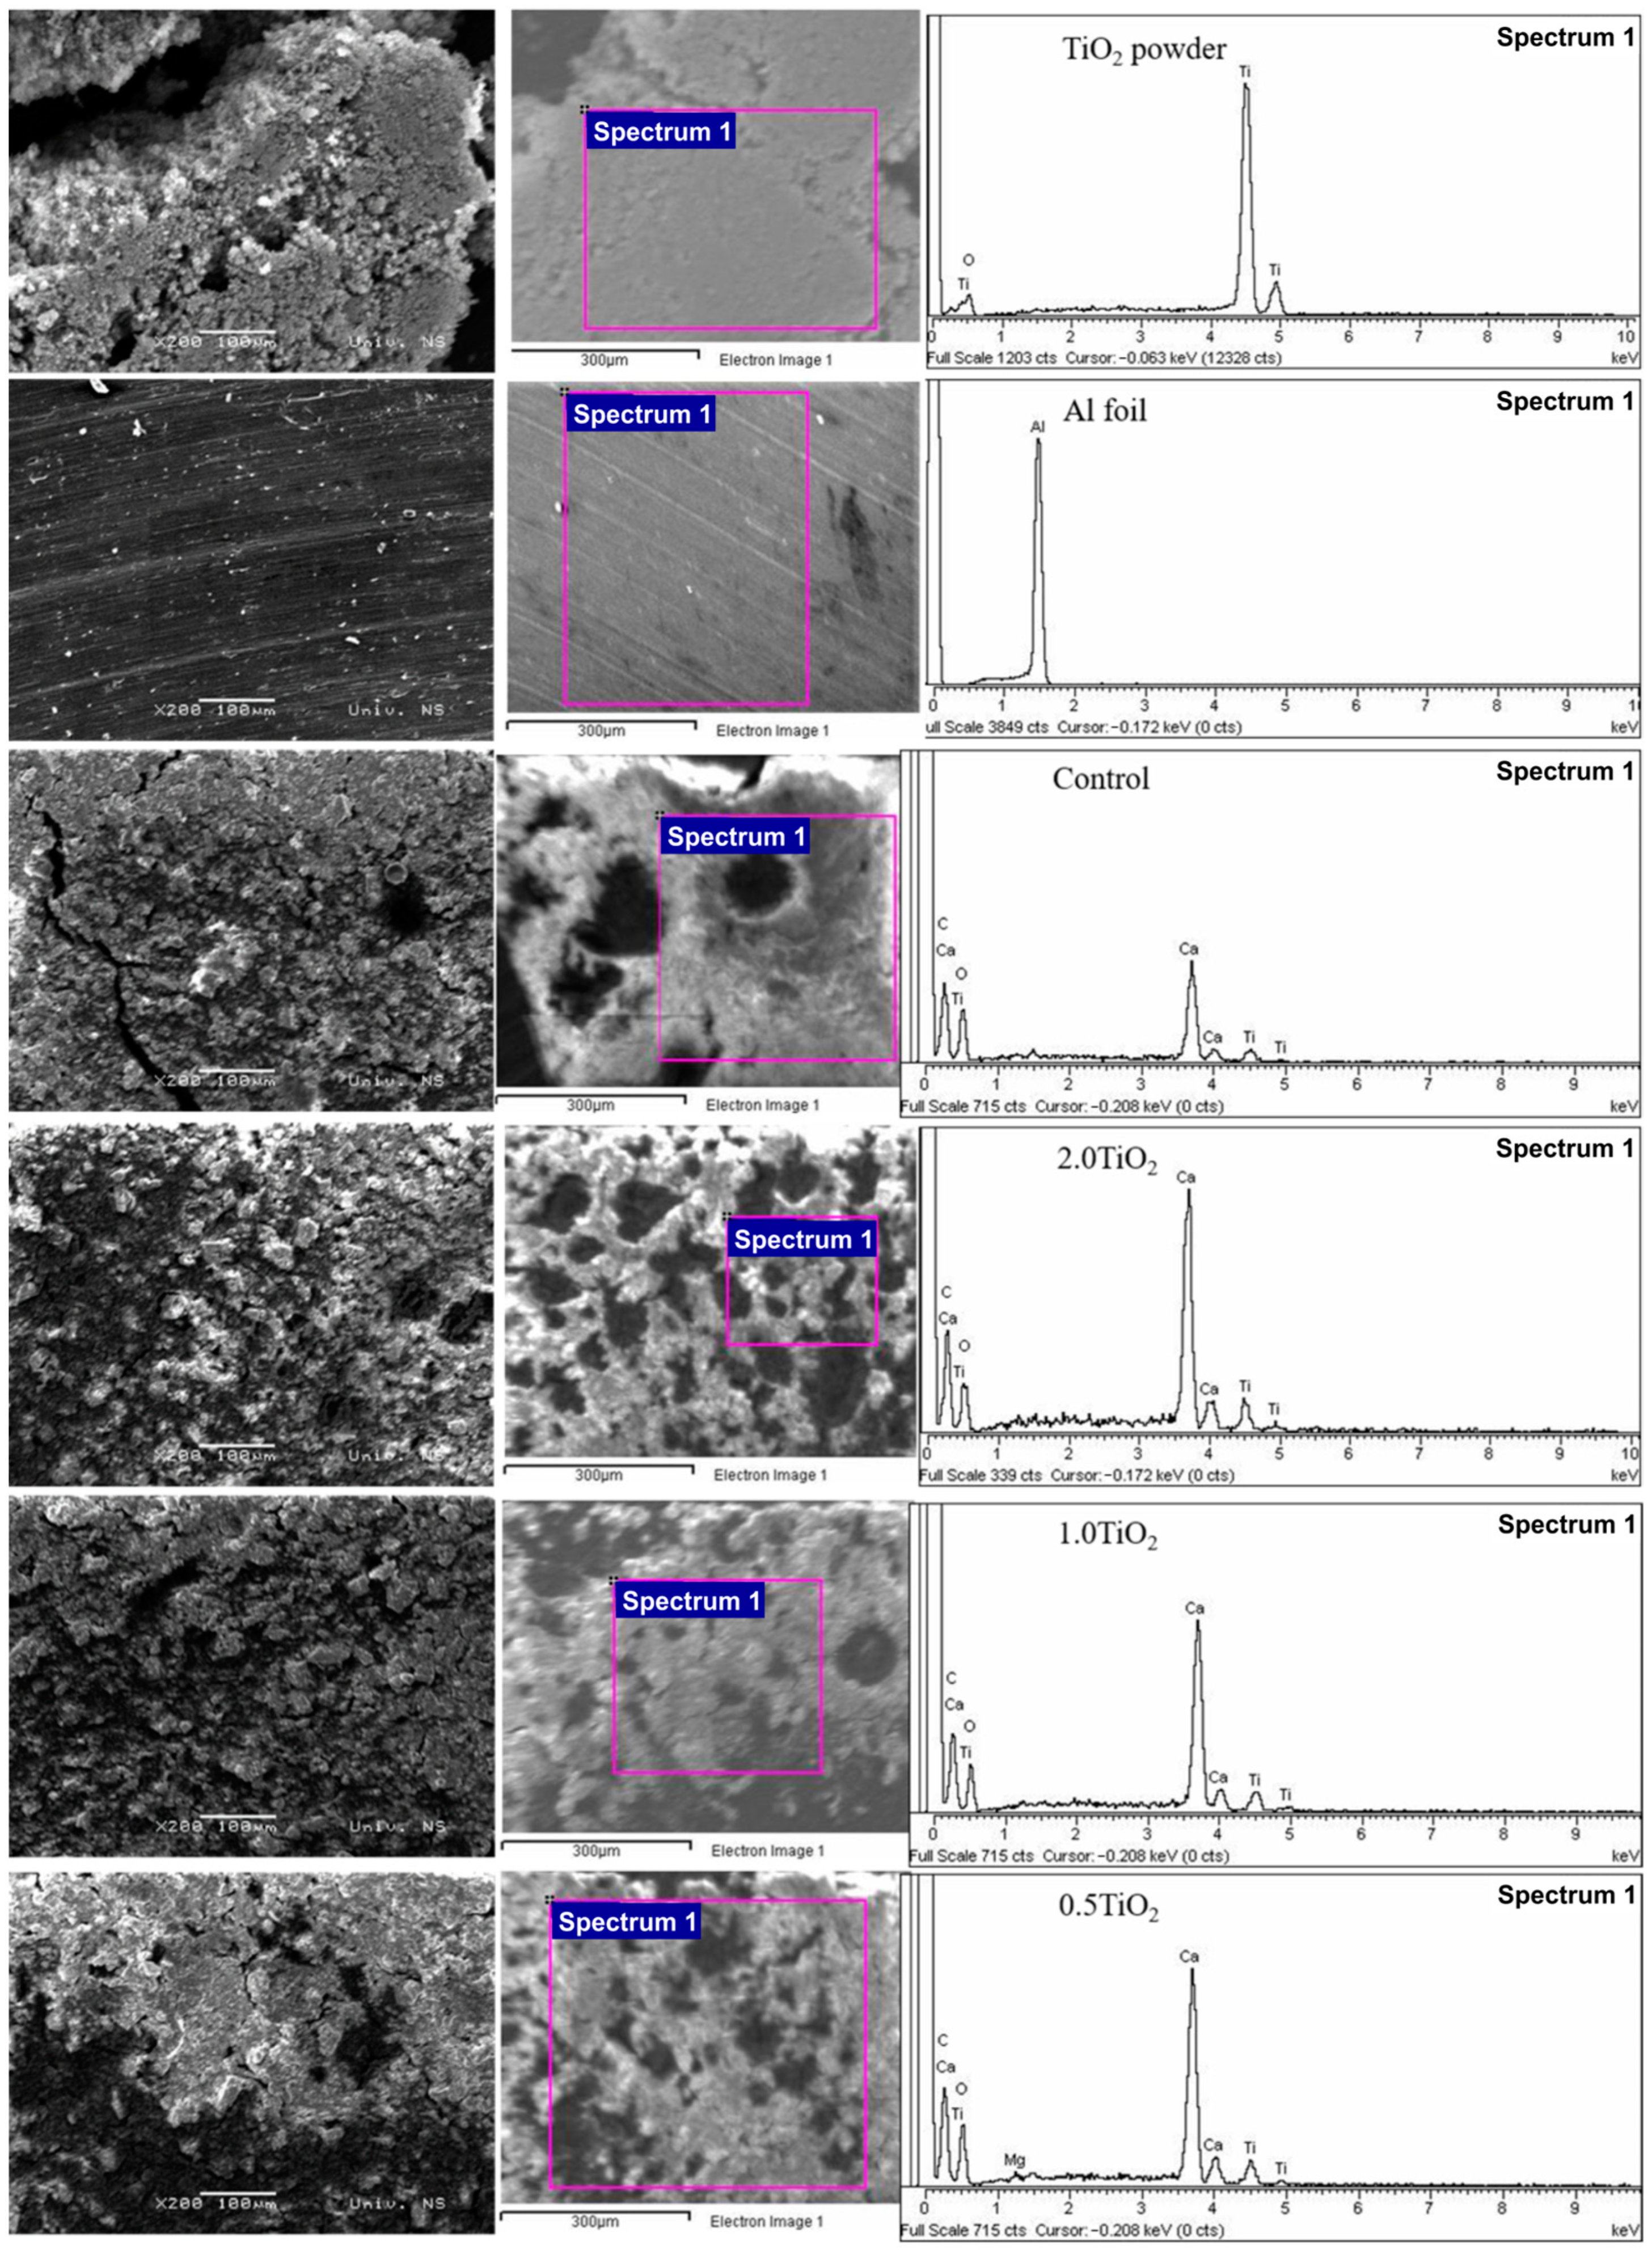
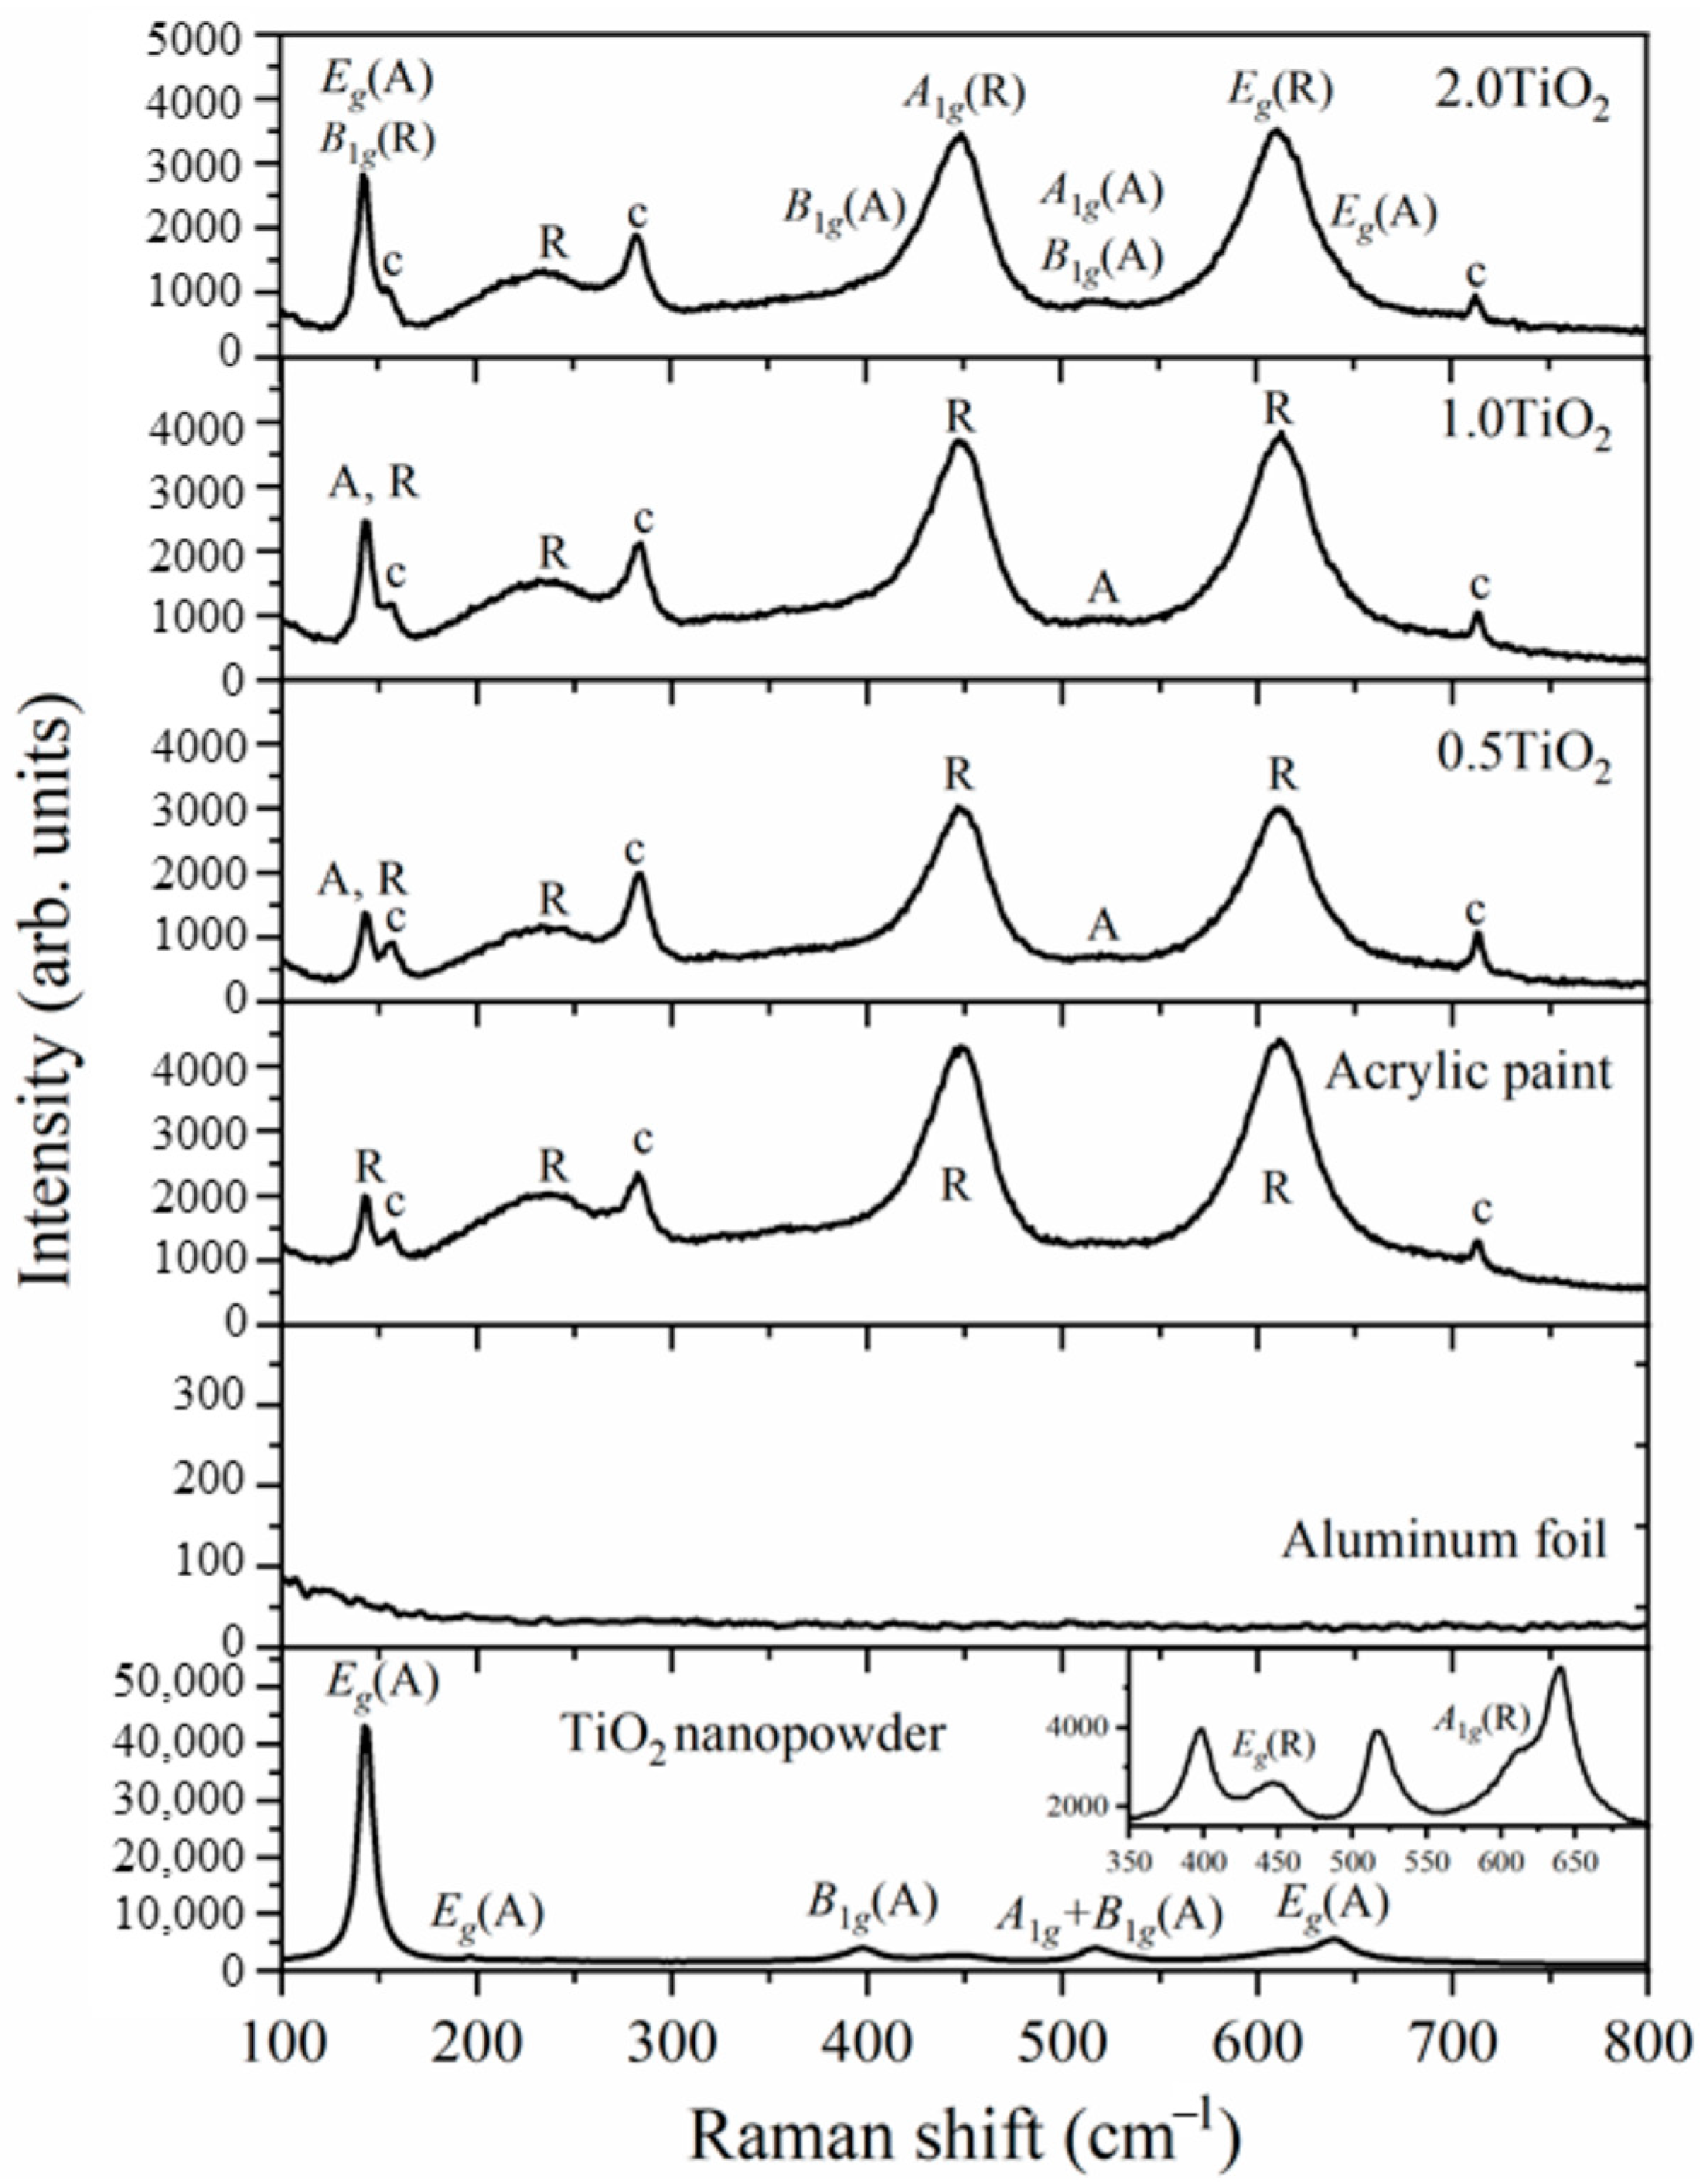
2.1. Material Characteristics: SEM, Raman Analysis, and Contact Angle
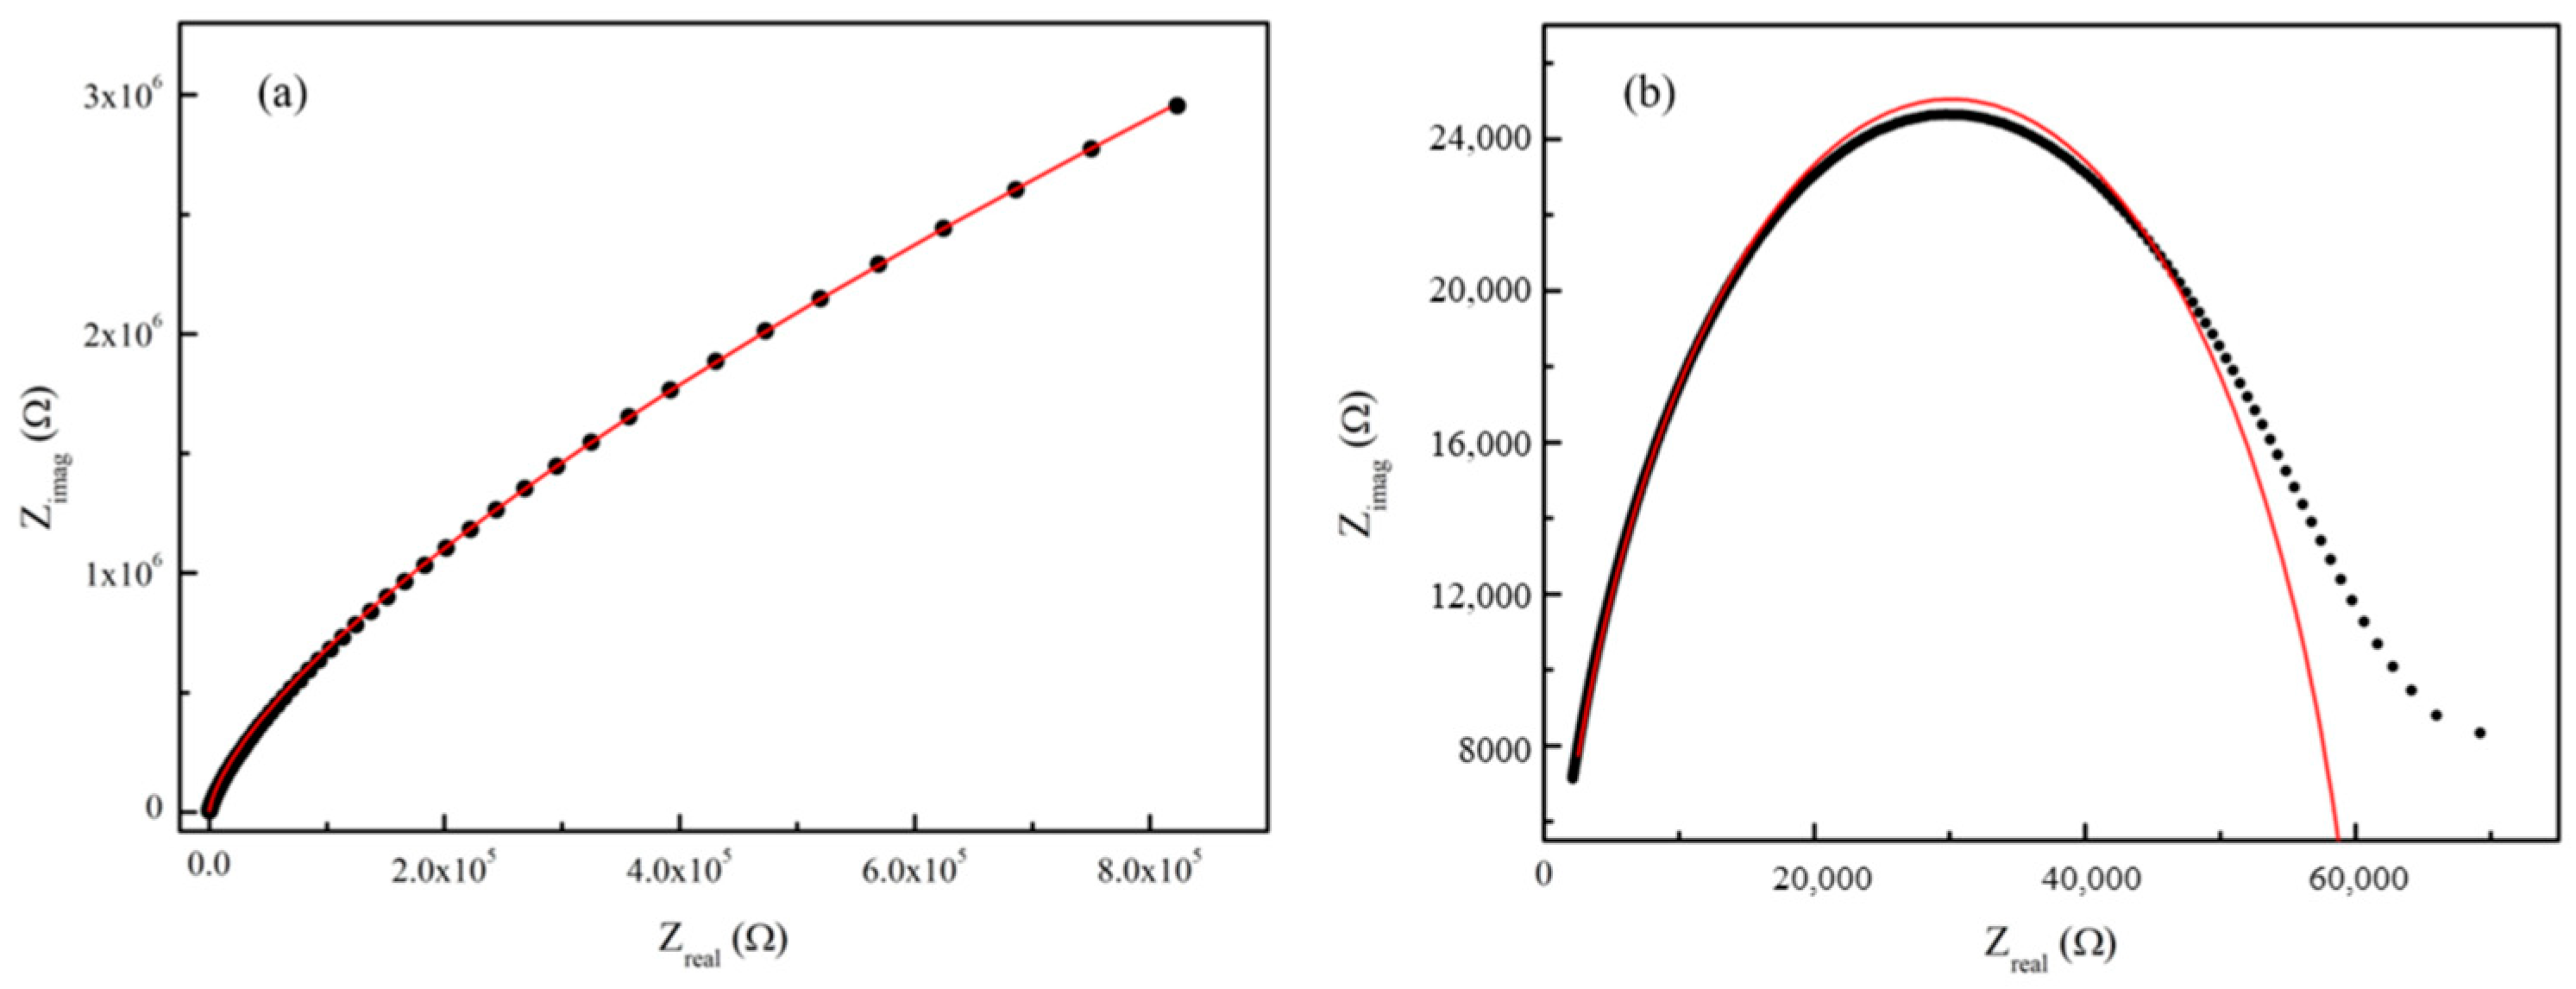
The SEM results offer crucial insights into surface morphology, particle characterization, and quality control, guiding research and development and correlating with material properties. Our SEM results related to self-cleaning modified acrylic paint tiles with varying TiO2 concentrations, presented in Figure 1 and Table 1, mainly indicate the presence of spherical particles. Table 1 provides the chemical composition from EDS spectra, aiding in understanding stoichiometry and impurity levels despite slight variations within the same sample, notably showing shifts in carbon, oxygen, calcium, and titanium percentages as TiO2 content increases. These variations suggest successful TiO2 incorporation, potentially influencing material properties like enhanced self-cleaning capabilities. TiO2 is the most commonly used pigment in paint formulations because of its high refractive index and brightness, excellent coverage, durability, whiteness, and opacity. Since the control sample was acrylic paint, it was expected to detect Ti in the control sample (Figure 1 and Table 1).
The analysis of Raman spectra (Figure 2 and Figure 3) should give complete insight into possible interactions between TiO2 nanopowder and acrylic matrix upon TiO2 addition by investigating structural and chemical modifications.
The Raman spectra of pure acrylic paint and 2.0TiO2 samples in a wide spectral range are shown in Figure 2. The features dominate the spectrum of pure acryl paint (a) at 446 and 610 cm−1, which may be ascribed to Eg and A1g modes of the rutile phase of TiO2, respectively. Broad bands at ~235 and ~350 cm−1 can also be ascribed to the rutile phase [51]. Also, a sharp feature at ~143 cm−1 should be ascribed to rutile low-intensity first-order B1g mode, but the contribution of a minimal amount of anatase phase cannot be excluded. Besides these modes, which originate from rutile TiO2 as a white pigment, there are several Raman features in the spectra of acryl paint. Sharp Raman modes at ~157, 283, 175, 1087 cm−1 are related to calcite (CaCO3) [52], whereas Raman features at ~999, 1030, 1304, 1449, 1605 cm−1, together with bands related to C-H (~2867 and 2919 cm−1) and O-H (~3060 cm−1) vibrations, have been ascribed to modified alkyd resin [53,54].
Figure 2b shows the Raman spectrum of the sample with 2.0TiO2 powder. This spectrum is similar to the spectrum of acrylic paint in the investigated range, pointing out that the procedures of sample preparation make no noticeable impact on the components of this paint. The only exception is the appearance of Raman features originating from inserted TiO2 nanopowder, which will be analyzed more thoroughly.
The Raman spectra of acrylic paint with different amounts of TiO2 nanopowder (Figure 3) are shown together with the spectra of TiO2 nanopowder, aluminum foil, and pure acrylic paint to investigate the influence of mixing acrylic paint with TiO2 nanopowder, application of these mixtures on aluminum foil, and subsequent heating/drying at 200 °C on characteristics of the samples.
The domination of anatase modes in the spectrum of TiO2 nanopowder confirms the high content of the anatase phase, but the presence of rutile modes (the inset of Figure 3) points to a small amount of rutile phase. The spectrum of aluminum foil does not show any distinctive Raman features in the region of interest, confirming that this substrate is suitable for Raman investigations [55]. In the spectra of pure acrylic paint and the samples 0.5TiO2, 1.0TiO2, and 2.0TiO2, all deposited on Al foil, the dominant Raman features of rutile remain unchanged regarding the mode position and linewidth (Figure 3), which confirms that the procedure of sample preparation does not affect the rutile pigment within acrylic paint. With the addition of TiO2 nanopowder, the Raman feature at ~143 cm−1 is significantly intensified. The intensifying of this mode, ascribed to anatase Eg, together with the appearance of 520 cm−1 spectral feature ascribed to anatase fingerprint A1g + B1g mode [52], point to an increase in anatase content in the samples, also confirmed by the integrated intensity ratio of anatase Eg mode at 143 cm−1 to rutile A1g mode at 610 cm−1 shown in Figure 4. A nearly linear increase in this ratio with added TiO2 nanopowder certifies the successful integration of anatase nanopowder within the acrylic matrix. Also, this intensity ratio is almost independent (within the experimental error) on measuring points at the surface of each sample, indicating that TiO2 nanopowder has been uniformly dispersed in the acrylic matrix.
The position of anatase Eg mode (~143 cm−1) in the spectra of acrylic paint with different content of TiO2 nanopowders is not changed. The Raman linewidth (7–8 cm−1) is smaller than the original TiO2 nanopowder (~9 cm−1), which may point to a bit of improved anatase crystallinity due to heating during sample preparation.
The consistent position of the anatase Eg mode in acrylic paint with different content of TiO2 indicates minimal structural changes in the TiO2 powder due to sample preparation. This suggests that the observed changes in elemental content, especially in carbon (Figure 1, Table 1), might not stem directly from structural modifications in the TiO2 nanostructure.
This work’s contact angle was qualitatively determined by observing water droplets placed on produced tiles. The droplet’s maintenance of a spherical shape without significant spreading on each tile (Figure 5) indicates a higher contact angle and the hydrophobic nature of the self-cleaning tiles. Notably, consistency in droplet behavior was observed across multiple tests, reinforcing the reliability of these findings. A high contact angle denotes exceptional water repellency and potential self-cleaning capabilities in self-cleaning surfaces. A superhydrophobic surface is characterized by static water contact angles exceeding 150°. Surfaces exhibiting both a high contact angle and a sliding angle below 10° possess self-cleaning properties. The tiles utilized in this study demonstrated a low sliding angle and a high level of superhydrophobic behavior, indicating substantial self-cleaning properties.

2.2. Nyquist Plot

Impedance spectroscopy is a potent and flexible instrument in materials science, providing a distinctive perspective for researchers further to understand the electrochemical properties and interactions in various materials. This technique involves applying a small perturbation to a system and measuring its response over a range of frequencies, allowing for the extraction of valuable information regarding the system’s impedance. Such insights are pivotal in understanding charge transfer processes, diffusion phenomena, and interface behaviors that are otherwise challenging to discern using conventional methods.
In these regards, Nyquist plots emerge as an integral graphical representation. By plotting the imaginary impedance component against its real part, Nyquist plots unveil the interplay between a material or system’s resistive, capacitive, and inductive elements. Their shape and features can hint at underlying processes, time constants, and even the quality of interfaces, making them indispensable for researchers aiming to provide the characteristics of materials.
In the context of ceramic tiles coated with acrylic paint embedded with TiO2 Hombikat nanoparticles, impedance spectroscopy, and Nyquist plots have particular importance. These tools can illuminate the interactions between the ceramic substrate, paint layer, and nanoparticles, providing a deeper understanding of the material’s electrochemical behavior. Such knowledge is crucial, especially when considering the potential applications of these coatings in realms like photocatalysis, where charge transfer efficiency directly impacts performance. In this investigation, we captured the complex impedance spectra within the frequency range from 100 Hz to 200 kHz. The measurements were conducted using a Hioki Impedance Analyzer IM3590, employing a cell configuration with copper electrodes. To discuss the influence of a TiO2 coating, the measurements were conducted on a sample with acrylic paint and samples with acrylic paint doped with all TiO2 content. The results are presented as a Nyquist plot in Figure 6. The observed variance in impedance response among the examined samples is evident, suggesting a modification in the transport mechanism of charge carriers resulting from the introduction of 1.0TiO2 doping. Comparable outcomes were achieved for the specimens featuring 0.5 and 2.0 mg/cm3 of TiO2, meaning doping in this concentration range does not significantly affect R and C parameters. Consequently, in discussing charge transport properties, we will present the 1.0 mg/cm³ TiO2 results to simplify the presentation.
For the sample with acrylic paint, we employed a fitting model comprising the active electrolyte resistance in conjunction with the parallel capacitance arrangement, the component is connected in series and a constant phase element (CPE). The Nyquist plot for the sample with 1.0 mg/cm3 of TiO2 can be described with resistance and CPE connected in parallel. It is important to highlight a strong agreement between the experimental data points and the fitted spectrum for both samples. Fitting with the model above using the Newton algorithm and amplitude function yielded the values of parameters as presented in Table 2. These values are determined with the following errors: ΔR = 0.29%, ΔCPE = 0.13%, and Δn = 0.01%, for modified sample and ΔR = 24.8%, ΔCPE = 0.17%, ΔC = 0.07% and Δn = 0.04% for acrylic paint.
According to the presented results, the charge transfer resistance of the system for the 1.0TiO2 was obtained to be 60.28 kΩ. Higher values of this parameter suggest a more resistive interface, and this value will serve for comparisons in our future studies dealing with the properties of acrylic paint modified with different nanoparticles. The fairly high resistance value suggests that the coating creates a resistive barrier.
n is the value of the CPE exponent, which indicates the deviation from ideal capacitive behavior. In our modified sample case, the CPE exponent’s obtained value is 0.88, indicating it is closer to capacitive behavior but with certain non-idealities. These non-idealities could be attributed to TiO2 nanoparticles in several ways. For example, TiO2 nanoparticles can lead to a heterogeneous surface at the microscopic level, or if the TiO2 nanoparticles tend to aggregate within the paint matrix, this can introduce further irregularities and non-uniformities in the electrochemical response. These aggregates can create regions with different dielectric properties or charge transfer characteristics. The non-idealities can also be attributed to porosity and percolation. Namely, if the inclusion of TiO2 nanoparticles affects the porosity or creates percolative pathways within the coating, this can influence the impedance. For instance, increased porosity might lead to more significant electrolyte infiltration and modified electrochemical behavior regarding samples with acrylic paint.
As presented in Table 2, time constants (τ) were determined only for the modified sample. Values of this parameter are obtained via two approaches (one derived from the Randles circuit model with CPE and the other derived from the frequency at which the maximum impedance is observed) are in excellent agreement, indicating that the Nyquist plot is a good representation of the collected experimental data. The obtained values of τ being in the microsecond range indicates relatively quick electrochemical processes in the obtained system.

2.3. Frequency-Dependent Behavior

Figure 7 depicts the variation in the imaginary part of the complex impedance with frequency for the samples under investigation. The absence of a peak in the spectra for acrylic paint suggests a relaxation process in a lower frequency range than the measured one, also indicated by the Nyquist plot. On the other hand, the appearance of one peak for a modified sample is by the presence of one relaxation process. Furthermore, the fact of asymmetric peaks indicates that the relaxation process in the material is contingent on temperature. Hence, the dispersion curves of the investigated samples affirm the substantial impact of TiO2 coating on dielectric behavior.
The relaxation time can also be established by referring to the characteristic frequency, corresponding to Z// max using the following relation [56]:
τ = 1 2 π f max
where fmax is the distinctive frequency corresponding to Z// max.
It is essential to highlight a remarkably strong agreement between the values of the parameter τ obtained through this method and those acquired by fitting the experimental data from the impedance spectra.
Examining the frequency-dependent behavior of dielectric permittivity within the frequency range associated with dielectric dispersion is essential in gaining insights into the nature and source of losses. Frequency-dependent analysis is also significant for studying the material’s electrical homogeneity, confirming the relaxation mechanism and electrical conduction behavior [57].
The dielectric permittivity sand real (ε/) and imaginary parts (ε//) were computed by utilizing the experimentally measured resistance (Rp) and capacitance (Cp) according to the following relations:
ε / = d S C p ω ε o ; ε / / = 1 R p ω ω C 0
where d is the sample thickness, S is the cross-sectional area, angular frequency, and free space permittivity C0 is the free space permittivity.
Variations in the real part of dielectric permittivity with frequency for the investigated samples are shown in Figure 8. The frequency dependence of dielectric loss is presented in Figure 9.
The dielectric characteristics of a material are linked to various types of polarizations, including dipolar, electronic, atomic, and free-charge separations. These polarizations strongly depend on the composition and nature of the material. Based on Figure 8 and Figure 9, the decrease in the values of both dielectric parameters for investigated samples as a function of frequency can be noticed. Also, these dielectric parameters reach a constant value at higher frequencies (104–106 Hz) when the frequency of electron jumps fails to keep up with the swift alterations in the applied external field. The influence of TiO2 coating is manifested in a significant increase in both dielectric quantities of modified samples in the low-frequency range.
The predominant mechanism at these frequencies involves polarization resulting from separating free charges within the investigated sample. In this scenario, charge carriers accumulate at the crystallite surface near the electrodes, inducing polarization in the sample, akin to findings reported by Parker and Wasilik [57] in single-crystal rutile samples. Due to the relatively extensive area of this interface, it possesses a significant capacitance and, consequently, a relatively large time constant for the polarization of charges within the interface induced by the AC signal. Consequently, these charges struggle to track the oscillations of the electric field at higher frequencies, where processes with smaller time constants would become prominent.
In conclusion, the observed dielectric properties of the system containing TiO2 nanocrystalline samples can be elucidated by the trapping and de-trapping of charge carriers at localized states present on the crystallite surface or grain boundaries.

2.4. Electrical Conductivity

Figure 10 depicts the electrical conductivity characteristics of the examined sample about frequency. The AC conductivity values can be expressed by:
σ a c ω = A ω s
where A represents a pre-exponential factor and is the universal exponent that defines the extent of interaction between mobile entities and lattices. Figure 10a exhibits pronounced frequency dependence, affirming the semiconductor characteristics of acrylic paint and its adherence to power law behavior. The AC conductivity magnitude for the modified sample (Figure 10b) remains nearly constant at low frequencies, indicative of alignment with a DC value, and steadily rises in the high-frequency range (beyond 1000 Hz). Additionally, a substantial enhancement in conductivity is evident, attributed to the presence of TiO2 coating.
As per Jonscher [58], the conductivity, varying with frequency, is ascribed to relaxation phenomena originating from mobile charge carriers. As these carriers transition from their initial positions to new locations, they experience a displacement between two potential energy minima, incorporating inputs from additional mobile defects. Over an extended period, the defect may relax until the lattice potential energy’s two minima align with the lattice site. The values of the factor s were determined as 0.671 and 0.329 through the linear fitting of the experimental data illustrated in Figure 10.
To ascertain the magnitude of the potential barrier that charge carriers need to overcome, the formula incorporating the factor ‘s’ was utilized:
s = d ln σ a c d ln ω = 1 6 k B T W m  
where k B is the Boltzmann constant, T is the temperature, and the potential barrier height is W m . The obtained value of W m = 0.48   e V for acrylic paint and W m = 0.23   e V for 1.0TiO2-modified acrylic paint suggests the charge carriers hopping between the localized states as a dominant mechanism.
The analyses of the frequency dependence of dielectric loss of the investigated sample also satisfy the equation [59]:
ε = A ω m
In this context, A represents a temperature-dependent constant, and m represents the negative exponent of the power function of the angular frequency. The experimental measurements showcased in this study facilitated the determination of the parameter m and the potential barrier height W m by analyzing the slope of the linear function logε// = f(logf) (Figure 11).
The computations employed the Giuntini model, which is designed to characterize dielectric dispersion [59]. This model draws inspiration from Elliott’s concept of charge carriers hopping across the potential barrier between charged defect states [60]. The assumption is that each pair of states forms a dipole, and its relaxation time (τ) is contingent upon the energy required to surpass the potential barrier. As per this model, at a given temperature (T) and field frequency, the parameter m is expressed by the following equation:
m = 4 k T W m
The obtained W m = 0.21   e V value of the modified sample agrees well with the previous one, determined according to conductivity measurements. However, the potential barrier height W m of acrylic paint is given as W m = 0.29   e V , meaning that the exact mechanism does not drive this sample’s relaxation and conductivity processes.

2.5. Self-Cleaning Properties of Prepared Tiles

This chapter outlines an exhaustive investigation into the self-cleaning capabilities of prepared samples. These samples underwent rigorous testing under varied conditions to mimic real-world scenarios to validate their practical utility. The evaluation involved applying two different dye volumes (20 μL and 10 μL) solely to the tiles with acrylic dye as a control and alongside different TiO2 contents (0.5, 1.0, and 2.0 mg/cm3) to assess effectiveness across varying contamination levels. Simulated solar (SS) irradiation mimicked field environmental conditions during a 10 h evaluation of the tiles’ self-cleaning properties.
Figure 12 indicates that self-cleaning tests on control tiles did not achieve complete color removal. However, partial color fading after 10 h was evident, attributed to TiO2 within the commercial acrylic paint.
In the subsequent experiment (Figure 13, Figure 14 and Figure 15), we explored the self-cleaning capacities of tiles treated with diverse TiO2 concentrations. Using tiles coated with 0.5TiO2-modified acrylic paint, we observed MB and MO dye removal within 8 h and 10 h, respectively, while RB’s color faded within 10 h.
Upon SS irradiation, tiles containing 1.0TiO2 exhibited more efficient outcomes, requiring shorter irradiation durations for MB and MO dye removal. MO was removed within approximately 2 h, whereas MB necessitated 3 h. Despite this, traces of RB persisted on the tile surfaces after 10 h (Figure 15).
The 2.0TiO2-modified acrylic paint tiles (Figure 15) displayed significantly enhanced self-cleaning and dye removal efficiency. MO and MB were eliminated within 1.5 h and 3.0 h, respectively, while RB’s color faded but remained on the tile surface. Surprisingly, there was no notable difference in self-cleaning efficacy between 1.0TiO2 and 2.0TiO2-modified acrylic paint tiles. Thus, considering cost-effectiveness, we proceeded with the 1.0TiO2-modified acrylic paint tiles for subsequent experiments.
To direct further research, we subjected our prepared tiles to plasma obtained from a continuous discharge arc. Plasma treatments are recognized for their ability to modify and activate surfaces, and in our case, proved to have a favorable impact. The plasma treatment notably enhanced the self-cleaning properties of our tiles. Remarkably, even the persistence of the RB dye was overcome after a 10 h exposure under SS irradiation, showcased in Figure 16. This demonstrates the promising potential of plasma treatments in augmenting the self-cleaning efficiency of the tiles.
The enhanced self-cleaning properties observed in tiles post-plasma treatment likely stem from generating functional groups on surfaces, altering surface wettability, and potentially increasing surface area. Additionally, plasma treatments can induce defects in TiO2 nanoparticles or modify their electronic structure. These induced defects might act as sites for trapping electrons and holes, potentially diminishing their recombination and ultimately enhancing the photocatalytic activity.

2.6. Computational Analysis

To understand the observed self-cleaning properties of produced tiles, we have performed a computational analysis of dye molecules whose degradation has been studied. We have employed a combination of global and local reactivity descriptors to achieve this. Global reactivity descriptors provide essential information on the reactivity of molecular systems. In contrast, a descriptor like the molecular electrostatic potential (MEP) helps identify molecular sites prone to electrostatic interactions [61,62,63,64]. This combination of parameters helped us explain the degradation of dyes observed in our experiments. One of the best-known and most frequently applied types of visualization of MEP is by mapping its values to the electron density surface, which leads to the so-called MEP surfaces. This method has been utilized in this study as well. Additionally, it is essential to mention that M06-2X density functional has been used to prepare MEP surfaces, as it outperforms B3LYP regarding thermochemical molecular properties.
Global reactivity parameters of studied dye molecules have been summarized in Table 3, while MEP surfaces of MB, MO, and RB have been presented in Figure 17.
Derived from the results in Table 3, the chemical hardness parameter is the lowest for the MB dye molecule, indicating minor stability among all the considered dyes. Moreover, various parameters, including dipole moment and electrophilicity index, exhibit exceptionally high values, indicating that this molecular system is notably reactive. The lowest stability and highest reactivity are in close agreement with experimental results, according to which this color is removed in the shortest time.
While global reactivity descriptors explain why MB dye is removed fastest, they cannot explain why MO degrades faster than RB dye since the chemical hardness of MO is much higher than the chemical hardness of RB. This situation required considering the local reactivity properties via MEP surfaces.
The analysis of the MEP surface in Figure 17b indicates that MO is characterized by far the highest magnitudes of both negative and positive MEP values. This makes it the dye with the highest propensity to interact with negatively charged species. In particular, it is also notable in the case of this dye that the most prominent reactivity sites are located very close to each other, making one part of this molecule particularly reactive. Therefore, significant stability indicated by chemical hardness is compensated by the fact that extreme values of MEP are located in their close vicinity, making this molecule highly reactive at one particular molecular site.
According to experimental results, the efficiency of removing RB dye is the lowest. In many cases, this dye remained at least a little bit on the tile’s surface even after 10 h of irradiation with UV LED and SS irradiation. This dye was removed after 10 h of irradiation only after plasma treatment. Global reactivity descriptors explain why this dye is more persistent than MB. However, other facts should be taken into account to explain why it is more persistent than MO. Namely, this dye is characterized by very high magnitudes of negative and positive MEP values. Although its highest magnitude of positive MEP is lower than in the case of the MO dye, it should be noted that the highest value of MO dye comes from the positive Na ion. In the case of the RB dye, the positive MEP values are present due to the core molecular part and spread practically all over the molecule. Such topology of RB makes it less locally reactive than MO, and in combination with its size (65 atoms), it explains why it is more difficult to remove from the tile surface.

3. Materials and Methods

3.1. Chemicals and Solutions

All chemicals utilized were of reagent grade and were employed without undergoing purification. Chemicals used were RB (C28H31ClN2O3, >99.9%, Merck, Darmstadt, Germany), MB (C16H18ClN3S, >99%, Merck, Germany), and MO (C14H14N3NaO3S, >99.9% Kemika, Zagreb, Croatia), ethanol (C2H6O, >99.8%, Merck, Germany), acrylic concrete paint (Betokril, Poly, Šid, Serbia), TiO2 Hombikat (100% anatase, Sigma-Aldrich, specific surface area 35–65 m2/g). Every solution was formulated using ultrapure water (pH 6.56, κ = 0.055 μS/cm, total organic carbon TOC < LOD). The dye concentration within the aqueous stock solution was 0.05 mmol/dm3.

3.2. Materials for Synthesis

Commercial aluminum (Al) foil was used as a solid surface for applying TiO2-modified acrylic paint with 0.5, 1.0, and 2.0 mg/cm3 TiO2 Hombikat as photocatalysts. Al foil was cleaned with ethanol. The mixture of TiO2 acrylic paint was made by adding the appropriate amount of TiO2 to acrylic paint, after which this mixture was homogenized. After that, the tiles were coated with a TiO2 acrylic paint layer. The coated samples underwent air drying and were then subjected to a 15 min treatment in an oven at 200 °C to enhance adhesion to the substrate [65].

3.3. Characterization Methods

Impedance spectroscopy was employed to characterize the electrical properties of the examined sample within the frequency from 100 Hz to 1 MHz. These measurements were conducted using a Hioki Impedance Analyzer in a cell configuration with copper electrodes.
The contact angle was descriptively determined [66] using the micropipette. A drop of 10 μL of ultrapure water was placed on the clean tiles’ surface.
The structure of self-cleaning modified acrylic paint tiles with different content of TiO2 is assessed using SEM, where the presence of gold-coated particles was detected using a JEOL JSM-6460LV operating at 20 keV. SEM analysis was employed, utilizing an EDS detector, explicitly employing the INCAx-sight detector and ‘INAx-stream’ pulse processor from Oxford Instruments, to ascertain the composition and quality of self-cleaning modified acrylic paint tiles.
Raman scattering spectra were captured in backscattering geometry employing a Jobin-Yvon T64000 triple spectrometer with gratings of 1800 grooves/mm. The setup included a confocal microscope and a nitrogen-cooled charge-coupled device detector. The samples were excited using a 514.5 nm line of Ar+/Kr+ ion laser with an output power of ~20 mW to avoid sample heating (~200 μW under the objective of 50× magnification). The measurements were performed at room temperature in open air.

3.4. Plasma Treatment

Plasma used to treat tiles was produced in an electric wall-stabilized arc, operated at atmospheric pressure, and used in a direct current regime. The arc consists of six water-cooled copper discs, each 7.1 mm thick, separated by Teflon discs, each of which is 0.5 mm thick. The copper and Teflon discs form the arc channel, which is 70 mm long and has a diameter of 5 mm. This channel ends with tungsten electrodes on each side. The electrodes are hollow and are closed off with removable windows to the outside. More details about the used arc can be found in [67].
Pure argon gas was introduced into the arc channel at a flow rate of 3 L/min. The used electric current was 30 A. In this way, plasma is produced between the electrodes in the arc channel. At its axis, this plasma reaches an electron density of a few times 1016 cm−3 and an electron temperature ranging from 10,000 K to 11,000 K [68,69].
For this work, the window behind the anode was removed, and the tiles were placed at the opening, perpendicular to the plasma column axis. Each tile was exposed for 1 s.

3.5. Photodegradation Experiments

For self-cleaning experiments, tiles were placed on a flat surface, and an irradiation beam was focused on them. In total, 10 μL and 20 μL of dye solutions were applied to the surface of the tiles before irradiation. Tiles were irradiated for 10 h using SS radiation (50 W halogen lamp, Philips, with an intensity of 661.0 W/m2 in the visible region and 1.071 W/m2 in the UV region). The distance between the tiles and the irradiation source was 50 mm. In one series of experiments, 2 μL of ultrapure water was added to the tile’s surface after each hour of irradiation.
The radiation energy fluxes were measured using a Delta Ohm HD 2102.2 (Padova, Italy) radiometer, which was fitted with the LP 471 UV (spectral range 315–400 nm) and LP 471 RAD (spectral range 400–1050 nm) sensors.

3.6. Computational Details

Computational study of dye molecules was performed using quantum-mechanical calculations based on density functional tight binding (DFTB) and density functional theory (DFT) methods. GFN2-xTB method [70,71,72,73,74] developed by Prof. Stefan Grimme and coworkers was used to pre-optimize molecular structures of dyes. Further geometrical re-optimizations were performed using the combination of B3LYP [75,76,77,78] density functional and 6-31G(d,p) basis set. Actual ground states of molecules were confirmed by vibrational frequency analysis, which yielded only positive frequencies. Molecular electrostatic potential (MEP) calculations have also been performed using the DFT calculations by applying M06-2X density functional combined with a 6-311++G(d,p) basis set. All GFN2-xTB calculations have been performed with the xTB program [72] version 6.6.1. through the atomistica.online molecular modeling platform, freely available at https://atomistica.online (accessed on 1 November 2023). Geometrical optimization at the DFT level was performed with the ORCA [79,80,81,82,83] molecular modeling package. Single-point energy calculations to obtain MEP descriptors have been performed with the Jaguar [84,85,86,87] program, while molecular visualization of MEP descriptors was performed with the Maestro program [88], both as implemented in the Schrödinger Materials Science Suite 2023-3.

4. Conclusions

In this work, we prepared a tile base with self-cleaning properties by coating foil with acrylic white paint mixed with Hombikat TiO2 nanoparticles. A detailed analysis of charge transport properties involved impedance spectroscopy and the investigation of electrical conductivity. By fitting the Randles circuit with a CPE, the charge transfer resistance of the system was calculated to be 60.28 kΩ, indicating that the coating created a resistive barrier. The n parameter took a value of 0.88, suggesting that the system leans towards capacitive behavior but with certain non-idealities, which are most likely a consequence of the TiO2 nanoparticles in the acrylic paint. The time constant values obtained via the two approaches show good agreement regarding the quality of the Nyquist plot, while the numerical value of the μs order indicates relatively quick electrochemical processes in the system. Regarding frequency-dependent properties, measurements suggest that the dominant mechanism at low frequencies is polarization due to the separation of free charges in the samples. Electrical conductivity measurements identify charge hopping between localized states as the dominant mechanism of conductivity.
The characterization of control and self-cleaning surfaces, created by applying an acrylic paint matrix enriched with varying levels of titanium dioxide TiO2 nanoparticles (0.5, 1.0, 2.0 mg/cm3) onto aluminum foil, revealed significant insights. SEM analysis delineated morphological shifts, notably the emergence of spherical particles, correlating with increased TiO2 content. Raman spectroscopy provided distinct signals linked to TiO2 phases, confirming their successful integration within the acrylic matrix. Together, these observations underscore the substantial influence of TiO2 content on surface attributes, offering crucial insights into customizing self-cleaning capabilities for diverse practical applications. Contact angle measurements depicted a noteworthy rise in hydrophobicity with increasing TiO2 concentrations, highlighting stronger water repellency across the modified acrylic surfaces. The difference in charge transport properties indicates a change in the transport mechanism of the charge carriers due to doping acrylic paint with TiO2. The samples exhibited comparable results of 0.5, 1.0, and 2.0 mg/cm3 of TiO2, meaning doping in this concentration range does not significantly affect observed parameters.
Self-cleaning properties were tested against three frequently used industrial dyes, considered significant environmental threats. These properties were evaluated under the influence of SS irradiation. Better self-cleaning results were observed under SS irradiation, wherein MB and MO were wholly removed from the tile surface after 2 h each. However, RB remained on the tile surface in both cases. Complete removal of RB paint was achieved by exposing the self-cleaning wafers to plasma from a continuous discharge arc, indicating the promising potential of this technique for further improvement of the self-cleaning properties of the prepared wafers and further research. A detailed analysis of the reactive properties of dye molecules was performed using a combination of DFTB and DFT. These results aided our understanding of the dye removal efficiency in more detail. Specifically, the MB dye is the least stable dye according to the chemical hardness descriptor. MO, the most stable based on chemical hardness, exhibits extreme charge separation in a small molecular area around the SO3 group, which is likely the molecular site where degradation begins. In terms of chemical hardness, RB is between MB and MO. However, it is the most persistent dye, which may be due to its size. Specifically, RB contains almost twice as many atoms as MB or MO.

Author Contributions

Conceptualization, S.J.A., M.M.S. and S.A.; Data curation, S.J.A., M.M.S., L.G. and S.A.; Formal analysis, S.J.A., M.M.S., M.V.Š., N.S., L.G., M.K., M.Š., M.G.-B. and S.A.; Funding acquisition, S.J.A. and S.A.; Investigation, S.J.A., M.M.S., M.V.Š., N.S., L.G., M.K., M.Š., M.G.-B. and S.A.; Methodology, S.J.A., L.G. and S.A.; Project administration, S.J.A.; Resources, S.J.A. and S.A.; Software, S.J.A. and S.A.; Supervision, S.J.A. and S.A.; Validation, S.J.A., M.V.Š. and S.A.; Visualization, S.J.A., M.M.S., M.V.Š., M.Š., M.G.-B. and S.A.; Writing—original draft, S.J.A., M.M.S., M.V.Š., L.G. and S.A., Writing—revision draft, S.J.A., M.M.S., M.V.Š., M.K., M.Š., M.G.-B. and S.A. All authors have read and agreed to the published version of the manuscript.

Funding

The authors sincerely acknowledge and express their gratitude for the financial support received from various sources. S.J.A., M.M.S., M.V.Š., N.S., L.G. and S.A. extend their appreciation to the Ministry of Science, Technological Development and Innovation of the Republic of Serbia for the funding provided under Grant No. 451-03-47/2023-01/200125. M.Š. and M.G.B. gratefully acknowledge the funding received from the Institute of Physics Belgrade, facilitated through a grant from the Ministry of Science, Technological Development and Innovation of the Republic of Serbia. M.K. expresses gratitude for the support received for the project titled “Innovative Scientific and Artistic Research from the Faculty of Technical Sciences Activity Domain”, with ID 200156.

Data Availability Statement

Data are contained within the article.

Acknowledgments

Authors express sincere gratitude to Stevica Đurović for his invaluable assistance, constructive comments, and expert guidance throughout this research related to plasma applications. S.A. gratefully acknowledges the computational resources of the Republic of Serbia’s National AI platform (https://www.ai.gov.rs, accessed on 1 November 2023).

Conflicts of Interest

The authors declare no conflicts of interest.

References

  1. Sarkar, S.; Ponce, N.T.; Banerjee, A.; Bandopadhyay, R.; Rajendran, S.; Lichtfouse, E. Green Polymeric Nanomaterials for the Photocatalytic Degradation of Dyes: A Review. Environ. Chem. Lett. 2020, 18, 1569–1580. [Google Scholar] [CrossRef]
  2. Banerjee, S.; Dionysiou, D.D.; Pillai, S.C. Self-Cleaning Applications of TiO2 by Photo-Induced Hydrophilicity and Photocatalysis. Appl. Catal. B Environ. 2015, 176–177, 396–428. [Google Scholar] [CrossRef]
  3. Al-Tohamy, R.; Ali, S.S.; Li, F.; Okasha, K.M.; Mahmoud, Y.A.-G.; Elsamahy, T.; Jiao, H.; Fu, Y.; Sun, J. A Critical Review on the Treatment of Dye-Containing Wastewater: Ecotoxicological and Health Concerns of Textile Dyes and Possible Remediation Approaches for Environmental Safety. Ecotoxicol. Environ. Saf. 2022, 231, 113160. [Google Scholar] [CrossRef] [PubMed]
  4. Lu, Y.; Song, S.; Wang, R.; Liu, Z.; Meng, J.; Sweetman, A.J.; Jenkins, A.; Ferrier, R.C.; Li, H.; Luo, W.; et al. Impacts of Soil and Water Pollution on Food Safety and Health Risks in China. Environ. Int. 2015, 77, 5–15. [Google Scholar] [CrossRef] [PubMed]
  5. Yaseen, D.A.; Scholz, M. Textile Dye Wastewater Characteristics and Constituents of Synthetic Effluents: A Critical Review. Int. J. Environ. Sci. Technol. 2019, 16, 1193–1226. [Google Scholar] [CrossRef]
  6. Calia, A.; Lettieri, M.; Masieri, M. Durability Assessment of Nanostructured TiO2 Coatings Applied on Limestones to Enhance Building Surface with Self-Cleaning Ability. Build. Environ. 2016, 110, 1–10. [Google Scholar] [CrossRef]
  7. Liang, F.; Dong, H.; Ji, Z.; Zhang, W.; Zhang, H.; Cao, C.; Li, H.; Liu, H.; Zhang, K.-Q.; Lai, Y.; et al. Temperature-Dependent Synthesis of SnO2 or Sn Embedded in Hollow Porous Carbon Nanofibers toward Customized Lithium-Ion Batteries. Sci. China Mater. 2023, 66, 1736–1746. [Google Scholar] [CrossRef]
  8. Armaković, S.J.; Savanović, M.M.; Armaković, S. Titanium Dioxide as the Most Used Photocatalyst for Water Purification: An Overview. Catalysts 2023, 13, 26. [Google Scholar] [CrossRef]
  9. Ge, M.; Tang, Y.; Malyi, O.I.; Zhang, Y.; Zhu, Z.; Lv, Z.; Ge, X.; Xia, H.; Huang, J.; Lai, Y.; et al. Mechanically Reinforced Localized Structure Design to Stabilize Solid–Electrolyte Interface of the Composited Electrode of Si Nanoparticles and TiO2 Nanotubes. Small 2020, 16, 2002094. [Google Scholar] [CrossRef]
  10. Ruot, B.; Plassais, A.; Olive, F.; Guillot, L.; Bonafous, L. TiO2-Containing Cement Pastes and Mortars: Measurements of the Photocatalytic Efficiency Using a Rhodamine B-Based Colourimetric Test. Sol. Energy 2009, 83, 1794–1801. [Google Scholar] [CrossRef]
  11. Demeestere, K.; Dewulf, J.; De Witte, B.; Beeldens, A.; Van Langenhove, H. Heterogeneous Photocatalytic Removal of Toluene from Air on Building Materials Enriched with TiO2. Build. Environ. 2008, 43, 406–414. [Google Scholar] [CrossRef]
  12. Vučetić, S.B.; Rudić, O.L.J.; Markov, S.L.; Bera, O.J.; Vidaković, A.M.; Skapin, A.S.S.; Ranogajec, J.G. Antifungal Efficiency Assessment of the TiO2 Coating on Façade Paints. Environ. Sci. Pollut. Res. 2014, 21, 11228–11237. [Google Scholar] [CrossRef] [PubMed]
  13. Stambolova, I.; Shipochka, M.; Blaskov, V.; Loukanov, A.; Vassilev, S. Sprayed Nanostructured TiO2 Films for Efficient Photocatalytic Degradation of Textile Azo Dye. J. Photochem. Photobiol. B Biol. 2012, 117, 19–26. [Google Scholar] [CrossRef] [PubMed]
  14. Yerli Soylu, N.; Soylu, A.; Dikmetas, D.N.; Karbancioglu-Guler, F.; Kucukbayrak, S.; Erol Taygun, M. Photocatalytic and Antimicrobial Properties of Electrospun TiO2–SiO2–Al2O3–ZrO2–CaO–CeO2 Ceramic Membranes. ACS Omega 2023, 8, 10836–10850. [Google Scholar] [CrossRef] [PubMed]
  15. Goetz, V.; Dezani, C.; Ribeiro, E.; Caliot, C.; Plantard, G. Continuous Flow Photocatalytic Reactor Using TiO2-coated Foams, Modeling and Experimental Operating Mode. AIChE J. 2023, 69, e17972. [Google Scholar] [CrossRef]
  16. Belkessa, N.; Serhane, Y.; Bouzaza, A.; Khezami, L.; Assadi, A.A. Gaseous Ethylbenzene Removal by Photocatalytic TiO2 Nanoparticles Immobilized on Glass Fiber Tissue under Real Conditions: Evaluation of Reactive Oxygen Species Contribution to the Photocatalytic Process. Environ. Sci. Pollut. Res. 2022, 30, 35745–35756. [Google Scholar] [CrossRef]
  17. Vulic, T.; Hadnadjev-Kostic, M.; Rudic, O.; Radeka, M.; Marinkovic-Neducin, R.; Ranogajec, J. Improvement of Cement-Based Mortars by Application of Photocatalytic Active Ti–Zn–Al Nanocomposites. Cem. Concr. Compos. 2013, 36, 121–127. [Google Scholar] [CrossRef]
  18. Lara, R.C.; De Castro Xavier, G.; Canela, M.C.; Carvalho, J.A.; Alexandre, J.; De Azevedo, A.R.G. Characterization and Photocatalytic Performance of Cement Mortars with Incorporation of TiO2 and Mineral Admixtures. Environ. Sci. Pollut. Res. 2023, 30, 95537–95549. [Google Scholar] [CrossRef]
  19. Růžek, V.; Novosád, J.; Buczkowska, K.E. Geopolymer Antimicrobial and Hydrophobic Modifications: A Review. Ceramics 2023, 6, 1749–1764. [Google Scholar] [CrossRef]
  20. Zailan, S.N.; Mahmed, N.; Abdullah, M.M.A.B.; Rahim, S.Z.A.; Halin, D.S.C.; Sandu, A.V.; Vizureanu, P.; Yahya, Z. Potential Applications of Geopolymer Cement-Based Composite as Self-Cleaning Coating: A Review. Coatings 2022, 12, 133. [Google Scholar] [CrossRef]
  21. Song, Z.; Fathizadeh, M.; Huang, Y.; Chu, K.H.; Yoon, Y.; Wang, L.; Xu, W.L.; Yu, M. TiO2 Nanofiltration Membranes Prepared by Molecular Layer Deposition for Water Purification. J. Membr. Sci. 2016, 510, 72–78. [Google Scholar] [CrossRef]
  22. Arun, J.; Nachiappan, S.; Rangarajan, G.; Alagappan, R.P.; Gopinath, K.P.; Lichtfouse, E. Synthesis and Application of Titanium Dioxide Photocatalysis for Energy, Decontamination and Viral Disinfection: A Review. Environ. Chem. Lett. 2023, 21, 339–362. [Google Scholar] [CrossRef]
  23. Navidpour, A.H.; Hosseinzadeh, A.; Zhou, J.L.; Huang, Z. Progress in the Application of Surface Engineering Methods in Immobilizing TiO 2 and ZnO Coatings for Environmental Photocatalysis. Catal. Rev. 2023, 65, 822–873. [Google Scholar] [CrossRef]
  24. Ramirez, A.M.; Demeestere, K.; De Belie, N.; Mäntylä, T.; Levänen, E. Titanium Dioxide Coated Cementitious Materials for Air Purifying Purposes: Preparation, Characterization and Toluene Removal Potential. Build. Environ. 2010, 45, 832–838. [Google Scholar] [CrossRef]
  25. Hüsken, G.; Hunger, M.; Brouwers, H.J.H. Experimental Study of Photocatalytic Concrete Products for Air Purification. Build. Environ. 2009, 44, 2463–2474. [Google Scholar] [CrossRef]
  26. Heredia Deba, S.A.; Wols, B.A.; Yntema, D.R.; Lammertink, R.G.H. Advanced Ceramics in Radical Filtration: TiO2 Layer Thickness Effect on the Photocatalytic Membrane Performance. J. Membr. Sci. 2023, 672, 121423. [Google Scholar] [CrossRef]
  27. Munafò, P.; Quagliarini, E.; Goffredo, G.B.; Bondioli, F.; Licciulli, A. Durability of Nano-Engineered TiO2 Self-Cleaning Treatments on Limestone. Constr. Build. Mater. 2014, 65, 218–231. [Google Scholar] [CrossRef]
  28. Poulios, I.; Spathis, P.; Grigoriadou, A.; Delidou, K.; Tsoumparis, P. Protection of Marbles against Corrosion and Microbial Corrosion with TiO 2 Coatings. J. Environ. Sci. Health Part A 1999, 34, 1455–1471. [Google Scholar] [CrossRef]
  29. Huang, X.; Tepylo, N.; Pommier-Budinger, V.; Budinger, M.; Bonaccurso, E.; Villedieu, P.; Bennani, L. A Survey of Icephobic Coatings and Their Potential Use in a Hybrid Coating/Active Ice Protection System for Aerospace Applications. Prog. Aerosp. Sci. 2019, 105, 74–97. [Google Scholar] [CrossRef]
  30. Weicheng, K.; Chengwen, S.; Dejun, K. Laser Cladded TiO2–Cu Composite Coatings with High TiO2 Content: Tribological Properties by First-Principle Calculation. Wear 2023, 530–531, 204999. [Google Scholar] [CrossRef]
  31. Kumar, A.; Singh, H.; Kant, R. Influence of Substrate Roughness and Ceramic Content on Deposition Characteristics of Cold-Sprayed Ti/TiO2 Deposits. Met. Mater. Int. 2023, 29, 1669–1683. [Google Scholar] [CrossRef]
  32. Gopalan, A.-I.; Lee, J.-C.; Saianand, G.; Lee, K.-P.; Sonar, P.; Dharmarajan, R.; Hou, Y.; Ann, K.-Y.; Kannan, V.; Kim, W.-J. Recent Progress in the Abatement of Hazardous Pollutants Using Photocatalytic TiO2-Based Building Materials. Nanomaterials 2020, 10, 1854. [Google Scholar] [CrossRef] [PubMed]
  33. Midtdal, K.; Jelle, B.P. Self-Cleaning Glazing Products: A State-of-the-Art Review and Future Research Pathways. Sol. Energy Mater. Sol. Cells 2013, 109, 126–141. [Google Scholar] [CrossRef]
  34. Carneiro, J.O.; Teixeira, V.; Portinha, A.; Magalhães, A.; Coutinho, P.; Tavares, C.J.; Newton, R. Iron-Doped Photocatalytic TiO2 Sputtered Coatings on Plastics for Self-Cleaning Applications. Mater. Sci. Eng. B 2007, 138, 144–150. [Google Scholar] [CrossRef]
  35. Qin, J.; Lu, H. A Review of Self-Cleaning Coatings for Solar Photovoltaic Systems: Theory, Materials, Preparation, and Applications. Environ. Sci. Pollut. Res. 2023, 30, 91591–91616. [Google Scholar] [CrossRef] [PubMed]
  36. Lalia, B.S.; Ahmed, F.E.; Shah, T.; Hilal, N.; Hashaikeh, R. Electrically Conductive Membranes Based on Carbon Nanostructures for Self-Cleaning of Biofouling. Desalination 2015, 360, 8–12. [Google Scholar] [CrossRef]
  37. Sumithra, M.; Sundaraganesan, N.; Rajesh, R.; Vetrivelan, V.; Ilangovan, V.; Javed, S.; Muthu, S. Electron Acceptor, Excitation Energies, Oscillatory Strength, Spectroscopic and Solvent Effects on 5-Amino-4,6-Dichloro-2-(Propylthio) Pyrimidine—Anticancer Agent. Chem. Phys. Impact. 2023, 6, 100145. [Google Scholar] [CrossRef]
  38. Sumithra, M.; Sundaraganesan, N.; Venkata Prasad, K.; Rajesh, R.; Vetrivelan, V.; Ilangovan, V.; Irfan, A.; Muthu, S. Effect of Green Solvents Physical, Chemical, Biological and Bonding Nature on 5-Acetyl-Thiophene-2-Carboxylic Acid by DFT and TD-DFT Approach—An Antiviral Agent. J. Indian Chem. Soc. 2023, 100, 100867. [Google Scholar] [CrossRef]
  39. Al-Otaibi, J.S.; Mary, Y.S.; Mary, Y.S.; Thomas, R. Evidence of Cluster Formation of Pyrrole with Mixed Silver Metal Clusters, Agx-My (x = 4,5, y = 2/1 and M = Au/Ni/Cu) Using DFT/SERS Analysis. Comput. Theor. Chem. 2022, 1208, 113569. [Google Scholar] [CrossRef]
  40. Haruna, K.; Kumar, V.S.; Armaković, S.J.; Armaković, S.; Mary, Y.S.; Thomas, R.; Popoola, S.A.; Almohammedi, A.R.; Roxy, M.S.; Al-Saadi, A.A. Spectral Characterization, Thermochemical Studies, Periodic SAPT Calculations and Detailed Quantum Mechanical Profiling Various Physico-Chemical Properties of 3, 4-Dichlorodiuron. Spectrochim. Acta Part A Mol. Biomol. Spectrosc. 2020, 228, 117580. [Google Scholar] [CrossRef]
  41. Bielenica, A.; Beegum, S.; Mary, Y.S.; Mary, Y.S.; Thomas, R.; Armaković, S.; Armaković, S.J.; Madeddu, S.; Struga, M.; Van Alsenoy, C. Experimental and Computational Analysis of 1-(4-Chloro-3-Nitrophenyl)-3-(3, 4-Dichlorophenyl) Thiourea. J. Mol. Struct. 2020, 1205, 127587. [Google Scholar] [CrossRef]
  42. Pooventhiran, T.; Thomas, R.; Bhattacharyya, U.; Sowrirajan, S.; Irfan, A.; Rao, D.J. Structural Aspects, Reactivity Analysis, Wavefunction Based Properties, Cluster Formation with Helicene and Subsequent Detection from Surface Enhancement in Raman Spectra of Triclabendazole Studies Using First Principle Simulations. Vietnam J. Chem. 2021, 59, 887–901. [Google Scholar] [CrossRef]
  43. Apaolaza, A.; Richard, D.; Tejerina, M.R. Experimental and Ab Initio Study of the Structural and Optical Properties of ZnO Coatings: Performance of the DFT+ U Approach. Process. Appl. Ceram. 2020, 14, 362–371. [Google Scholar] [CrossRef]
  44. Janani, S.; Rajagopal, H.; Sakthivel, S.; Aayisha, S.; Raja, M.; Irfan, A.; Javed, S.; Muthu, S. Molecular Structure, Electronic Properties, ESP Map (Polar Aprotic and Polar Protic Solvents), and Topology Investigations on 1-(tert-Butoxycarbonyl)-3-Piperidinecarboxylic Acid- Anticancer Therapeutic Agent. J. Mol. Struct. 2022, 1268, 133696. [Google Scholar] [CrossRef]
  45. Muthu, S.; Uma Maheswari, J. Quantum Mechanical Study and Spectroscopic (FT-IR, FT-Raman, 13C, 1H, UV) Study, First Order Hyperpolarizability, NBO Analysis, HOMO and LUMO Analysis of 4-[(4-Aminobenzene) Sulfonyl] Aniline by Ab Initio HF and Density Functional Method. Spectrochim. Acta Part A Mol. Biomol. Spectrosc. 2012, 92, 154–163. [Google Scholar] [CrossRef]
  46. Tonel, M.Z.; González-Durruthy, M.; Zanella, I.; Fagan, S.B. Interactions of Graphene Derivatives with Glutamate-Neurotransmitter: A Parallel First Principles—Docking Investigation. J. Mol. Graph. Model. 2019, 88, 121–127. [Google Scholar] [CrossRef]
  47. de Oliveira, P.V.; Zanella, I.; Bulhões, L.O.S.; Fagan, S.B. Adsorption of 17 β- Estradiol in Graphene Oxide through the Competing Methanol Co-Solvent: Experimental and Computational Analysis. J. Mol. Liq. 2021, 321, 114738. [Google Scholar] [CrossRef]
  48. Bruckmann, F.d.S.; Zuchetto, T.; Ledur, C.M.; dos Santos, C.L.; da Silva, W.L.; Binotto Fagan, S.; Zanella da Silva, I.; Bohn Rhoden, C.R. Methylphenidate Adsorption onto Graphene Derivatives: Theory and Experiment. New J. Chem. 2022, 46, 4283–4291. [Google Scholar] [CrossRef]
  49. Murthy, P.K.; Valverde, C.; Suneetha, V.; Armaković, S.; Armaković, S.J.; Rani, N.U.; Naidu, N.V. An Analysis of Structural and Spectroscopic Signatures, the Reactivity Study of Synthetized 4,6-Dichloro-2-(Methylsulfonyl)Pyrimidine: A Potential Third-Order Nonlinear Optical Material. J. Mol. Struct. 2019, 1186, 263–275. [Google Scholar] [CrossRef]
  50. Murthy, P.K.; Sheena Mary, Y.; Shyma Mary, Y.; Panicker, C.Y.; Suneetha, V.; Armaković, S.; Armaković, S.J.; Van Alsenoy, C.; Suchetan, P.A. Synthesis, Crystal Structure Analysis, Spectral Investigations, DFT Computations and Molecular Dynamics and Docking Study of 4-Benzyl-5-Oxomorpholine-3-Carbamide, a Potential Bioactive Agent. J. Mol. Struct. 2017, 1134, 25–39. [Google Scholar] [CrossRef]
  51. Sacco, A.; Mandrile, L.; Tay, L.-L.; Itoh, N.; Raj, A.; Moure, A.; Del Campo, A.; Fernandez, J.F.; Paton, K.R.; Wood, S.; et al. Quantification of Titanium Dioxide (TiO2) Anatase and Rutile Polymorphs in Binary Mixtures by Raman Spectroscopy: An Interlaboratory Comparison. Metrologia 2023, 60, 055011. [Google Scholar] [CrossRef]
  52. Donnelly, F.C.; Purcell-Milton, F.; Framont, V.; Cleary, O.; Dunne, P.W.; Gun’ko, Y.K. Synthesis of CaCO 3 Nano- and Micro-Particles by Dry Ice Carbonation. Chem. Commun. 2017, 53, 6657–6660. [Google Scholar] [CrossRef]
  53. Stewart, S.P.; Bell, S.E.J.; Armstrong, W.J.; Kee, G.; Speers, S.J. Forensic Examination of Multilayer White Paint by Lateral Scanning Raman Spectroscopy. J. Raman Spectrosc. 2012, 43, 131–137. [Google Scholar] [CrossRef]
  54. Bell, S.E.J.; Fido, L.A.; Speers, S.J.; Armstrong, W.J.; Spratt, S. Forensic Analysis of Architectural Finishes Using Fourier Transform Infrared and Raman Spectroscopy, Part II: White Paint. Appl. Spectrosc. 2005, 59, 1340–1346. [Google Scholar] [CrossRef]
  55. Cui, L.; Zhang, D.; Yang, K.; Zhang, X.; Zhu, Y.-G. Perspective on Surface-Enhanced Raman Spectroscopic Investigation of Microbial World. Anal. Chem. 2019, 91, 15345–15354. [Google Scholar] [CrossRef]
  56. Trabelsi, I.; Jebali, A.; Kanzari, M. Electrical Characterization of SnSb4S7 Thin Films by Impedance Spectroscopy. J. Mater. Sci. Mater. Electron. 2016, 27, 4326–4335. [Google Scholar] [CrossRef]
  57. Parker, R.A.; Wasilik, J.H. Dielectric Constant and Dielectric Loss of TiO2 (Rutile) at Low Frequencies. Phys. Rev. 1960, 120, 1631–1637. [Google Scholar] [CrossRef]
  58. Jonscher, A. The ‘Universal’ Dielectric Response. Nature 1977, 267, 673–679. Available online: https://www.nature.com/articles/267673a0 (accessed on 27 October 2023). [CrossRef]
  59. Giuntini, J.C.; Zanchetta, J.V.; Jullien, D.; Eholie, R.; Houenou, P. Temperature Dependence of Dielectric Losses in Chalcogenide Glasses. J. Non-Cryst. Solids 1981, 45, 57–62. [Google Scholar] [CrossRef]
  60. Elliott, S.R. A Theory of a.c. Conduction in Chalcogenide Glasses. Philos. Mag. A J. Theor. Exp. Appl. Phys. 1977, 36, 1291–1304. [Google Scholar] [CrossRef]
  61. Politzer, P.; Truhlar, D.G. Chemical Applications of Atomic and Molecular Electrostatic Potentials: Reactivity, Structure, Scattering, and Energetics of Organic, Inorganic, and Biological Systems; Springer Science & Business Media: Berlin/Heidelberg, Germany, 2013; ISBN 1-4757-9634-X. [Google Scholar]
  62. Politzer, P.; Laurence, P.R.; Jayasuriya, K. Molecular Electrostatic Potentials: An Effective Tool for the Elucidation of Biochemical Phenomena. Environ. Health Perspect. 1985, 61, 191–202. [Google Scholar] [CrossRef]
  63. Murray, J.S.; Politzer, P. The Electrostatic Potential: An Overview. Wiley Interdiscip. Rev. Comput. Mol. Sci. 2011, 1, 153–163. [Google Scholar] [CrossRef]
  64. Politzer, P.; Murray, J.S. The Fundamental Nature and Role of the Electrostatic Potential in Atoms and Molecules. Theor. Chem. Acc. 2002, 108, 134–142. [Google Scholar] [CrossRef]
  65. Costa, A.L.; Ortelli, S.; Blosi, M.; Albonetti, S.; Vaccari, A.; Dondi, M. TiO2 Based Photocatalytic Coatings: From Nanostructure to Functional Properties. Chem. Eng. J. 2013, 225, 880–886. [Google Scholar] [CrossRef]
  66. Neumann, A.W.; Good, R.J. Techniques of Measuring Contact Angles. In Surface and Colloid Science; Good, R.J., Stromberg, R.R., Eds.; Springer: Boston, MA, USA, 1979; pp. 31–91. ISBN 978-1-4615-7971-7. [Google Scholar]
  67. Nikolić, D.; Djurović, S.; Mijatović, Z.; Kobilarov, R.; Vujičić, B.; Ćirišan, M. Determination of Ion-Broadening Parameter for Some Ar I Spectral Lines. J. Quant. Spectrosc. Radiat. Transf. 2004, 86, 285–298. [Google Scholar] [CrossRef]
  68. Djurović, S.; Mijatović, Z.; Kobilarov, R.; Konjević, N. Stark Width and Shift Temperature Dependence of the Ar I 425.9 Nm Line. J. Quant. Spectrosc. Radiat. Transf. 1997, 57, 695–701. [Google Scholar] [CrossRef]
  69. Djurović, S.; Nikolić, D.; Mijatović, Z.; Kobilarov, R.; Konjević, N. Line Shape Study of Neutral Argon Lines in Plasma of an Atmospheric Pressure Wall Stabilized Argon Arc. Plasma Sources Sci. Technol. 2002, 11, A95. [Google Scholar] [CrossRef]
  70. Grimme, S.; Bannwarth, C.; Shushkov, P. A Robust and Accurate Tight-Binding Quantum Chemical Method for Structures, Vibrational Frequencies, and Noncovalent Interactions of Large Molecular Systems Parametrized for All Spd-Block Elements (Z = 1–86). J. Chem. Theory Comput. 2017, 13, 1989–2009. [Google Scholar] [CrossRef]
  71. Pracht, P.; Caldeweyher, E.; Ehlert, S.; Grimme, S. A Robust Non-Self-Consistent Tight-Binding Quantum Chemistry Method for Large Molecules. In Theoretical and Computational Chemistry; ChemRxiv®: Beijing, China, 2019. [Google Scholar] [CrossRef]
  72. Bannwarth, C.; Caldeweyher, E.; Ehlert, S.; Hansen, A.; Pracht, P.; Seibert, J.; Spicher, S.; Grimme, S. Extended Tight-Binding Quantum Chemistry Methods. WIREs Comput. Mol. Sci. 2021, 11, e1493. [Google Scholar] [CrossRef]
  73. Bannwarth, C.; Ehlert, S.; Grimme, S. GFN2-xTB—An Accurate and Broadly Parametrized Self-Consistent Tight-Binding Quantum Chemical Method with Multipole Electrostatics and Density-Dependent Dispersion Contributions. J. Chem. Theory Comput. 2019, 15, 1652–1671. [Google Scholar] [CrossRef]
  74. Ehlert, S.; Stahn, M.; Spicher, S.; Grimme, S. Robust and Efficient Implicit Solvation Model for Fast Semiempirical Methods. J. Chem. Theory Comput. 2021, 17, 4250–4261. [Google Scholar] [CrossRef]
  75. Stephens, P.J.; Devlin, F.J.; Chabalowski, C.F.; Frisch, M.J. Ab Initio Calculation of Vibrational Absorption and Circular Dichroism Spectra Using Density Functional Force Fields. J. Phys. Chem. 1994, 98, 11623–11627. [Google Scholar] [CrossRef]
  76. Vosko, S.H.; Wilk, L.; Nusair, M. Accurate Spin-Dependent Electron Liquid Correlation Energies for Local Spin Density Calculations: A Critical Analysis. Can. J. Phys. 1980, 58, 1200–1211. [Google Scholar] [CrossRef]
  77. Becke, A.D. Density-functional Thermochemistry. III. The Role of Exact Exchange. J. Chem. Phys. 1993, 98, 5648–5652. [Google Scholar] [CrossRef]
  78. Lee, C.; Yang, W.; Parr, R.G. Development of the Colle-Salvetti Correlation-Energy Formula into a Functional of the Electron Density. Phys. Rev. B 1988, 37, 785. [Google Scholar] [CrossRef]
  79. Neese, F. The ORCA Program System. WIREs Comput. Mol. Sci. 2012, 2, 73–78. [Google Scholar] [CrossRef]
  80. Neese, F.; Wennmohs, F.; Becker, U.; Riplinger, C. The ORCA Quantum Chemistry Program Package. J. Chem. Phys. 2020, 152, 224108. [Google Scholar] [CrossRef]
  81. Neese, F. The SHARK Integral Generation and Digestion System. J. Comput. Chem. 2022, 44, 381–396. [Google Scholar] [CrossRef]
  82. Neese, F. Software Update: The ORCA Program System, Version 4.0. WIREs Comput. Mol. Sci. 2018, 8, e1327. [Google Scholar] [CrossRef]
  83. Neese, F. Software Update: The ORCA Program System—Version 5.0. WIREs Comput. Mol. Sci. 2022, 12, e1606. [Google Scholar] [CrossRef]
  84. Jacobson, L.D.; Bochevarov, A.D.; Watson, M.A.; Hughes, T.F.; Rinaldo, D.; Ehrlich, S.; Steinbrecher, T.B.; Vaitheeswaran, S.; Philipp, D.M.; Halls, M.D. Automated Transition State Search and Its Application to Diverse Types of Organic Reactions. J. Chem. Theory Comput. 2017, 13, 5780–5797. [Google Scholar] [CrossRef]
  85. Cao, Y.; Hughes, T.; Giesen, D.; Halls, M.D.; Goldberg, A.; Vadicherla, T.R.; Sastry, M.; Patel, B.; Sherman, W.; Weisman, A.L.; et al. Highly Efficient Implementation of Pseudospectral Time-Dependent Density-Functional Theory for the Calculation of Excitation Energies of Large Molecules. J. Comput. Chem. 2016, 37, 1425–1441. [Google Scholar] [CrossRef] [PubMed]
  86. Bochevarov, A.D.; Harder, E.; Hughes, T.F.; Greenwood, J.R.; Braden, D.A.; Philipp, D.M.; Rinaldo, D.; Halls, M.D.; Zhang, J.; Friesner, R.A. Jaguar: A High-Performance Quantum Chemistry Software Program with Strengths in Life and Materials Sciences. Int. J. Quantum Chem. 2013, 113, 2110–2142. [Google Scholar] [CrossRef]
  87. Cao, Y.; Halls, M.D.; Vadicherla, T.R.; Friesner, R.A. Pseudospectral Implementations of Long-Range Corrected Density Functional Theory. J. Comput. Chem. 2021, 42, 2089–2102. [Google Scholar] [CrossRef] [PubMed]
  88. Maestro Schrödinger Release 2023-3: Maestro; Schrödinger, LLC: New York, NY, USA, 2023.
Figure 1. The SEM images and EDS spectra of self-cleaning modified acrylic paint tiles with different content of TiO2.
Inorganics 12 00035 g001
Figure 2. Raman spectra of (a) pure acrylic paint and (b) 2.0TiO2 sample in extended range. Raman features of rutile, anatase, calcite, and alkyd resin are denoted by R, A, c, and *, respectively.
Inorganics 12 00035 g002
Figure 3. Raman spectra of TiO2 nanopowder, aluminum foil, pure acrylic paint, and acrylic paint with different TiO2 nanopowder content. Raman features of rutile, anatase, and calcite are denoted by R, A, and c, respectively.
Inorganics 12 00035 g003
Figure 4. The integrated intensity ratio of anatase Eg (143 cm−1) to rutile A1g (610 cm−1) mode for different content (mg/cm3) of TiO2 nanopowder in acrylic paint samples. The dashed line illustrates the linear fitting of the experimental data.
Inorganics 12 00035 g004
Figure 5. Observation of contact angle for self-cleaning modified acrylic paint tiles with different content of TiO2.
Inorganics 12 00035 g005
Figure 6. The complex impedance spectra for the coated foils with (a) acrylic paint and (b) 1.0TiO2-modified acrylic paint (black dots) fit with an equivalent circuit (red curve).
Inorganics 12 00035 g006
Figure 7. The variation in the imaginary component with respect to frequency of the complex impedance for the coated foils with (a) acrylic paint and (b) 1.0TiO2-modified acrylic paint.
Inorganics 12 00035 g007
Figure 8. Changes in the real part of dielectric permittivity concerning frequency for the coated foils with (a) acrylic paint and (b) 1.0TiO2-modified acrylic paint.
Inorganics 12 00035 g008
Figure 9. The frequency dependence of dielectric loss for the coated foils with (a) acrylic paint and (b) 1.0TiO2-modified acrylic paint.
Inorganics 12 00035 g009
Figure 10. The electrical conductivity for the coated foils with (a) acrylic paint and (b) 1.0TiO2-modified acrylic paint.
Inorganics 12 00035 g010
Figure 11. Giuntini model for the description of dielectric dispersion for the coated foils with (a) acrylic paint and (b) 1.0TiO2-modified acrylic paint.
Inorganics 12 00035 g011
Figure 12. Dye removal using self-cleaning acrylic paint tiles under irradiation.
Inorganics 12 00035 g012
Figure 13. Dye removal using self-cleaning 0.5TiO2-modified acrylic paint tiles under irradiation.
Inorganics 12 00035 g013
Figure 14. Dye removal using self-cleaning 1.0TiO2-modified acrylic paint tiles under irradiation.
Inorganics 12 00035 g014
Figure 15. Dye removal using self-cleaning 2.0TiO2-modified acrylic paint tiles under irradiation.
Inorganics 12 00035 g015
Figure 16. Dye removal using self-cleaning TiO2-modified acrylic paint tiles activated with continuous plasma arch under SS irradiation.
Inorganics 12 00035 g016
Figure 17. MEP surfaces of (a) MB, (b) MO, and (c) RB with extreme values in kcal/mol.
Inorganics 12 00035 g017
Table 1. EDS results for control and self-cleaning modified acrylic paint tiles with different content of TiO2.
SampleTiO2
(mg/cm3)
EDS Results
C
(wt.%)
O
(wt.%)
Ca
(wt.%)
Ti
(wt.%)
Total
(wt.%)
Control030.4649.7516.453.34100.00
TiO20.526.7043.5324.714.29100.00
1.025.9243.1426.274.68100.00
Table 2. The values of electrical circuit parameters.
SampleR (kΩ)A (nF)nC (pF)τ = (R·A)1/n (μs)τ = 1/2πfmax (μs)
acrylic paint2.133.020.511.53--
1.0TiO260.280.540.88-8.288.69
Table 3. Selected global reactivity parameters of dye molecules.
Duy E H O M O [ e V ] E L U M O [ e V ] η [ e V ] S [ e V 1 ] μ D [ D e b y e ] ω [ e V ]
MB−6.23−2.961.640.6111.916.45
MO−6.59−1.472.560.398.613.17
RB−6.15−2.461.840.549.685.02
Disclaimer/Publisher’s Note: The statements, opinions and data contained in all publications are solely those of the individual author(s) and contributor(s) and not of MDPI and/or the editor(s). MDPI and/or the editor(s) disclaim responsibility for any injury to people or property resulting from any ideas, methods, instructions or products referred to in the content.

