Article

The Analytical Application of Quenching Phenomena of CdTe Quantum Dot Nanoparticles

by
Petra Humajová
,
Patrik Baliak
,
Ivan Landry Yumdjo Youmbissi
,
Alžběta Jebavá
,
Lenka Řezáčová
and
Přemysl Lubal
*
Department of Chemistry, Faculty of Science, Masaryk University, Kamenice 5, 625 00 Brno, Czech Republic
*
Author to whom correspondence should be addressed.
Inorganics 2023, 11(9), 373; https://doi.org/10.3390/inorganics11090373
Submission received: 7 August 2023 / Revised: 13 September 2023 / Accepted: 15 September 2023 / Published: 19 September 2023
(This article belongs to the Special Issue Colorimetric and Fluorescent Chemosensors for Metal Ions)

Abstract

:
This paper is devoted to the synthesis and application of CdTe quantum dot (QD) nanoparticles covered with organic ligands containing a thiol group, mostly mercaptopropionic acid (MPA) and glutathione (GSH). The simple one-step synthetic procedure was optimized to prepare greater quantities of nanoparticles for analytical purposes. The prepared CdTe QD nanoparticles were characterized by various analytical techniques, and their interaction with some metal ions (Cu(II), Pb(II), and Hg(II)) was studied by using luminescence spectroscopy in both steady-state and time-resolved modes. The mathematical analysis of the quenching effect of Cu(II) ions on the luminescence of CdTe QD nanoparticles shows that the static contribution is mostly responsible for the overall effect, but experimental conditions, such as pH, ionic strength, or the concentration of nanoparticles in aqueous solution, could also be important. The presence of metal ions in the form of a metal complex species could play an important role, and this phenomenon could be used to tune the selectivity of the quenching process. These findings have been utilized for the development of an analytical procedure for the detection and quantitative analysis of Cu(II) and Pb(II) ions in environmental water samples. In practice, this procedure could be easily implemented in a microplate format to increase throughput.

Graphical Abstract

1. Introduction

Recent nanotechnological methods enable the assembly and characterization of well-defined objects at the nanometer scale [1,2,3,4,5,6,7]. Quantum dot (QD) colloid particles of 1–10 nm in diameter are usually CdX compounds with low solubility (X = S, Se, and Te). Their solubility is increased by covering their surface with thiol-containing compounds and by increasing the solution pH, which leads to the dissociation of functional carboxylate and/or protonated amine groups [7,8,9,10,11,12,13]. Their exceptional physicochemical and optical properties can be tuned, and they also exhibit higher photostability compared to organic fluorophores [1,2,3,4,5,6,7]. Thus, they can be used in optoelectronics [9], for the development of new analytical methods, for the sensitive detection and determination of ions and molecules important in biology and medicine [7,8,14,15,16,17,18,19,20,21,22,23,24,25,26,27,28,29,30,31,32,33]. CdTe QD-based nanoparticles exhibit broad excitation and narrow emission bands where their position depends on their type, morphology, and size. Thus, the maximum wavelength of the emission band can be tuned by the synthetic process [7,8,10,11,12,13].
This paper deals with the synthesis and characterization of various CdTe QD nanoparticles covered with thiol-containing compounds (e.g., mercaptopropionic acid—MPA, dimercaptosuccinic acid—DMSA, glutathione, and 2-mercapto-ethanesulfonic acid—MESNA, see Tables S1 and S3). The physicochemical properties of these nanoparticles in the presence of several metal ions were studied spectroscopically, and some of them have been employed for analytical determination using luminescence spectroscopy. The analytical procedure was optimized for the given experimental conditions (e.g., pH, concentration of nanoparticles, and analyte) and was utilized for the determination of the Cu(II) and Pb(II) ions in water samples. The proposed method is simple and fast and thus can be employed in environmental analyses. Some preliminary results were published elsewhere [34].

2. Results

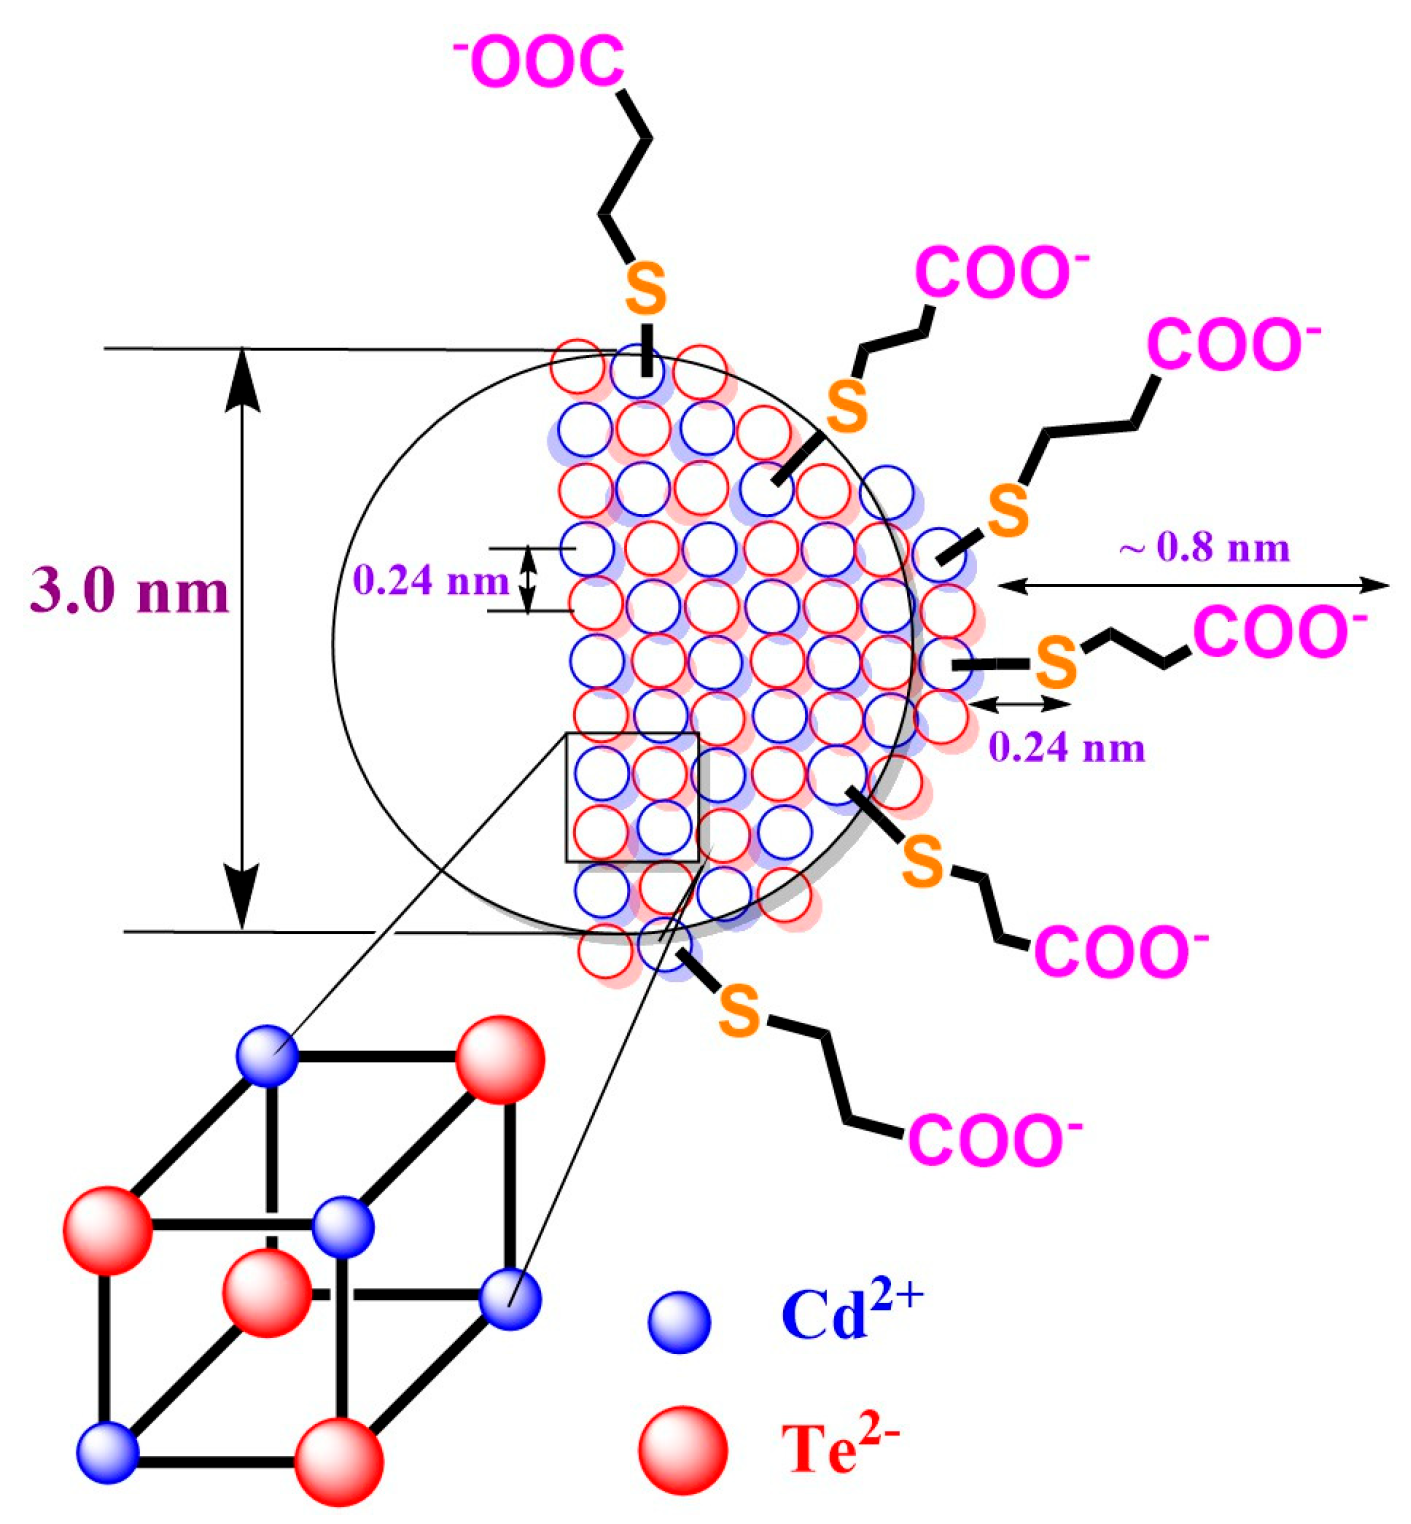
2.1. Synthesis and Characterization of CdTe QD Nanoparticles

CdTe QD nanoparticles can be synthesized by using several methods, each of which has some advantages and disadvantages. Common methods for the synthesis of QD nanoparticles [7,8,10,11,12,13] are ultrasonic irradiation, hydrothermal synthesis, and desolvation or by heating a mixture of precursors. Generally, the bottom-up approach is based on a one-step or two-step synthetic procedure (see Figure S1).
It is generally known [7,8,10,11,12,13] that a one-step synthesis is relatively easy and reproducible; however, worse control over the reaction experimental conditions leads to a greater distribution of the diameter of the nanoparticles. On the other hand, the two-step synthesis provides better control over the experimental conditions of the chemical processes resulting in more homogenous nanoparticles. However, this procedure is not always reproducible and reliable. Another advantage of the one-step synthesis is its relative robustness. While preparing reaction intermediates for the two-step synthesis is very sensitive to experimental conditions, the one-step synthesis has fewer limitations. In this work, both synthetic approaches were tested simultaneously with the characterization of the CdTe QD nanoparticles to decide which approach is more suitable for analytical applications, considering the time and reproducibility of synthesis, photostability, tuning spectral properties of CdTe QD nanoparticles, etc.
To test the suitability of a one-step or two-step synthetic approach, the CdTe QD nanoparticles covered with MPA (Figure 1) were chosen. These nanoparticles were characterized by using several techniques. The nanoparticles prepared by using both synthetic approaches were highly negatively charged (zeta potential −50 and −45 mV—see Table S2). The size distribution of the CdTe QD nanoparticles in aqueous solution was more monodisperse for the one-step procedure, with an average hydrodynamic diameter of about 3 nm. These results agree with the diameter of 1.6 ± 0.5 nm obtained by using AFM for nanoparticles in a solid state (Figure S6). The nanoparticles prepared by using the two-step procedure were more populated with a diameter of 12 ± 2 nm (main population), which is visible from the SAXS experimental data (Figures S4 and S5). On the contrary, the nanoparticles covered with GSH exhibited similar geometrical parameters when the prolongation of heating time leads to larger nanoparticles. The polydispersity of nanoparticles could also be caused by the changing of their shape from spherical particles to ellipsoid-like particles (see Figure 2).
This could explain why the dynamic light-scattering (DLS) experimental technique gives information about the polydispersity of the prepared nanoparticles in some cases. The most serious problem with the two-step approach is the preparation of sodium hydrogen telluride (see Figure S2), which does not have long-term stability and can decompose back into elemental tellurium. This can cause the synthesis of CdTe QD nanoparticles to fail; therefore, it is necessary to cool the mixture and immediately transfer it to the reaction flask containing Cd(II) salt and organic ligand with the thiol group. This aspect can be important when this procedure is scaled up; in this case, the problems could be overcome by utilizing the one-step approach.
The one-step approach brings many advantages in comparison to the two-step approach. Its robustness was verified for the given experimental conditions, e.g., temperature, amounts of reagents, sodium tellurite, organic ligand containing the thiol group, and reduction agent NaBH4, as well as differences in technique due to the involvement of different individuals in the synthesis. The same results were obtained using air or water baths. The use of a rotary vacuum evaporator to decrease the volume of the reaction mixture can reduce the amount of isopropanol applied for the purification of the CdTe QD nanoparticles. The nanoparticles covered with glutathione are stable up to 80 °C (see Figure S8), and, therefore, the nanoparticles can be dried at a temperature lower than 60 °C for long-term storage and applications for analysis. Although this has not yet been investigated for a period longer than 3–6 months, the product(s) may be able to be stored in the solid state for a long time without changes in their photophysical and chemical properties. Generally, this synthetic procedure gives about 200 mg/h (verified for 1–3 h of reflux time). To increase the quantity of nanoparticles for practical applications in analytical chemistry or to study their cytotoxicity [30,36], the rescaling of the synthetic procedure for high-throughput production on a larger scale is necessary. It was determined that a tenfold amount of input chemical compounds results in about 2.3 g, i.e., a tenfold higher yield. Thus, this synthetic procedure is reproducible and enables the production of a larger quantities of nanoparticles.
In the next step of our investigation, the photophysical properties of the CdTe QD nanoparticles were tuned according to experimental conditions because they depend on the type of organic ligands containing thiol groups (Figure S3, Tables S1–S3). As can be seen, two other organic ligands were used to cover the CdTe QD nanoparticles. The MESNA ligand was chosen because it contains a sulfonic functional group that is negatively charged and stable for a broad pH region. On the contrary, the CdTe QD nanoparticles covered with the MPA ligand are stable at pH > 6 (see Figure S7), while the same behavior was also observed for GSH-covered nanoparticles. It was suggested that DMSA would form more stable complexes with the Cd(II) ion on the surface of the nanoparticles due to the presence of two thiol vicinal groups. Comparing the photophysical properties of nanoparticles covered with both ligands (Figure S3 and Table S2), the DMSA nanoparticles with a 4 nm diameter are stable in an alkaline medium (ζ potential~−52 mV) and exhibit almost the same photophysical properties as nanoparticles covered with MPA and GSH (Figure S3). On the contrary, nanoparticles covered with MESNA are polydisperse, and their intensity is much lower, as observed for former nanoparticles. Because MPA and GSH are examples of organic ligands with the thiol group anchored to the CdTe QD nanoparticles (Figure 1), which have different sequestering abilities toward metal ions, these nanoparticles were chosen for the next study. Adopting the procedures described in the literature [37,38], the CdTe QD nanoparticles covered with GSH and differing in size could be separated by using polyacrylamide gel electrophoresis, PAGE (see Figure S19). These results agree with studies obtained by using capillary zone electrophoresis [39]. Thus, this PAGE experimental analytical technique could be suitable for the fast control of nanoparticle size during synthesis [37,38].
The luminescence emission spectra of the CdTe QD nanoparticles (see Figure S3) differ due to their size or organic ligands covering their surface, while the broad excitation spectra [40,41] with two peaks about 360 and 440 nm (Figure S3) are almost identical. Comparing the luminescence spectra of typical organic fluorophores with CdTe QD nanoparticles, the shape of the luminescence spectra is not dependent on the wavelength of the applied excitation source [38,39,40,41]. Thus, the luminescence spectra could be measured using different light sources, such as lasers or xenon lamps, for excitation, in both continuous and time-resolved modes to investigate their photophysical properties in detail.

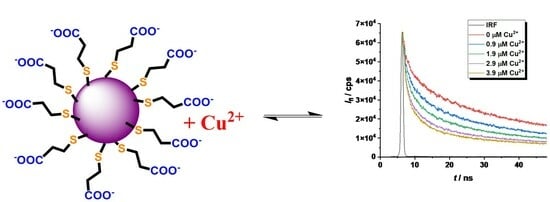
2.2. Study of the Quenching Phenomena of CdTe QD Nanoparticles

To tune the photophysical properties of CdTe QD nanoparticles covered with MPA, the duration of heating is a crucial parameter and thus was studied for the one-step synthetic procedure. The aqueous solutions of mixtures containing CdTe QD nanoparticles differ from a greenish color (30 min heating) to a reddish color (360 min heating) after illumination by using a UV lamp (see Figure S9). This is backed up by the luminescence spectra (see Figure S10), where the peak shifts from 560 to 600 nm, accompanied by increased intensity (Figure S10). This is also supported by the fact that the size of the CdTe nanoparticles increased to 16 nm. The luminescence decay of CdTe QD nanoparticles was decomposed into two exponentials. The first value differs according to nanoparticle size in the range of τ2 = 7–23 ns, while τ1~0.6 ns is almost constant. Because the nanoparticles became more polydisperse for heating times greater than three hours (see Figure S9), it was decided to continue the research concerning the quenching phenomena with nanoparticles prepared in three hours.
An important aspect of the practical analytical procedure is the dependence of luminescence intensity on the concentration of nanoparticles in aqueous solutions (see Figure 3). This concentration dependence is linear in a broad region of 0–100 mg·L−1, while a curvature is observed at concentrations higher than 100 mg·L−1 due to the self-quenching effect [34,42]. Thus, to evaluate the quenching effect of metal ions on CdTe QD nanoparticles (see Scheme 1), it was necessary to work at concentrations lower than 100 mg·L−1.
The quenching phenomena of Cu(II) ions on MPA-covered CdTe nanoparticles was investigated by using luminescence spectroscopy in both modes (see Figure 4). The decrease in luminescence intensity in the presence of Cu(II) ions is observed and can be explained by two mechanisms. Firstly, the luminescence enhancement or dynamic quenching mechanisms can be detected from the concentration dependence of luminescence decay, i.e., τ0/τ = f (cCu) (see slopes (−1.3 ± 0.1) × 105 M−1 and (7.5 ± 0.7) × 104 M−1 on the right side of Figure 4 for variables τ1 and τ2 obtained by deconvolution of luminescence decays). Secondly, the combined dynamic–static behavior (left side of Figure 4) can be observed from the Ifl,0/Ifl = f(cCu) dependence (see slope KD+S = (1.51 ± 0.01) × 106 M−1). The luminescence enhancement of CdTe QD nanoparticles (see Figure 4D with slope −1.3 × 10⁵ M−1) could be caused by direct collisional interaction of the Cu(II) ions with the surface of the nanoparticles when Cu(II) ions can likely incorporate into the CdTe cubic structure leading to large nanoparticles. Analogously, the metal-enhanced luminescence of organic fluorophores on nanocolloids was already described elsewhere [42]. The opposite effect of the same magnitude (KD~7.5 × 10⁴ M−1) could be explained by the collision of Cu(II) ions with the molecules of the covering ligands attached to the surface of the nanoparticles.
The combined dynamic–static quenching effect can be described by the equation [31,32,33,42,43]
I f l , 0 I f l = 1 + ( K D + K S ) × c C u + ( K D × K S ) × c C u 2
The value KD = (7.5 ± 0.7) × 104 M−1 representing the dynamic quenching behavior can be used to estimate KS = 1.30 × 10⁶ M−1 where the logarithmic value of about 6.1 is close to the stability constants for the CuL complex of dicarboxylic (log β~4.8–5.0—oxalic/malonic acid) or tricarboxylic acid (log β~5.9—citric acid) [44]. This supports the formation of chelate complexes of stoichiometry 1:1 where Cu(II) ions are bound by the carboxylate group of the covering ligand and the quenching process is caused by the stepwise formation of nonfluorescent cluster(s) (Scheme 1). The KD+S = KD + KS = (1.30 + 0.075) × 106 M−1~1.38 × 10⁶ M−1 is in good agreement with the experimental value (KD+S = (1.51 ± 0.01) × 106 M−1). It is interesting that the contribution of dynamic behavior is only 5.5% of the overall quenching effect. Thus, the Cu(II) ion-enhanced agglomeration of the CdTe QDs leads to nanoparticles of a larger radius and a gradual decrease in the luminescence analytical signal of the nanoparticles. In addition, the limit of detection (LOD) is about 10 nM as calculated from KD+S, while it is 100 times higher when calculated from KD. Thus, the Ifl,0/Ifl approach using KD+S for the analysis of a quenching agent is more sensitive than the time-resolved approach.
By fitting the curved (Ifl,0Ifl)/Ifl = f (cCu)) dependence with a second-order polynomial a × cCu + b × cCu2 (see Equation (1)), one can obtain both parameters (a = KD+S = KD + KS and b = KD × KS). The a and b parameters could be used for the calculation of both the KD and KS values as described elsewhere [42]. This approach does not require the measurement of the luminescence decay of nanoparticles in the absence and presence of Cu(II) metal ions in the solution as performed above. In our case, the b parameter (KD × KS = (9.8 ± 0.9) × 1010 M−2) could be estimated from the known KD and KS values. As can be seen (Figure 4C), this value is underestimated because both parameters differ by two orders of magnitude, while usually they are comparable [23,42]. In addition, the quenching ratio Ifl,0/Ifl > 10 (see Figure 4C) leads to less than 10% of the initial analytical signal, which is significantly loaded by instrumental noise from the experimental set-up, and therefore the reliable calculation of the KD × KS parameter is very sensitive to the instrumental input parameters. This effect could be demonstrated on the utilization of different values of KD × KS (0.98, 1.8, and 2.7 of 1011 M−2—see Figure 4C), which allow for the estimation of real error of about 30%. This aspect should also be considered when optimizing the analytical procedure for the determination of the Cu(II) ion concentration.
To tune the quenching process of Cu(II) ions on CdTe QD nanoparticles, the chemical state of the Cu(II) ion was changed to a metal complex species (see distribution diagram in Figure S11). At the micromolar scale, the Cu(II) ion forms stable complexes with picolinic acid; therefore, it was used to study the impact of Cu(II) speciation on the quenching behavior of CdTe QD nanoparticles (see Table 1 and Figure 5 and Figure S12). When the Cu(II) complexes were present in the solution, the quenching effect was increased (see increasing KD+S value), while the LOD also slightly increased. When the Cu(II) ion was fully complexed as the [Cu(Pic)2] species, the concentration region was enlarged. In the opposite case, when both the [Cu(Pic)]+ and [Cu(Pic)2] species were present in the solution, the dynamic effect was observed for a shorter concentration region (see Figure S12).
The analogous behavior was also observed for other metal ions (e.g., Hg(II) and Pb(II)—see Table 2 and Figures S14 and S16), while the KD+S values were lower than for the Cu(II) ion (1.01 ± 0.09 μM−1 for Hg(II) and 0.38 ± 0.06 μM−1 for Pb(II)) and linear up to 2 μM. The complexation of both metal ions with picolinic acid (see Figures S13 and S15) also had a different effect on the quenching phenomena. For the Cu(II) ion, the [Cu(Pic)2] species had a higher impact on the quenching of CdTe QD nanoparticle luminescence (see Table 1), while the presence of the [Hg(Pic)2] species in the solution had the opposite effect (see Table 2). On the contrary, the Pb(II) ion in the presence of picolinic acid as a sequestering agent did not have any quenching effect as the Pb(II) ion is almost free in the solution (Figure S15). Thus, the addition of a simple chelating ligand could be employed to change the selectivity of the quenching phenomena for different metal ions in a mixture. The different quenching effects of the Hg(II) and PhHg(I) ions on the luminescence of the CdSe QD nanoparticles were also observed and described elsewhere [28].
To investigate the quenching effect of a positively charged complex species on CdTe QD nanoparticles, a stock solution containing the [Cu(NH3)4]2+ species was prepared. Interestingly, in comparison to the [Cu(Pic)2] species, the quenching effect of these Cu(II)–ammonia complex species was less pronounced for the nanoparticles covered with MPA or GSH ligands (Figure 6), leading to lower KD+S values (see Table 3). This finding means that the charge of the metal ion complex species likely plays an important role in the quenching phenomena. This is a consequence of electrostatic coulombic effects of attraction and repulsion among the Cu(II) complex species and the molecules covering the CdTe QD nanoparticles (Figure 1). This fact should also be considered while optimizing the analytical procedure for the determination of the concentrations of some metal ions.
Another aspect that should also be considered is the adjustment of the instrumental parameters during the experimental set-up employed for the measurement of luminescence spectra. The wavelength of the excitation source is not important due to the broad excitation spectra. To eliminate the self-quenching phenomena of CdTe QD nanoparticles, a lower concentration is recommended. However, this leads to a lower analytical signal loaded by higher noise. This problem can be eliminated by utilizing a longer integration time, leading to a higher signal-to-noise ratio. This adjustment for the study of the quenching effect was also investigated for nanoparticles of different sizes (see Figure 7, Figures S17–S21, and Table 4). To compare the results for the input instrumental parameters and differing concentrations of the nanoparticles (10 vs. 100 mg·L−1), the spectra were acquired with comparable integration times (1.0 s vs. 0.1 s).
One can notice that the size of the nanoparticles is not so important for steady-state experimental data (Figure 7), while it is relevant for time-resolved experiments with smaller nanoparticles (Figure S21). On the contrary, the KD+S values are higher for more diluted solutions of nanoparticles acquired with longer integration times; however, the concentration range is smaller. Surprisingly, the longer integration time (10.0 s) for larger nanoparticles does not increase the quenching effect. Unfortunately, there are some experimental difficulties because the longer integration time for more concentrated solutions of nanoparticles leads to the saturation of the photodiode detector. Therefore, it is not possible to carry out measurements on a larger concentration scale. The LOD values are almost the same because the sensitivity changes little with different experimental parameters.

2.3. Analytical Applications of CdTe QDs

The results of the quenching effect described above could be employed for the determination of metal ions by measuring the luminescence intensity of CdTe QD nanoparticles. Because MPA-covered nanoparticles exhibit better photophysical properties as well as the quenching effect of Cu(II) ions, they were employed to develop the analytical procedure for water samples. The pH of 6.5 was chosen to be close to the pH of most water samples. As the intensity of luminescence at this pH is much lower than for a pH~8.0 in the presence and absence of Cu(II) ions, the concentration of the nanoparticles was increased (see Figure 4). The value of KD+S (~0.42 μM−1) for a pH~6.5 (distilled water—Figure 8 left) is much lower than value for a pH~8 (KD+S~1.38 μM−1—see Figure 5). On the contrary, the values (KD+S~1.28 μM−1 and KD+S~1.26 μM−1—see Figure 8) are higher than for distilled water and are almost the same for both water samples. The reason could be due to the higher ionic strength of the solution, because Brno tap water is hard (cCa~3.8 mM, determined by using chelatometric titration). The standard addition method should be employed for this analytical procedure to ensure the linearity of concentration dependence and eliminate matrix effect [45]. The same procedure was applied for the quantitative analysis of Pb(II) ions in the same water samples (see Figure S22).
The results of the luminescence analysis based on CdTe QD nanoparticles are given in Table 5. The same tap water samples were independently analyzed by using induced coupled plasma optical emission spectroscopy (ICP-OES). The statistical treatment of the results shows that there is no systematic error in the Pb(II) ion analysis and only a slight error for Cu(II) ions due to lower confidence intervals. The precision of the Cu(II) analysis is lower because of the LOD~10 nM (see Table 1) and due to the matrix effect. Because the concentration limits for drinking water in the Czech Republic are 1 ppm (Cu) and 0.01 ppm (Pb), this proposed analytical procedure could be used for fast control of the quality of water samples.

3. Discussion

CdTe QD nanoparticles of different sizes were successfully prepared by tuning the heating time of a mixture of Cd(II) salt and sodium tellurite (pH~8–9) under reducing conditions in the presence of NaBH4. In this one-step synthesis, the addition of thiol-containing organic ligands ensured the initial formation of nanoclusters, which were transformed into stable nanoparticles of different sizes and photophysical properties, mostly band maxima of luminescence spectra. This almost linear dependence for MPA- and GSH-covered nanoparticles (Figures S9 and S17) could be used to tune the peaks of emission spectra. It was demonstrated that this synthetic approach is robust and reproducible; therefore, it could also be applied for the large-scale preparation of CdTe QD nanoparticles for the detection of metal ions. The prepared CdTe QD nanoparticles were characterized by using several experimental techniques. Further, some less-common methods, e.g., SAXS, AFM, TG, and gel-electrophoresis, were utilized to give relevant information for the optimization of the synthetic procedure and the quality control of prepared nanoparticles. These methods can give additional details in comparison with well-known techniques (DLS and charge mobility measurement), and this in turn can be combined with published results [39,40,41].
The CdTe QD nanoparticles with various organic complexing agents anchored via an S donor atom (Figure 1 and Figure 2) can be considered “new” luminescence reagents for the fast detection and semiquantitative determination of metal ions in water samples. This procedure is based on the metal ion’s quenching effect where the static phenomenon is more significant than the dynamic one. It is interesting that a slight enhancement of the fluorescence analytical signal was observed for the low Cu(II) ion concentration. Cu(II) ions can likely incorporate into the CdTe face-centered cubic lattice (see Figure 1) because the ionic diameter of the Cu(II) ion (87 pm) is slightly smaller than the Cd(II) ion (109 pm) [35], leading to an increase in the size of the nanoparticles. Thus, the quenching process becomes more significant and could be tuned by the addition of sequestering agents that form metal complexes. In this step, the stoichiometry, charge, and stability of the complex species are crucial, as both the dynamic and static contributions of the quenching process are important. If the metal complex species has low stability or is not fully coordinated, the static character of the quenching process could dominate. In the opposite case, the dynamic character would be more important. Assuming that the number of thiol-containing molecules bound to a nanoparticle is at least 10–14 [39,40], these covering molecules could sufficiently bind metal ions, which would be driven by the sequestering properties of these ligands (compare a simple MPA ligand with the GSH tripeptide molecule). In addition, these CdTe QD nanoparticles exhibit a polyelectrolyte character at a higher solution pH; therefore, the luminescence intensity is influenced by the ionic strength of the solution caused by the presence of different inert salts. All these aspects should be considered for the development of an analytical procedure in practice. This approach was tested on the analysis of water samples of different origins, and the results were compared with values obtained by using ICP-OES. The results are in good agreement, and therefore this approach could be used for routine and fast analysis. A higher analytical throughput could be achieved by the utilization of a microplate reader used in a clinical analysis where special requirements are not necessarily due to the broad excitation spectra of CdTe QD nanoparticles.

4. Materials and Methods

4.1. Reagents for the Synthesis of CdTe QD Nanoparticles

Tellurium powder and sodium tetrahydroborate (Fluka, Switzerland), L-glutathion, sodium tellurate, sodium hydroxide, 2-propanol, sodium citrate, 2-mercapto-ethanesulfonic acid (Sigma Aldrich, St. Louis, MO, USA), cadmium chloride (Lachema, Brno, Czech Republic), 3-mercaptopropionic acid, and dimercaptosuccinic acid (Acros Organics, Geel, Belgium) were of analytical grade or of the highest purity available and were used as received. The list is given in Electronic Supplementary Informations (Table S1). Triple-distilled water was utilized for the preparation of all solutions and in all experiments.

4.2. Synthesis of CdTe QD Nanoparticles

Several types of CdTe QD nanoparticles were prepared, differing by the covering organic ligand with a thiol group (see Table S3). Synthetic procedures are briefly mentioned here, and the detailed experimental procedure is mentioned in Supplementary Material.
Firstly, a modified two-step synthesis was used for the preparation of some CdTe QDs [39,40,41]. In the first step, the NaHTe compound was prepared by a simple reaction of NaBH4 and Te in an aqueous solution. After a reaction time of two hours, the violet NaHTe compound (Figure S2) was transferred into a three-necked flask and mixed with an aqueous solution containing cadmium chloride and thiol-containing organic acid, e.g., 2-mercaptopropionic acid with a pH adjusted to 9.5. The solution was heated under reflux for four hours at temperature of 90 °C. The purification of CdTe QDs was performed by precipitation with isopropanol:water (1:1; v/v) and then separated by using centrifugation. The precipitate was dried at 60 °C.
Secondly, CdTe QDs were made by a modified one-step synthesis procedure [38,46,47]. Cadmium chloride was dissolved together with sodium citrate and thiol-containing organic acid, e.g., glutathione, in water. The pH of the solution was adjusted to 8–9, and sodium tellurate and sodium tetrahydroborate were added. The solution was heated under reflux for several hours at a temperature of 90–95 °C. The purification of CdTe QDs was performed analogously as in the previous case.

4.3. Characterization of CdTe QD Nanoparticles

The cadmium contents in both types of QDs and the concentrations of Cu(II) and Pb(II) in water samples were measured by using the iCAP 6500 Duo ICP-OES spectrometer (ThermoFisherScientific, Waltham, MA, USA). The Cd content was (23.19 ± 0.06)% m/m (MPA-modified nanoparticles) and (22.99 ± 0.05)% m/m (GSH-modified nanoparticles. DLS and zeta potential measurements were carried out on a Zetasizer Nano Malvern (Malvern, UK), AFM measurements on a JPK NanoWizard 3 microscope JPK (Bruker, Billerica, MA, USA), and SAXS measurements on a BioSAXS 1000 (Rigaku, Tokyo, Japan). The steady-state luminescence spectra were measured on a QuantaMaster 300 Plus spectrofluorimeter (PTI, Birmingham, AL, USA) with a Xe lamp or modular AVANTES system with diode-laser system as excitation sources, while time-resolved luminescence experiments were carried out on a SPC-130 EM spectrofluorimeter (Becker & Hickl, Berlin, Germany) with a laser excitation source. Experimental details are given in Supplementary Material.

5. Conclusions

In this paper, we show that the luminescence of CdTe nanoparticles can be quenched by different metal ions. This process can be separated into dynamic and static contributions, while the latter is usually more important. The quenching effect is dependent on the experimental conditions, which should be carefully adjusted for the desired analytical applications. Metal ion-enhanced aggregation phenomena (Scheme 1) strongly depend on the solution pH and concentration of nanoparticles. The change in analytical signal by metal ion quenching can be tuned by instrumental input parameters, such as the excitation/emission wavelength, power of excitation source, and integration time. Due to the colloidal character of the nanoparticles, the ionic strength of the solution is also important, while their size is not so crucial. In addition, metal ions can be complexed by simple organic ligands, and the stability as well as charge of the metal complex species has an impact on the luminescence quenching of nanoparticles. Thus, the selectivity of the analytical procedure can be tuned for the quantitative analysis of some metal ions. The concentration region will be important for the choice of CdTe QD nanoparticles, e.g., nanoparticles with MPA and GSH ligands for lower and higher Cu(II) ion concentrations, respectively.
A multicomponent analysis of the metal ions by CdTe QD nanoparticles is also possible [18] and is currently being investigated. The preparation of strip test papers based on the immobilization of CdTe QD nanoparticles with MPA- or GSH-covered ligands was not successful [48] because the paper could not be well impregnated with nanoparticles due to a “coffee-ring” effect likely caused by the differing hydrophobicity of the nanoparticles and cellulose. Dipping this strip paper into an aqueous solution of Cu(II) ions led to the quenching of the luminescent nanoparticles [48]. This was visible by using fluorescence microscopy, and some preliminary results have already been published elsewhere [48]. To improve the hydrophilicity of CdTe QD nanoparticles and their immobilization on strip paper, the preparation of silica-modified nanoparticles is recommended [29]. Using the luminescent nanocomposite LaF3:Ln3+/CdTe QD system [49], improvement in the chemosensor for detection of metal ions can also be achieved.

Supplementary Materials

The following supporting information can be downloaded at: https://www.mdpi.com/article/10.3390/inorganics11090373/s1. Table S1: The list of applied chemical compounds; Table S2: The characterization of prepared CdTe QD nanoparticles; Table S3: The chemical structural formulas of organic ligands covering CdTe QD nanoparticles; Figure S1: The description of one-step vs. two-step synthetic procedures; Figure S2: The first step of synthesis of NaHTe compound; Figure S3: The excitation and emission spectra of CdTe QD nanoparticles covered with GSH, MPA, DMSA, and MESNA organic ligands; Figure S4: Experimental data for SAXS analysis of CdTe QD nanoparticles; Figure S5: Models of average CdTe nanoparticles with different covering ligands; Figure S6: The AFM pictures for CdTe QD nanoparticles covered with MPA ligand; Figure S7: The pH dependence of size and charge of the CdTe QD nanoparticles covered with MPA; Figure S8: TG curve of CdTe nanoparticles covered with GSH ligand; Figure S9: The picture of samples of CdTe QD nanoparticles covered with MPA ligand; Figure S10: The emission spectra of CdTe QD nanoparticles covered with MPA ligand; Figure S11: The distribution diagram of Cu(II) ion in presence of picolinic acid; Figure S12: The quenching effect of CdTe QD nanoparticles in presence of [Cu(Pic)n]2−n species; Figure S13: The distribution diagram of Hg(II) ion in presence of picolinic acid; Figure S14: The quenching effect of CdTe QD nanoparticles in presence of [Hg(Pic)n]2−n species; Figure S15: The distribution diagram of Pb(II) ion in presence of picolinic acid; Figure S16: The quenching effect of CdTe QD nanoparticles in presence of [Pb(Pic)n]2−n species; Figure S17: The picture of samples of CdTe nanoparticles covered with GSH ligand; Figure S18: The photophysical properties of GSH-covered CdTe QD nanoparticles; Figure S19: The PAGE picture under UV light for GSH-covered CdTe QD nanoparticles; Figure S20: The quenching effect of Cu(II) ions on photophysical properties of GSH-covered CdTe QD nanoparticles of different sizes; Figure S21: The quenching effect of Cu(II) ions on photophysical properties of CdTe QD nanoparticles of different sizes; Figure S22: The example of analysis of real water samples with MPA-covered CdTe QD nanoparticles.

Author Contributions

Conceptualization, methodology, P.L.; data curation, formal analysis, investigation, validation, visualization, P.H., P.B., I.L.Y.Y., A.J. and L.Ř.; resources, P.L., P.H., P.B., I.L.Y.Y., A.J. and L.Ř.; writing—original draft preparation, review and editing, P.L.; supervision, project administration, funding acquisition, P.L. All authors have read and agreed to the published version of the manuscript.

Funding

This research was funded by the Ministry of Education, Youth and Sports of the Czech Republic (LTC20044) and NECTAR COST Action (European Union).

Data Availability Statement

Not applicable.

Acknowledgments

The authors thank Z. Moravec (MU) for the TG/DSC analysis, T. Klumpler (Single Crystal X-ray Diffraction Core Facility CEITEC MU) for the SAXS measurements, Z. Farka (MU) for the AFM experiments, and K. Novotný (MU) for the ICP analysis. We also would like to thank Stanislava Rybáková and Sofya Yakovenko (MU) for some preliminary experiments and Aleš Hrdlička (MU) for the analysis of water samples by using the ICP-OES method.

Conflicts of Interest

The authors declare no conflict of interest.

References

  1. Cademartiri, L.; Ozin, G.A. Concepts of Nanochemistry; WILEY-VCH: Weinheim, Germany, 2009; ISBN 978-3-527-32597-9. [Google Scholar]
  2. Merkoçi, A. (Ed.) Biosensing Using Nanomaterials; John Wiley & Sons: New York, NY, USA, 2009; ISBN 978-0-470-18309-0. [Google Scholar]
  3. Collins, A. Nanotechnology Cookbook: Practical, Reliable and Jargon-Free Experimental Procedures; Elsevier: Amsterdam, The Netherlands, 2012; ISBN 978-0-08-097172-8. [Google Scholar]
  4. Shabbir, H.; Csapó, E.; Wojnicki, M. Carbon Quantum Dots: The Role of Surface Functional Groups and Proposed Mechanisms for Metal Ion Sensing. Inorganics 2023, 11, 262. [Google Scholar] [CrossRef]
  5. Lesnyak, V.; Gaponik, N.; Eychmüller, A. Colloidal Semiconductor Nanocrystals: The Aqueous Approach. Chem. Soc. Rev. 2013, 42, 2905–2929. [Google Scholar] [CrossRef] [PubMed]
  6. Reiss, P.; Protière, M.; Li, L. Core/Shell Semiconductor Nanocrystals. Small 2009, 5, 154–168. [Google Scholar] [CrossRef] [PubMed]
  7. Ealias, A.M.; Saravanakumar, M.P. A Review on the Classification, Characterisation, Synthesis of Nanoparticles and Their Application. IOP Conf. Ser. Mater. Sci. Eng. 2017, 263, 032019. [Google Scholar] [CrossRef]
  8. Mohammadreza Alizadeh-Ghodsi, M.; Pourhassan-Moghaddam, M.; Zavari-Nematabad, A.; Walker, B.; Annabi, N.; Akbarzadeh, A. State-of-the-Art and Trends in Synthesis, Properties, and Application of Quantum Dots-Based Nanomaterials. Part. Part. Syst. Charact. 2019, 36, 1800302. [Google Scholar] [CrossRef]
  9. Litvin, A.P.; Martynenko, I.V.; Purcell-Milton, F.; Baranov, A.V.; Fedorov, A.V.; Gun’ko, Y.K. Colloidal Quantum Dots for Optoelectronics. J. Mater. Chem. A 2017, 26, 13252–13275. [Google Scholar] [CrossRef]
  10. Zhou, J.; Liu, Y.; Tang, J.; Tang, W. Surface Ligands Engineering of Semiconductor Quantum Dots for Chemosensory and Biological Applications. Mater. Today 2017, 20, 360–376. [Google Scholar] [CrossRef]
  11. Farkhani, S.M.; Valizadeh, A. Review: Three Synthesis Methods of CdX (X = Se, S or Te) Quantum Dots. IET Nanobiotechnol. 2014, 8, 59–76. [Google Scholar] [CrossRef]
  12. Pu, Y.; Cai, F.; Wang, D.; Wang, J.-X.; Chen, J.-F. Colloidal Synthesis of Semiconductor Quantum Dots towards Large- Scale Production: A Review. Ind. Eng. Chem. Res. 2018, 57, 1790–1802. [Google Scholar] [CrossRef]
  13. Zhang, H.; Wang, D.; Yang, B.; Mohwald, H. Manipulation of Aqueous Growth of CdTe Nanocrystals to Fabricate Colloidally Stable One-Dimensional Nanostructures. J. Am. Chem. Soc. 2006, 128, 31, 10171–10180. [Google Scholar] [CrossRef]
  14. Wang, X.-J.; Ruedas-Rama, M.J.; Hall, E.A.H. The emerging use of quantum dots in analysis. Anal. Lett. 2007, 40, 1497–1520. [Google Scholar] [CrossRef]
  15. Murphy, C.J. Optical Sensing with Quantum Dots. Anal. Chem. 2002, 74, 520A–526A. [Google Scholar] [CrossRef] [PubMed]
  16. Biranje, A.; Azmi, N.; Tiwari, A.; Chaskar, A. Quantum Dots Based Fluorescent Probe for the Selective Detection of Heavy Metal Ions. J. Fluoresc. 2021, 31, 1241–1250. [Google Scholar] [CrossRef] [PubMed]
  17. Bittar, D.B.; Ribeiro, D.S.M.; Pascoa, R.N.M.J.; Soares, J.X.; Rodrigues, S.S.M.; Castro, R.C.; Pezza, L.; Pezza, H.R.; Santos, J.L.M. Multiplexed analysis combining distinctly-sized CdTe-MPA quantum dots and chemometrics for multiple mutually interfering analyte determination. Talanta 2017, 174, 572–580. [Google Scholar] [CrossRef]
  18. Ribeiro, D.S.M.; Castro, R.C.; Pascoa, R.N.M.J.; Soares, J.X.; Rodrigues, S.S.M.; Santos, J.L.M. Tuning CdTe quantum dots reactivity for multipoint detection of mercury(II), silver(I) and copper(II). J. Lum. 2019, 207, 386–396. [Google Scholar] [CrossRef]
  19. Bo, C.; Ping, Z. A new determining method of copper(II) ions at ng ml–1 levels based on quenching of the water-soluble nanocrystals fluorescence. Anal. Bioanal. Chem. 2005, 381, 986–992. [Google Scholar] [CrossRef]
  20. Xia, Y.; Zhu, C. Aqueous synthesis of type-II core/shell CdTe/CdSe quantum dots for near-infrared fluorescent sensing of copper(II). Analyst 2008, 133, 928–932. [Google Scholar] [CrossRef]
  21. Ghosh, S.; Priyam, A.; Bhattacharya, S.C.; Saha, A. Mechanistic Aspects of Quantum Dot Based Probing of Cu (II) Ions: Role of Dendrimer in Sensor Efficiency. J. Fluoresc. 2009, 19, 723–731. [Google Scholar] [CrossRef]
  22. Liang, G.-X.; Liu, H.-Y.; Zhang, J.-R.; Jun-Jie Zhu, J.-J. Ultrasensitive Cu2+ sensing by near-infrared-emitting CdSeTe alloyed quantum dots. Talanta 2010, 80, 2172–2176. [Google Scholar] [CrossRef]
  23. Lima, A.S.; Rodrigues, S.S.M.; Korn, M.G.A.; Ribeiro, D.S.M.; Santos, J.L.M.; Teixeira, L.S.G. Determination of copper in biodiesel samples using CdTe-GSH quantum dots as photoluminescence probes. Microchem. J. 2014, 117, 144–148. [Google Scholar] [CrossRef]
  24. Hamideh Elmizadeh, H.; Soleimani, M.; Faridbod, F.; Bardajee, G.R. Ligand-Capped CdTe Quantum Dots as a Fluorescent Nanosensor for Detection of Copper Ions in Environmental Water Sample. J. Fluoresc. 2017, 27, 2323–2333. [Google Scholar] [CrossRef] [PubMed]
  25. Xiong, H.; Wang, B.; Wen, W.; Zhang, X.; Wang, S. Fluorometric determination of copper(II) by using 3-aminophenylboronic acid-functionalized CdTe quantum dot probes. Microchim. Acta 2019, 186, 392. [Google Scholar] [CrossRef] [PubMed]
  26. Wu, H.; Liang, J.; Han, H. A novel method for the determination of Pb2+ based on the quenching of the fluorescence of CdTe quantum dots. Microchim. Acta 2008, 161, 81–86. [Google Scholar] [CrossRef]
  27. Xia, Y.-S.; Zhu, C.-Q. Use of surface-modified CdTe quantum dots as fluorescent probes in sensing mercury (II). Talanta 2008, 75, 215–221. [Google Scholar] [CrossRef]
  28. Subramaniyan, S.B.; Veerappan, A. Water soluble cadmium selenide quantum dots for ultrasensitive detection of organic, inorganic and elemental mercury in biological fluids and live cells. RSC Adv. 2019, 9, 22274. [Google Scholar] [CrossRef]
  29. Han, J.; Liu, H.; Qi, J.; Xiang, J.; Fu, L.; Sun, X.; Wang, L.; Wang, X.; Li, B.; Chen, L. A Simple and Effective Visual Fluorescent Sensing Paper-Based Chip for the Ultrasensitive Detection of Mercury Ions in Environmental Water. Sensors 2023, 23, 3094. [Google Scholar] [CrossRef]
  30. Chinnathambi, S.; Shirahata, N. Recent advances on fluorescent biomarkers of near-infrared quantum dots for in vitro and in vivo imaging. Sci. Technol. Adv. Mater. 2019, 20, 337–355. [Google Scholar] [CrossRef]
  31. Sandeep, K.; Vaishanav, S.K.; Korram, J.; Nagwanshi, R.; Karbhal, I.; Dewangan, L.; Ghosh, K.K.; Satnami, M.L. Interaction of Folic Acid with Mn(II) Doped CdTe/ZnS Quantum Dots In Situ Detection of Folic Acid. J. Fluoresc. 2021, 31, 951–960. [Google Scholar] [CrossRef]
  32. Sławski, J.; Białek, R.; Burdziński, G.; Gibasiewicz, K.; Worch, R.; Grzyb, J. Competition between Photoinduced Electron Transfer and Resonance Energy Transfer in an Example of Substituted Cytochrome c–Quantum Dot Systems. J. Phys. Chem. B 2021, 125, 3307–3320. [Google Scholar] [CrossRef]
  33. Zhang, B.; Zou, P.; Li, J.; Lu, D.; Wang, X.-J.; Ma, L. Photoluminescent CdTe Quantum Dot-Polynitroxylated Albumin Composites for Glutathione Detection. ACS Appl. Nano Mater. 2022, 5, 4677–4687. [Google Scholar] [CrossRef]
  34. Řezáčová, L.; Rybáková, S.; Lubal, P. Quantum Dot-Based Fluorosensor for Determination of Cu(II) and Pb(II) Ions. In Proceedings of the 7th International Conference on Nanomaterials-Research & Application–NanoCon 2015, Brno, Czech Republic, 14–16 October 2015; pp. 650–654. [Google Scholar]
  35. Huhey, J.E.; Keiter, E.A.; Keiter, R.L. Inorganic Chemistry: Principles of Structure and Reactivity, 4th ed.; Harper Collins: New York, NY, USA, 1993. [Google Scholar]
  36. Modlitbová, P.; Novotný, K.; Pořízka, P.; Klus, J.; Lubal, P.; Zlámalová-Gargošová, H.; Kaiser, J. Comparative investigation of toxicity and bioaccumulation of Cd-based quantum dots and Cd salt in freshwater plant Lemna minor L. Ecotoxicol. Environ. Saf. 2018, 147, 334–341. [Google Scholar] [CrossRef] [PubMed]
  37. Hlaváček, A.; Skládal, P. Isotachophoretic purification of nanoparticles: Tuning optical properties of quantum dots. Electrophoresis 2012, 33, 1427–1430. [Google Scholar] [CrossRef]
  38. Křížková, S.; Dostálová, S.; Michálek, P.; Nejdl, L.; Komínková, M.; Milosavljevič, V.; Moulick, A.; Vaculovičová, M.; Kopel, P.; Adam, V.; et al. SDS-PAGE as a Tool for Hydrodynamic Diameter-Dependent Separation of Quantum Dots. Chromatografia 2015, 78, 785–793. [Google Scholar] [CrossRef]
  39. Voráčová, I.; Klepárník, K.; Lišková, M.; Foret, F. Determination of zeta-potential, charge, and number of organic ligands on the surface of water-soluble quantum dots by capillary electrophoresis. Electrophoresis 2015, 36, 867–874. [Google Scholar] [CrossRef]
  40. Klepárník, K.; Voráčová, I.; Lišková, M.; Přikryl, J.; Hezinová, V.; Foret, F. Capillary electrophoresis immunoassays with conjugated quantum dots. Electrophoresis 2011, 32, 1217–1223. [Google Scholar] [CrossRef] [PubMed]
  41. Lišková, M.; Voráčová, I.; Klepárník, K.; Hezinová, V.; Přikryl, J.; Foret, F. Conjugation reactions in the preparations of quantum dot-based immunoluminescent probes for analysis of proteins by capillary electrophoresis. Anal. Bioanal. Chem. 2011, 400, 369–379. [Google Scholar] [CrossRef]
  42. Lakowicz, J.R. Principles of Fluorescence Spectroscopy, 3rd ed.; Springer: New York, NY, USA, 2006; ISBN 978-0-387-31278-1. [Google Scholar]
  43. Valeur, B.; Berberan-Santos, M.N. Molecular Fluorescence. Principles and Applications, 2nd ed.; Wiley-VCH: Weinheim, Germany, 2001; ISBN 3-527-29919-X. [Google Scholar]
  44. Kotrlý, S.; Šůcha, L. Handbook of Chemical Equilibria in Analytical Chemistry; Ellis Horwood: Chichester, UK, 1985; ISBN 0470274794. [Google Scholar]
  45. Christian, G.D. Analytical Chemistry; Wiley: New York, NY, USA, 2004; ISBN 978-0-471-21472-4. [Google Scholar]
  46. Duan, J.L.; Song, L.X.; Zhan, J.H. One-Pot Synthesis of Highly Luminescent CdTe Quantum Dots by Microwave Irradiation Reduction and Their Hg2+-Sensitive Properties. Nano Res. 2009, 2, 61–68. [Google Scholar] [CrossRef]
  47. Bao, H.F.; Wang, E.K.; Dong, S.J. One-pot synthesis of CdTe nanocrystals and shape control of luminescent CdTe-cystine nanocomposites. Small 2006, 2, 476–480. [Google Scholar] [CrossRef]
  48. Škarková, P.; Novotný, K.; Lubal, P.; Jebavá, A.; Pořízka, P.; Klus, J.; Farka, Z.; Hrdlička, A.; Kaiser, J. 2D distribution mapping of quantum dots injected onto filtration paper by laser-induced breakdown spectroscopy. Spectrochim. Acta B 2017, 131, 107–114. [Google Scholar] [CrossRef]
  49. Řezáčová, L.; Runowski, M.; Lubal, P.; Szyczewski, A.; Lis, S. Synthesis of highly luminescent nanocomposite LaF3:Ln3+/QD-CdTe system, exhibiting tunable red-to-green emission. Chem. Pap. 2019, 73, 2907–2911. [Google Scholar] [CrossRef]
Figure 1. The schematic simplified model of CdTe QD nanoparticles with MPA-covering ligand. The ionic diameters of 207 pm (Te2−) and 109 pm (Cd2+) were considered for coordination number 6 (see ref. [35]).
Inorganics 11 00373 g001
Figure 2. The models of average CdTe QD nanoparticles with different covering ligands prepared by using one-step synthesis (MPA: 180 min, left; GSH: 60 min, middle; and GSH: 180 min, right) obtained from the SAXS data analysis (see Figures S4 and S5).
Inorganics 11 00373 g002
Figure 3. The concentration dependence of the CdTe QD nanoparticles covered with MPA (λexc = 445 nm, λem = 580 nm, pH~8). The red line represents the calibration plot with a sensitivity of 0.209 ± 0.005 mg·L−1.
Inorganics 11 00373 g003
Scheme 1. The chemical reaction describing the formation of Cu(II) complexes with the organic ligands covering the CdTe QD nanoparticles, which leads to their agglomeration in form of nanoclusters and luminescence quenching of original CdTe QD nanoparticles.
Inorganics 11 00373 sch001
Figure 4. The steady-state spectra ((A), λexc = 445 nm) and luminescence decays ((B), λexc = 408 nm) of MPA-covered CdTe QD nanoparticles (c = 1 mg·L−1) in the presence of Cu(II) ions (pH~8). The quenching effect ((C,D), λem = 580 nm) was simulated using KD+S = 1.51 × 10⁶ M−1 (black solid line), KD = 7.5 × 10⁴ M−1 (τ2), KD = −1.3 × 10⁵ M−1 (τ1), and KS = 1.30 × 10⁶ M−1 (black dashed line). Other lines were fitted with KD+S = 1.51 × 10⁶ M−1 (fixed) and KD × KS = 9.8 × 10¹⁰ M−2 (red dashed line), KD × KS = 1.8 × 10¹¹ M−2 (green solid line), or KD × KS = 2.7 × 10¹⁰ M−2 (blue solid line).
Inorganics 11 00373 g004
Figure 5. The quenching effect of [Cu(Pic)2] complexes on the luminescence of MPA-covered CdTe QD nanoparticles (λexc/λem = 445/580 nm, c = 1 mg·L−1, and pH = 8).
Inorganics 11 00373 g005
Figure 6. The quenching effect of [Cu(S)4]2+ ions (S = H2O (black) and NH3, (red)) on the luminescence of CdTe QD nanoparticles (λexc = 297 nm, c = 50 mg·L−1, and pH = 8.6) covered with MPA (left, λem = 545 nm) or GSH (right, λem = 585 nm) ligands.
Inorganics 11 00373 g006
Figure 7. The quenching effect of Cu(II) ions (pH = 8) on the luminescence of GSH-covered CdTe QD nanoparticles (c = 10 or 100 mg·L−1, integration time 1.0 or 0.1 s, and λexc = 445 nm). The size of the nanoparticles differs due to the heating time: 60 min (A), 120 min (B), 180 min (C), and 240 min (D). The experimental data are given in Supplementary Material (see Figures S17–S21). The experimental points are fitted by parameters given in Table 3.
Inorganics 11 00373 g007aInorganics 11 00373 g007b
Figure 8. An example of the analysis of real water samples with MPA-covered CdTe QD nanoparticles (c = 1.3 mg·mL−1, pH = 6.5, and λexc/λem = 405/540 nm). Samples: distilled water (left), Brno tap water (black), and Svratka River water (red) (right). The values for the Svratka River samples (Brno dam) were subtracted by a value of 1 for the sake of clarity.
Inorganics 11 00373 g008
Table 1. The parameters describing the quenching of MPA-covered CdTe QD a nanoparticles by Cu(II) ions. The experimental data are given in Figure 4 and Figure 5 and Figure S12.
Ratio Pic/Cu2+KD+S/μM−1 bLOD/nM
01.51 ± 0.0111
15.3 ± 0.440
34.7 ± 0.229
54.3 ± 0.198
a The nanoparticles (λem = 590 nm) were prepared by heating for 180 min (see Figure S10). b λexc = 445 nm (50 mW diode laser).
Table 2. The parameters describing the quenching of MPA-covered CdTe QD a nanoparticles by Pb(II) and Hg(II) ions. The experimental data are given in Figures S14 and S16.
Ratio Pic/M2+Hg(II)Pb(II)
KD+S/μM−1 b
01.01 ± 0.090.38 ± 0.06
10.58 ± 0.050.38 ± 0.04
30.43 ± 0.04-
50.37 ± 0.010.323 ± 0.003
a The nanoparticles (λem = 590 nm) were prepared by heating for 180 min (see Figure S10). b λexc = 445 nm (diode laser 50 mW).
Table 3. The parameters describing the quenching of CdTe QD nanoparticles by Cu(II) species. The nanoparticles are covered with MPA or GSH. The experimental data are given in Figure 6.
SpeciesMPAGSH
KD+S/μM−1 a
[Cu(H2O)4]2+0.41 ± 0.010.26 ± 0.01
[Cu(NH3)4]2+0.207 ± 0.0090.16 ± 0.02
a The nanoparticles (λem = 545/590 nm) were prepared by heating for 180 min, λexc = 297 nm (see Figures S10 and S17).
Table 4. The values of calculated parameters describing the quenching of GSH-covered CdTe QD nanoparticles by Cu(II) ions. The limit of detection (LOD) is 0.25–0.92 microM.
Heating Time/min
(λem/nm)
cQD/mg·L−1 a
10100
KD+S/μM−1
60 (543)2.18 ± 0.03 b0.72 ± 0.04 c
120 (547)2.0 ± 0.2 b0.87 ± 0.09 c
180 (552)1.6 ± 0.2 b0.42 ± 0.06 c
240 (562)1.8 ± 0.1 b0.46 ± 0.03 c
360 (577)5 ± 1 c
4.9 ± 0.6 b
2.8 ± 0.2 d
4.1 ± 0.3 c
2.3 ± 0.3 b
a The nanoparticles were prepared by heating for 60–360 min, λexc = 445 nm (laser 50 mW). b The integration time was 1.0 s. c The integration time was 0.1 s. d The integration time was 10.0 s.
Table 5. The results of the analysis of water samples based on metal ion quenching of MPA-covered CdTe QD nanoparticles (the experimental data—see Figure 8). Values based on luminescence analysis are average values from triplicates.
Metal
Ion
Tap WaterSvratka River Water
FluorosensorICP-OESFluorosensorICP-OES
Cu(II)47 ± 6 ppm
0.7 ± 0.1 μM
76.0 ppm
1.20 μM
51 ± 4 ppm
0.80 ± 0.06 μM
31.0 ppm
0.488 μM
Pb(II)58 ± 30 ppm
0.3 ± 0.1 μM
48.9 ppm
0.236 μM
80 ± 14 ppm
0.39 ± 0.07 μM
69.0 ppm
0.333 μM
Disclaimer/Publisher’s Note: The statements, opinions and data contained in all publications are solely those of the individual author(s) and contributor(s) and not of MDPI and/or the editor(s). MDPI and/or the editor(s) disclaim responsibility for any injury to people or property resulting from any ideas, methods, instructions or products referred to in the content.

