Article

Significantly Enhanced Self-Cleaning Capability in Anatase TiO2 for the Bleaching of Organic Dyes and Glazes

School of Materials Science and Engineering, Jingdezhen Ceramic University, Jingdezhen 333403, China
*
Authors to whom correspondence should be addressed.
Inorganics 2023, 11(8), 341; https://doi.org/10.3390/inorganics11080341
Submission received: 25 June 2023 / Revised: 15 August 2023 / Accepted: 15 August 2023 / Published: 18 August 2023
(This article belongs to the Special Issue New Advances into Nanostructured Oxides, 2nd Edition)

Abstract

:
In this study, the Mg2+-doped anatase TiO2 phase was synthesized via the solvothermal method by changing the ratio of deionized water and absolute ethanol Vwater/Vethanol). This enhances the bleaching efficiency under visible light. The crystal structure, morphology, and photocatalytic properties of Mg-doped TiO2 were characterized by X-ray diffraction, scanning electron microscopy, high-resolution transmission electron microscopy, N2 adsorption-desorption, UV-Vis spectroscopy analysis, etc. Results showed that the photocatalytic activity of the Mg2+-doped TiO2 sample was effectively improved, and the morphology, specific surface area, and porosity of TiO2 could be controlled by Vwater/Vethanol. Compared with the Mg-undoped TiO2 sample, Mg-doped TiO2 samples have higher photocatalytic properties due to pure anatase phase formation. The Mg-doped TiO2 sample was synthesized at Vwater/Vethanol of 12.5:2.5, which has the highest bleaching rate of 99.5% for the rhodamine B dye during 80 min under visible light. Adding Mg2+-doped TiO2 into the phase-separated glaze is an essential factor for enhancing the self-cleaning capability. The glaze samples fired at 1180 °C achieved a water contact angle of 5.623° at room temperature and had high stain resistance (the blot floats as a whole after meeting the water).

1. Introduction

With the deterioration of environmental pollution, low-consumption and high-efficiency pollution technologies have received more attention [1,2]. As the durative utilizes clean energy, solar energy has vast potential for exploitation and application. Titanium dioxide is an important photocatalyst that has been widely studied because of its high activity, non-toxic characteristics, environmental friendliness, and good chemical stability [3,4,5,6]. As the energy barrier of the metastable phase was less than that of the stability phase, it was more likely to excite electrons and holes for the metastable phase [7,8]. Hence, anatase TiO2 is considered to be the best photocatalyst of all of the structures of TiO2 [9,10]. It can fully effectively utilize UV light from sunlight [11,12,13]. Several factors affect anatase TiO2 photoactivity, such as crystal size, specific surface area, and crystallinity [14,15,16]. The performance of the TiO2 was optimized by doping [17,18,19,20], loading [21,22], and thin-film preparation [23,24]. Available studies indicated that some ions could enter the lattice as substitutional or interstitial; the titanium ions are substituted by metal ions in the crystal lattices. Some studies illustrate that rare-metal-ion-doped titania nanoparticles were prepared by the hydrothermal method, and their photocatalytic performance was greatly improved under UV irradiation [25,26]. At present, there exist a few studies concerning magnesium-ion-doped TiO2 obtained by the sol-gel reaction synthesis route and the solvothermal method [27,28], but its processing is complex and needs HF as a capping agent to form the anatase phase. It would therefore be interesting to investigate how a simple method can be used for preparing a glaze containing Mg(II)-doped anatase that is stable in a medium-/high-temperature (>1000 °C) ceramic glaze [29] and has self-cleaning properties, as anatase TiO2 has a nanometer size.
This study presents the simple synthetic procedure of producing Mg-doped TiO2 anatase samples without surfactants or templates and evaluates the influence of the structure and Vwater/Vethanol on their photocatalytic activity in decomposing rhodamine B (RhB). The self-cleaning activities of Mg-doped and undoped TiO2 anatase glaze samples are evaluated by comparing their anti-pollution ability.

2. Experimental Section

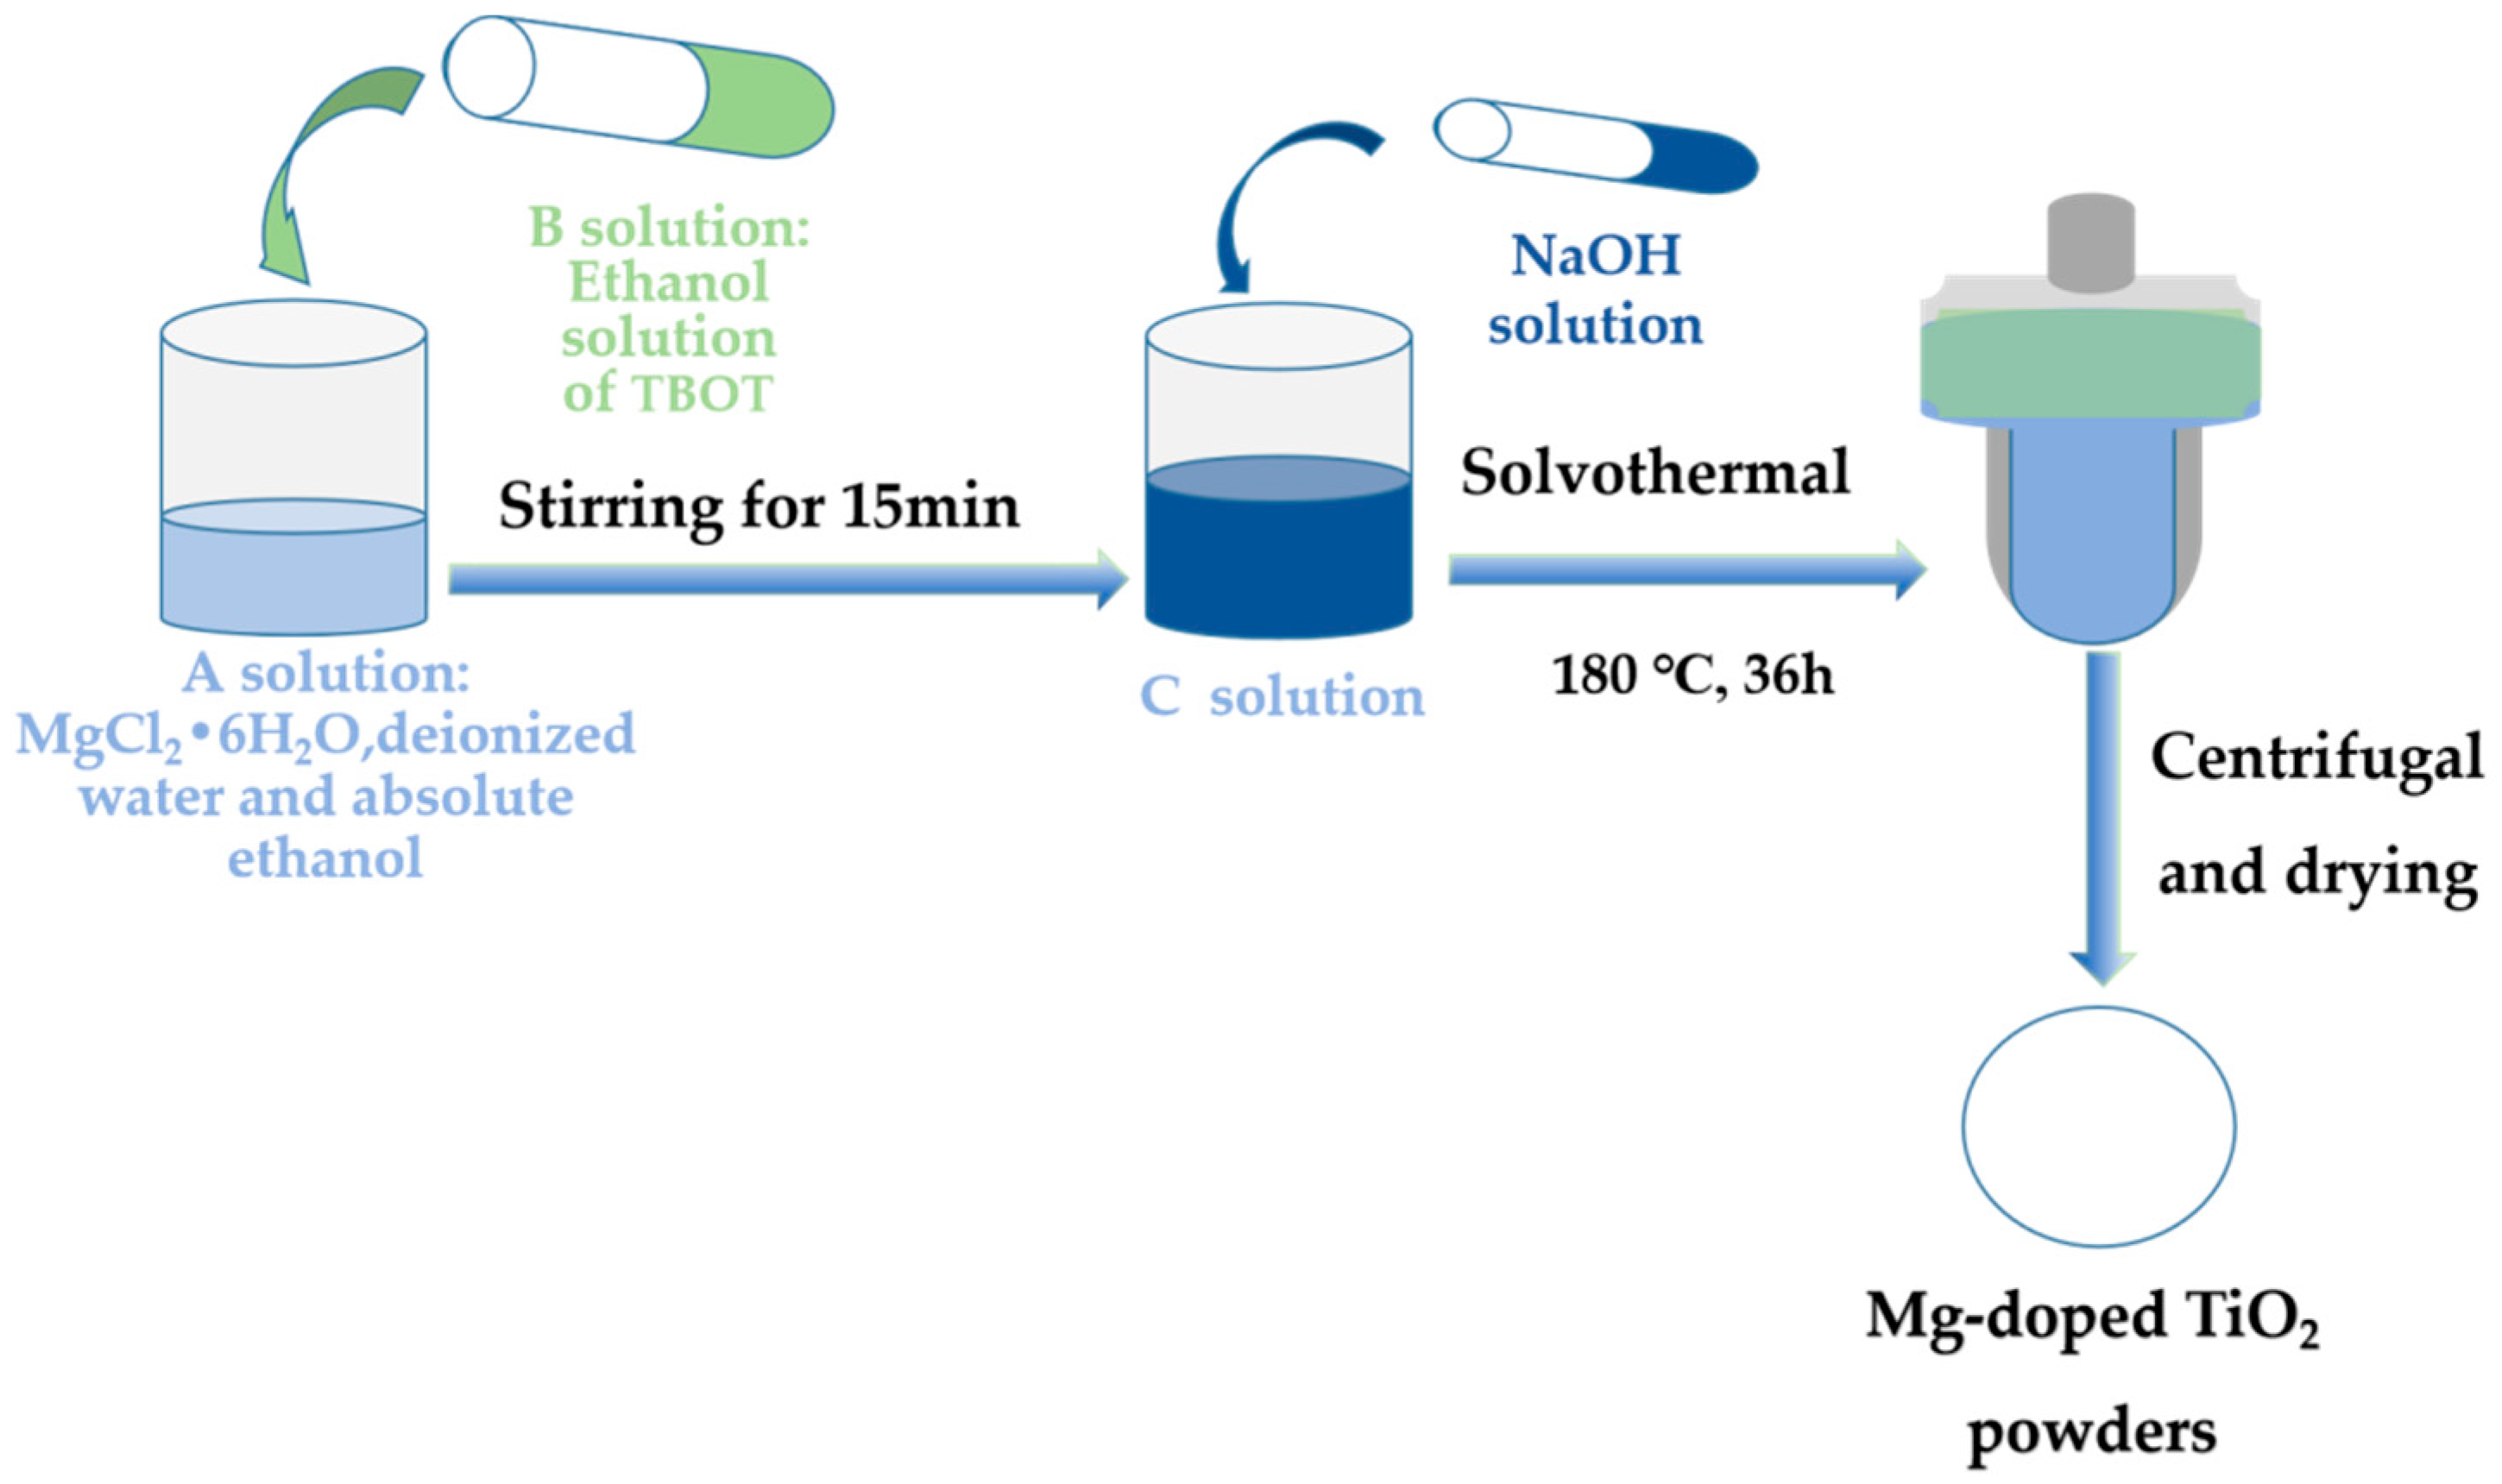
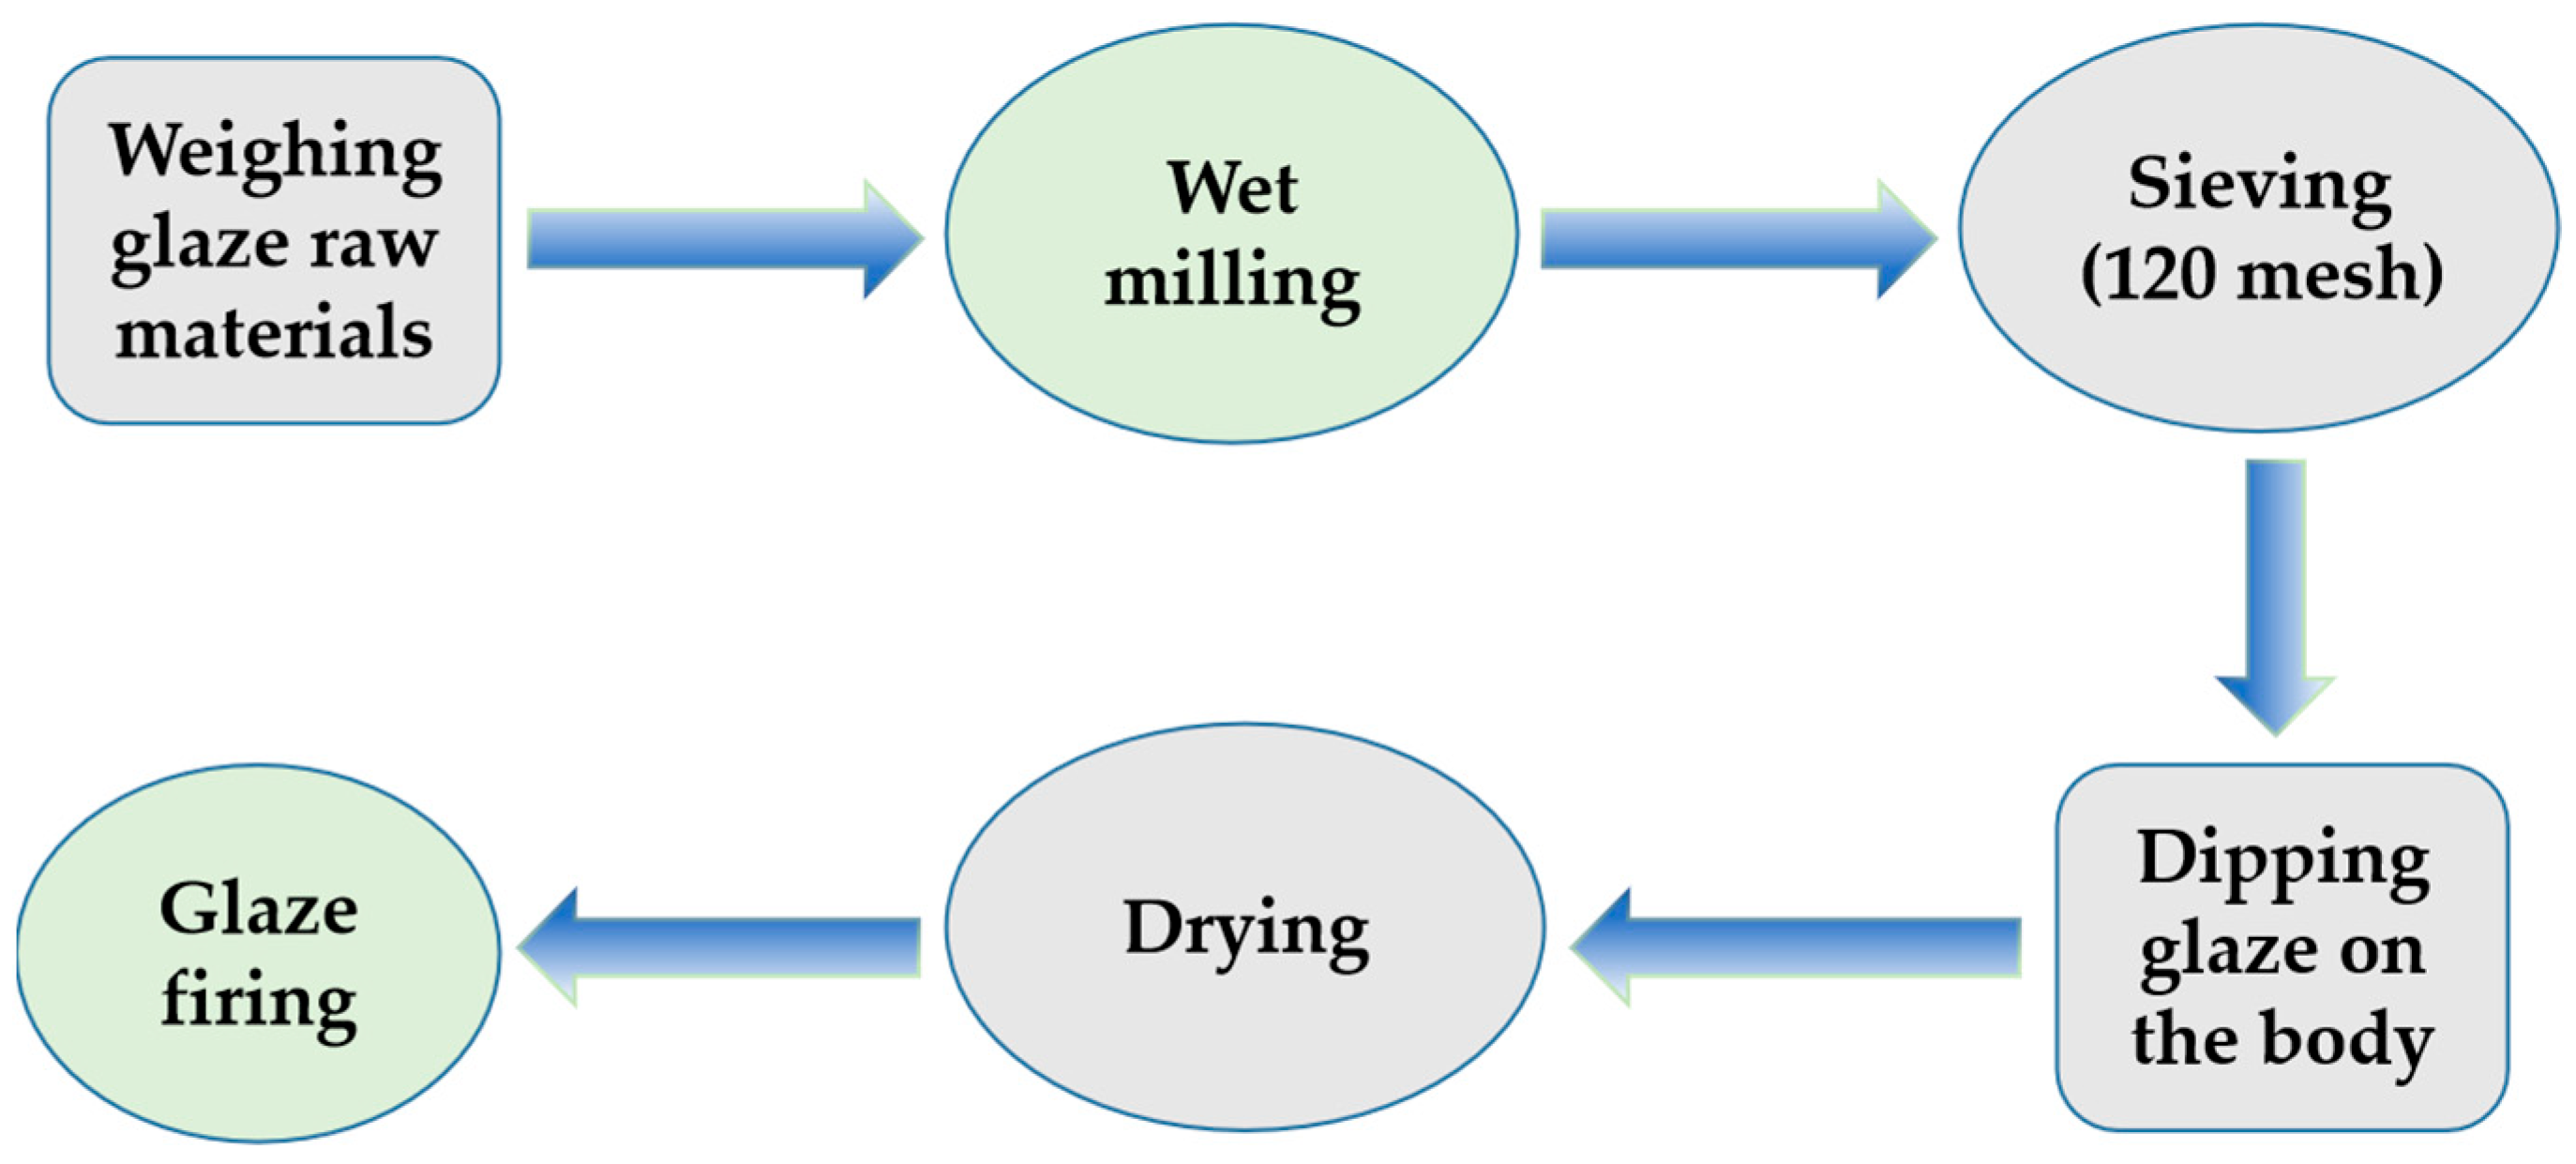
2.1. Preparation of the Samples

The samples, with various deionized water and absolute ethanol contents, were prepared from tetrabutyl titanate (TBOT), MgCl2•6H2O, and NaOH using the hydrothermal method. In a typical synthesis, firstly, solution A was made, which included MgCl2•6H2O, deionized water, and absolute ethanol. Subsequently, solution B was made, which included TOBT and ethanol. Finally, suspension C was prepared by dripping solution B into system A. The molar ratio of MgCl2•6H2O:TBOT:ethanol: water was 0.03:1:10:50. After 15 min, after adding suspension C into the reactor, it was heated at 180 °C for 36 h and then naturally cooled to room temperature. The final sample obtained was centrifuged and washed with deionized water and absolute ethanol. The photocatalytic properties of the samples were investigated by changing the molar ratio of water/ethanol (Vwater:Vethanol), keeping other experimental parameters unchanged. Figure 1 is the schematic diagram of Mg-doped TiO2 sample preparation.
The Mg-doped TiO2 in the glaze sample was fabricated by sintering at 1180~1200 °C using raw powders, i.e., 95% of the as-prepared Kaolin clay was subjected to phase separation melting at 1500 °C for 4 h and 5% by adding 5% Mg-doped TiO2 (Vwater/Vethnol of 12.5:2.5) photocatalysts, and the self-cleaning and hyper-hydrophilic properties of the fired glaze samples were characterized and tested, respectively. Figure 2 is the schematic diagram of the glaze firing processes.

2.2. Characterization of the Samples

The crystalline phase was identified by X-ray diffractometer (XRD, D8 Advance Bruker AXS, Germany) using Cu Kα radiation. Compared with the standard pattern in the XRD standard database, including JCPDS (i.e., PDF cards), the phase composition of the sample was analyzed using Jade 6.0 software. Photocatalyst morphology was investigated by scanning electron microscopy (SEM, JSM-6700F, Japan) using a device equipped with an EDS system operating at an accelerating voltage of 5.0 kV or 15 kV (15 kV for EDS). The crystal surface of nanocrystals was evaluated by high-resolution microscopy. The microstructures of the samples were studied by transmission electron microscopy (TEM, FEI Tecnai G2 F-30, Holland) and high-resolution transmission electron microscopy (HRTEM, FEI Tecnai G2 F-30, Holland) at accelerating voltages of 160 kV and 200 kV, respectively. The valence states of the samples were characterized by X-ray photoelectron spectroscopy (XPS, ESCALAB Xi+, United States) using Al Kα radiation. The specific surface areas were determined by the Brunauer–Emmett–Teller method, and the pore size was determined by the Barrett–Joyner–Hallenda method. Nitrogen adsorption-desorption isotherms were collected on a Micromeritics TriStar ii 3020 analyzer at 77 K. The analysis of samples by UV-Vis diffuse reflectance spectroscopy was carried out. The hydrophilicity of the samples was tested by a contact angle meter (JGW-360D, China).

2.3. Photocatalytic Activity of the Samples

The photocatalytic activity of the TiO2 was evaluated by bleaching the RhB with a concentration of 10−4 mol/L. The total volume of RhB was 50 mL, irradiated with 0.05 g of the photocatalyst and a 500 WXeon light with a cut-off filter of 420 nm. This was to prove that the RhB was exhibiting bleaching rather than adsorption after the dark experiment was carried out. Samples were taken out at 20 min intervals and analyzed with a spectrophotometer. The photocatalytic activity was characterized by the apparent first-order rate constant k, as in equation k = ln(A0/A), where A was the absorbance of RhB at 553 nm after bleaching and A0 was the absorbance of the initial RhB solution at 553 nm.

3. Results and Discussion

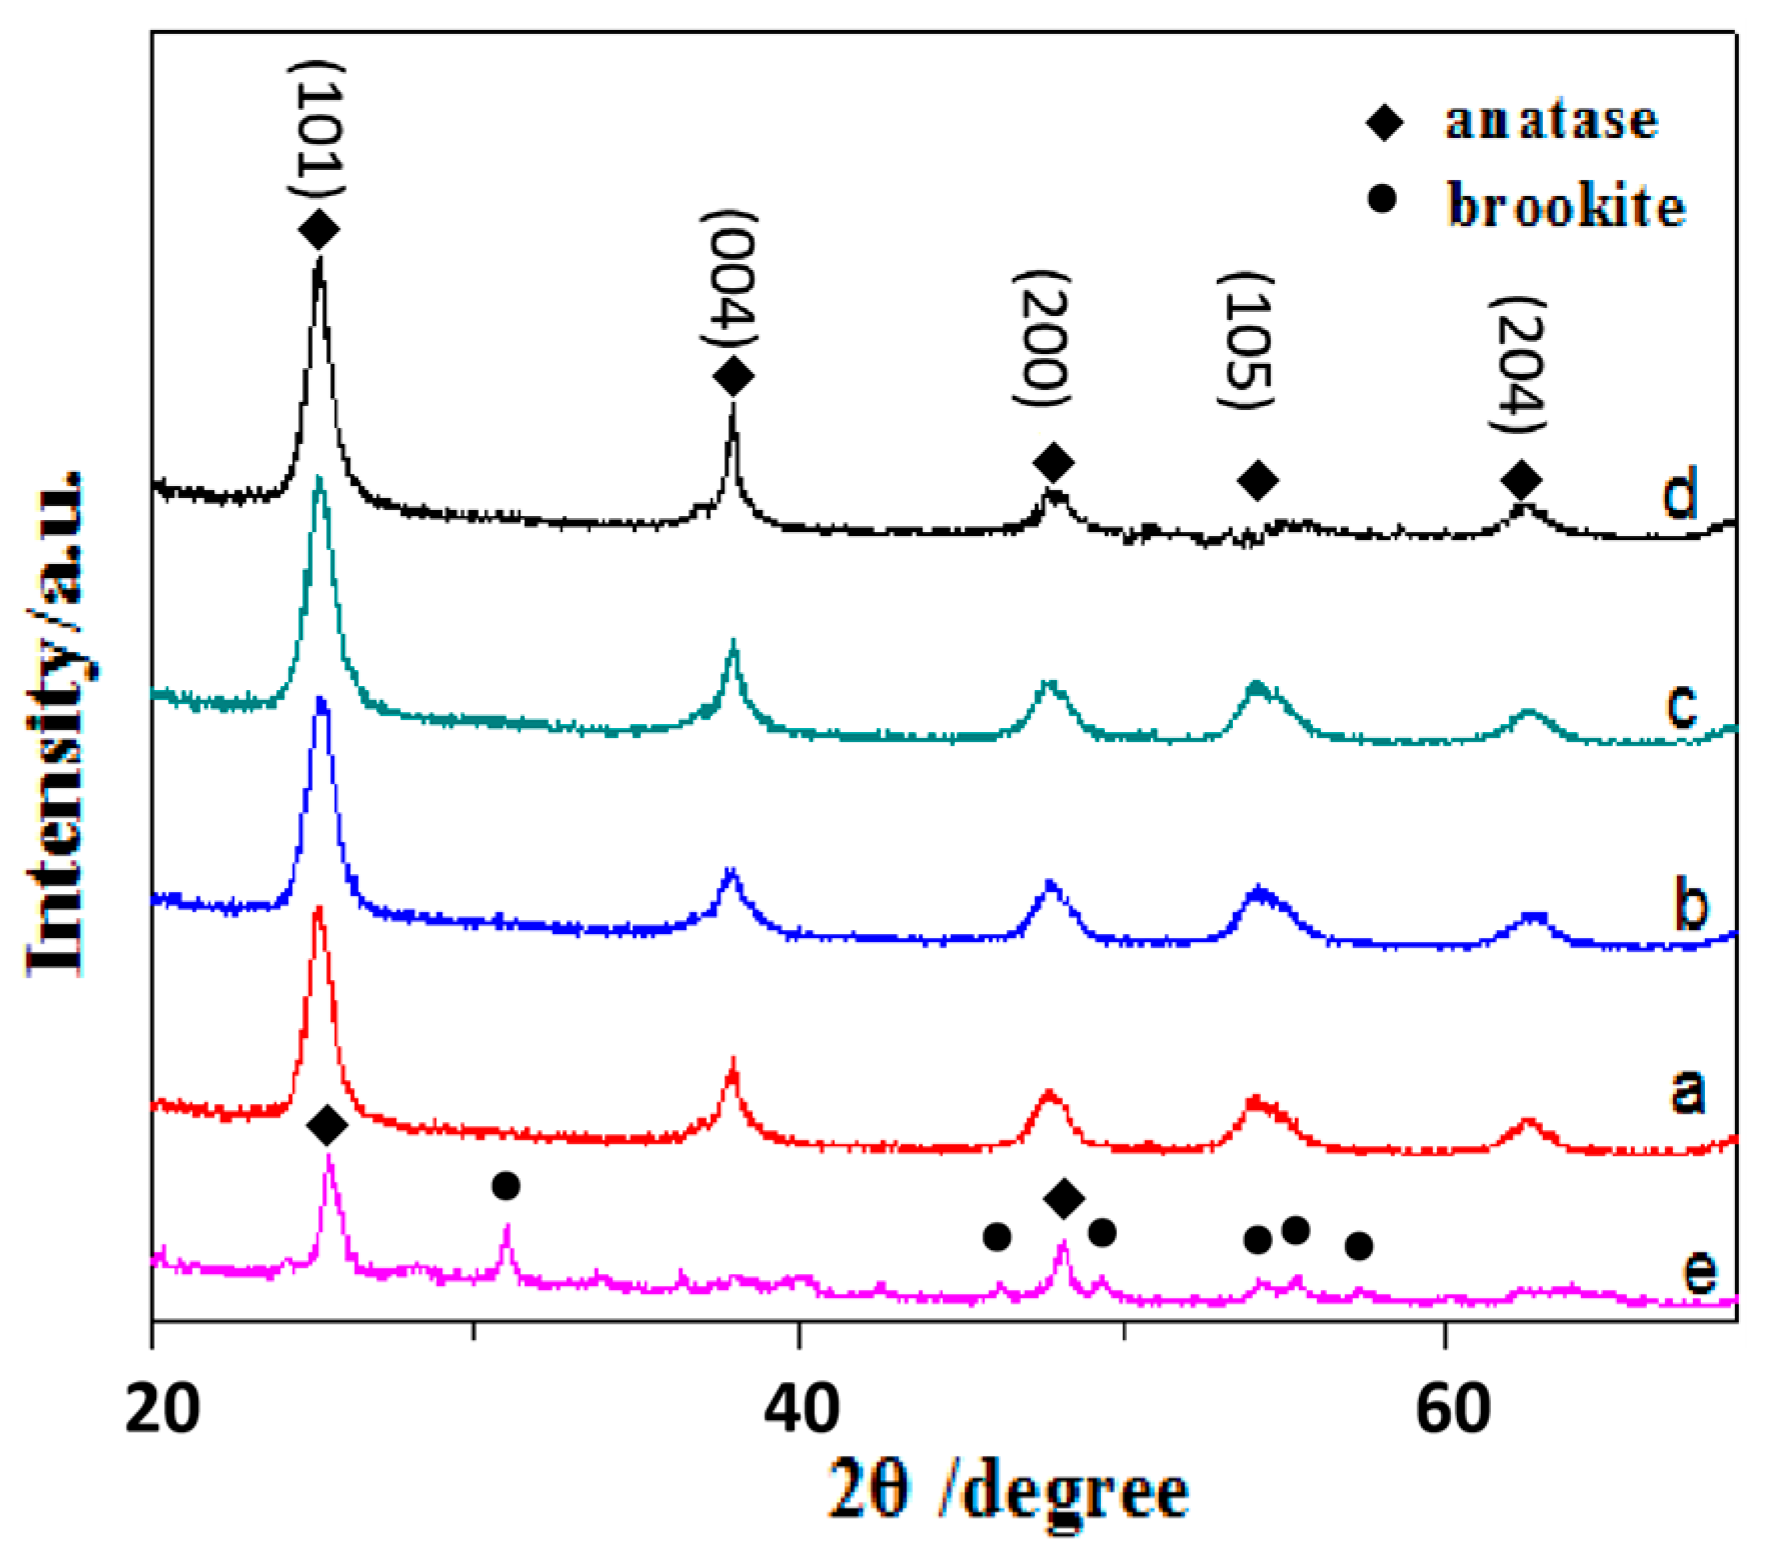
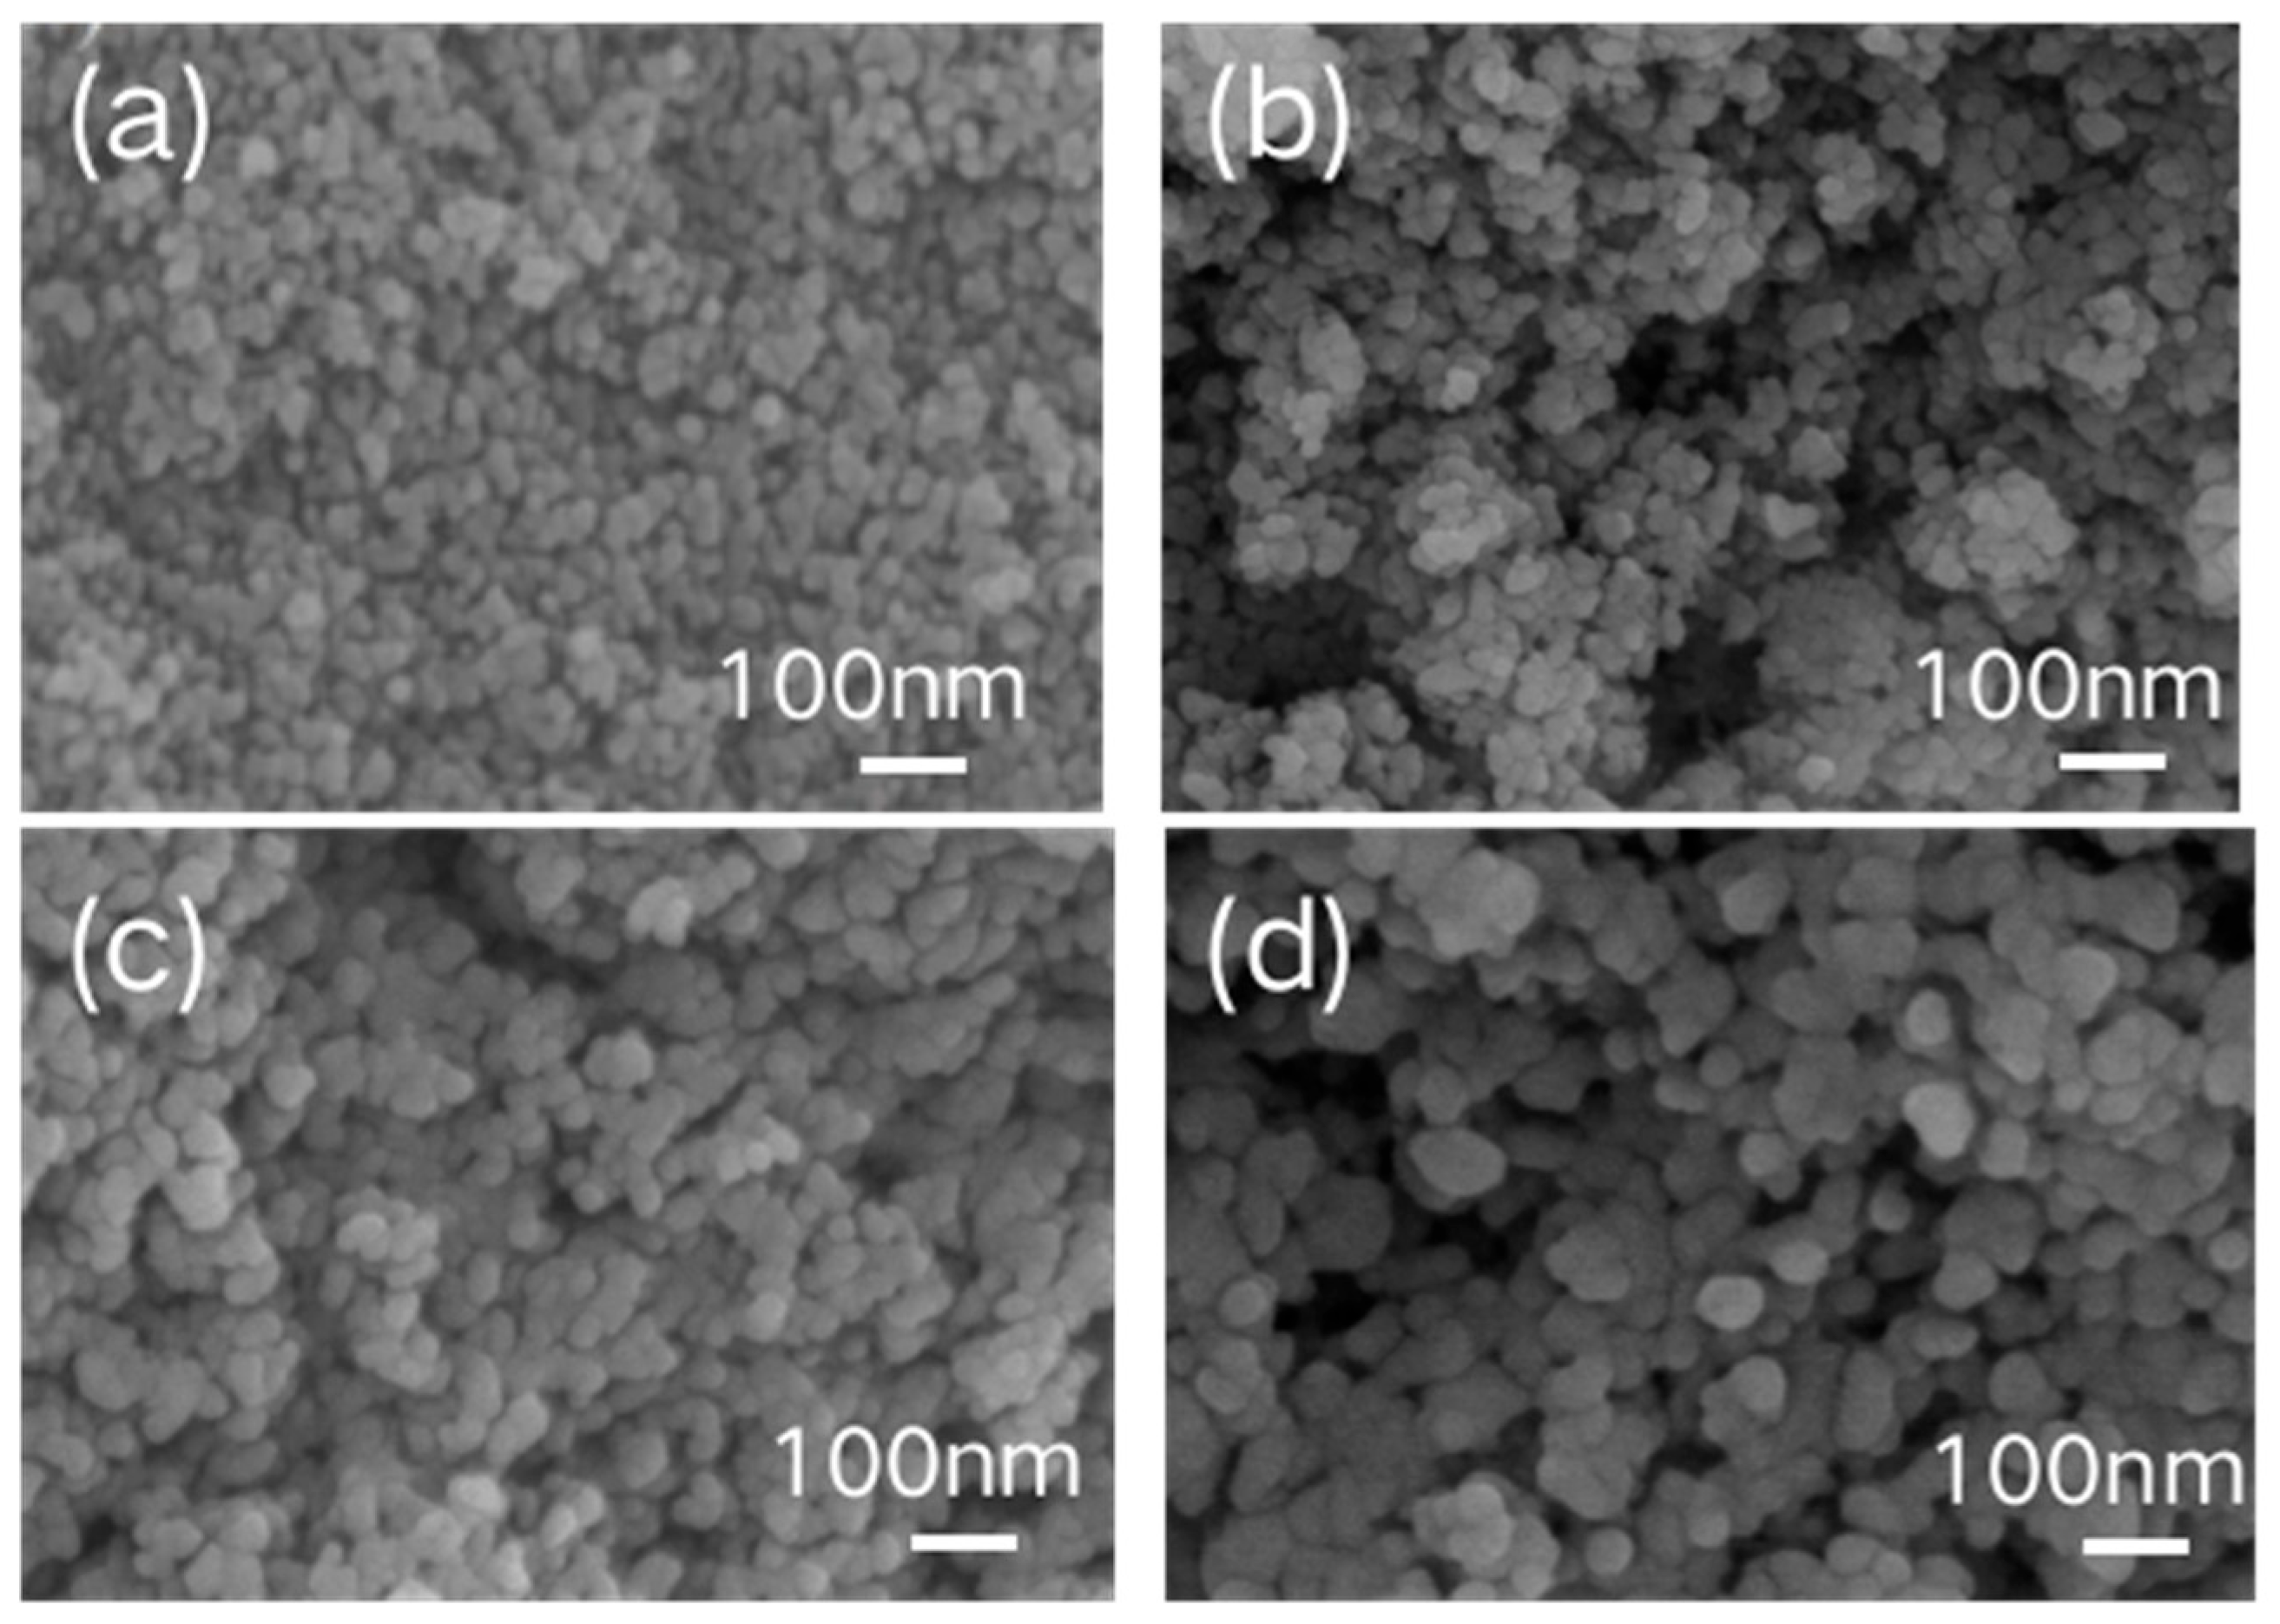
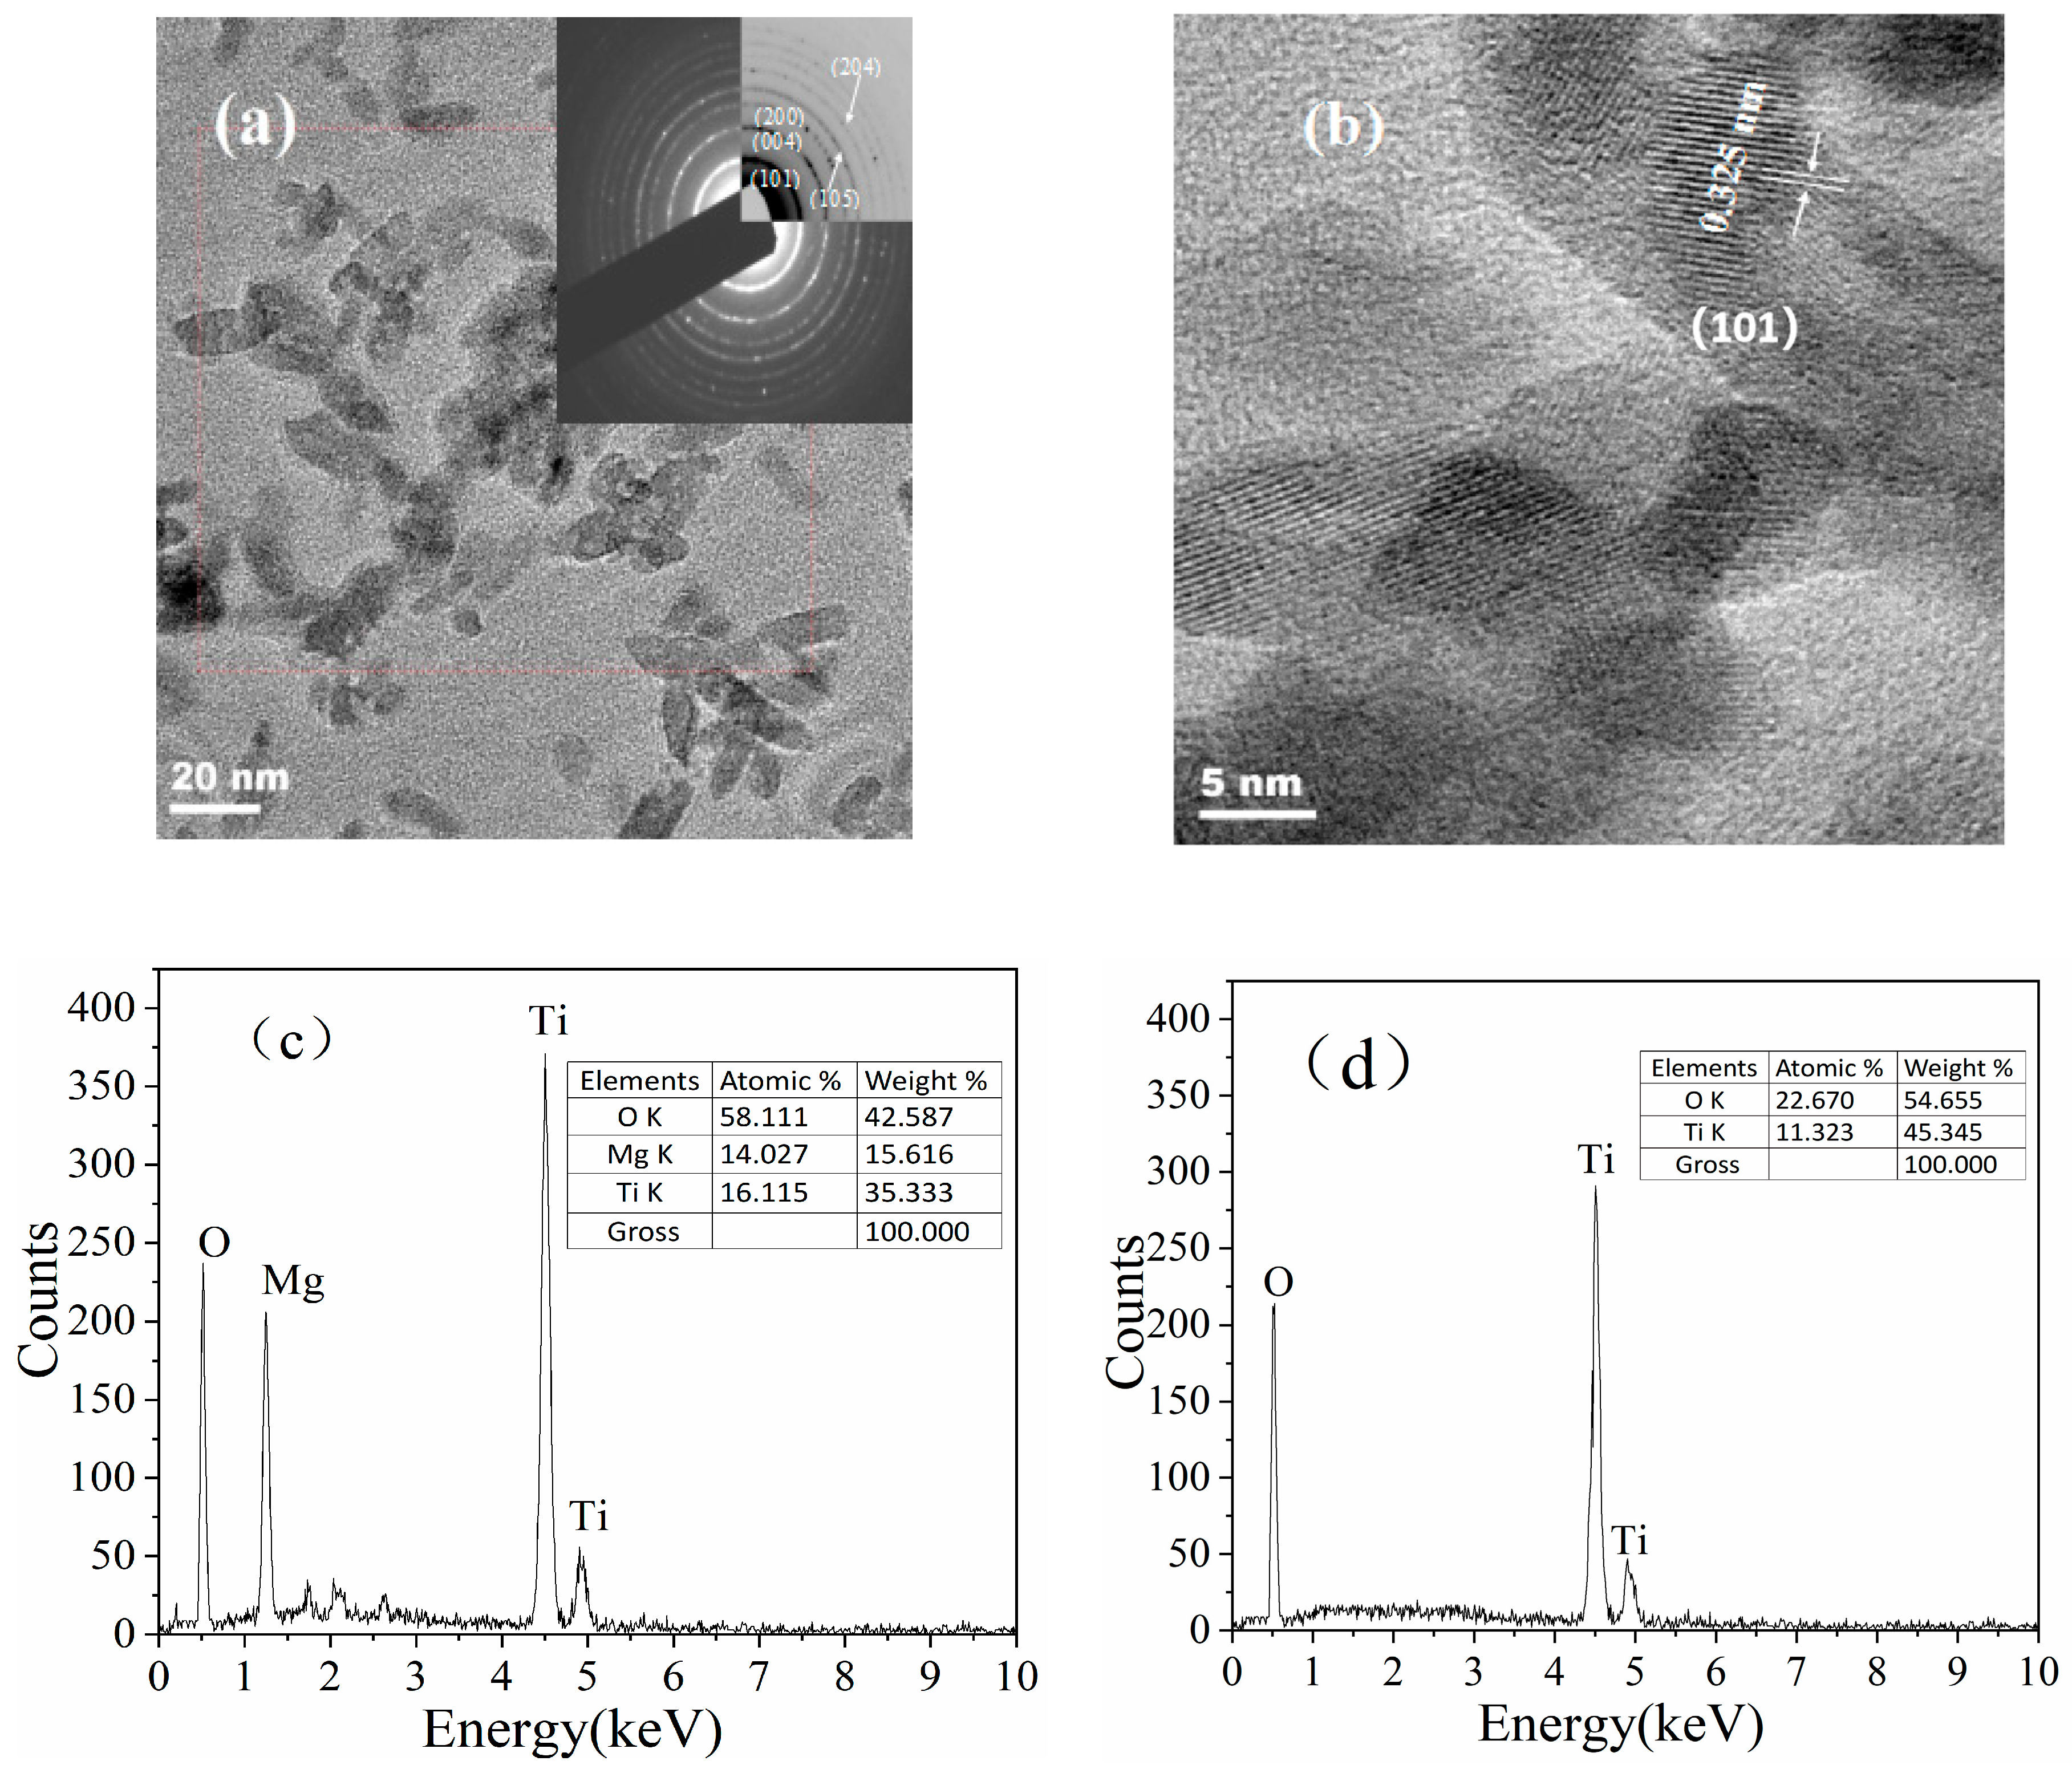
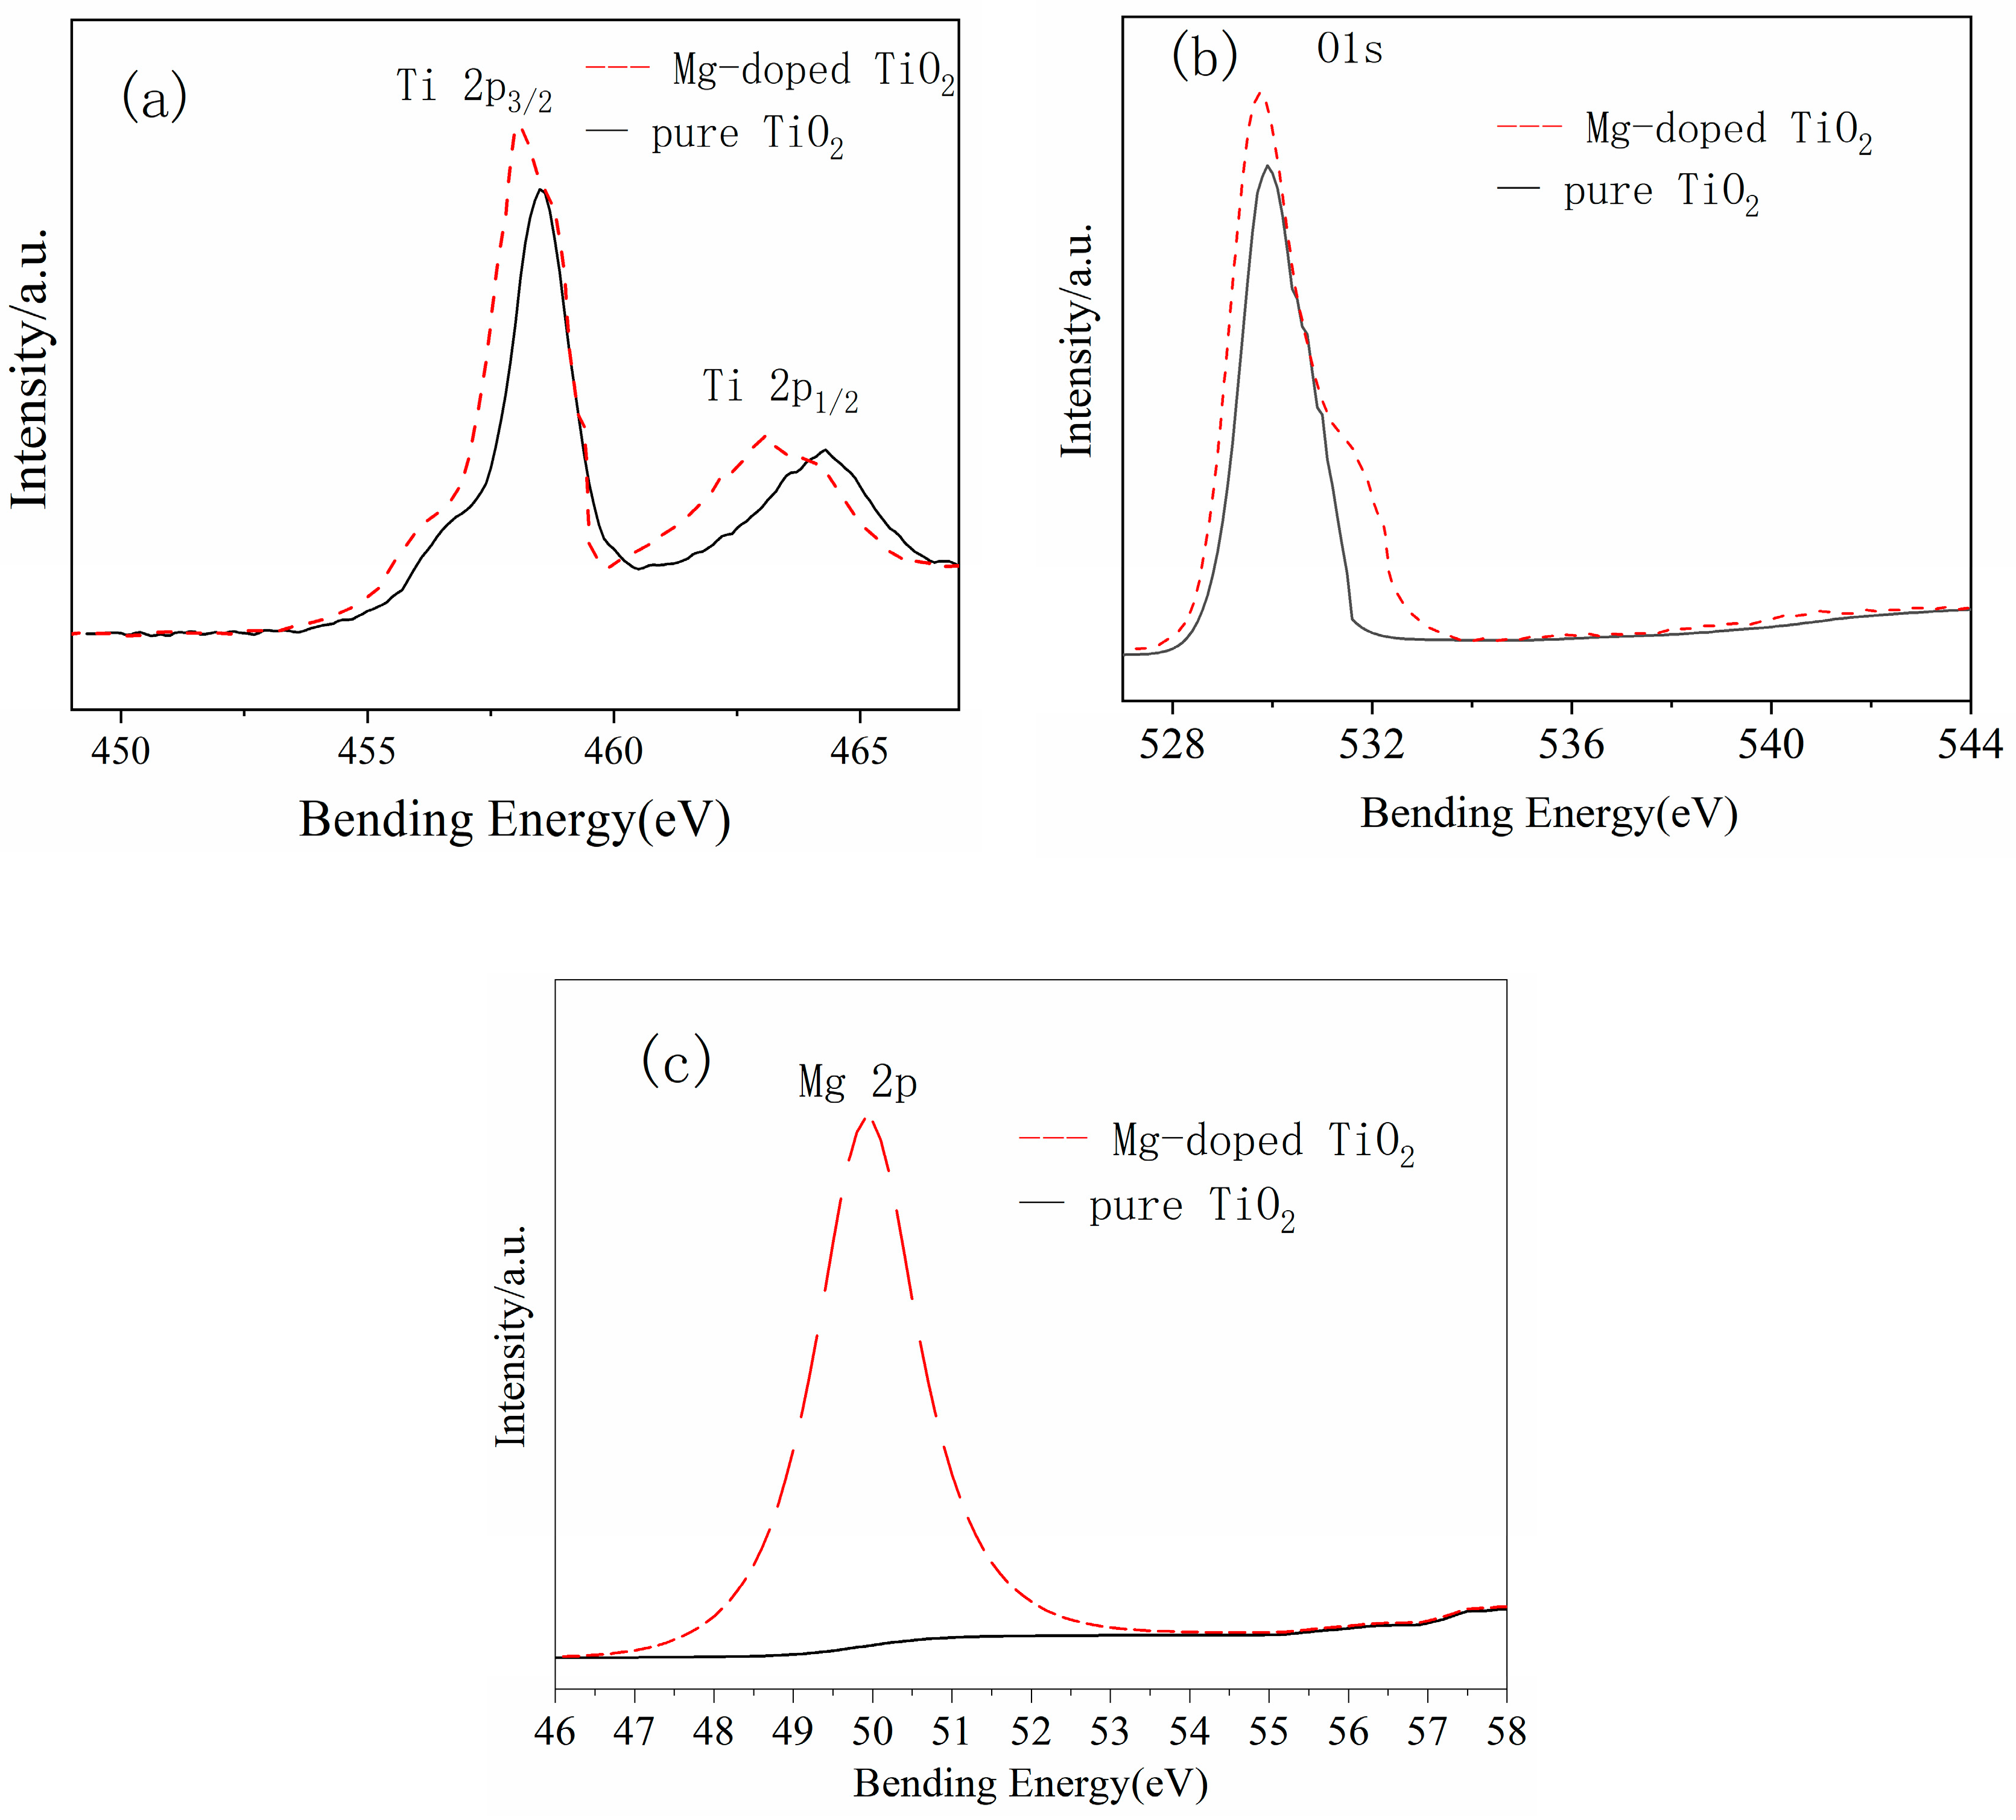
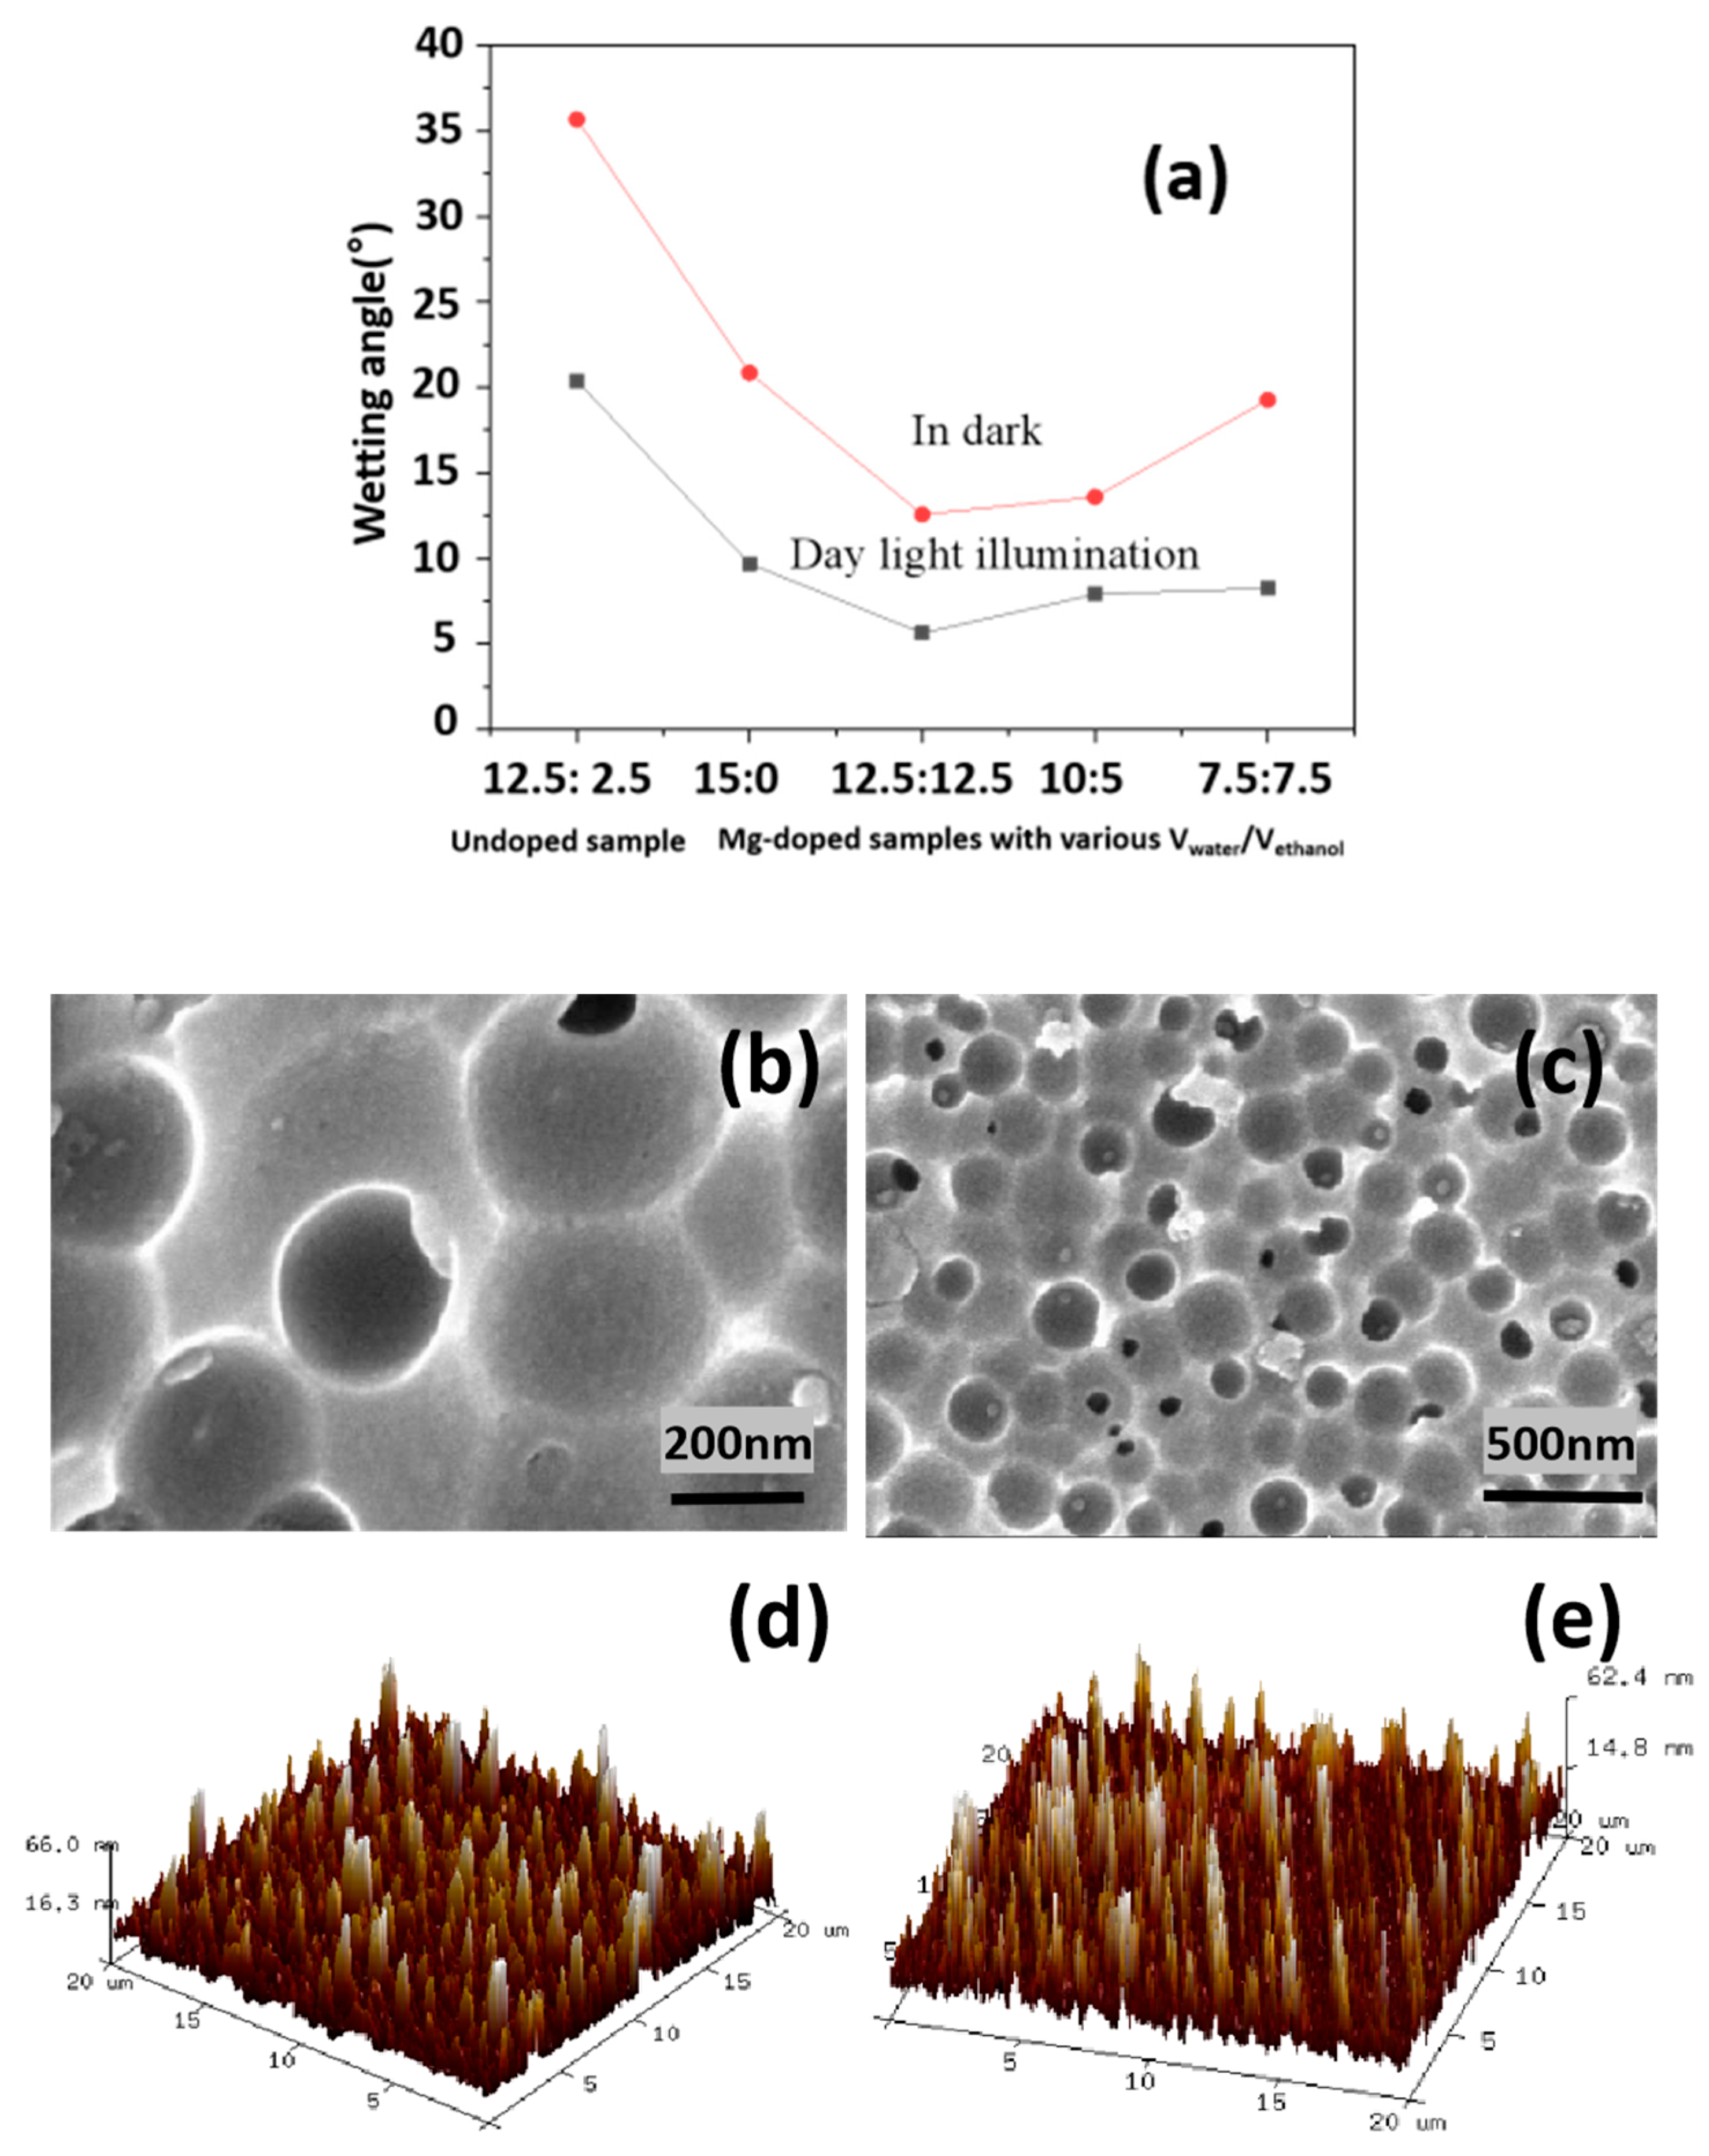
3.1. Structural and Morphology
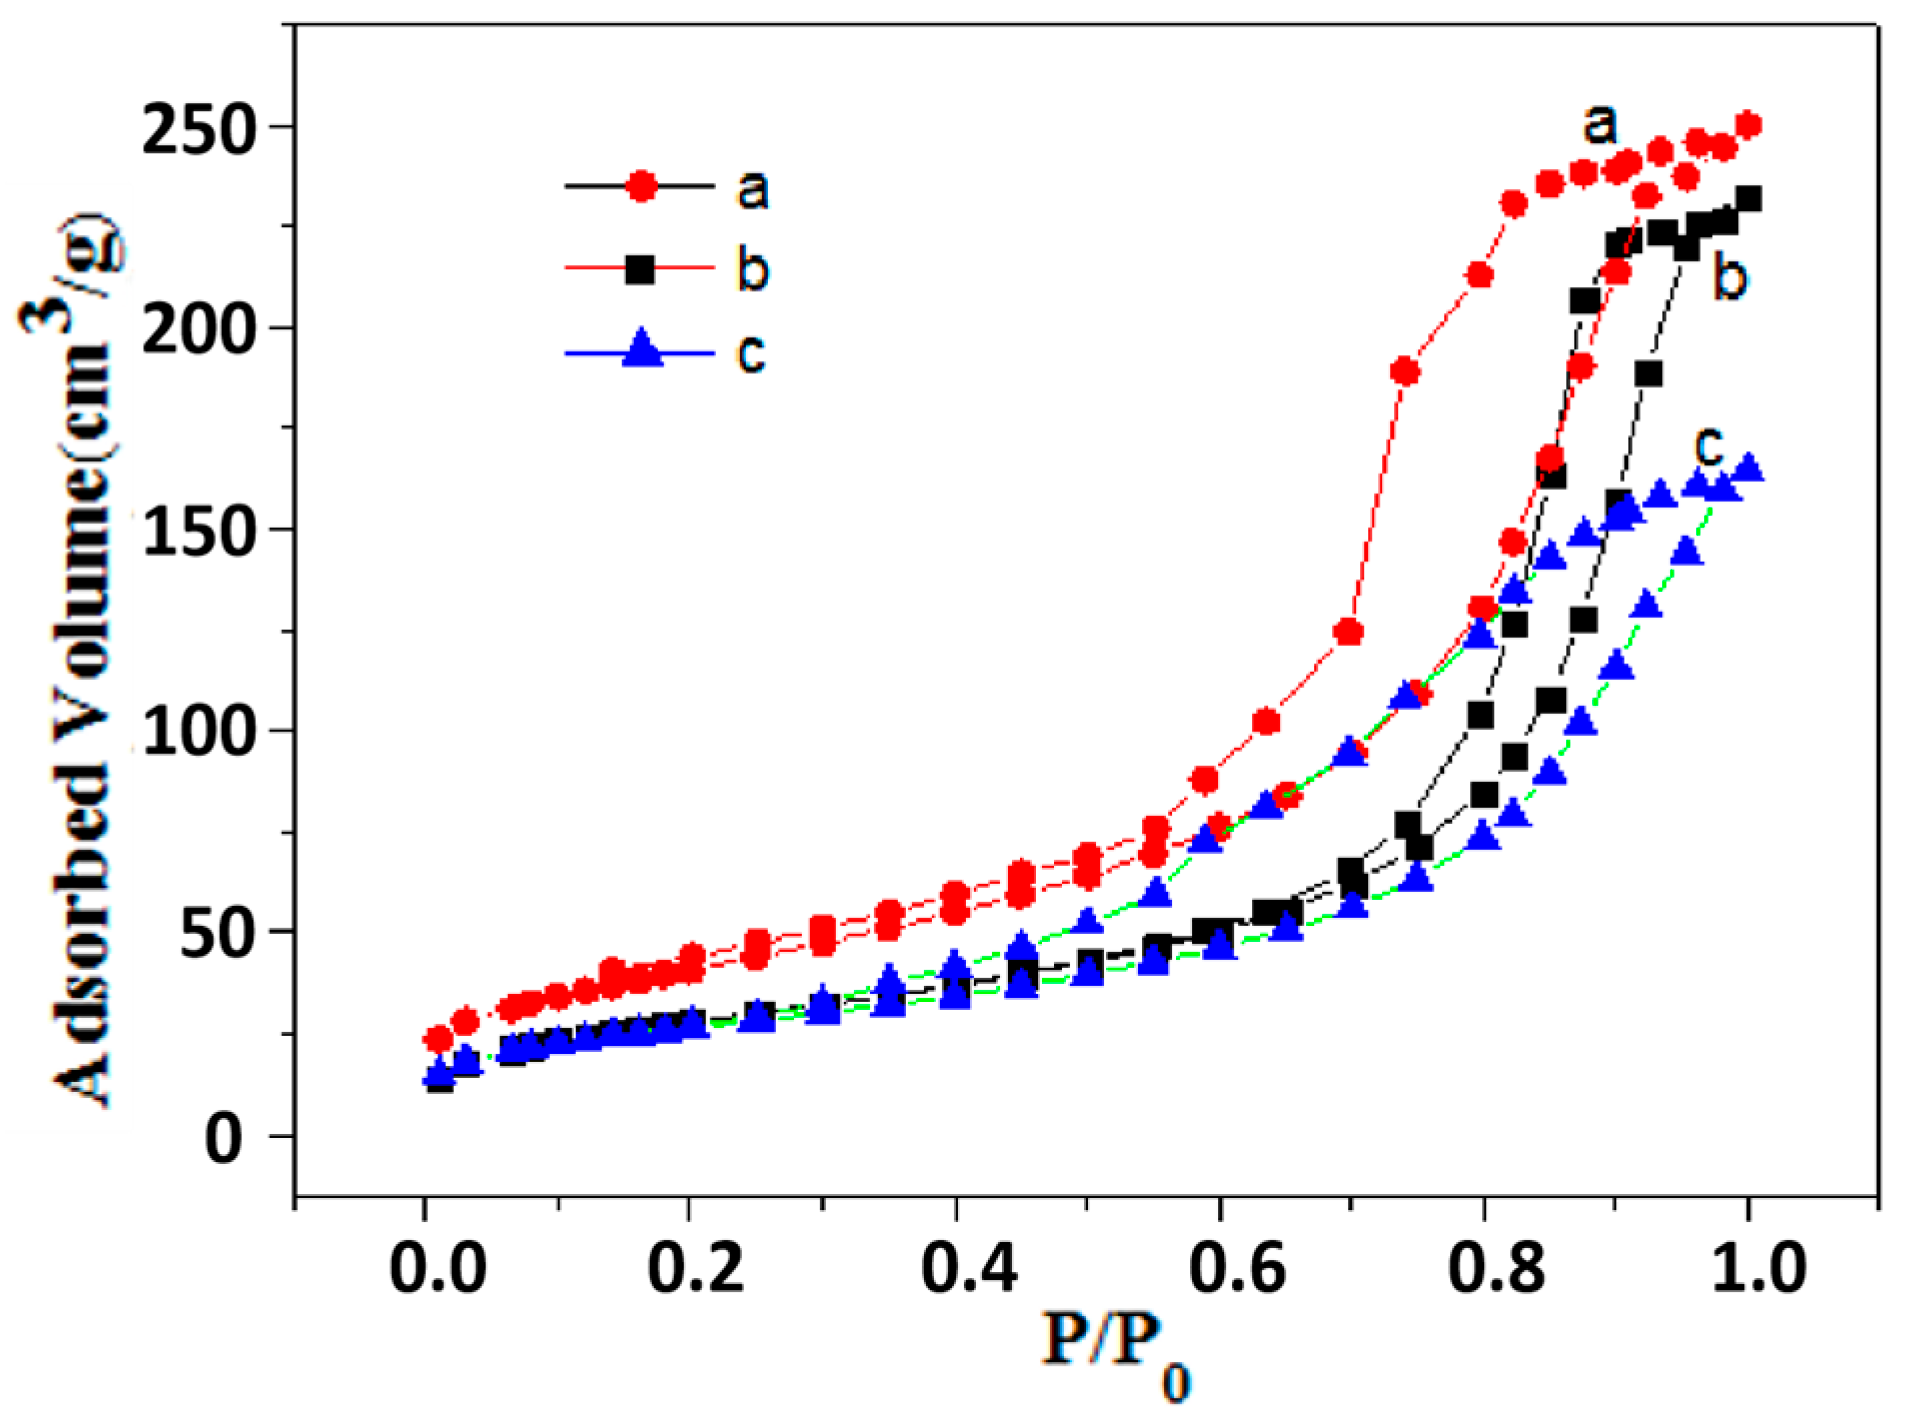
The crystal phase of the samples was studied as shown in Figure 3. The obtained diffraction peak of the doped TiO2 matched very well with the standard values (PDF-#21-1272) and the diffraction peaks at 2θ = 25.281(101), 37.800(004), 48.049(200), 53.890(105), and 62.688(204), illustrating that the samples were in the anatase phase. However, the obtained undoped TiO2 was in a mixed phase of anatase and brookite. The cell volume was calculated by Fourier synthesis with the program SHELXS−97 [30]. When the solvent was water, the sample consisted of nanoparticles 10~20 nm in mean size, as determined by Nano Measurer 1.2 software using 10 nanoparticles. The average crystallite size of TiO2 samples with different Mg-doped ions was calculated by XRD–Scherrer formula: d = 0.91 λ/βcos θ, where d is the mean crystallite size, k is 0.9, λ is the wavelength of Cu Kα (i.e., λ = 0.15420 nm), β is the full width at half maximum intensity of the peak (FWHM) in radian, and θ is Bragg’s diffraction angle [31]. The crystallite size and cell volume were calculated as shown Table 1. When increasing Vwater/Vethanol, there are differences in the diffraction peak intensity and minor shifts in the peak occur, which indicates a reduction in crystalline size and an increase in the volume of unit cells (Table 1). Since the ionic radius of Mg2+ (0.072 nm) is close to that of Ti4+ (0.061 nm), Mg2+ easily enters the TiO2 lattice [32] and the lattice volume increases (Table 1), indicating that the formation of a crystal defect. Based on the experimental results, the formation of the crystal defect promotes the formation of the anatase phase, which is accordance with the reported literature [27,29]. Hence, after the addition of the magnesium source, a pure-anatase TiO2 phase appears. The intensity of the (004) direction is significantly enhanced compared to undoped TiO2. In addition, the FWHM of the (101) peak was calculated by using Lorentz fitting. According to the Scherrer formula, d = 0.91 λ/βcos θ, the crystallite size was calculated; it is shown in Table 1.
Figure 4 shows SEM images of the as-synthesized samples. When the solvent was water, the sample consisted of nanoparticles 5–10 nm in size. When the Vwater/Vethnol ratio was 12.5:2.5, agglomerated nanoparticles had a grape-like morphology (Figure 4b). With the increase in ethanol dosage, nanoparticles increased (Figure 4c,d). The experimental results show that the morphology of the samples was greatly affected by Vwater/Vethnol. Their morphology is determined by the relationship between crystal formation and growth. Moreover, crystal growth is influenced by the adsorption of certain crystalline facets into OH. This adsorption hinders the growth of these facets, resulting in different rates of crystalline growth. Ethanol is a typical polar solvent and amphiphilic molecule. It was vertically adsorbed on the hydrophilic surface of the TiO2 particles, forming a two-amphiphilic bilayer, which limited the immersion of the water molecule in the hydrophilic side surface and the TiO2 particles [33]. The rapid hydrolysis of TBOT promoted the rapid generation of TiO2, which led to TiO2 particle agglomeration with an increase in Vwater/Vethanol. Figure 5a,b show TEM and the corresponding SAED pattern (inset) and HRTEM images of the sample prepared at Vwater/Vethnol = 12.5:2.5. From Figure 5a, it is observed that the aggregated particles in Figure 4b consist of nanoparticles. The major diffraction rings for the crystal surface at (101), (004), and (105) match well with XRD analysis. The d spacing is 0.325 nm (Figure 5b), and it matches well with the lattice spacing of anatase TiO2 (101). Furthermore, the corresponding EDX spectrum shown in Figure 5c and Figure S1 verifies the existence of Mg, Ti, and O ions. Other impurities were not detected in the EDX spectra.
As can be seen from Table 1 and Figure 3, the morphologies of the samples strongly depend on Mg-doped ions and Vwater/Vethanol. Because the current system contains ethanol, water, Mg-doped ions, and TBOT, we can reasonably assume that the formation of anatase TiO2 is due to the dehydrating condensation between Ti(OH)62− and Mg-doped ions under solvothermal conditions [34]. Thus, due to the formation of a lower number of active OH ions and a lower number of soluble species, Ti(OH)62− and TiO6 octahedrons in one cluster may construct a chain via the corner-sharing of Ti(OH)62− growth units. Due to doped Mg ions entering the TiO2 lattice, resulting in TiO6 octahedron lattice distortion (Table 1) and an increase in the charge density of Ti and reduction in the electron density of oxygen, the preferred TiO6 octahedron chain-shaped clusters further adsorb OH soluble species into the (101) plane (Figure 5b) and anatase TiO2 monomers form through a dehydrating condensation process. Therefore, these planes could be freely bonded by interactions between OH and nuclei to obtain aggregated nanoparticles (Figure 4). The solubility of salt increases with the dielectric constant of the solvent [35], and the dielectric constant of water is bigger than that of ethanol. When Vwater/Vethnol decreases, that is, ethanol content increases, this could decrease the solubility of the precursor and increase the viscosity of the solution, thereby decreasing the diffusion ability of Ti(OH)62− ions and causing the crystal size of the TiO2 sample to decrease (Table 1).
Figure 6 shows XPS spectra of pure and Mg-doped TiO2 samples. Peaks located around 457 eV and 464 eV resulted from Ti 2p3/2 and Ti 2p1/2, respectively, corresponding to the oxidation state of Ti4+. Meanwhile, due to the partial substitution of Tg4+ ions by Mg2+, the binding energy of Ti decreases, thus increasing the charge density of Ti. The binding energy of O 1s in the pure TiO2 sample is 529.8 eV, owing to the intrinsic binding energy of oxygen in TiO2. The Mg-doped TiO2 sample shows a shoulder peak near 532.3 eV in addition to the intrinsic binding energy of O 1s (shown in Figure 6b). This may be due to the addition of small amounts of Mg atoms, causing new oxygen vacancies [36]. Oxygen vacancies in TiO2 are usually created in doped TiO2 to maintain charge neutrality and improve the service life of the photocatalyst [37]. When oxygen vacancies are generated, a higher energy peak can be seen due to the decrease in the electron density of oxygen [37]. A peak at 49.93 eV was associated with Mg 2p, which is further verified by the incorporation of Mg2+ into the titanium dioxide lattice.
Figure 7 shows the typical FT-IR spectrum of undoped TiO2 and Mg-doped TiO2 samples with different Vwater/Vethnol ratios. All samples have absorption peaks at 3380 cm−1 and 1640 cm−1, corresponding to O-H stretching vibration and bending vibration, respectively [38]. For the undoped TiO2 sample, the bands at 1450 cm−1 and 1538 cm−1 are attributed to the H-O-H bending of the lattice water [39]. The band centered at 510 cm−1 is due to isolated tetrahedral TiO4 stretching vibrations and only occurs in the pure TiO2 sample [40]. As a result of Mg-doping, the bands at 1065 cm−1 and 458 cm−1 show the vibration of Ti-O-Mg [41]. With the increase in ethanol content, the intensities of the absorption peaks at 3380 cm−1 and 458 cm−1 increase, respectively. This indicates that Mg ions are doped into the lattice of TiO2, and the HRTEM, TEM, and XRD results further confirmed this point.

3.2. BET Analysis

Figure 8 shows the BET analysis of the samples using nitrogen adsorption-desorption. For all samples, the isotherms are type IV, and clear hysteresis loops can be identified. With the increase in Vwater/Vethnol, the BET surface area of the Mg-doped TiO2 samples decreases. However, the pore volume and porosity of the samples exhibit a prominent enhancement compared with the undoped TiO2 sample, as shown in Table 1 and Figure 8. The BJH average pore diameters, calculated from the adsorption branch of the isotherms, are 11.205 nm, 12.560 nm, 12.365 nm, and 12.807 nm for pure TiO2 and Mg-doped TiO2 samples prepared with different Vwater/Vethnol ratios of 12.5:2.5, 10:5, and 7.5:7.5, respectively. The mesoporous structure is mainly due to the porous accumulation of nanoparticles [42]. The porosity increase is due to the crystal size reducing with the decrease in Vwater/Vethnol.

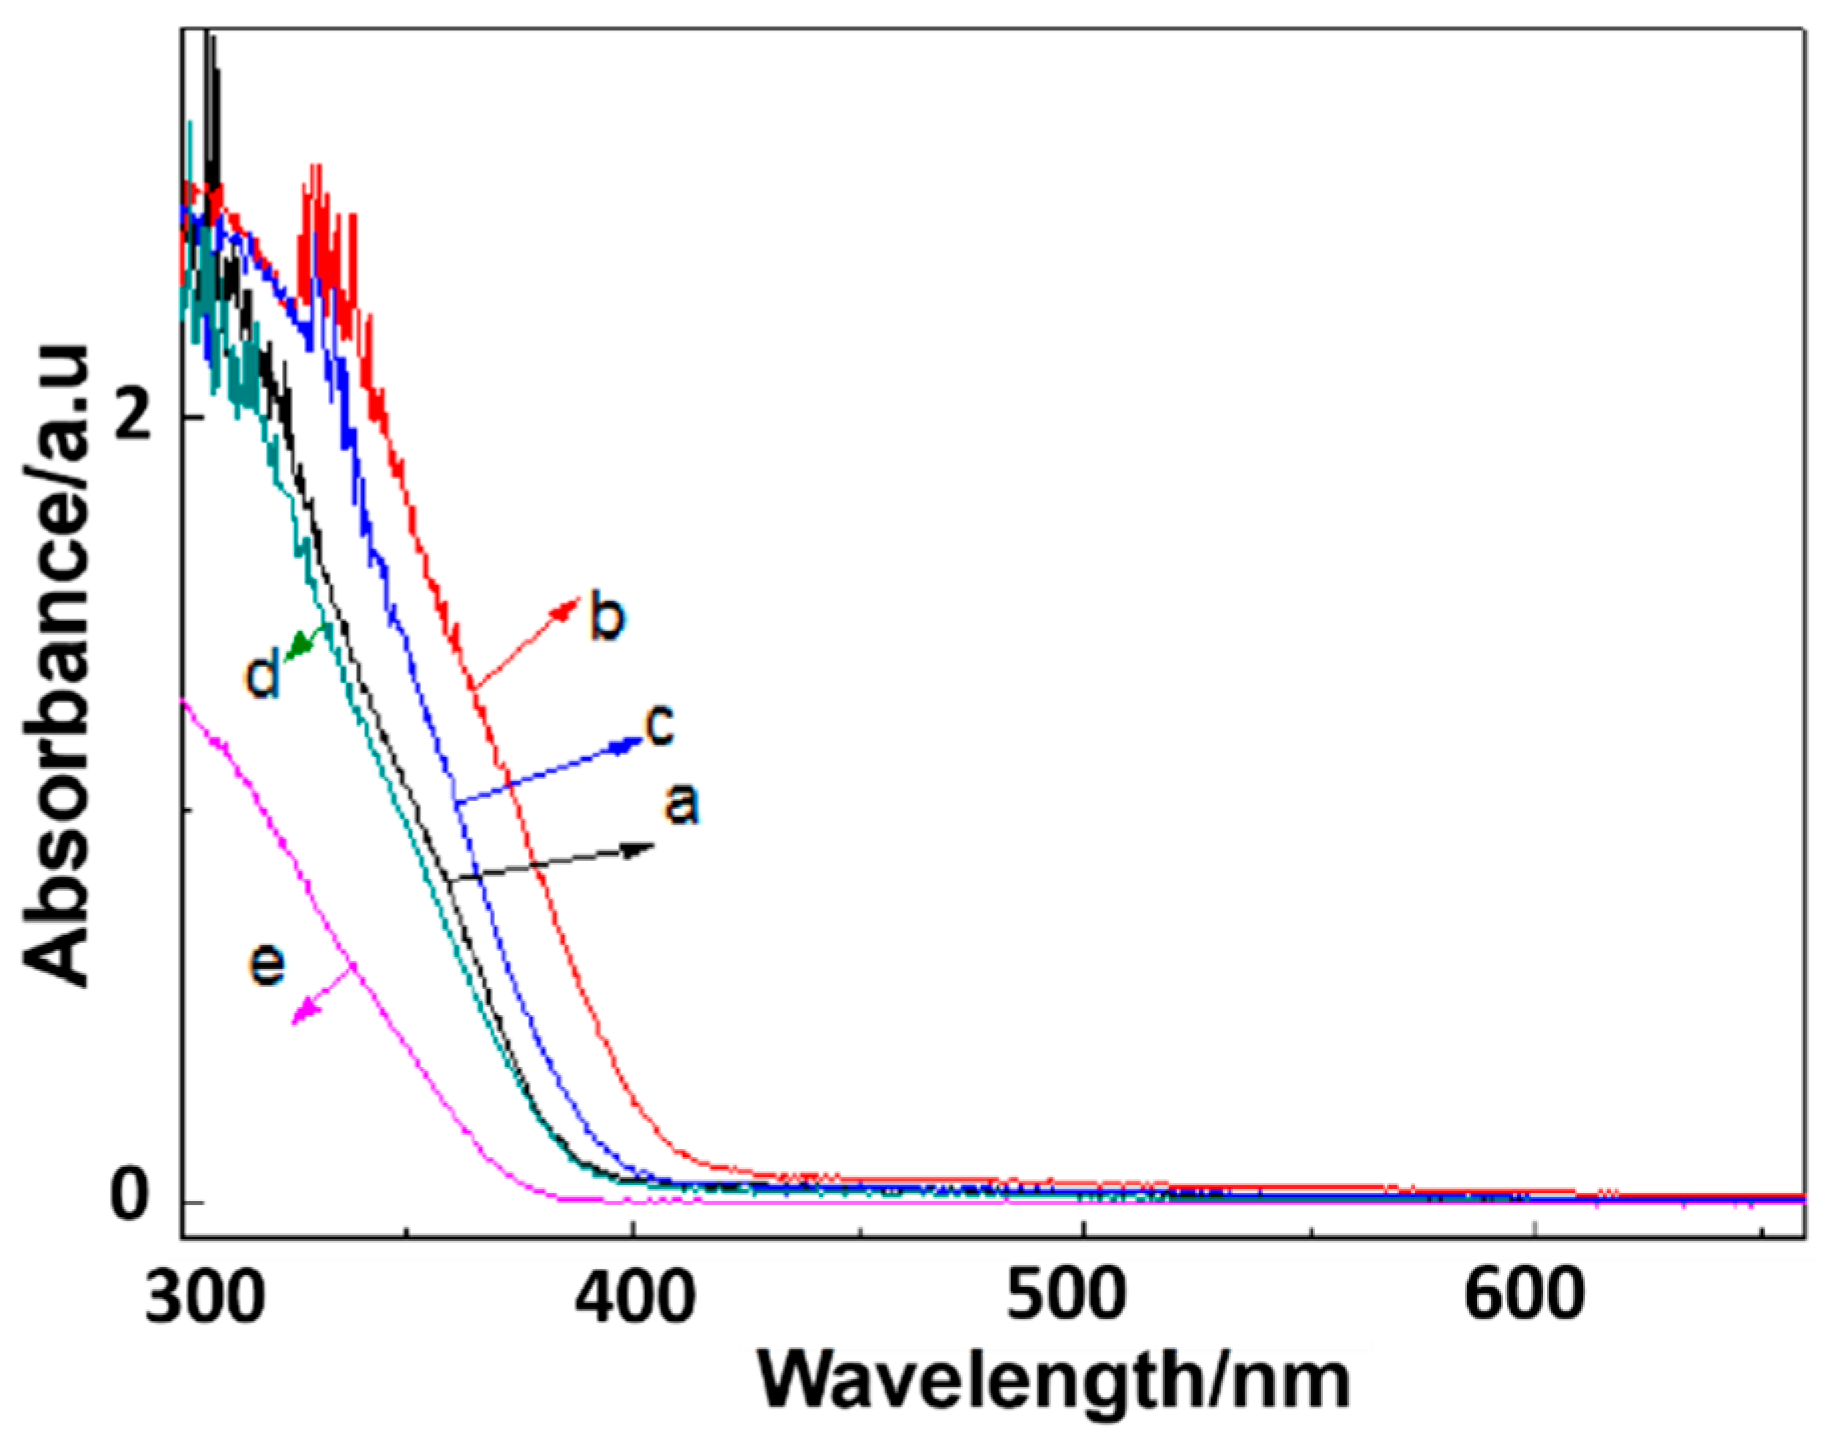
3.3. Optical Properties

Figure 9 shows the UV-Visible diffuse reflectance spectra of TiO2. The absorption edge of doped TiO2 had more of a blue shift than the undoped TiO2. The Kulbeka–Munk formula, (E(ev) = hC/λ, h = 6.626 × 10⁻³⁴ Js, C = 3.0 × 10⁸ ms−1), was used to acquire the exact band gap of TiO2 from 3.26 eV to 3.13 eV, which can be attributed to the Mg2+-doped TiO2 in the framework. Since Mg2+ ions generated from oxygen vacancies are known to cause the photoexcitation of long-wavelength light, the UV-Vis absorption spectrum was inferred to verify the presence of Mg2+ in the TiO2-doped sample.
Moreover, from the spectrum, the energy gap of the semiconductor nanoparticles is related to the particle size. The band gap increases as the particle size decreases, resulting in a phenomenon known as a “blue shift” in light absorption at a specific wavelength due to the quantum size effect [43]. With the increase in ethanol content, the absorption edge of the doped TiO2 is blue-shifted, illustrating the particle size reduction. The results obtained are well-matched with the sizes of the crystals that were measured. The band gap energies of the prepared TiO2 doped by adding 0 to 7.5 mL ethanol were found to be 3.17 ev, 3.03 ev, 3.13 ev, and 3.25 ev, respectively. From Figure 4, it is clear that the size of anatase nanoparticles increases with the increase in ethanol content. Optical absorption is highly dependent on the internal structure of the material [44]. Compared with pure TiO2, the longer-wavelength region of Mg-doped TiO2 samples implies that the only possible transition is from the oxygen vacancies causing a red shift of the absorption edge (Figure 6), which also implies that Mg2+ has been incorporated into the lattice of TiO2 (Table 1). From Figure 6, it can be observed that compared with the pure TiO2 sample, the Ti and O binding energy in Mg-doped TiO2 samples has been shifted to a lower energy and a higher energy peak, because some Ti4+ ions are replaced by Mg2+ ions in order to increase the charge density of Ti and reduce the electron density of oxygen [45]. The new oxygen vacancies are created through the doping of small amounts of Mg atoms [46]. For the Mg-doped TiO2 sample, the peak of 49.9 eV is ascribed to Mg 2p (Figure 6c), which is consistent with the value of Mg2+ [27,41]. These observations further verify the existence of Mg2+ in the Mg-doped TiO2 sample, which is consistent with XRD (Figure 3), increased cell volume (Table 1), and FT-IR spectrum (Figure 7).

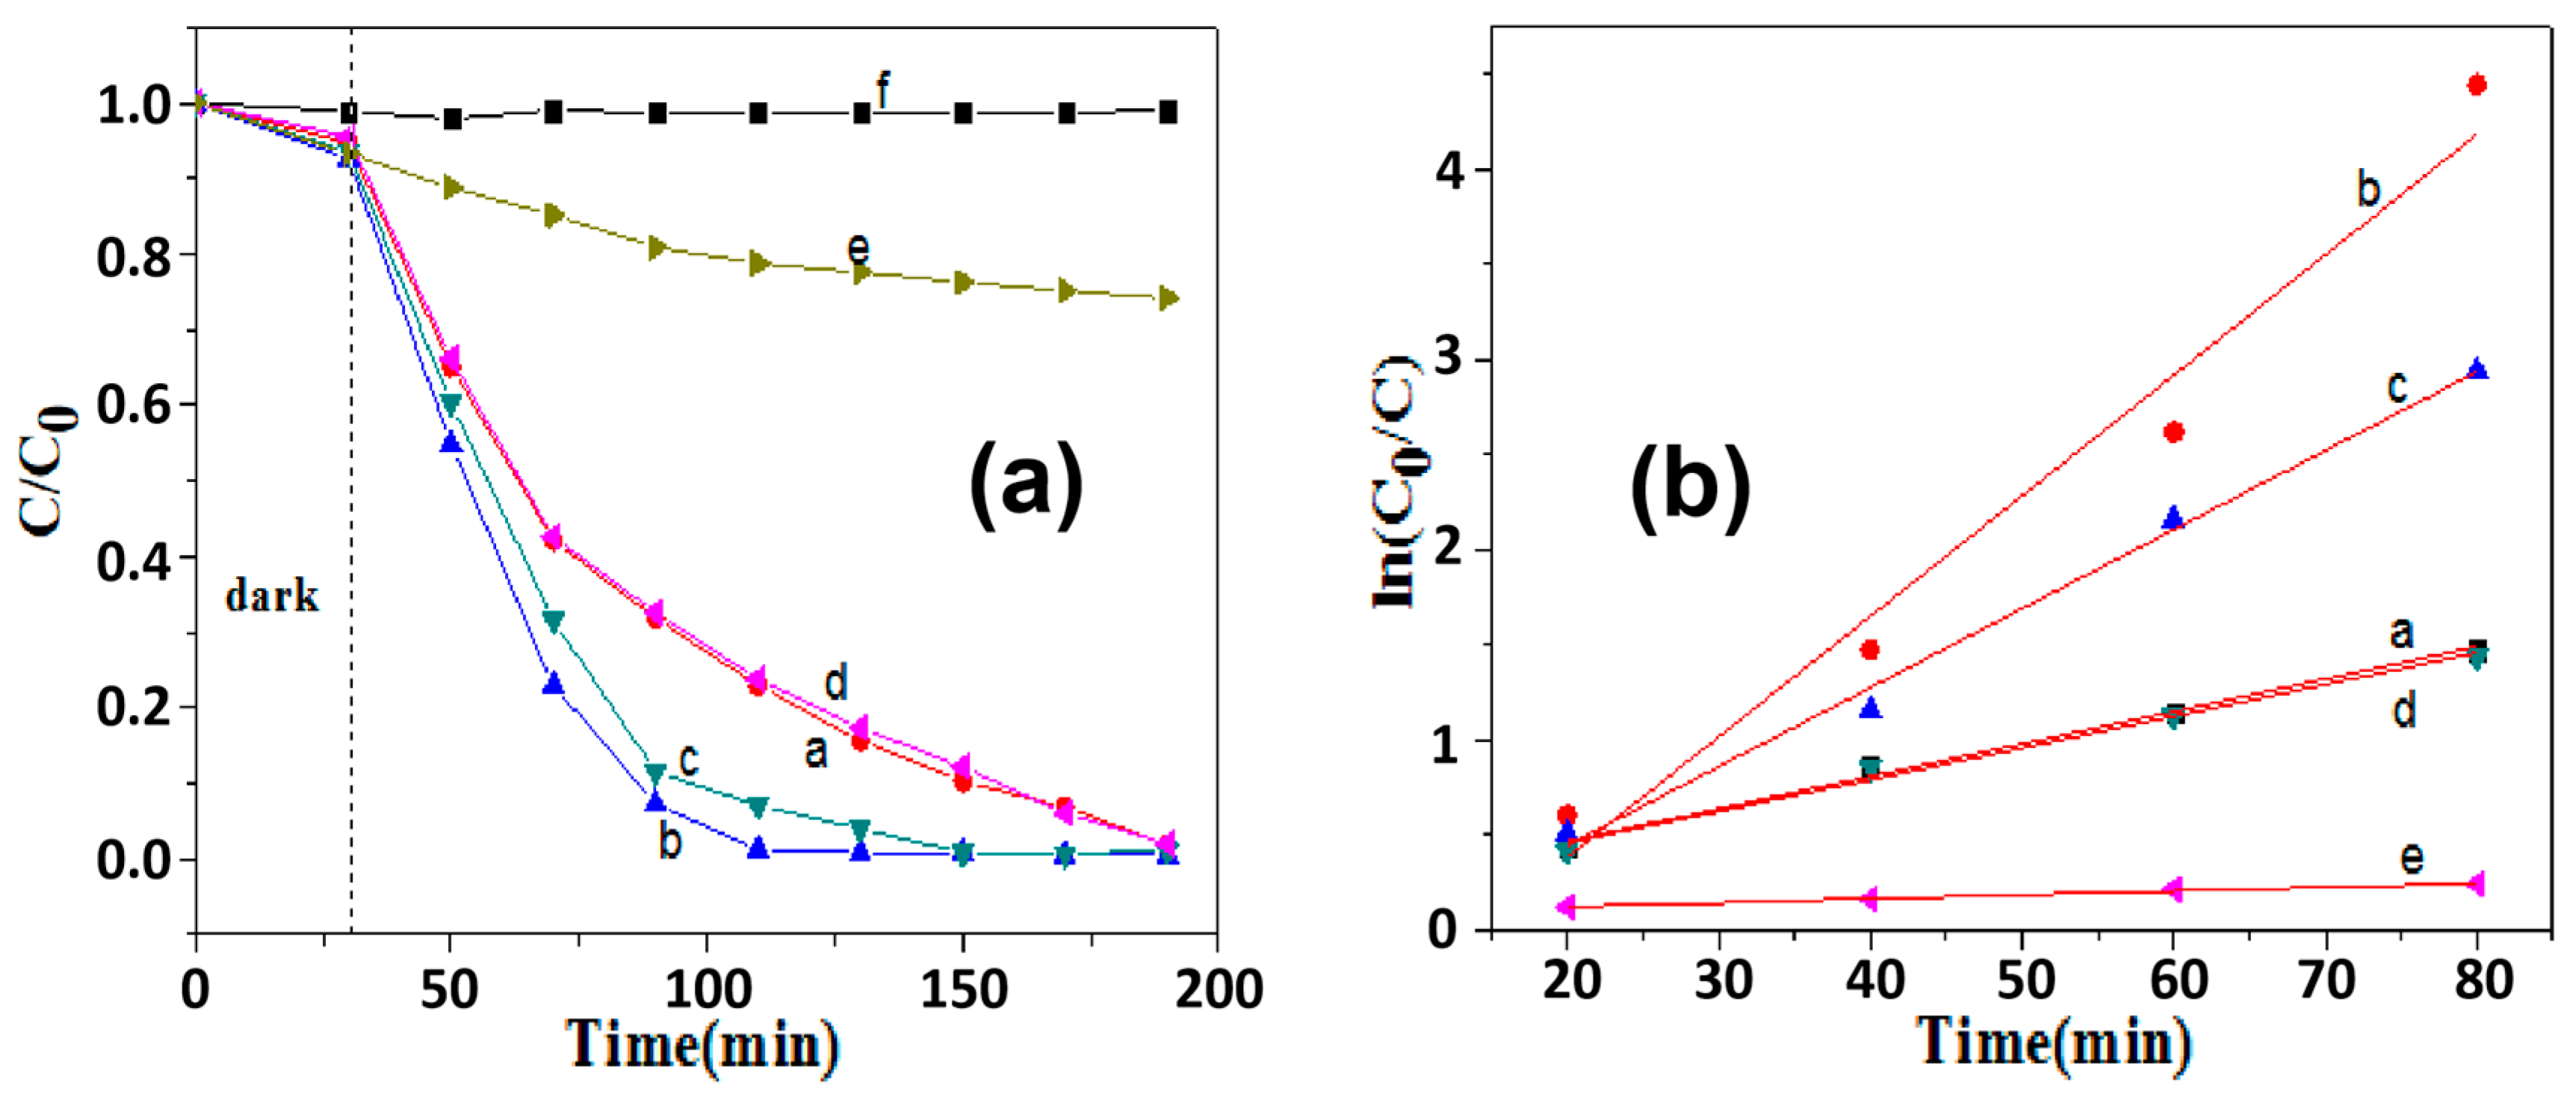
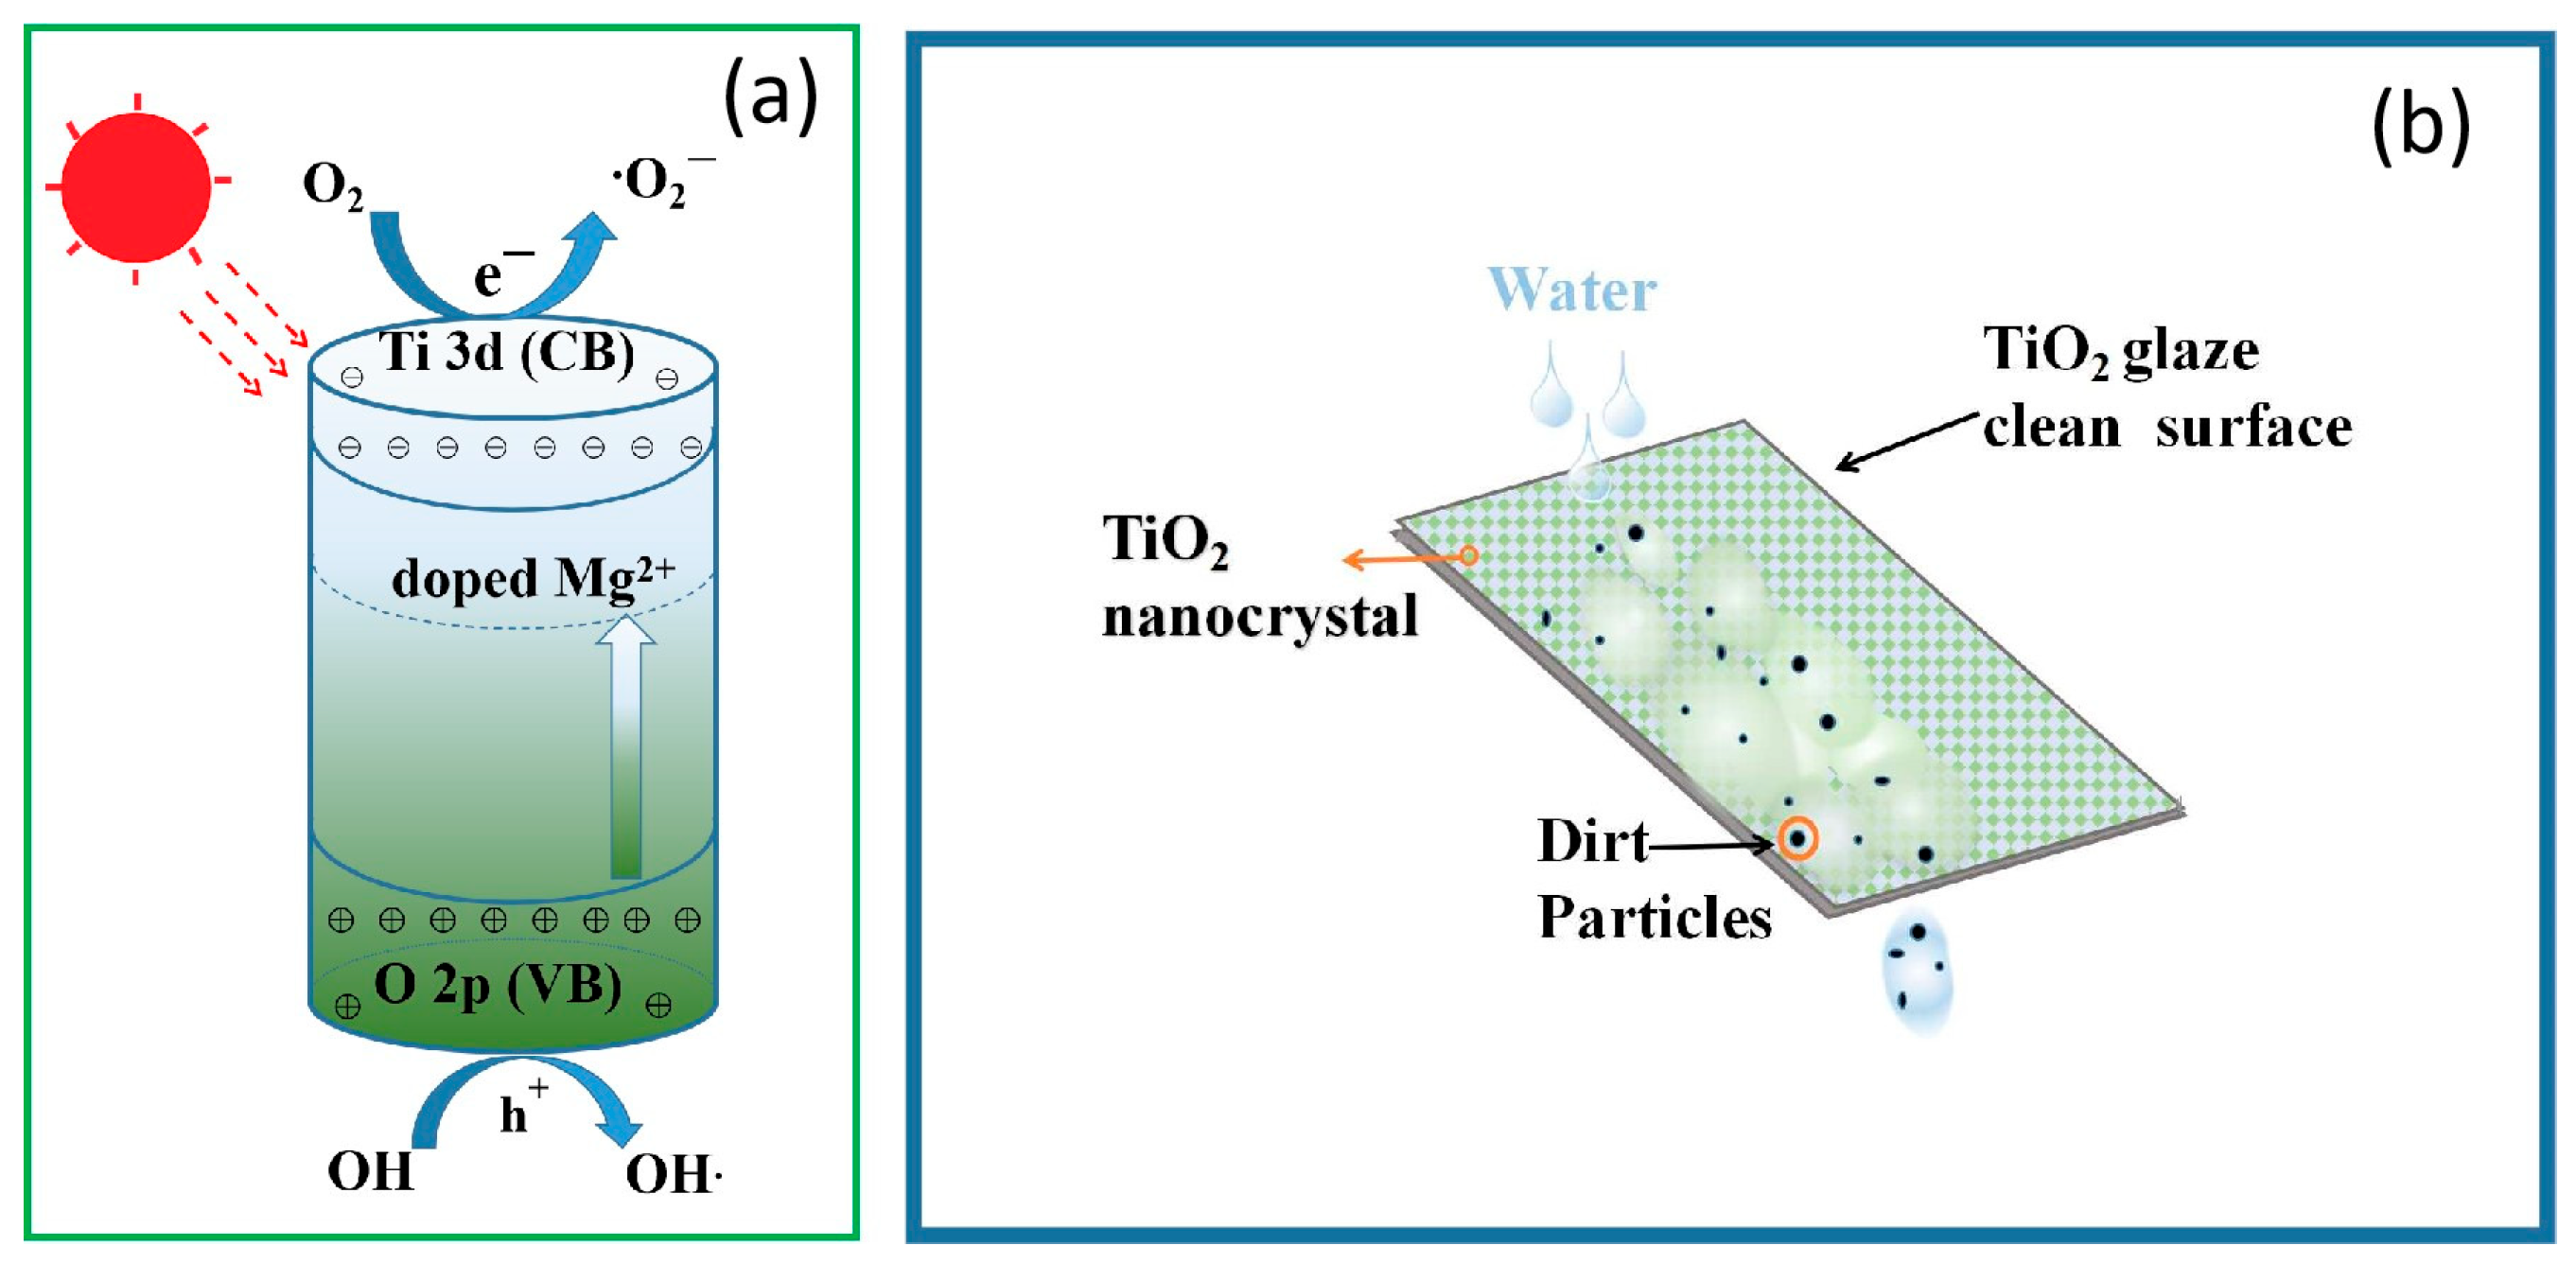
3.4. Photocatalytic Activity

Figure 10 shows the photocatalytic bleaching of RhB through the as-prepared sample under visible light. As shown in Figure 10, RhB concentration is unchanged, illustrating that RhB adsorbed on the TiO2 surface had reached equilibrium in 30 min. Figure 10b shows kinetic curves of ln(C0/C) versus irradiation time during RhB bleaching under visible light irradiation. It has been found that the apparent rate constants [47] for the reaction of RhB with Mg-doped TiO2 samples (Vwater/Vethanol = 15:0, 12.5:2.5, 10:5, 7.5:7.5) and Mg-undoped TiO2 (Vwater/Vethanol = 12.5:2.5) were 0.01704, 0.06335, 0.04153, 0.01668, and 0.00203 min−1, respectively, which illustrates that the photocatalytic activity of the samples was effectively improved by Mg2+-doping (due to pure anatase phase formation (Figure 3)). Moreover, the photocatalytic properties of Mg-doped TiO2 can be further improved by changing the ratio of water to ethanol. The photocatalytic properties of the samples increased first and then decreased gradually with the increase in Vwater/Vethanol. When the Vwater/Vethanol ratio was 12.5:2.5, Mg-doped TiO2 had the maximum photocatalytic activity. In addition, by combining Table 1 with Figure 4 and Figure 9, we can observe that the aggregated nanoparticles increase in size and thus Eg increases, which leads to the easy recombination of the electron and hole in the migration process, and therefore, the photocatalytic activity of the samples decreases with the increase in ethanol volume (i.e., Vwater/Vethanol decreases). Although TiO2 (Vwater/Vethanol = 15:0) has a larger specific surface area and smaller crystal size (Table 1) compared with the Mg-doped samples, the sample had lower porosity and pore size, which caused the decrease in the sample of RhB adsorption. This clearly indicates that the adsorption of samples was determined by the surface area and characteristics of the pore. Obviously, Mg-doped TiO2 samples exhibited better photocatalytic activities than pure TiO2 samples. The narrowing of the band gap is a result of Mg doping into the TiO2 lattice, which enables the trapping of the photo-induced electron and facilitates the separation of electron-hole pairs (Figure 11a).

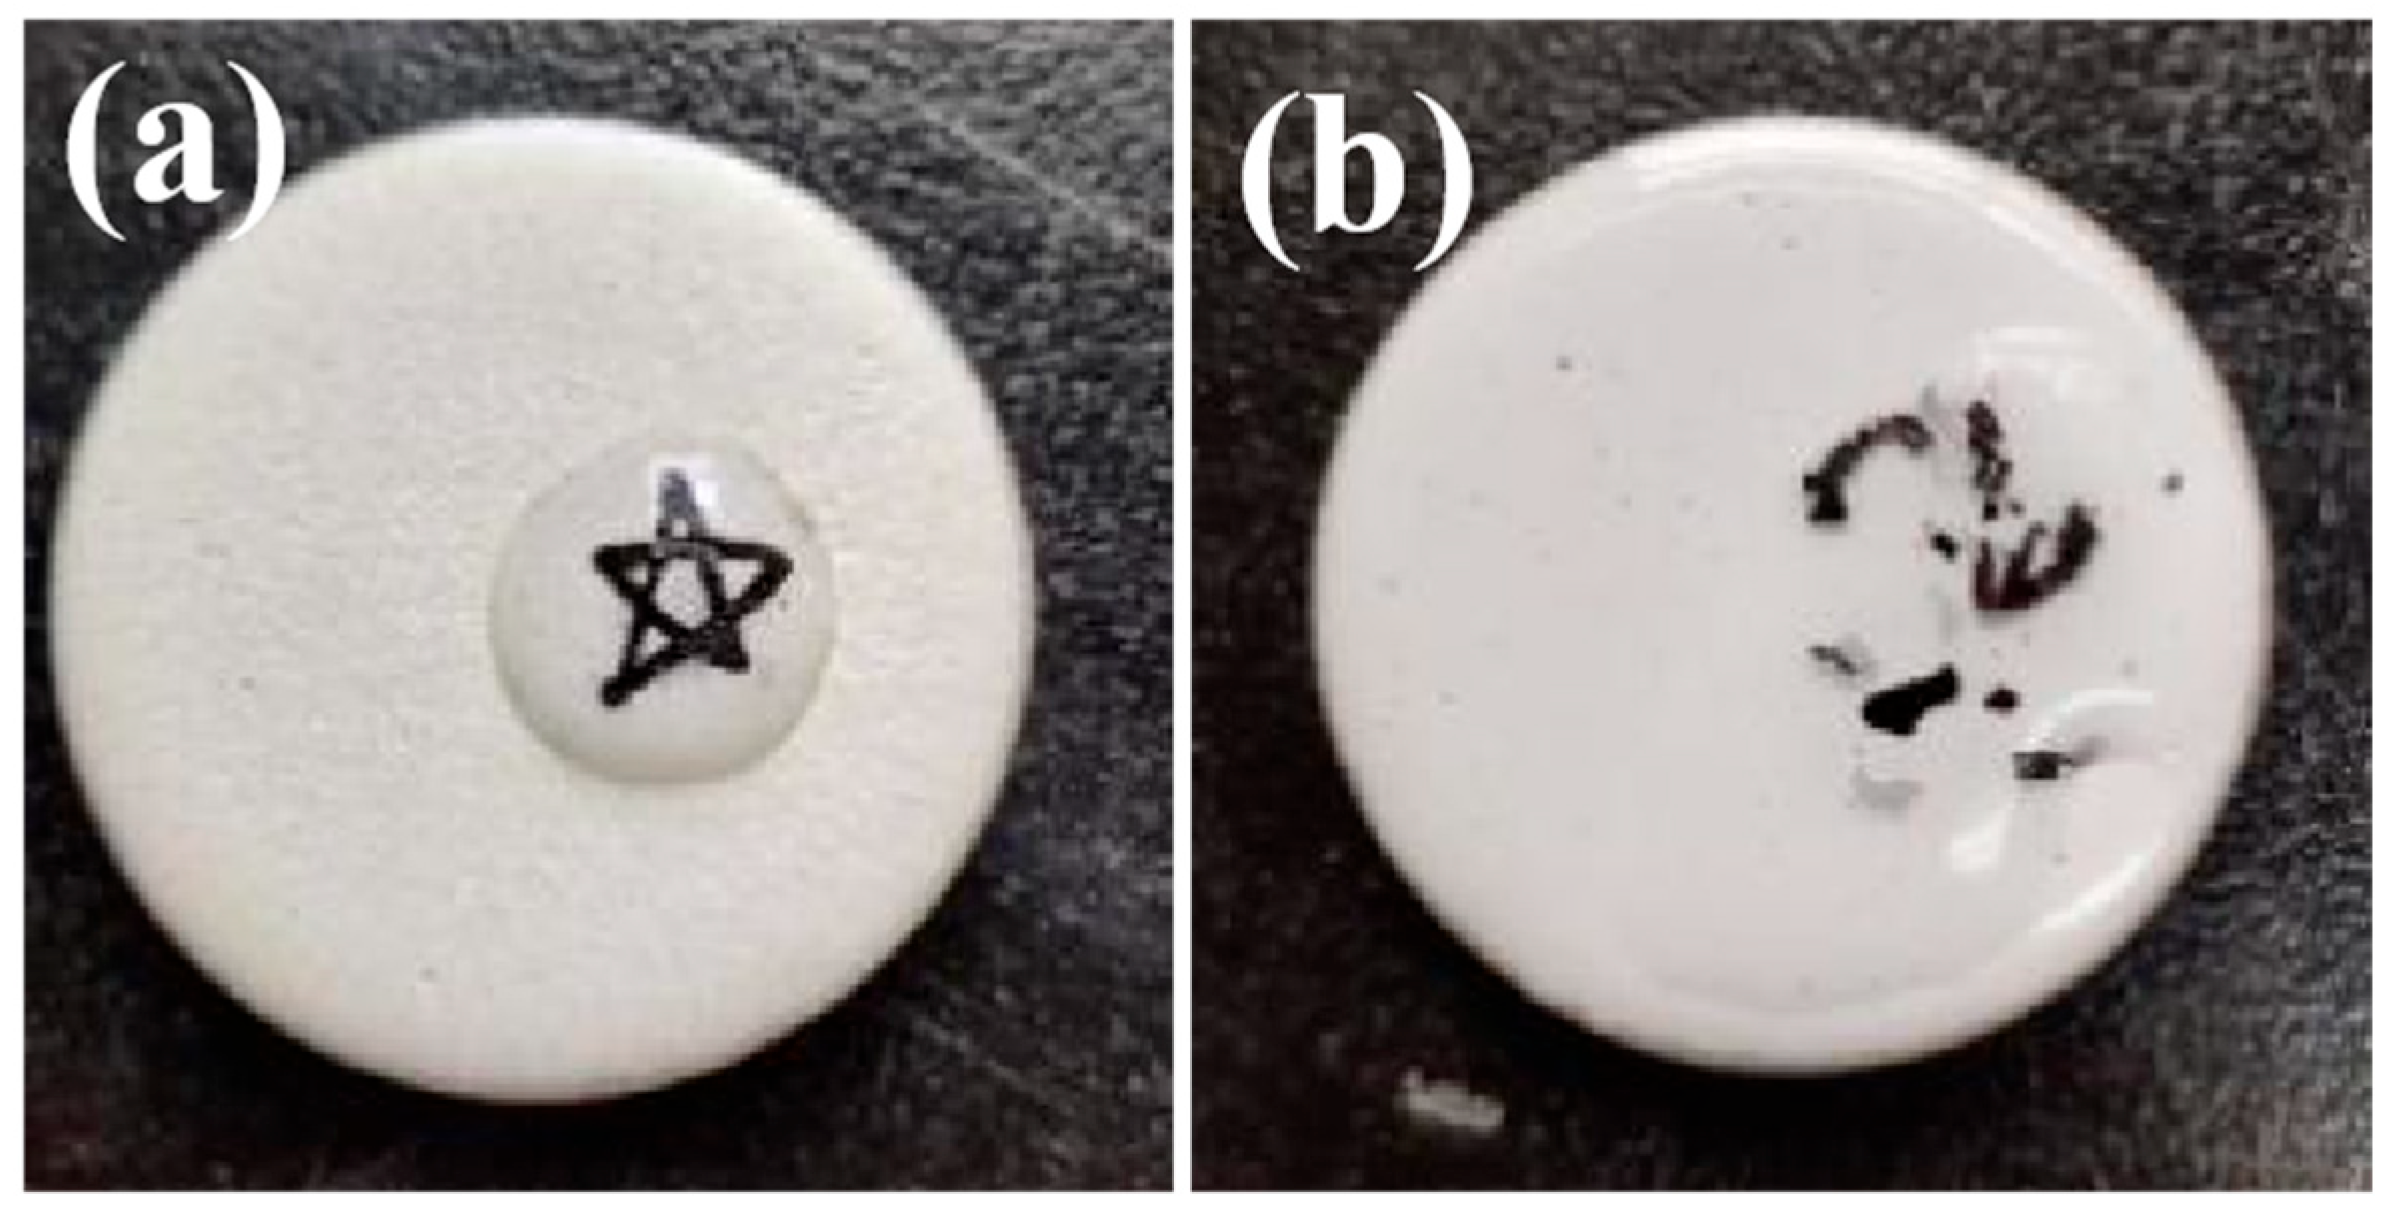
3.5. Self-Cleaning Properties of Mg-Doped TiO2 in Glaze Sample

It can be seen the wet angle of pure TiO2 glaze samples is obviously higher than those of Mg-doped TiO2 glaze samples (Figure 12). The super-hydrophilicity of Mg-doped TiO2 glaze samples is attributed to several comprehensive factors. Based on the experimental results, Mg ions are helpful for the growth of the TiO2 crystal grain, and thus separates the phase size in Mg-doped TiO2 glaze more than pure TiO2. This makes the Mg-doped TiO2 glaze surface rougher than that of the pure TiO2 glaze (Figure 12). A large surface roughness could improve the hydrophilicity, according to the Wenzel equation (1): cos θr = rcos θ, where r denotes the surface roughness of the glaze, cos θ is the classical contact angle depicted by the Young equation, and θr is the measured real contact angle. Moreover, the partial substitution of Mg2+ ions for Ti sites increases the slight TiO2 lattice distortion, which is available for a low initial contact angle and hydrophilicity [48]. From Figure 12, it can be seen that the contact angles of Mg-doped TiO2 samples are smaller than that of the pure TiO2 glaze sample in the dark condition, indicating that the greater roughness and lattice distortion are helpful for decreasing the contact angle. This could be because the incorporation of Mg makes the band gap of TiO2 narrow, thus the visible light can excite pairs of electrons and holes (Figure 11a), just as in the case of ultraviolet irradiation for the pure TiO2 glaze. Ti4+ ions could be united with the photo-induced electron and thus Ti3+ ions could be obtained. Ti3+ sites can be substituted by Mg2+ ions, which produces one excess positive charge. Those excess positive charges could capture the photo-induced electrons quickly, and thus photo-generated holes are available for combining more H2O adsorbed on the glaze surface and react with water, producing hydroxyl radicals that are also available for maintaining the hydrophilicity of Mg-doped TiO2 glaze samples [29]. Therefore, the super-hydrophilicity of Mg-doped TiO2 glaze samples could be attributed to the visible-light-exciting photo-induced pairs of electrons and holes. For the sample with a Vwater/Vethanol ratio of 10:5 and 7.5:7.5, the contact angles of water droplets on Mg-doped TiO2 glaze samples increase slightly, which could be attributed to the decrease in the Vwater/Vethanol ratio. However, when Vwater/Vethanol is 10:5 and 7.5:7.5, the hydrophilicity of Mg-doped TiO2 glaze samples decreases slightly, though it still has super-hydrophilicity. The hydroxy groups anchoring on the Mg-doped TiO2 glaze surface have a significant impact on the hydrophilicity. The formation of hydroxy groups results in the dissociative adsorption of water molecules at oxygen vacancy sites on the Mg-doped TiO2 glaze surface. The extra hydroxy groups and oxygen vacancies on the surface are produced by electron–hole pairs, which lead to the hydrophilicity of the Mg-doped TiO2 glaze surface [39]. Because oxygen vacancy is produced by the doping of Mg in the TiO2 crystal and the separation of electron–hole pairs is facilitated (Figure 11a), the Mg-doped TiO2 glaze surface has more photo-induced wettability than the pure TiO2 glaze surface.
The self-cleaning performance was tested using a Japan Marker pen. The glaze surface was drawn on after drying for 1 h. After that, after placing a few drops of water on the glaze, we could observe whether the ink blots were floating. Table 2 shows that after firing at 1180~1200 °C, the water contact angle (5.623° vs. 15.23°) and stain resistance (the blot floats as a whole vs. not floating, as shown in Figure 13) of the sample fabricated were improved compared to commercial self-cleaning ceramic glazes [49]. The above results indicate the great potential application for enhancing the self-cleaning properties of glazes by introducing Mg-doped TiO2.

4. Conclusions

In this paper, Mg-doped TiO2 samples with various Vwater/Vethanol ratios were successfully prepared through the solvothermal method at 180 °C for 36 h. The Mg-doped (Vwater/Vethanol = 12.5:2.5) sample had higher surface area, porosity, optical performance, and photocatalytic activity than other samples. Undoped and Mg-doped TiO2 glaze ceramic samples were prepared using a medium-/high-temperature solid-firing process. Mg-doped TiO2 samples (Vwater/Vethanol = 12.5:2.5) illustrated superior hydrophilicity properties, photocatalytic activity in terms of bleaching organic dye, and self-cleaning capability in ceramic glaze samples than other samples after visible light exposure. This study provides a preparation approach for the synthesis of TiO2 while controlling crystal size and morphology, which can be utilized with solar energy for bleaching the contaminants in water and enhancing the self-cleaning properties of medium-/high-temperature glazes.

Supplementary Materials

The following supporting information can be downloaded at: https://www.mdpi.com/article/10.3390/inorganics11080341/s1, Figure S1: EDX spectroscopy mapping performed in the TEM microscope.

Author Contributions

Conceptualization, T.Z., Q.B. and W.D.; methodology, T.C. and Q.B.; software, P.L. and Y.L.; validation, X.G. and Q.B.; formal analysis, T.Z. and J.Z.; investigation, T.C. and Y.L.; resources, Q.B. and J.Z.; data curation, T.Z. and W.D.; writing—original draft preparation, T.Z. and W.D.; writing—review and editing, T.Z. and W.D.; visualization, P.L. and X.G.; supervision, X.G. and J.Z.; project administration, T.Z. and T.C.; funding acquisition, W.D. All authors have read and agreed to the published version of the manuscript.

Funding

We would like to express our gratitude for the financial support from Major Project of Natural Science Foundation of Jiangxi Province (20232ACB204017), Jingdezhen technology bureau (2021GYZD009-18 and 20224GY008-16) and Jiangxi Province Key R&D Program in China (No. 20202BBE53012), Graduate Innovation Fund Project of Jingdezhen Ceramic University (JYC202004).

Institutional Review Board Statement

Not applicable.

Informed Consent Statement

Not applicable.

Data Availability Statement

The raw data required to reproduce these findings cannot be shared at this time as the data also forms part of an ongoing study.

Conflicts of Interest

The authors declare no conflict of interest.

References

  1. Mathew, S.; John, B.K.; Abraham, T.; Mathew, B. Metal-Doped Titanium Dioxide for Environmental Remediation, Hydrogen Evolution and Sensing: A Review. Chemistryselect 2021, 6, 12742–12751. [Google Scholar] [CrossRef]
  2. Lettieri, S.; Pavone, M.; Nanostructures, B. Composites and Hybrid Photocatalysts. Materials 2022, 15, 1271. [Google Scholar] [CrossRef] [PubMed]
  3. Jahdi, M.; Mishra, S.B.; Nxumalo, E.N.; Mhlanga, S.D.; Mishra, A.K. Synergistic effects of sodium fluoride (NaF) on the crystallinity and band gap of Fe-doped TiO2 developed via microwave-assisted hydrothermal treatment. Opt. Mater. 2020, 104, 109844. [Google Scholar] [CrossRef]
  4. Wang, Y.; Chen, Y.-X.; Barakat, T.; Wang, T.-M.; Krief, A.; Zeng, Y.-J.; Laboureur, M.; Fusaro, L.; Liao, H.-G.; Su, B.-L. Synergistic effects of carbon doping and coating of TiO2 with exceptional photocurrent enhancement for high performance H2 production from water splitting. J. Energy Chem. 2021, 56, 141–151. [Google Scholar] [CrossRef]
  5. de Almeida, G.C.; Mohallem, N.D.; Viana, M.M. Ag/GO/TiO2 nanocomposites: The role of the interfacial charge transfer for application in photocatalysis. Nanotechnology 2022, 33, 035710. [Google Scholar] [CrossRef]
  6. Byrne, C.; Dervin, S.; Hermosilla, D.; Merayo, N.; Blanco, A.; Hinder, S.; Harb, M.; Dionysiou, D.D.; Pillai, S.C. Solar light assisted photocatalytic degradation of 1,4-dioxane using high temperature stable anatase W-TiO2 nanocomposites. Catal. Today 2021, 380, 199–208. [Google Scholar] [CrossRef]
  7. Tao, J.; Luttrell, T.; Batzill, M. A two-dimensional phase of TiO2 with a reduced bandgap. Nat. Chem. 2011, 3, 296–300. [Google Scholar] [CrossRef]
  8. Sivkov, A.; Vympina, Y.; Ivashutenko, A.; Rakhmatullin, I.; Shanenkova, Y.; Nikitin, D.; Shanenkov, I. Plasma dynamic synthesis of highly defective fine titanium dioxide with tunable phase composition. Ceram. Int. 2022, 48, 10862–10873. [Google Scholar] [CrossRef]
  9. Buchalska, M.; Kobielusz, M.; Matuszek, A.; Pacia, M.; Wojtyła, S.; Macyk, W. On oxygen activation at rutile-and anatase-TiO2. ACS Catal. 2015, 5, 7424–7431. [Google Scholar] [CrossRef]
  10. Ji, Y.; Luo, Y. New mechanism for photocatalytic reduction of CO2 on the anatase TiO2 (101) surface: The essential role of oxygen vacancy. J. Am. Chem. Soc. 2016, 138, 15896–15902. [Google Scholar] [CrossRef]
  11. Estrada-Flores, S.; Martinez-Luevanos, A.; Perez-Berumen, C.M.; Garcia-Cerda, L.A.; Flores-Guia, T.E. Relationship between morphology; porosity, and the photocatalytic activity of TiO2 obtained by sol-gel method assisted with ionic and nonionic surfactants. Bol. La Soc. Esp. Ceram. Y Vidr. 2020, 59, 209–218. [Google Scholar] [CrossRef]
  12. Byrne, C.; Rhatigan, S.; Hermosilla, D.; Merayo, N.; Blanco, A.; Michel, M.C.; Hinder, S.; Nolan, M.; Pillai, S.C. Modification of TiO2 with hBN: High temperature anatase phase stabilisation and photocatalytic degradation of 1,4-dioxane. J. Phys.-Mater. 2020, 3, 015009. [Google Scholar] [CrossRef]
  13. Yu, Z.H.; Zhu, S.L.; Zhang, L.H.; Watanabe, S. Mesoporous single crystal titanium oxide microparticles for enhanced visible light photodegradation. Opt. Mater. 2022, 127, 112297. [Google Scholar] [CrossRef]
  14. Kumar, A.; Choudhary, P.; Krishnan, V. Selective and efficient aerobic oxidation of benzyl alcohols using plasmonic Au-TiO2: Influence of phase transformation on photocatalytic activity. Appl. Surf. Sci. 2022, 578, 151953. [Google Scholar] [CrossRef]
  15. Wu, J.M.; Xing, H. Facet-dependent decoration of TiO2 mesocrystals on TiO2 microcrystals for enhanced photoactivity. Nanotechnology 2020, 31, 025604. [Google Scholar] [CrossRef] [PubMed]
  16. Song, C.G.; Won, J.; Jang, I.; Choi, H. Fabrication of high-efficiency anatase TiO2 photocatalysts using electrospinning with ultra-violet treatment. J. Am. Ceram. Soc. 2021, 104, 4398–4407. [Google Scholar] [CrossRef]
  17. George, S.; Pokhrel, S.; Ji, Z.; Henderson, B.L.; Xia, T.; Li, L.; Zink, J.I.; Nel, A.E.; Mädler, L. Role of Fe doping in tuning the band gap of TiO2 for the photo-oxidation-induced cytotoxicity paradigm. J. Am. Chem. Soc. 2011, 133, 11270–11278. [Google Scholar] [CrossRef] [PubMed]
  18. Galindo-Hernandez, F.; Gomez, R.; De la Torre, A.I.R.; Mantilla, A.; Lartundo-Rojas, L.; Martinez, A.M.M.; Cipagauta-Diaz, S. Structural changes and photocatalytic aspects into anatase network after doping with cerium: Comprehensive study via radial distribution functions, electron density maps and molecular hardness. J. Photochem. Photobiol. A-Chem. 2022, 428, 113855. [Google Scholar] [CrossRef]
  19. Shymanovska, V.V.; Khalyavka, T.A.; Manuilov, E.V.; Gavrilko, T.A.; Aho, A.; Naumov, V.V.; Shcherban, N.D. Effect of surface doping of TiO2 powders with Fe ions on the structural, optical and photocatalytic properties of anatase and rutile. J. Phys. Chem. Solids 2022, 160, 110308. [Google Scholar] [CrossRef]
  20. Huang, J.X.; Li, D.G.; Li, R.B.; Chen, P.; Zhang, Q.X.; Liu, H.J.; Lv, W.Y.; Liu, G.G.; Feng, Y.P. One-step synthesis of phosphorus/oxygen co-doped g-C3N4/anatase TiO2 Z-scheme photocatalyst for significantly enhanced visible-light photocatalysis degradation of enrofloxacin. J. Hazard. Mater. 2020, 386, 121634. [Google Scholar] [CrossRef]
  21. Sudrajat, H.; Babel, S.; Hartuti, S.; Phanthuwongpakdee, J.; Laohhasurayotin, K.; Nguyen, T.K.; Tong, H.D. Origin of the overall water splitting activity over Rh/Cr2O3 @anatase TiO2 following UV-pretreatment. Int. J. Hydrog. Energy 2021, 46, 31228–31238. [Google Scholar] [CrossRef]
  22. Alshehri, A.; Narasimharao, K. PtOx-TiO2 anatase nanomaterials for photocatalytic reformation of methanol to hydrogen: Effect of TiO2 morphology. J. Mater. Res. Technol.-JmrT 2020, 9, 14907–14921. [Google Scholar] [CrossRef]
  23. Zhang, Q.; Li, C.Y. Effects of water-to-methanol ratio on the structural, optical and photocatalytic properties of titanium dioxide thin films prepared by mist chemical vapor deposition. Catal. Today 2020, 358, 172–176. [Google Scholar] [CrossRef]
  24. Alotaibi, A.M.; Williamson, B.A.D.; Sathasivam, S.; Kafizas, A.; Alqahtani, M.; Sotelo-Vazquez, C.; Buckeridge, J.; Wu, J.; Nair, S.P.; Scanlon, D.O.; et al. Enhanced Photocatalytic and Antibacterial Ability of Cu-Doped Anatase TiO2 Thin Films: Theory and Experiment. ACS Appl. Mater. Inter. 2020, 12, 15348–15361. [Google Scholar] [CrossRef] [PubMed]
  25. Wang, Q.Y.; Li, H.L.; Yu, X.L.; Jia, Y.; Chang, Y.; Gao, S.M. Morphology regulated Bi2WO6 nanoparticles on TiO2 nanotubes by solvothermal Sb3+ doping as effective photocatalysts for wastewater treatment. Electrochim. Acta 2020, 330, 135167. [Google Scholar] [CrossRef]
  26. Li, J.; Chu, B.X.; Xie, Z.; Deng, Y.Q.; Zhou, Y.M.; Dong, L.H.; Li, B.; Chen, Z.J. Mechanism and DFT study of degradation of organic pollutants on rare earth ions doped TiO2 photocatalysts prepared by sol-hydrothermal synthesis. Catal. Lett. 2022, 152, 489–502. [Google Scholar] [CrossRef]
  27. Nithya, N.; Gopi, S.; Bhoopathi, G. An Amalgam of Mg-Doped TiO2 Nanoparticles Prepared by Sol-Gel Method for Effective Antimicrobial and Photocatalytic Activity. J. Inorg. Organomet. Polym. Mater. 2021, 31, 4594–4607. [Google Scholar] [CrossRef]
  28. Barbierikova, Z.; Dvoranova, D.; Sofianou, M.V.; Trapalis, C.; Brezova, V. UV-induced reactions of Mg2+-doped anatase nanocrystals with exposed {001} facets: An EPR study. J. Catal. 2015, 331, 39–48. [Google Scholar] [CrossRef]
  29. Cao, T.H.; Liang, Y.Z.; Bao, Q.F.; Xu, C.L.; Bai, M.M.; Luo, T.; Gu, X.Y. A simple solvothermal preparation of Mg-doped anatase TiO2 and its self-cleaning application, solar energy. Sol. Energy 2023, 249, 12–20. [Google Scholar] [CrossRef]
  30. Sheldrick, G.M. Phase annealing in SHELX-90: Direct methods for larger structures. Acta Crystallogr. Sect. A Found. Crystallogr. 1990, 46, 467–473. [Google Scholar] [CrossRef]
  31. Cullity, B.D. Elements of X-ray Diffraction, 2nd ed.; Addison-Wesley: London, UK, 1978. [Google Scholar]
  32. Olowoyo, J.O.; Kumar, M.; Singhal, N.; Jain, S.L.; Babalola, J.O.; Vorontsov, A.V.; Kumar, U. Engineering and modeling the effect of Mg doping in TiO2 for enhanced photocatalytic reduction of CO2 to fuels. Catal. Sci. Technol. 2018, 8, 3686–3694. [Google Scholar] [CrossRef]
  33. Dong, W.X.; Zhao, G.L.; Song, B.; Xu, G.; Zhou, J.; Han, G.R. Surfactant-free fabrication of CaTiO3 butterfly-like dendrite via a simple one-step hydrothermal route. Crystengcomm 2012, 14, 6990–6997. [Google Scholar] [CrossRef]
  34. Zhang, J.; Sun, P.; Jiang, P.; Guo, Z.; Liu, W.; Lu, Q.; Cao, W. The formation mechanism of TiO2 polymorphs under hydrothermal conditions based on the structural evolution of [Ti(OH)h(H2O)6−h]4−h monomers. J. Mater. Chem. C 2019, 7, 5764–5771. [Google Scholar] [CrossRef]
  35. Kolker, A.; Pablo, J. Thermodynamic modeling of concentrated aqueous. Ind. Eng. Chem. Res. 1996, 35, 228–233. [Google Scholar] [CrossRef]
  36. Wang, C.C.; Wang, K.W.; Perng, T.P. Electron field emission from Fe-doped TiO2 nanotubes. Appl. Phys. Lett. 2010, 96, 143102. [Google Scholar] [CrossRef]
  37. Wang, Q.; Li, H.J.; Zhang, R.X.; Liu, Z.Z.; Deng, H.Y.; Cen, W.G.; Yan, Y.G.; Chen, Y.G. Oxygen vacancies boosted fast Mg2+ migration in solids at room temperature. Energy Storage Mater. 2022, 51, 630–637. [Google Scholar] [CrossRef]
  38. Ali, T.; Ahmed, A.; Siddique, M.N.; Alam, U.; Muneer, M.; Tripathi, P. Influence of Mg2+ ion on the optical and magnetic properties of TiO2 nanostructures: A key role of oxygen vacancy. Optik 2020, 223, 165340. [Google Scholar] [CrossRef]
  39. Dong, W.X.; Song, B.; Zhao, G.L.; Han, G.R. Controllable synthesis of CaTi2O4(OH)2 nanoflakes by a facile template-free process and its properties. Ceram. Int. 2013, 39, 6795–6803. [Google Scholar] [CrossRef]
  40. Nakamoto, K. Infrared and Raman Spectra of Inorganic and Coordination Compounds, Part B: Applications in Coordination, Organometallic, and Bioinorganic Chemistry; John Wiley & Sons: New York, NY, USA, 2009. [Google Scholar]
  41. Shivaraju, H.P.; Yashas, S.R.; Harini, R. Application of Mg-doped TiO2 coated buoyant clay hollow-spheres for photodegradation of organic pollutants in wastewater. Mater. Today Proc. 2020, 27, 1369–1374. [Google Scholar] [CrossRef]
  42. Deng, R.H.; Liu, S.H.; Li, J.Y.; Liao, Y.G.; Tao, J.; Zhu, J.T. Mesoporous block copolymer nanoparticles with tailored structures by hydrogen-bonding-assisted self-assembly. Adv. Mater. 2012, 24, 1889–1893. [Google Scholar] [CrossRef]
  43. Huang, W.; Cheng, H.; Feng, J.; Shi, Z.; Bai, D.; Li, L. Synthesis of highly water-dispersible N-doped anatase titania based on low temperature solvent-thermal method. Arab. J. Chem. 2018, 11, 871–879. [Google Scholar] [CrossRef]
  44. Singh, M.K.; Mehata, M.S. Enhanced photoinduced catalytic activity of transition metal ions incorporated TiO2 nanoparticles for degradation of organic dye: Absorption and photoluminescence spectroscopy. Opt. Mater. 2020, 109, 110309. [Google Scholar] [CrossRef]
  45. Bally, A.R.; Korobeinikova, E.N.; Schmid, P.E.; Levy, F.; Bussy, F. Structural and electrical properties of Fe-doped thin films. J. Phys. D Appl. Phys. 1998, 31, 1149. [Google Scholar] [CrossRef]
  46. Hoffmann, M.R.; Martin, S.T.; Choi, W.; Bahnemann, D.W. Environmental applications of semiconductor photocatalysis. Chem. Rev. 1995, 95, 69–96. [Google Scholar] [CrossRef]
  47. Augugliaro, V.; Loddo, V.; Marcì, G.; Palmisano, L.; López-Muñoz, M.J. Photocatalytic oxidation of cyanides in aqueous titanium dioxide suspensions. J. Catal. 1997, 166, 272–283. [Google Scholar] [CrossRef]
  48. Zubair, M.A.; Al Mamun, A.; McNamara, K.; Tofail, S.A.M.; Islam, F.; Lebedev, V.A. Amorphous interface oxide formed due to high amount of Sm doping (5–20 mol%) stabilizes finer size anatase and lowers indirect band gap. Appl. Surf. Sci. 2020, 529, 146967. [Google Scholar] [CrossRef]
  49. Ferreira-Neto, E.P.; Ullah, S.; Martinez, V.P.; Yabarrena, J.M.C.; Simões, M.B.; Perissinotto, A.P.; Wender, H.; De Vicente, F.S.; Noeske, P.-L.M.; Ribeiro, S.J. Thermally stable SiO2@TiO2 core@shell nanoparticles for application in photocatalytic self-cleaning ceramic tiles. Mater. Adv. 2021, 2, 2085–2096. [Google Scholar] [CrossRef]
  50. Kim, S.M.; In, I.; Park, S.Y. Study of photo-induced hydrophilicity and self-cleaning property of glass surfaces immobilized with TiO2 nanoparticles using catechol chemistry. Surf. Coat. Technol. 2016, 294, 75–82. [Google Scholar] [CrossRef]
  51. Li, K.; Yao, W.; Liu, Y.; Wang, Q.; Jiang, G.; Wu, Y.; Lu, L. Wetting and anti-fouling properties of groove-like microstructured surfaces for architectural ceramics. Ceram. Int. 2022, 48, 6497–6505. [Google Scholar] [CrossRef]
  52. Akarsu, M.; Burunkaya, E.; Tunalı, A.; Selli, N.T.; Arpaç, E. Enhancement of hybrid sol–gel coating and industrial application on polished porcelain stoneware tiles and investigation of the performance. Ceram. Int. 2014, 40, 6533–6540. [Google Scholar] [CrossRef]
Figure 1. Schematic diagram of Mg-doped TiO2 sample preparation.
Inorganics 11 00341 g001
Figure 2. Schematic diagram of the glaze firing processes.
Inorganics 11 00341 g002
Figure 3. XRD patterns of the samples with different volume ratios of water: ethanol: (a) 15: 0, (b) 12.5:2.5, (c) 10:5, (d) 7.5:7.5, (e) undoped TiO2 (12.5:2.5).
Inorganics 11 00341 g003
Figure 4. SEM images of TiO2 with different volume ratios of water: ethanol (a) 15:0, (b) 12.5:2.5, (c) 10:5, (d) 7.5:7.5.
Inorganics 11 00341 g004
Figure 5. (a) TEM images and SAED pattern, (b) HRTEM images, (c,d) EDX spectra. (ac) Mg-doped sample prepared using Vwater/Vethnol = 12.5:2.5, (d) pure TiO2 sample prepared using Vwater/Vethnol = 12.5:2.5.
Inorganics 11 00341 g005
Figure 6. XPS spectra of the undoped TiO2 and Mg-doped TiO2 samples prepared using Vwater/Vethnol ratio of 15:0 (a) Ti, (b) O, (c) Mg.
Inorganics 11 00341 g006
Figure 7. FT-IR spectrum of the typical samples: (a) undoped TiO2, (b) Mg-doped TiO2 samples prepared using Vwater/Vethnol ratio of 15:0, (c) Mg-doped TiO2 samples prepared using Vwater/Vethnol ratio of 12.5:2.5.
Inorganics 11 00341 g007
Figure 8. N2 adsorption-desorption isotherm samples with different ratio of water: ethanol (a) doped TiO2 12.5:2.5, (b) doped TiO2 10:5, (c) undoped TiO2 12.5:2.5.
Inorganics 11 00341 g008
Figure 9. UV-Vis spectra of TiO2 with different rate of water: ethanol (a) 15:0, (b) 12.5:2.5, (c) 10:5, (d) 7.5:7.5, (e) undoped TiO2 12.5:2.5.
Inorganics 11 00341 g009
Figure 10. (a) Photocatalytic performance, (b) Kinetic curves of ln(C0/C) as a function of irradiation time for RhB bleaching under visible light irradiation: (a) 15:0, (b) 12.5:2.5, (c) 10:5, (d) 7.5:7.5 of the Mg-doped samples, (e) Mg-undoped TiO2 sample, (f) without photocatalyst.
Inorganics 11 00341 g010
Figure 11. Schematic representation of photo processes using Mg-doped TiO2 photocatalysts (a) and the self-cleaning process using Mg-doped TiO2 in glaze sample (b), respectively.
Inorganics 11 00341 g011
Figure 12. Wetting angle of Mg-undoped TiO2 glaze sample prepared at Vwater/Vethanol of 12.5:2.5, and Mg-doped TiO2 glaze samples with various Vwater/Vethanol ratios in dark and daylight illumination (a), respectively; SEM images of the Mg-doped TiO2 glazes prepared using Vwater/Vethano of 12.5:2.5 (b) and pure TiO2 glaze prepared using Vwater/Vethano of 12.5:2.5 (c); AFM surfaces of the Mg-doped TiO2 glaze (d) and pure TiO2 glaze sample (e) with Vwater/Vethano of 12.5:2.5, respectively.
Inorganics 11 00341 g012
Figure 13. Photos of the as-prepared samples immediately meeting the water in this study (a) Mg-undoped TiO2 in glaze sample, (b) Mg-doped TiO2 in glaze sample.
Inorganics 11 00341 g013
Table 1. Effect of different ratios of water: ethanol in the solvent on the crystal size, BET surface area, pore size, pore volume, and cell volume of Mg-doped TiO2.
Vwater/VethnolCrystal Size
(nm)
BET
(m2/g)
Pore Size
(nm)
Pore Volume
(cm3/g)
Cell Volume
Ǻ3
Mg-doped TiO215:013.615213.80.415136.458
12.5:2.513.214812.50.402136.315
10:510.310512.40.378136.452
7.5:7.58.110112.00.350136.689
Pure TiO212.5:2.514.09811.20.340136.089
Table 2. Performances of Mg-doped TiO2 in the ceramic samples obtained in this study and from other literature studies.
TypeFiring Temperature
(°C)
Water Contact Angle (°)Stain ResistanceRef.
Before UseIrradiation after Use
Mg-doped TiO2 in glaze sample1180~12005.6235.124After dripping water droplets, the blot floats as a wholeThis work
TiO2 doped in glaze sample1180~120012.2613.56Not floatingThis work
The commercial self-cleaning ceramic products1180~120021.2328.96Not floatingThis work
C-PEG/TiO2 coating-2611Blot cannot be completely removed[50]
Commercial ceramic tiles with groove-like microstructure surfaces-164.75-Blot cannot be completely removed[51]
Hybrid sol–gel coating and industrial application on
polished porcelain stoneware tiles
---With the help of cleaning agent, the stains can be removed from the surface[52]
Disclaimer/Publisher’s Note: The statements, opinions and data contained in all publications are solely those of the individual author(s) and contributor(s) and not of MDPI and/or the editor(s). MDPI and/or the editor(s) disclaim responsibility for any injury to people or property resulting from any ideas, methods, instructions or products referred to in the content.

