Article

Simultaneous Quantification of Fullerenes C60 and C70 in Organic Solvents by Excitation–Emission Matrix Fluorescence Spectroscopy

by
Ivan V. Mikheev
1,
Viktor A. Verkhovskii
1,
Sofiya M. Byvsheva
1,
Dmitry S. Volkov
1,
Mikhail A. Proskurnin
1,* and
Vladimir K. Ivanov
2,*
1
Chemistry Department, Lomonosov Moscow State University, Leninskie Gory, 1-3, GSP-1, Moscow 119991, Russia
2
Kurnakov Institute of General and Inorganic Chemistry, Russian Academy of Sciences, Moscow 117901, Russia
*
Authors to whom correspondence should be addressed.
Inorganics 2023, 11(4), 136; https://doi.org/10.3390/inorganics11040136
Submission received: 19 February 2023 / Revised: 17 March 2023 / Accepted: 21 March 2023 / Published: 23 March 2023
(This article belongs to the Special Issue Advances in Fullerene Science)

Abstract

:
Excitation–emission matrix (EEM) fluorescence spectroscopy of unmodified (pristine) fullerenes C60 and C70 in benzene, toluene, and n-hexane at room temperature was used for their quantification by their solvent-dependent EEM bands specific to each fullerene. The intensity and parameters of fluorescence depend on both the fullerene and solvent and provide the conditions for the quantification of both fullerenes in their mixtures without separation. The detection limits for C60 in n-hexane and C70 in benzene under the selected conditions are 7 and 2 nmol/L, respectively. The approach was tested for model and real mixtures of fullerenes C60 and C70.

Graphical Abstract

1. Introduction

Fullerenes have been studied intensively over several decades owing to their physicochemical properties and biological activity [1] which allow for their use in various fields, including materials science [2], photovoltaics [3], electrochemistry, and biomedicine [4]. Development of novel fullerene-based nano-structured materials and the demand for the purification of fullerenes and fullerene soot call for the methods for composition control. Though fullerenes find a wide variety of applications, large-scale synthesis and separation is still a significant challenge. Regardless of the fullerene required, the goal is to produce and isolate macroscopic quantities of purified and pristine materials. The most efficient methods for fullerene separation that have industrial potential are selective complexation, chromatography, and fractional crystallization. Advanced chromatographic techniques, e.g., involving metal–organic frameworks as stationary phases, are cost-effective and efficient enough to achieve large-scale pure fullerene production [5].
Current applications of fullerenes and their mixtures demand the determination of low concentrations, which limits the selection of analytical methods. For the detection of fullerenes, either molecular spectroscopy or mass spectrometry (MS) have been used due to excellent response times [6]. UV-vis detection is also commonly used with capillary electrophoresis techniques. Mathematical algorithms for spectrophotometric quantification make it possible to reduce the quantification uncertainty [7]. Since it is generally required to analyze the composition of product mixtures in situ or with minimal sample preparation, methods for the assessment of solid mixtures are being developed, e.g., near-IR spectrophotometry [8] or Raman spectroscopy [9] for mixtures of fullerenes C60 and C70. Nevertheless, MS with various mass analyzers (time-of-flight, quadrupole, etc.) provides better selectivity, differentiates fullerenes by their molecular weight, and provides structural information, e.g., on the presence of functional groups or addends [10,11,12,13]. However, these techniques often require special sample preparation, expensive equipment, etc. They also may require a screening procedure. Thus, alternative techniques for rapid and simple but sensitive quantification of fullerenes are demanded.
Such a quantification/screening technique could be based on luminescence spectroscopy of organic fullerene solutions, especially for solvents with high fullerene solubilities. As a highly sensitive spectrochemical method, luminescence spectroscopy is used for the monitoring and characterization of fullerene derivatives, along with liquid chromatography (LC) MS, MALDI, NMR, etc. [14,15]. In fact, the majority of papers deal with approaches to elucidating the physicochemical or photophysical parameters of specific fullerene solutions, and the studies are focused on their luminescence properties at different conditions, especially at the low temperatures (in frozen matrices) that are required for revealing fullerene–solvent structures [15,16,17,18,19,20,21,22,23,24]. The most studied fullerene is C60; luminescence in various organic solvents is used for its properties determination in different conditions and states [16,17,18,19]. Additionally, the fluorescence spectra of C70 solutions in n-hexane, benzene, and dichloromethane demonstrate the quenching properties of this fullerene due to the formation of stable charge-transfer complexes with electron-donating compounds (e.g., porphyrin rings, etc.) [15]. The aggregation of fullerenes in solution was studied for C60 and C70 [20,21]. In addition, the luminescence of C60 and C70 in thin films was studied. Fullerenes exhibit thermally-activated delayed fluorescence (TADF), which can be used to assess some photophysical parameters [22,23]. This effect also allows for the use of fullerenes as optical sensors of temperature or oxygen under extreme conditions [24]. Thus, the studies of luminescence properties are rather extended and provide information on the differences in the luminescence spectra of fullerenes, though comparison studies of fullerenes are not common [15,16,17,18,19,20,21,22,23,24].
However, the conditions for the analytical determination of fullerenes in organic solvents by fluorescence at room conditions have not been established yet, and there is no estimation of the limits of detection (LOD or cmin) of fullerenes under these conditions. Moreover, state-of-the-art techniques of fluorescence spectroscopy, especially excitation–emission matrix fluorescence spectroscopy (EEM), have not been used for unmodified (pristine) fullerene quantification at room temperature; the existing data are for fluorescence/phosphorescence at low temperatures [16,17,18,19]. However, this method is well suited for the rapid and accurate assessment of fullerenes, and EEM advantages for the analysis and assessment of independent fluorescent components in a mixture have been described in detail [25,26].
Thus, this paper is focused on evaluating the possibilities of EEM fluorescence spectroscopy at room temperature with minimum sample preparation for the quantitative determination of fullerenes C60 and C70 and their mixtures in organic solutions.

2. Results and Discussion

The optical properties of fullerenes have been investigated in various solvents, including toluene, dichlorobenzene, CS2, acetonitrile, hexane, cyclohexane, methylcyclohexane, and other alkanes [27]. In this study, toluene, benzene, and n-hexane were selected due to their different chemical structures, polarity, and proper solubility of both fullerenes and due to the previously reported intense fullerene luminescence in these solvents. The solvents individual dipole moments (µ, D) are 0.375 D, 0 D, and 0.09 D and dielectric constants (ε) of 2.38, 2.28, and 1.89 for toluene, benzene, and n-hexane, respectively [28,29].
To obtain reproducible fullerene EEM fluorescence spectra in the concentration range for test fullerenes, 0.03–50 μM, the necessary sizes of the emission and excitation slits to obtain stable, reproducible, and intense fluorescence signals were 20 nm. To increase the sensitivity, the detector voltage was set to at least 800 V.
EEM for neat solvents were obtained to find the background picture under the selected conditions (Figure 1). In all the solvents, there is a relatively low-intensive and broad emission region at 360–550 nm with a maximum at ca. 400 nm corresponding to 300–350 nm excitation. We also observed solvent-specific spectral regions. EEM reveals the region below the isoenergetic line: in benzene, excitation of 250–290 nm and emission of 550–750 nm and, in toluene, excitation of 280–330 nm and emission of 600–800 nm. Similar EEM results were previously observed in these solvents for other solutes [18,30]. In n-hexane, there is a broad area, excitation of 270–280 nm, and emission of 600–750 nm.
The absorption spectra of fullerenes are presented in Figure 2. They show higher absorptivities for C70 in the whole region as expected [31] and show characteristic maxima for C60 in n-hexane at 256, 326, 375, 387, 392, 404, 541, 593, 615, 660, and 728 nm; and for C70 in benzene at 361, 379, 469, 546, 596, 613, 639, 660, and 687 nm, which are in a good agreement with the recently reported data [32].

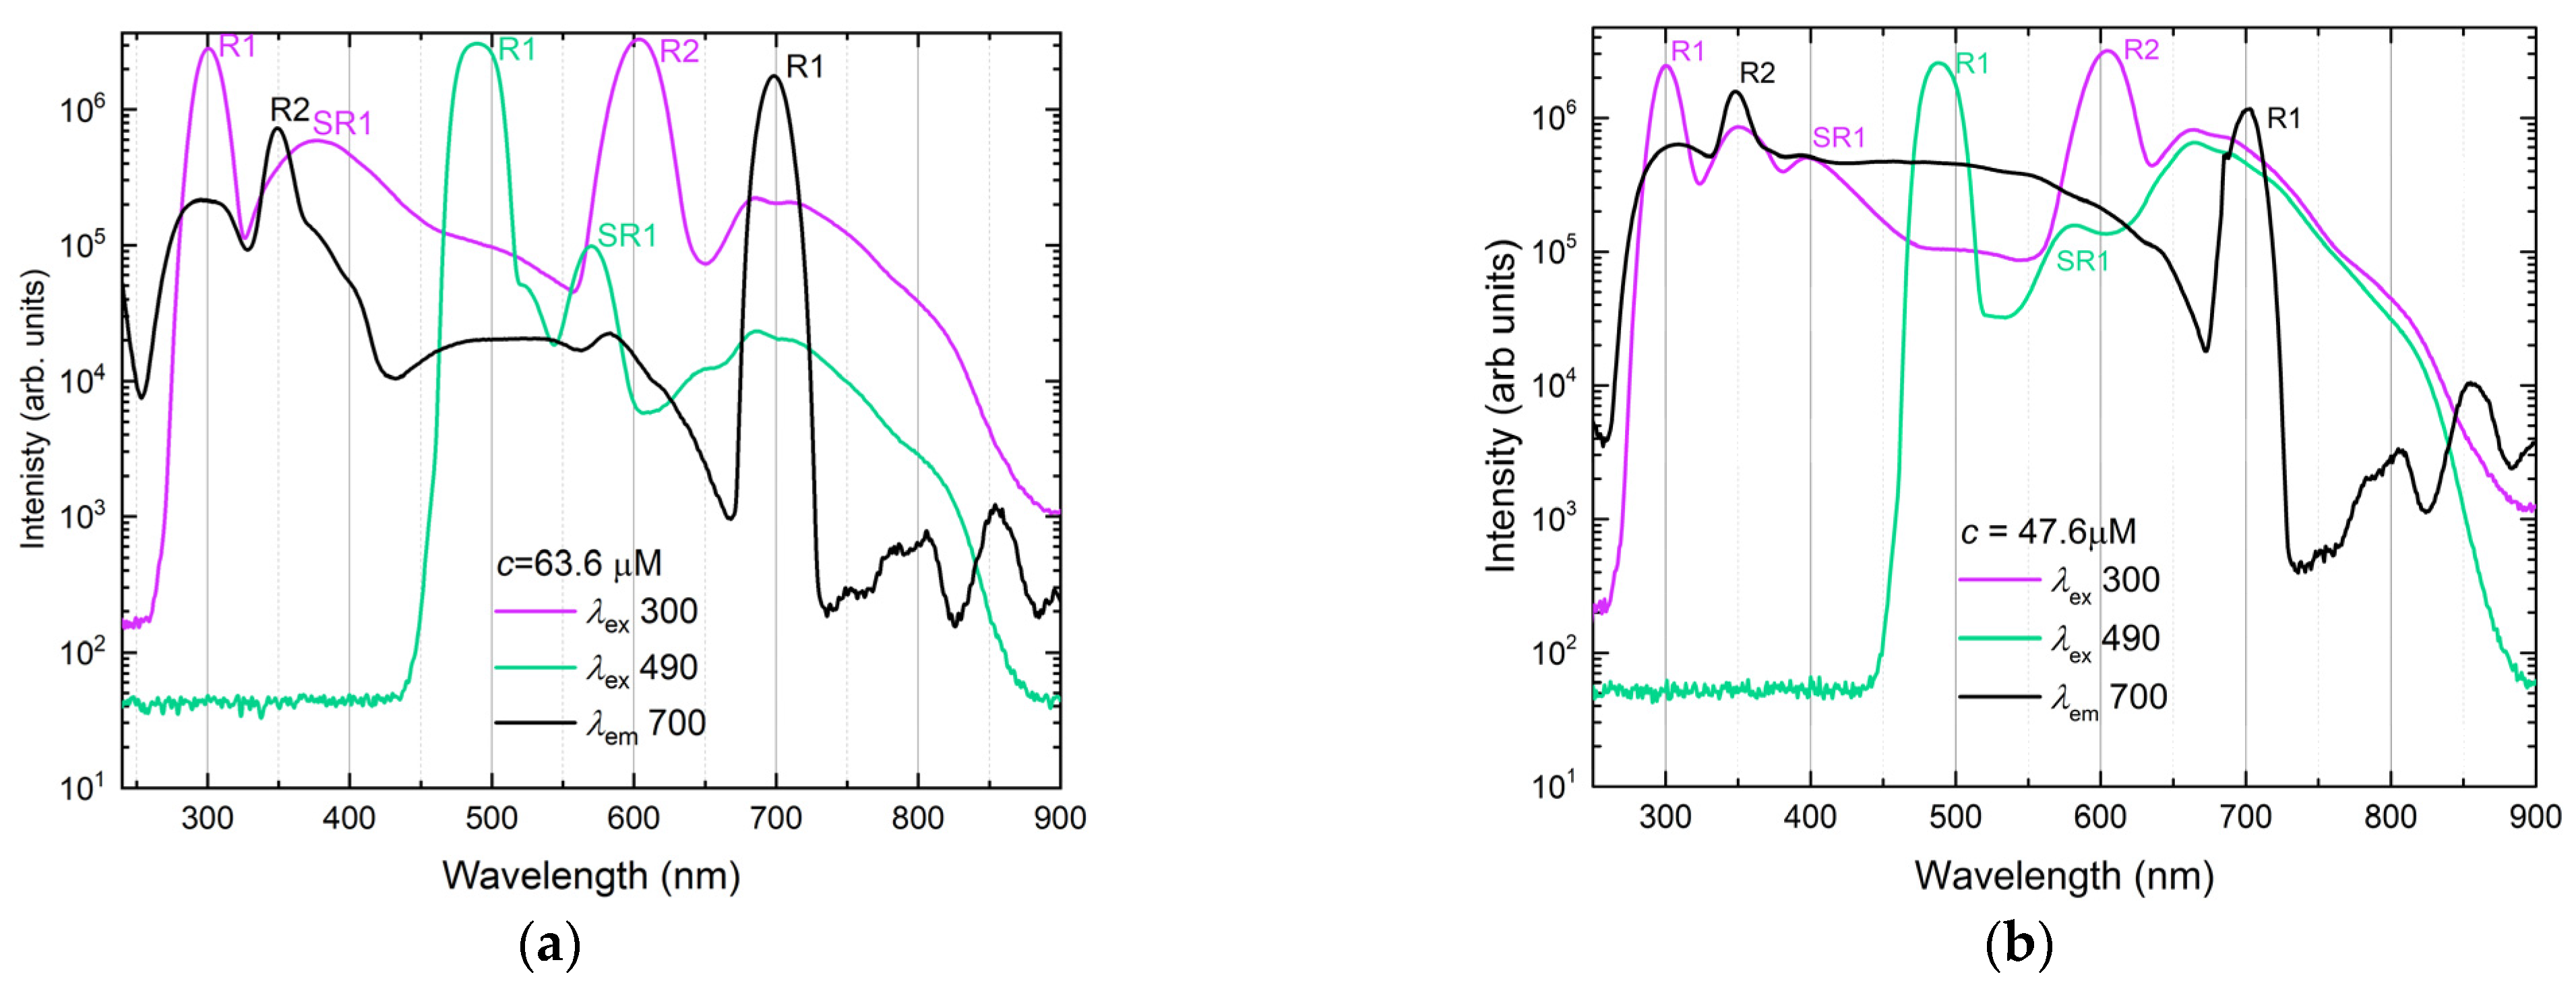
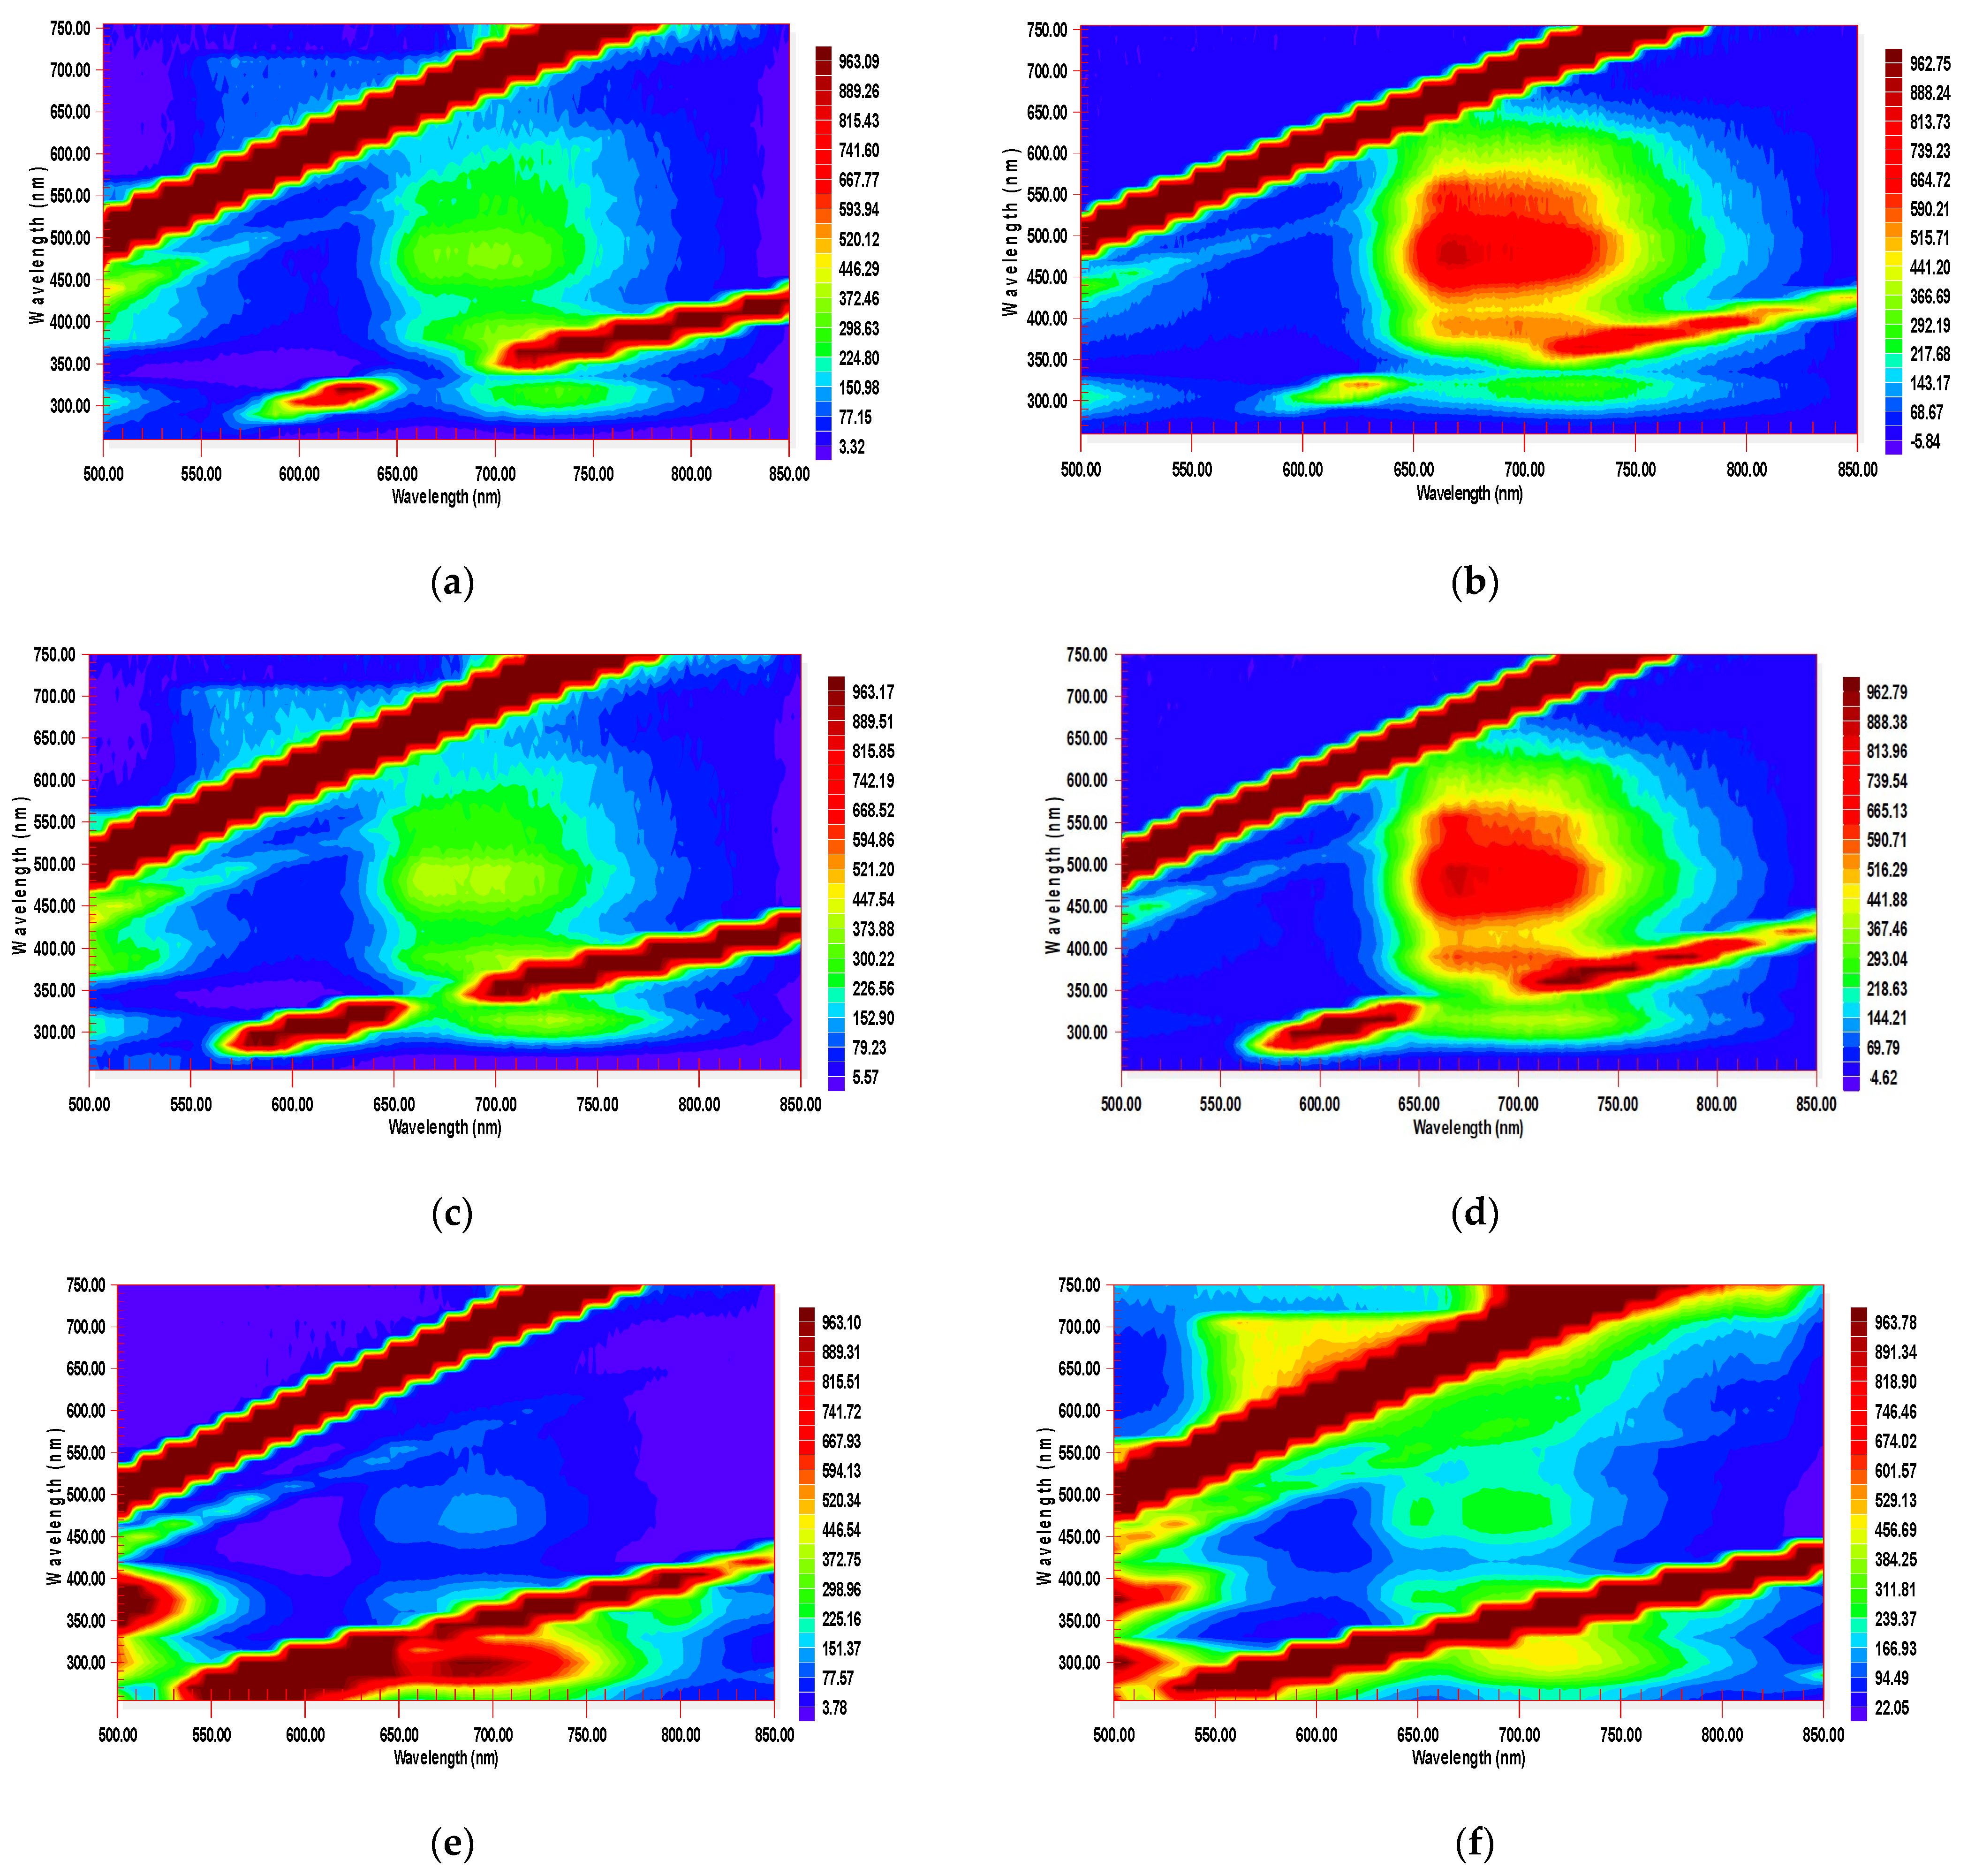
2.1. EEM Features of C60

EEM of C60 in all three solvents show the same characteristic features, hereafter referred to as Regions A, B, and C (Figure 3). The intensities of all the regions depend on the concentration of C60 (Figure 4a,b).
Region A at excitation wavelengths of 470–600 nm is a set of weak red-emission peaks at 650–760 nm, which can both be attributed to prompting fluorescence and TADF [23]. This band is the strongest in benzene (Figure 3a), much less intense in toluene (Figure 3b), and nearly absent in n-hexane (Figure 3c). The data for C60 in toluene are in accordance with the emission peak positions at 77 K [33,34]. Maxima at 690 (ca. 14,500 cm−1), 710 (ca. 14,000 cm−1), and, weaker, 740 nm (ca. 13,700 cm−1), correspond to S1 → S0 [27,35]. The whole emission region is broader than that reported elsewhere [33,34] and somewhat blue-shifted (wavenumbers of 32,500–32,700 cm−1), which can be attributed to solvent relaxation at room temperature compared to frozen matrices at 77 K [33]. As expected, the bands are less pronounced compared to the low temperatures reported by Sibley et al. and Palewska et al. [33,36], but are distinct enough to make quantitative estimations under the selected excitation and detection conditions.
Region B is located at 650–770 nm emission and 270–320 nm excitation, corresponding to the absorption bands of 11Ag transitions [37], mainly below the 2nd-order Rayleigh and 2nd-order Stokes Raman scattering of solvents (Figure 4) and is usually assigned to TADF [22,23]. It is broader than Region A. In all three solvents, Region B demonstrates higher intensities than Region A due to the excitation by the primary absorption band of C60 (330 nm; 31T1u ← 11Ag transition, Figure 2) [32,37]. A more detailed picture of this region using lower slit widths shows two neighboring EEM bands at 730 and 620 nm (13,700 and 16,100 cm−1, Figure 5). The former corresponds to S1 → S0 transition components. Benzene and toluene solutions of C60 show a red shift in emission maxima at 715 nm compared to n-hexane by approximately 20 nm as expected from different solvent dipole moments and complexation [38]. The band at 620 nm is the 0–0 transition [18], and its position only slightly depends on the solvent.
A relatively low-intensive region (region C) at 460–550 nm with a maximum of 400 nm corresponding to 300–350 nm excitation (Figure 4) is revealed in all the solvents. It lies in the range that can be attributed to the solvent (Figure 1) [39]; however, under the same conditions, the intensities in this region are much higher than for the pure solvents. Most probably, the increase in the band intensity is due to the formation of fullerene–solvent complexes [38], which manifest themselves both in fullerene and solvent fluorescence enhancement [27], but this subject was out of the scope of this study.
It is noteworthy that the presence of a fullerene also increases the intensity of the Stokes Raman bands of the solvent, and this effect becomes more pronounced with increasing fullerene concentration (see Figure 1 and Figure 4). The intensity in this region is well pronounced in toluene and n-hexane and less pronounced in benzene.

2.2. EEM Features of C70

EEM for C70 (Figure 6) show the same Regions A, B, and C, though they are more similar from solvent to solvent compared to C60. The intensities in all the regions depend on the concentration of C70 (Figure 4).
Compared to C60, a much broader Region A at 14,000–15,000 cm−1 corresponding to S1 → S0, is observed with two maxima: at 640–740 nm at excitation wavelengths of 450–550 nm (ca. 18,000–22,000 cm−1). The intensity of this region is much higher than for C60 (compare Figure 3 and Figure 6) due to much more pronounced TADF of C70 due to its different symmetry [22,23]. This area can be seen in all the three solvents, although is much less intense in n-hexane. The latter is due to much lower ground-state complexation in non-aromatic solvents [40]. Another maximum in Region A, somewhat less pronounced and overlapping with the 1st-order Stokes Raman line of the solvent, has the emission range of 660–680 nm, while agrees with longer excitation wavelengths of 520–540 nm; this maximum is clearly visible in aromatic solvents, and is much less pronounced in n-hexane. This maximum agrees with EEM maps of C60, though for C70 it is shifted to the shorter emission wavelengths. The strongest emission peak corresponding to S1 → S0 transition is ca. 680 nm [33]. It shifts to 670 nm (ca. 14,900 cm−1) and 680 nm (ca. 14,500 cm−1) in benzene and toluene and to 650 nm (ca. 15,400 cm−1) in n-hexane in accordance with the existing low-temperature data. Other maxima corresponding to S1 → S0 transition components are at 706 and 740 nm in aromatic solvents, which are 690 and 730 nm (ca. 13,700 cm−1) in n-hexane. As for C60, the whole area is broader than reported elsewhere in [33,34] and shifted toward shorter excitation wavelengths, which can be attributed to the effect of solvent relaxation compared to frozen matrices at 77 K.
As in the case of C60, Region B is more intense than Region A due to the high absorptivity of absorption (excitation) bands in this region (Figure 2) and has the primary emission maximum at 660–680 nm (S1 → S0 transition). Compared to C60, Region B shows much higher intensities, as was shown previously [22,23], and a more pronounced double structure than C60; however, it overlaps much more with the 2nd-order Rayleigh scattering and 2nd-order Stokes Raman lines. Its highest intensity is observed in toluene, is lower in benzene, and much lower in n-hexane.
In Region C at the short wavelength range (350–450 nm emission at 290–310 nm excitation in toluene and benzene), fluorescence intensity is higher in benzene compared to toluene (see Figure 6a,b). The position of this area shifts, broadens, and is much more intense in n-hexane: it corresponds to an emission range of 340–470 nm, as for C60.
Over Region C, there is another fluorescence region (emission at 400–540 nm, excitation at 340–400 nm), where the fluorescence intensity for the benzene or toluene solutions is low, while quite high for n-hexane solutions (Figure 6). For this region, the position and the intensity of the absorption band (~400 nm) are sensitive to the environment [31]. This region is not detectable for C60 due to its very low absorptivity in this range (Figure 2).
It is noteworthy that most intense peaks for both C60 and C70, corresponding to short-wave excitation (290–350 nm, Regions B and C), show higher intensity in n-hexane. While long-wave excitation areas (430–560 nm, Region A) have significantly lower intensities in n-hexane compared to aromatic solvents. This fact is partially attributed to the differences in the deformation of fullerene molecules in various solvents [33]. The differences are more pronounced compared to these features at low temperatures (5–77 K) [33,34,36]. Such dependences may be caused by the differences of fullerene structures or different stacking interactions between fullerenes and solvents [17,41] and, due to changes in the incorporation of the solvent into fullerenes structures [27] and complex formation [42], this subject was out of the scope of this study.

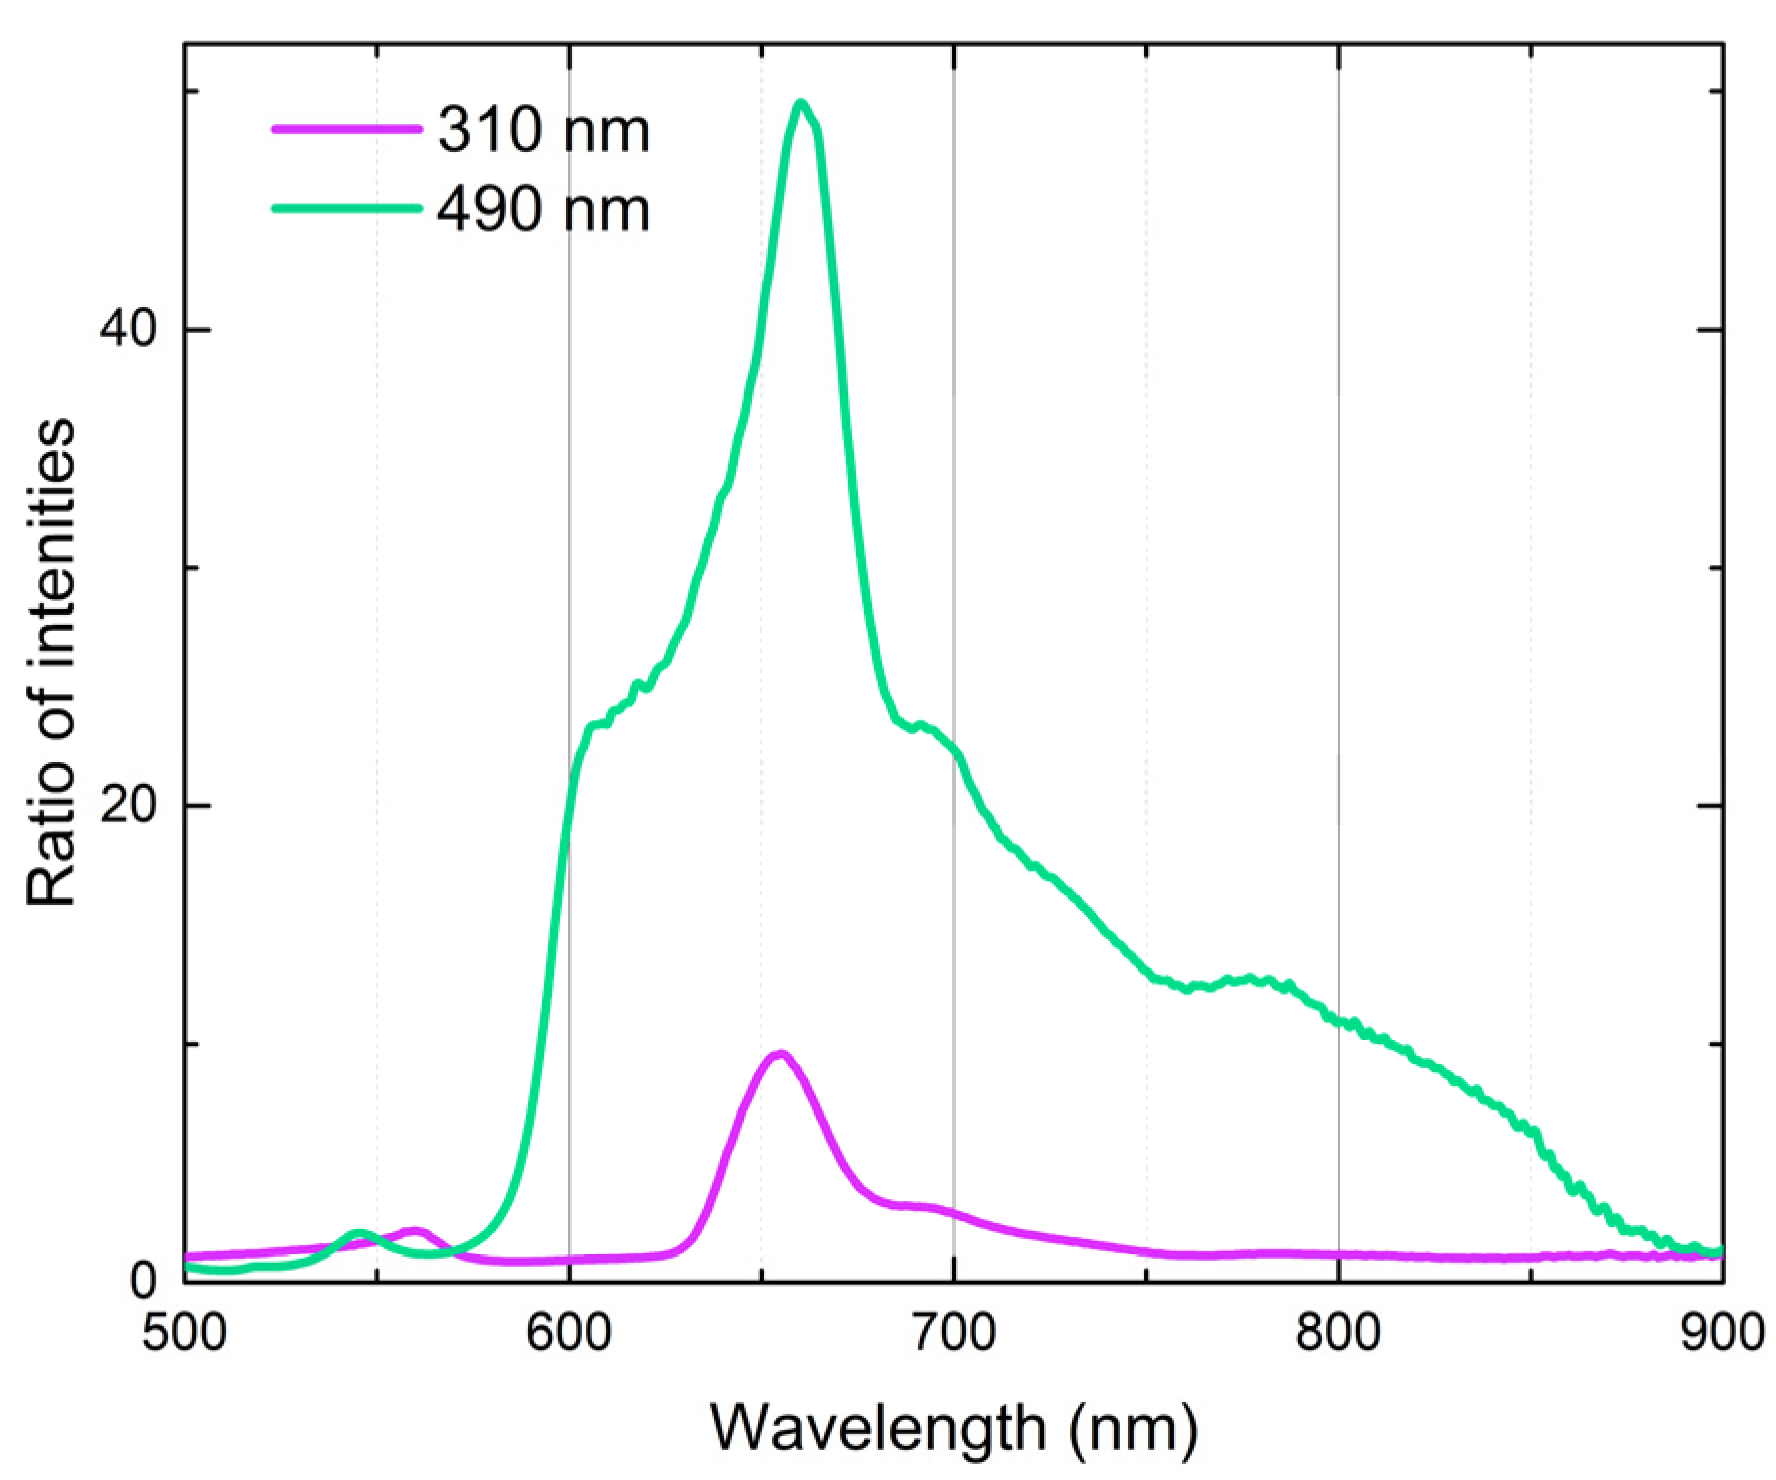
2.3. Performance Parameters

The comparison of fullerenes C60 and C70 (Figure 3 and Figure 6) shows that they are characterized by three EEM regions with distinct maxima with higher intensities at long-wave excitation, although band structures in Regions A and B are different for C60 and C70. The total fluorescence intensity of C70 is the highest in toluene and the lowest in n-hexane. On the contrary, the intensity in Region B for C60 is the highest in n-hexane and the lowest in benzene. These effects can be used for fullerene quantification in mixtures. Thus, the determination of C70 was made in benzene and C60 in n-hexane (Figure 2 and Figure 4, Table 1).
Thus, we selected long-wave excitation conditions for C70, while retaining shortwave excitation conditions for C60. The conditions selected for quantification and performance parameters for individual fullerenes are summed up in Table 1. Fluorescence features of solvents (Figure 1) do not have a significant impact on the fullerene quantification as they mainly show responses in other regions compared to fullerenes. The intensities of these areas do not change depending on the fullerene and its concentration.
Fluorescence emission and excitation spectra of C60 for the selected conditions (single-wavelength excitation) are shown in Figure 7, a. Fluorescence excitation spectra show bands with main maxima at 310 (31T1u ← 11Ag) and 370 nm (21T1u ← 11Ag) as well as at 405 nm (shoulder), corresponding to Hg → 11T1u [27]. The bands at 570 nm, 590 nm, and 620 nm (shoulder) correspond to S0 → S1 absorption components (Figure 2 and Figure 7); probable weak T–T absorption components contribute to the absorption at the wavelengths above 800 nm. Weak maxima at 745 and 760 nm, which can be revealed by the analysis of the second-derivatives of the spectra, may be attributed to the fullerene aggregates [32]. In fluorescence spectra at short-wave excitation, the main overlapped bands of Region B lay at 600–800 nm as previously reported for room and low temperatures [15,16,17,18,19,33,36,43]. In fluorescence spectra at a long-wave excitation of 490 nm, the structure and positions of these bands do not change, but a band at 620 nm, hidden by 2nd-order Rayleigh scattering at short-wave excitation, is revealed.
Fluorescence emission and excitation spectra of C70 under selected conditions are shown in Figure 7b. Excitation spectra are similar to C60. As for C60, major fluorescence bands are in the same areas (at 600–800 nm with the maximum at 688 and 707 nm, and a weak at 747 nm). Thus, under the selected conditions, the largest difference is in the position of the main maximum of the S1 → S0 band—662 nm for C70 and 688 nm for C60. Fluorescence intensity in n-hexane is much lower than that in benzene and toluene. Compared to C60, the same red shift for aromatic solvents is observed for the long-wave maxima due to ground state complexation [40].
Thus, the spectra show that, in all the studied range, C60 fluorescence is always accompanied by the fluorescence of C70, while in the range 580–800 nm, around the S1 → S0 transition, the fluorescence of C70 exceeds the fluorescence of C60 by more than an order, which agrees well with calculated oscillator strengths [33]. Therefore, we selected the wavelength of 660 nm under the long-wave excitation for the quantification of C70 as, at this wavelength, the contribution from C60 is less than 2% (Figure 8).
Model mixtures with similar concentrations of fullerenes show characteristic EEM ranges for both fullerenes, and shortwave excitation areas overlap (Figure 4 and Figure 7). For short-wave excitation (310 nm), the wavelength of 740 nm was selected as, at this wavelength, C60 shows high sensitivity, while the contribution from C70 is 50%. Thus, C60 can be found as the difference between the sum at 740 nm and the value for C70. As the contributions from both fullerenes are the same, the calibration can be made by C60.
Linear ranges for fullerenes C60 and C70 determined at the same detection conditions are different in different solvents. For complex molecules such as fullerenes, which contain a substantial system of double bonds, quenching [44] may occur by way of a wide range of mechanisms, for instance, concentration quenching or self-quenching. Therefore, for C70, we divided the calibration curve into linear ranges 0.03 ÷ 0.10 and 0.10 ÷ 0.35 μM for trace and medium concentrations (Table 1).
LODs for both fullerenes are several nM (Table 1), which is 104 times lower in comparison with the spectrophotometry, 10–30 µM [45,46]. LC techniques (all for C60 in toluene) provide limits of detection of fullerenes at the nanomolar level: LC-ESI-MS, 0.03 nM [11]; LC-APCI-MS, 4 nM [12], LC-UV, 700 nM [13]. Thus, the proposed approach shows lower sensitivity compared to LC-MS but better LODs compared to other detection techniques. However, the proposed approach shows much rapidity—about 5 min for measuring two solutions in toluene and n-hexane. This exceeds the performance of chromatography techniques and can be considered a basis for screening for LC–MS analysis.
Although Region C cannot be unambiguously attributed to fullerene fluorescence, or probably to the fluorescence amplification of the solvent, the intensity in this region is proportional to the fullerene concentration (Figure 3 and Table 1); thus, it was also tested for fullerene quantification. Under the same excitation power as above (300 nm excitation, slit widths, 20/20 nm), the calibration linearity is good and the LOD, 1 nM, is better than that of the spectrophotometry, which is 30 µM [45].

2.4. Real Sample Analysis

Based on different fluorescence properties of C60 and C70 in benzene and n-hexane, and the suitable quantification sensitivity (Table 1), we analyzed mixtures of fullerenes without their separation (Figure 9). As model samples, we used mixtures C60 and C70 from 1:1 to 5:1 prepared from individual fullerenes; the error for both components under the selected conditions did not exceed 10%.
A real sample with certified values for C60 and C70 was an unseparated (raw) technological mixture produced by fullerene soot production in a direct current arc plasma in a helium atmosphere at a pressure of 13.3 kPa; the method has remained the most effective until recently [47].
The comparison of the EEM spectra of a real technological mixture and a mixture reveals considerable differences. In benzene, in the range of excitation wavelengths of 450–500 nm and emission wavelengths of 650–700 nm, in Region A—which is more intense for C70—the intensity of the technological mixture is lower (Figure 9). Spectra of these mixtures in n-hexane showed that the fluorescence intensity at emission wavelengths of 600–750 nm with excitation at 280–320 nm is higher in Region B of the technological mixture (Figure 9).
The analysis of the technological mixture under the conditions denoted in Table 1 results in 92 ± 3% wt. of C60 and 8 ± 2% wt. of C70 (n = 3, p = 0.95), which provides a value of the C60/C70 ratio of 11.5 ± 1.2. The mean values differ insignificantly from the estimated values (90 ± 5% wt. and 10 ± 5% wt., respectively) provided by the manufacturer. The precision of measurements using the proposed approach is higher than that of the results provided by the manufacturer. The accuracy estimation was conducted using spike additions of standard reference materials of C60 and C70.
The consistency of the results obtained using the developed fluorimetry procedure have been checked according to Vierordt’s spectrophotometric method (Appendix A), which is used for simultaneous estimation of C60 and C70 in their binary mixture in toluene [48]. For the tested technological mixture, UV/vis measurements, according to Vierordt’s approach, provided a mass ratio of 10.5 ± 1.1 for the molar concentrations in the solution c C 60 = 18.2 ± 1.2 µM and c C 70 = 1.49 ± 0.16 µM (n = 3, p = 0.95). Thus, the C60/C70 mass ratio agrees well with the fluorescence data despite the high components ratio value.

3. Materials and Methods

High-pure fullerene C60, 99.5% and fullerene C70, 99% (both, LLC Neo Tech Product, St. Petersburg, Russia), and an unseparated extract (a technological mixture, lot PD-1) of fullerenes C60 (90 ± 5%, estimated value) and C70 (10 ± 5%, estimated value) from Fullerene Technology Company (St. Petersburg, Russia) were used. Chemically pure toluene, benzene, and n-hexane (LLC Reakhim, Moscow, Russia) were used throughout. For the preparation of solutions and sampling, Biohit Proline Plus mechanical automatic dispensers (Biohit Group Sartorius, Helsinki, Finland) were used. All solutions were prepared in Class A glass volumetric flasks with volumes of 25.00 and 50.00 mL (LLC Labtekh, Moscow, Russia). For sampling, 15 mL polypropylene test tubes were used (Axygen, Mexico). To improve the dissolution of fullerenes, a GRAD 180-35 ultrasonic bath (LLC Grad-Technology, Moscow, Russia) was used.
Samples of pristine fullerenes or the technological mixture were transferred into volumetric flasks. Next, up to 15 mL of the appropriate solvent (toluene, benzene, or n-hexane) was added. The flasks were placed into an ultrasonic bath for complete dissolution of fullerenes. After sonication, the solvent was added to the mark. Sonication was performed at an electrical power of 300 W for 15 min for benzene and toluene, and for 30 min for n-hexane. Concentrations of all the stock solutions (benzene: C60, 0.72 mM, C70, 0.83 mM; toluene: C60, 1.10 mM, C70, 1.30 mM; and n-hexane: C60, 0.05 mM, C70, 0.10 mM) were at approximately half-solubility for both fullerenes in the solvents [28,29]. The measurements were performed under ambient atmosphere. All solutions including neat solvents were deoxygenated using an ultrasonic bath for 10 min according to [49].
Registration of the emission, excitation, and excitation–emission matrix fluorescence was performed using a Cary Eclipse Fluorescence Spectrophotometer (Agilent, Mulgrave, Australia). The wavelength range was 190–1100 nm for the zero-order emission, and excitation was used. The angle between excitation and emission slits was 90°. The detector voltage was manually selectable from 400 to 1000 V with an increment of 1 V. Slit widths for the excitation and emission were selectable from 1 to 20 nm. Due to low fluorescence intensity, spectra were recorded at wide slit widths (>5 nm) and at high detector voltages (700–1000 V). The EEM pitch for both the emission and excitation wavelengths was 15 nm. Quartz cells with an optical path length of 10 mm (Laborkomplekt, Moscow, Russia) were used. Cary Eclipse Scan Application software, version 1.2 (147), was used (Agilent Technologies, Mulgrave, Australia). Fluorescence EEM maps of the samples show the wavelength of emission at the abscissa axis and the wavelength of excitation at the ordinate axis.
The limits of detection (3σ) were calculated using a standard protocol. The measurement results are presented in accordance with the requirements of ISO/IEC 17025:2019.

4. Conclusions

EEM fluorescence spectroscopy was used for the quantification of fullerenes C60 and C70, and a quantitative analysis of an unseparated (raw) C60/C70 mixture in terms of fluorescence regions that differ distinctly for fullerene and the solvent was performed. Such selectivity of fullerene luminescence provided selective quantification of fullerenes in a mixture without pre-separation of its components. Other advantages of this approach are simple sample preparation, good sensitivity, and analysis rapidity. Apart from analytical applications, the data and approach can be of use in studies of fullerene solutions and for the verification of the purity of fullerene samples. EEM can also help with the multicomponent analysis of a more complex fullerene mixture (C60, C70, C84, and endohedral fullerenes, etc.). Furthermore, the sensitivity can be enhanced using high-power excitation sources (e.g., laser-induced fluorescence).

Author Contributions

Conceptualization, V.K.I. and M.A.P.; methodology, M.A.P.; validation, V.A.V., D.S.V. and I.V.M.; formal analysis, M.A.P.; investigation, V.A.V., I.V.M., D.S.V. and S.M.B.; resources, M.A.P.; data curation, V.A.V.; writing—original draft preparation, I.V.M. and M.A.P.; writing—review and editing, M.A.P. and V.K.I.; visualization, V.A.V.; supervision, M.A.P.; project administration, I.V.M.; funding acquisition, M.A.P. All authors have read and agreed to the published version of the manuscript.

Funding

The research was funded by M.V. Lomonosov Moscow State University No. AAAA-A21-121011590089-1 “Development of highly in-formative and high-tech methods of chemical analysis for the protection of ecosystems, the creation of new materials and advanced production technologies, the transition to environmentally friendly and resource-saving energy, the development of nature-like technologies, high-tech healthcare and rational use of natural resources”.

Conflicts of Interest

The authors declare no conflict of interest.

Appendix A. Spectrophotometric Quantification of C60 and C70

A quantitative simultaneous spectrophotometric analysis of two-component mixtures is possible if Beer’s law, as well as the principle of additivity of absorbances for both components, is obeyed. Vierordt’s method can be applied if both components can be prepared individually and the molar absorptivities (ε) are known. Apparent molar absorptivities of fullerenes in the selected organic solvents are reliably established [45]; the light scattering factor is negligible from the viewpoint of absorptivity estimation [50].
An essential point for Vierordt’s method is the choice of analytical wavelengths. Absorption spectra of toluene solutions of individual fullerenes in the range of 300–850 nm was acquired for high-purity pristine fullerenes C60 and C70; then, the dependence
ε C 60 λ 1 λ n / ε C 70 λ 1 λ n = f λ
was plotted. It is characterized by maxima at 355 and 407 nm and minima at 320 and 337 nm, which provide the maximum possible difference between the ratios of the apparent molar absorptivity, which can be estimated as
ε C 60 λ 1 / ε C 70 λ 1 ε C 60 λ 2 / ε C 70 λ 2
An analysis of the fullerene mixture by Vierordt’s method at 355, 407 nm and 320, 337 nm shows a relative error of determination (δc, %) from the calculated concentration in the mixture of no more than 15%.
The absorption maxima of a mixture of fullerenes in toluene at λ 1 = 337 nm and λ 2 = 407 nm, providing the maximum difference in absorptivities, were selected for spectrophotometric analysis for fluorescence procedure verification. Under these conditions, the relative error of determination (δc, %) of the concentration is no more than 10%.

References

  1. Devi, N.; Kumar, R.; Chen, Y.-S.; Singh, R.K. Carbon-Based Nanomaterials: Carbon Nanotube, Fullerene, and Carbon Dots. In Nanomaterials; Singh, D.K., Singh, S., Singh, P., Eds.; Springer: Singapore, 2023; pp. 27–57. [Google Scholar]
  2. Zhang, L.; Xu, K.; Wei, F. Fabrication of electronic switches based on low-dimensional nanomaterials: A review. J. Mater. Sci. 2023, 58, 2087–2110. [Google Scholar] [CrossRef]
  3. Bernardo, G.; Melle-Franco, M.; Washington, A.L.; Dalgliesh, R.M.; Li, F.; Mendes, A.; Parnell, S.R. Different agglomeration properties of PC 61 BM and PC 71 BM in photovoltaic inks–a spin-echo SANS study. RSC Adv. 2020, 10, 4512–4520. [Google Scholar] [CrossRef] [PubMed] [Green Version]
  4. Holmannova, D.; Borsky, P.; Svadlakova, T.; Borska, L.; Fiala, Z. Carbon Nanoparticles and Their Biomedical Applications. Appl. Sci. 2022, 12, 7865. [Google Scholar] [CrossRef]
  5. Yi, H.; Zeng, G.; Lai, C.; Huang, D.; Tang, L.; Gong, J.; Chen, M.; Xu, P.; Wang, H.; Cheng, M.; et al. Environment-friendly fullerene separation methods. Chem. Eng. J. 2017, 330, 134–145. [Google Scholar] [CrossRef]
  6. Astefanei, A.; Nunez, O.; Galceran, M.T. Characterisation and determination of fullerenes: A critical review. Anal. Chim. Acta 2015, 882, 1–21. [Google Scholar] [CrossRef] [PubMed] [Green Version]
  7. Kuznetsov, S.I.; Yunusova, D.S.; Yumagulova, R.K.; Miftakhov, M.S.; Kolesov, S.V.; Spivak, S.I.; Kantor, O.G. Quantitative UV Spectrophotometric Analysis of Mixtures of Substituted C60 Fullerenes. J. Appl. Spectrosc. 2015, 82, 644–652. [Google Scholar] [CrossRef]
  8. Tran, C.D.; Grishko, V.I.; Challa, S. Near-infrared spectrophotometric determination of compositions of fullerene samples. Spectrochim. Acta A Mol. Biomol. Spectrosc. 2005, 62, 38–41. [Google Scholar] [CrossRef]
  9. Kimbrell, J.B.; Crittenden, C.M.; Steward, W.J.; Khan, F.A.; Gaquere-Parker, A.C.; Stuart, D.A. Analysis of mixtures of C60and C70by Raman spectrometry. Nanosci. Methods 2014, 3, 40–46. [Google Scholar] [CrossRef] [Green Version]
  10. Isaacson, C.W.; Kleber, M.; Field, J.A. Quantitative Analysis of Fullerene Nanomaterials in Environmental Systems: A Critical Review. Environ. Sci. Technol. 2009, 43, 6463–6474. [Google Scholar] [CrossRef]
  11. Isaacson, C.W.; Usenko, C.Y.; Tanguay, R.L.; Field, J.A. Quantification of fullerenes by LC/ESI-MS and its application to in vivo toxicity assays. Anal. Chem. 2007, 79, 9091–9097. [Google Scholar] [CrossRef]
  12. Chen, Z.; Westerhoff, P.; Herckes, P. Quantification of C60 fullerene concentrations in water. Environ. Toxicol. Chem. 2008, 27, 1852–1859. [Google Scholar] [CrossRef] [PubMed]
  13. Benn, T.M.; Westerhoff, P.; Herckes, P. Detection of fullerenes (C60 and C70) in commercial cosmetics. Environ. Pollut. 2011, 159, 1334–1342. [Google Scholar] [CrossRef] [PubMed] [Green Version]
  14. Mitra, R.; Chattopadhyay, S.; Bhattacharya, S. Physicochemical insights in supramolecular interaction of fullerenes C60 and C70 with a monoporphyrin in presence of silver nanoparticles. Spectrochim. Acta A Mol. Biomol. Spectrosc. 2012, 89, 284–293. [Google Scholar] [CrossRef]
  15. Williams, R.M.; Verhoeven, J.W. Fluorescence of fullerene-C70 and its quenching by long-range intermolecular electron transfer. Chem. Phys. Lett. 1992, 194, 446–451. [Google Scholar] [CrossRef] [Green Version]
  16. Zhao, Y.; Fang, Y.; Jiang, Y. Fluorescence study of fullerene in organic solvents at room temperature. Spectrochim. Acta A Mol. Biomol. Spectrosc. 2006, 64, 564–567. [Google Scholar] [CrossRef]
  17. Ma, B.; Sun, Y.-P. Fluorescence spectra and quantum yields of [60]fullerene and [70]fullerene under different solvent conditions. A quantitative examination using a near-infrared-sensitive emission spectrometer. J. Chem. Soc. Perkin Trans. 1996, 2, 2157–2162. [Google Scholar] [CrossRef]
  18. Catalan, J.; Elguero, J. Fluorescence of fullerenes (C60 and C70). J. Am. Chem. Soc. 1993, 115, 9249–9252. [Google Scholar] [CrossRef]
  19. Song, J.; Li, F.; Qian, S.; Li, Y.; Peng, W.; Zhou, J.; Yu, Z. Time-Resolved Fluorescence Study of C 60 Solution. Chin. Phys. Lett. 1994, 11, 137. [Google Scholar] [CrossRef]
  20. Zhang, F.; Fang, Y. Nanostructure origins of C60 fluorescence in pyridine. J. Phys. Chem. B 2006, 110, 9022–9026. [Google Scholar] [CrossRef]
  21. Zhang, F.; Zhang, X. On the fluorescence of C60 at room temperature. Sci. China Phys. Mech. Astron. 2010, 53, 95–99. [Google Scholar] [CrossRef]
  22. Baleizao, C.; Berberan-Santos, M.N. A molecular thermometer based on the delayed fluorescence of C70 dispersed in a polystyrene film. J. Fluoresc. 2006, 16, 215–219. [Google Scholar] [CrossRef] [PubMed] [Green Version]
  23. Baleizao, C.; Berberan-Santos, M.N. Thermally activated delayed fluorescence in fullerenes. Ann. N. Y. Acad. Sci. 2008, 1130, 224–234. [Google Scholar] [CrossRef] [PubMed] [Green Version]
  24. Kim, D.; Lee, M.; Suh, Y.D.; Kim, S.K. Observation of fluorescence emission from solutions of C60 and C70 fullerenes and measurement of their excited-state lifetimes. J. Am. Chem. Soc. 1992, 114, 4429–4430. [Google Scholar] [CrossRef]
  25. Wild, U.P.; Luond, M.; Meister, E.; Suter, G.W. Total luminescence spectroscopy. J. Lumin. 1988, 40–41, 270–271. [Google Scholar] [CrossRef]
  26. Weber, G. Enumeration of components in complex systems by fluorescence spectrophotometry. Nature 1961, 190, 27–29. [Google Scholar] [CrossRef]
  27. Saraswati, T.E.; Setiawan, U.H.; Ihsan, M.R.; Isnaeni, I.; Herbani, Y. The Study of the Optical Properties of C60 Fullerene in Different Organic Solvents. Open Chem. 2019, 17, 1198–1212. [Google Scholar] [CrossRef] [Green Version]
  28. Marcus, Y.; Smith, A.L.; Korobov, M.V.; Mirakyan, A.L.; Avramenko, N.V.; Stukalin, E.B. Solubility of C60 Fullerene. J. Phys. Chem. B 2001, 105, 2499–2506. [Google Scholar] [CrossRef]
  29. Sivaraman, N.; Dhamodaran, R.; Kaliappan, I.; Srinivasan, T.G.; Vasudeva Rao, P.R.P.; Mathews, C.K.C. Solubility of C70in Organic Solvents. Fuller. Sci. Technol. 1994, 2, 233–246. [Google Scholar] [CrossRef]
  30. Ichida, M.; Sakai, M.; Yajima, T.; Nakamura, A. Luminescence properties of C70 in solutions and solids. J. Lumin. 1997, 72–74, 499–500. [Google Scholar] [CrossRef]
  31. Orlandi, G.; Negri, F. Electronic states and transitions in C60 and C70 fullerenes. Photochem. Photobiol. Sci. 2002, 1, 289–308. [Google Scholar] [CrossRef]
  32. Pavlovich, V.S.; Shpilevsky, E.M. Absorption and fluorescence spectra of C60 fullerene concentrated solutions in hexane and polystyrene at 77–300 K. J. Appl. Spectrosc. 2010, 77, 335–342. [Google Scholar] [CrossRef]
  33. Palewska, K.; Sworakowski, J.; Chojnacki, H.; Meister, E.C.; Wild, U.P. A photoluminescence study of fullerenes: Total luminescence spectroscopy of C60 and C70. J. Phys. Chem. 1993, 97, 12167–12172. [Google Scholar] [CrossRef]
  34. Wang, Y. Photophysical properties of fullerenes and fullerene/N,N-diethylaniline charge-transfer complexes. J. Phys. Chem. 1992, 96, 764–767. [Google Scholar] [CrossRef]
  35. Cavar, E.; Blum, M.C.; Pivetta, M.; Patthey, F.; Chergui, M.; Schneider, W.D. Fluorescence and phosphorescence from individual molecules excited by local electron tunneling. Phys. Rev. Lett. 2005, 95, 196102. [Google Scholar] [CrossRef] [PubMed] [Green Version]
  36. Sibley, S.P.; Argentine, S.M.; Francis, A.H. A photoluminescence study of C60 and C70. Chem. Phys. Lett. 1992, 188, 187–193. [Google Scholar] [CrossRef] [Green Version]
  37. Leach, S.; Vervloet, M.; Desprès, A.; Bréheret, E.; Hare, J.P.; John Dennis, T.; Kroto, H.W.; Taylor, R.; Walton, D.R.M. Electronic spectra and transitions of the fullerene C60. Chem. Phys. 1992, 160, 451–466. [Google Scholar] [CrossRef]
  38. Bhattacharya, S.; Banerjee, M.; Mukherjee, A.K. Study of the formation equilibria of electron donor-acceptor complexes between [60]fullerene and methylbenzenes by absorption spectrometric method. Spectrochim. Acta A Mol. Biomol. Spectrosc. 2001, 57, 1463–1470. [Google Scholar] [CrossRef]
  39. Hiraoka, K.; Nara, M.; Iijima, Y. Luminescence emission and excitation spectra of benzene thin film under slow electron impact at 77 K. J. Phys. Chem. 1983, 87, 3959–3961. [Google Scholar] [CrossRef]
  40. Bhattacharya, S.; Nayak, S.K.; Chattopadhyay, S.K.; Banerjee, M.; Mukherjee, A.K. Absorption spectroscopic study of EDA complexes of. Spectrochim. Acta A Mol. Biomol. Spectrosc. 2001, 57, 309–313. [Google Scholar] [CrossRef]
  41. Dhawan, A.; Taurozzi, J.S.; Pandey, A.K.; Shan, W.; Miller, S.M.; Hashsham, S.A.; Tarabara, V.V. Stable colloidal dispersions of C60 fullerenes in water: Evidence for genotoxicity. Environ. Sci. Technol. 2006, 40, 7394–7401. [Google Scholar] [CrossRef]
  42. Talyzin, A.; Jansson, U. C60 and C70 Solvates Studied by Raman Spectroscopy. J. Phys. Chem. B 2000, 104, 5064–5071. [Google Scholar] [CrossRef]
  43. Rice, J.H.; Galaup, J.-P.; Leach, S. Fluorescence and phosphorescence spectroscopy of C70 in toluene at 5 K: Site dependent low lying excited states. Chem. Phys. 2002, 279, 23–41. [Google Scholar] [CrossRef]
  44. Qaiser, D.; Khan, M.S.; Singh, R.D.; Khan, Z.H. Time resolved spectroscopy and gain studies of Fullerenes C60 and C70. Spectrochim. Acta A Mol. Biomol. Spectrosc. 2013, 113, 400–407. [Google Scholar] [CrossRef] [PubMed]
  45. Ruoff, R.S.; Kadish, K.M.; Group, E.S.F. Proceedings of the Symposium on Recent Advances in the Chemistry and Physics of Fullerenes and Related Materials; Electrochemical Society: Philadelphia, PA, USA, 1995. [Google Scholar]
  46. Çiçek, B.; Kenar, A.; Nazir, H. Simultaneous Determination of C60and C70fullerenes by a Spectrophotometric Method. Fuller. Sci. Technol. 2001, 9, 103–111. [Google Scholar] [CrossRef]
  47. Dudnik, A.I.; Osipova, I.V.; Nikolaev, N.S.; Churilov, G.N. Comparative analysis of two methods for synthesis of fullerenes at different helium pressures. Fuller. Nanotub. Carbon Nanostructures 2020, 28, 697–701. [Google Scholar] [CrossRef]
  48. Mikheev, I.V.; Bolotnik, T.A.; Volkov, D.S.; Korobov, M.V.; Proskurnin, M.A. Approaches to the determination of C60 and C70 fullerene and their mixtures in aqueous and organic solutions. Nanosyst. Phys. Chem. Math. 2016, 7, 104–110. [Google Scholar] [CrossRef] [Green Version]
  49. Vencel, T.; Donovalová, J.; Gáplovský, A.; Kimura, T.; Toma, S. Oxygen Exclusion from the Organic Solvents Using Ultrasound and Comparison with Other Common Techniques Used in Photochemical Experiments. Chem. Pap. 2005, 59, 271–274. [Google Scholar]
  50. Alargova, R.G.; Deguchi, S.; Tsujii, K. Stable colloidal dispersions of fullerenes in polar organic solvents. J. Am. Chem. Soc. 2001, 123, 10460–10467. [Google Scholar] [CrossRef]
Figure 1. Excitation–emission fluorescence maps of solvents: (a) benzene, (b) toluene, and (c) n-hexane. Excitation/emission slits, 10/10; 20/20; and 20/20 nm, respectively; detector voltage, 860, 930, and 850 V, respectively; scanning pitch, 15 nm. Y-axis is excitation, X-axis is emission. The lines corresponding to 1st-, 2nd-, and 3rd-order Rayleigh and 1st- and 2nd-order Stokes Raman scattering are diagonal swaths in the maps.
Inorganics 11 00136 g001
Figure 2. Log-scale molar absorptivity spectra: (solid red line) C60 in n-hexane, 63.6 µM; (solid blue line) C70 in benzene, 47.6 µM.
Inorganics 11 00136 g002
Figure 3. Excitation–emission fluorescence maps of C60 in (a) benzene, (b) toluene, and (c) n-hexane, 50.0 µM. Excitation/emission slits, 20/20 nm; detector voltage, 870 V; Scanning pitch, 15 nm. Y-axis is excitation, X-axis is emission. Regions of fluorescence A, B, and C are marked by white circles. Lines of scattering are denoted by diagonal white lines: 1st-, 2nd-, and 3rd-order Rayleigh (dotted) and 1st and 2nd Stokes Raman (dashed).
Inorganics 11 00136 g003
Figure 4. Excitation–emission fluorescence maps for different concentrations of fullerenes: C60 in n-hexane, (a) 3.00 and (b) 10.0 µM; C70 in benzene, (c) 30.0 and (d) 100 µM. Excitation/emission slits, 20/20 nm; detector voltage, 870 V; scanning pitch, 15 nm. Y-axis is excitation, X-axis is emission.
Inorganics 11 00136 g004
Figure 5. Excitation–emission fluorescence map (wavenumbers scale) for fullerene C60, 50.0 µM in n-hexane, Region B. Excitation/emission slits, 2.5/2.5 nm; detector voltage, 700 V. Scanning pitch, 15 nm. Y-axis is excitation, X-axis is emission.
Inorganics 11 00136 g005
Figure 6. Excitation–emission fluorescence maps of C70 in (a) benzene, (b) toluene, and (c) n-hexane, 16.3 µM. Excitation/emission slits, 20/20 nm; detector voltage, 870 V; scanning pitch, 15 nm. Y-axis is excitation, X-axis is emission. Regions of fluorescence A, B, and C are marked by white circles. Lines of scattering are denoted by diagonal white lines: 1st-, 2nd-, and 3rd-order Rayleigh (dotted) and 1st and 2nd Stokes Raman (dashed).
Inorganics 11 00136 g006
Figure 7. Log-scale fluorescence emission (excitation wavelengths, 310 nm, magenta line and symbols and 490 nm, green line and symbols) and fluorescence excitation spectra (emission wavelength, 700 nm, black line and symbols): (a) C60 in n-hexane, 63.6 µM; (b) C70 in benzene, 47.6 µM. Bands marked R1 and R2 are 1st and 2nd-order Rayleigh scattering; bands marked SR1 are 1st-order Stokes Raman scattering. Excitation/emission slits, 14/14 nm; detector voltage, 950 V; accumulation time 0.5 s per point.
Inorganics 11 00136 g007
Figure 8. Ratio of fluorescence emission intensities of C70 in benzene and C60 in n-hexane (47.6 µM) under the same excitation conditions (310 and 490 nm). See Figure 6 for conditions.
Inorganics 11 00136 g008
Figure 9. Excitation–emission maps of mixtures of C60 and C70 (a) technological and (b) model in benzene; (c) technological and (d) model in toluene; (e) technological and (f) 3:1 wt. model in n-hexane. The technological mixture is 67 µM. In the model mixture, the concentration of C60 is 50.0 µM and of C70 it is 16.3 µM. Excitation/emission slits, 20/20 nm; detector voltage, 870 V; scanning pitch, 15 nm. Y-axis is excitation, X-axis is emission.
Inorganics 11 00136 g009
Table 1. Performance parameters of EEM fluorescence quantification of fullerenes (p = 0.95); experimental parameters: emission/excitation slits, 20/20 nm, detector voltage, 1000 V.
Fullerene/SolventEEM RegionExcitation/Emission Wavelength, nmLOD (cmin), nMRegression Equation and Concentration Range
(in Parentheses)
C70 in benzeneA490/6602I = (4.1 ± 1.0) × 108 × c + (70 ± 10), n = 4, r = 0.9990
(0.03 ÷ 0.10 μM)
I = (5.2 ± 0.8) × 108 × c + (60 ± 10), n = 5, r = 0.9985
(0.10 ÷ 0.35 μM)
C60 in n-hexaneB (sum)310/7407I = (2.0 ± 0.1) × 107 × c + (300 ± 100), n = 7, r = 0.9984
(10.0 ÷ 50.0 μM)
C310/4201I = (1.3 ± 0.1) × 108 × c + (40 ± 10), n = 7, r = 0.9980
(0.03 ÷ 1.00 μM)
I is signal intensity and c is fullerene molar concentration.
Disclaimer/Publisher’s Note: The statements, opinions and data contained in all publications are solely those of the individual author(s) and contributor(s) and not of MDPI and/or the editor(s). MDPI and/or the editor(s) disclaim responsibility for any injury to people or property resulting from any ideas, methods, instructions or products referred to in the content.

