Article

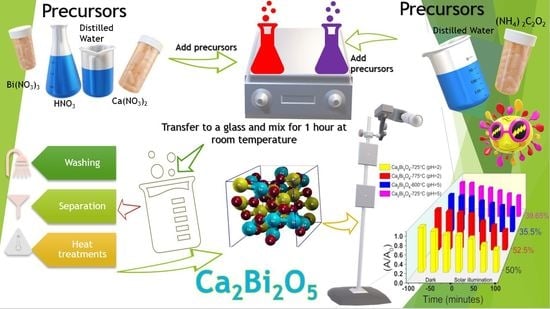
Preparing a Ca-Bi-O System by the Precipitation Method and Studying Its Intermediate Structural Properties for Applications in Water Treatment

by
Adrian Ionuț Cadiș
1,
Florina Ștefania Rus
2,*,
João Nuno Gonçalves
3 and
Mădălina Ivanovici
2,*
1
“Raluca Ripan” Institute for Research in Chemistry, “Babes-Bolyai” University, Fantanele 30, 400294 Cluj-Napoca, Romania
2
National Institute for Research and Development in Electrochemistry and Condensed Matter, 300569 Timisoara, Romania
3
CICECO—Aveiro Institute of Materials and Departamento de Física, Universidade de Aveiro, 3810-193 Aveiro, Portugal
*
Authors to whom correspondence should be addressed.
Inorganics 2023, 11(2), 79; https://doi.org/10.3390/inorganics11020079
Submission received: 22 December 2022 / Revised: 31 January 2023 / Accepted: 4 February 2023 / Published: 9 February 2023
(This article belongs to the Special Issue Inorganics for Catalysts: Design, Synthesis and Applications)

Abstract

:
This study focuses on the development of a Ca-Bi-O system (CBO) with efficiency in the degradation of Rhodamine B, which is extremely toxic to many organisms and can have long-term negative consequences if not safely removed from the water. The conventional precipitation method was used to create a stable phase of Ca2Bi2O5 with a stoichiometric 1:1 molar ratio of Ca:Bi. Before obtaining the pure phase, the details of the reaction processes were investigated and the various intermediate products were identified using X-ray diffraction followed by Fourier transform infrared, UV-Vis, and Raman spectroscopy. An ab initio calculation evaluated with the HSE06 functional yields a band gap of 3.5 eV, similar to the band gap obtained by diffuse reflectance recorded on Ca2Bi2O5. This newly synthesized compound is addressed to the environmental application by investigating the photocatalytic properties of CBO materials obtained at different calcination temperatures. The investigation of pure Ca2Bi2O5, with characterization techniques and complemented by new first-principles calculations to investigate the photocatalysis provide valuable new insights for this scarcely studied yet potentially interesting compound.

Graphical Abstract

1. Introduction

The problems associated with an increased population density, global climate change, and natural resource depletion are reflected in all scientific fields [1]. In chemistry, the principles that underpin sustainable chemical development [2] (green chemistry) have imposed the need to identify innovative materials [3], processes, and products for reducing the consumption of reactants and energy in chemical processes, reducing toxic chemical emissions in the environment, and expanding the use of renewable resources [4]. Because of the activities of the population in big cities and the high demand for food production by the agro-food industry, there has been an increase in concern for various pollutants in recent decades. Environmental impacts in air, soil, and water have been observed in specific locations [5,6]. Contaminants are released into the atmosphere, water, and soil and being absorbed by organisms. They are responsible for serious diseases, such as irreversible immune system damage, cancer, genetic disorders, and ovarian toxicity [7,8,9]. Dyes, for example, are used in the paper, textile, and food industries and in medicine for histological specimens and cosmetic products. The EU member states have reported the presence of dangerous dyes in foods, such as chili powder, curry powder, processed products containing chili or curry powder, sumac, curcuma, and palm oil. One of the dyes used is Rhodamine B, a potentially genotoxic and carcinogenic dye. Advanced devices and techniques for dye degradation and monitoring are required for population safety and security. Photocatalysis is an ideal technology that has the potential to be one of the most significant contributors to the transition to a greener lifestyle. Photocatalysts have great potential due to the sun’s virtually limitless energy source. Organic waste degradation is a major application area for photocatalysts. Photocatalytic decomposition of toxic water pollutants can be a cost-efficient and simple way to clean up environmental systems. Scientists have been drawn to bismuth-containing semiconductor materials in recent decades due to their high photocatalytic activity in various reactions combined with their high efficiency in the photoelectric conversion of solar energy. Photocatalysis technology will be an important tool for removing organic pollutants from the environment.
Semiconductor-based photocatalytic systems have recently received increased attention for their ability to degrade organic molecules, but not limited to their rapid speed and efficiency. There has been an abundance of work done with various systems, such as CaBi2O4 [10,11], CaBiO3 [12,13], Ca6Bi6O15 [14], Ca4Bi6O13 [15], CaBi6O10 [16], Ca3Bi8O15 [17], CaBi2O6 [18], and Ca5Bi14O26 [19], but less on Ca2Bi2O5. Further, Table 1 presents the degradation efficiency of various contaminants over CBO materials investigated in other studies.
Thus far, the following methods have been used by other researchers for the preparation of Ca2Bi2O5: sol-gel method (from Ca(NO3)2, Bi(NO3)3 with citric acid and polyvinylalcohol [21,22] or sorbitol [23]) mechanochemical ceramic method (from CaO and Bi2O3) [24] and solid-state reaction (from CaCO3 and Bi2O3 in the presence of NaCl and KCl [14,25] or without [15,26,27,28]). In this study, we obtained Ca2Bi2O5 at 725 °C through a fast precipitation method starting with equal volumes of ammonium oxalate and acidified Ca-Bi nitrate aqueous solutions stirred for 1 h to make the solution homogeneous. The whole process is described in the preparation from Section 4.1. From what we know, there are no other studies on obtaining CBO by the precipitation method. We add novelty also with the calculation of the band gap based on the DFT framework using the Heyd–Scuseria–Ernzerhof (HSE) hybrid functional approach [29], calculations which have never been performed until now.

2. Results

In this study, we obtained CBO by the precipitation method using ammonium oxalate and Ca-Bi nitrate aqueous solutions as the reactants. The molar ratio of ammonium oxalate and Ca-Bi nitrate was 2:1 and the molar ratio for Ca-Bi nitrates was 1:1. The obtained powder was calcined at 450 °C, 600 °C, 725 °C, and 775 °C, and all the intermediate phases were characterized. Additional details of the synthesis are presented in Section 4.1.

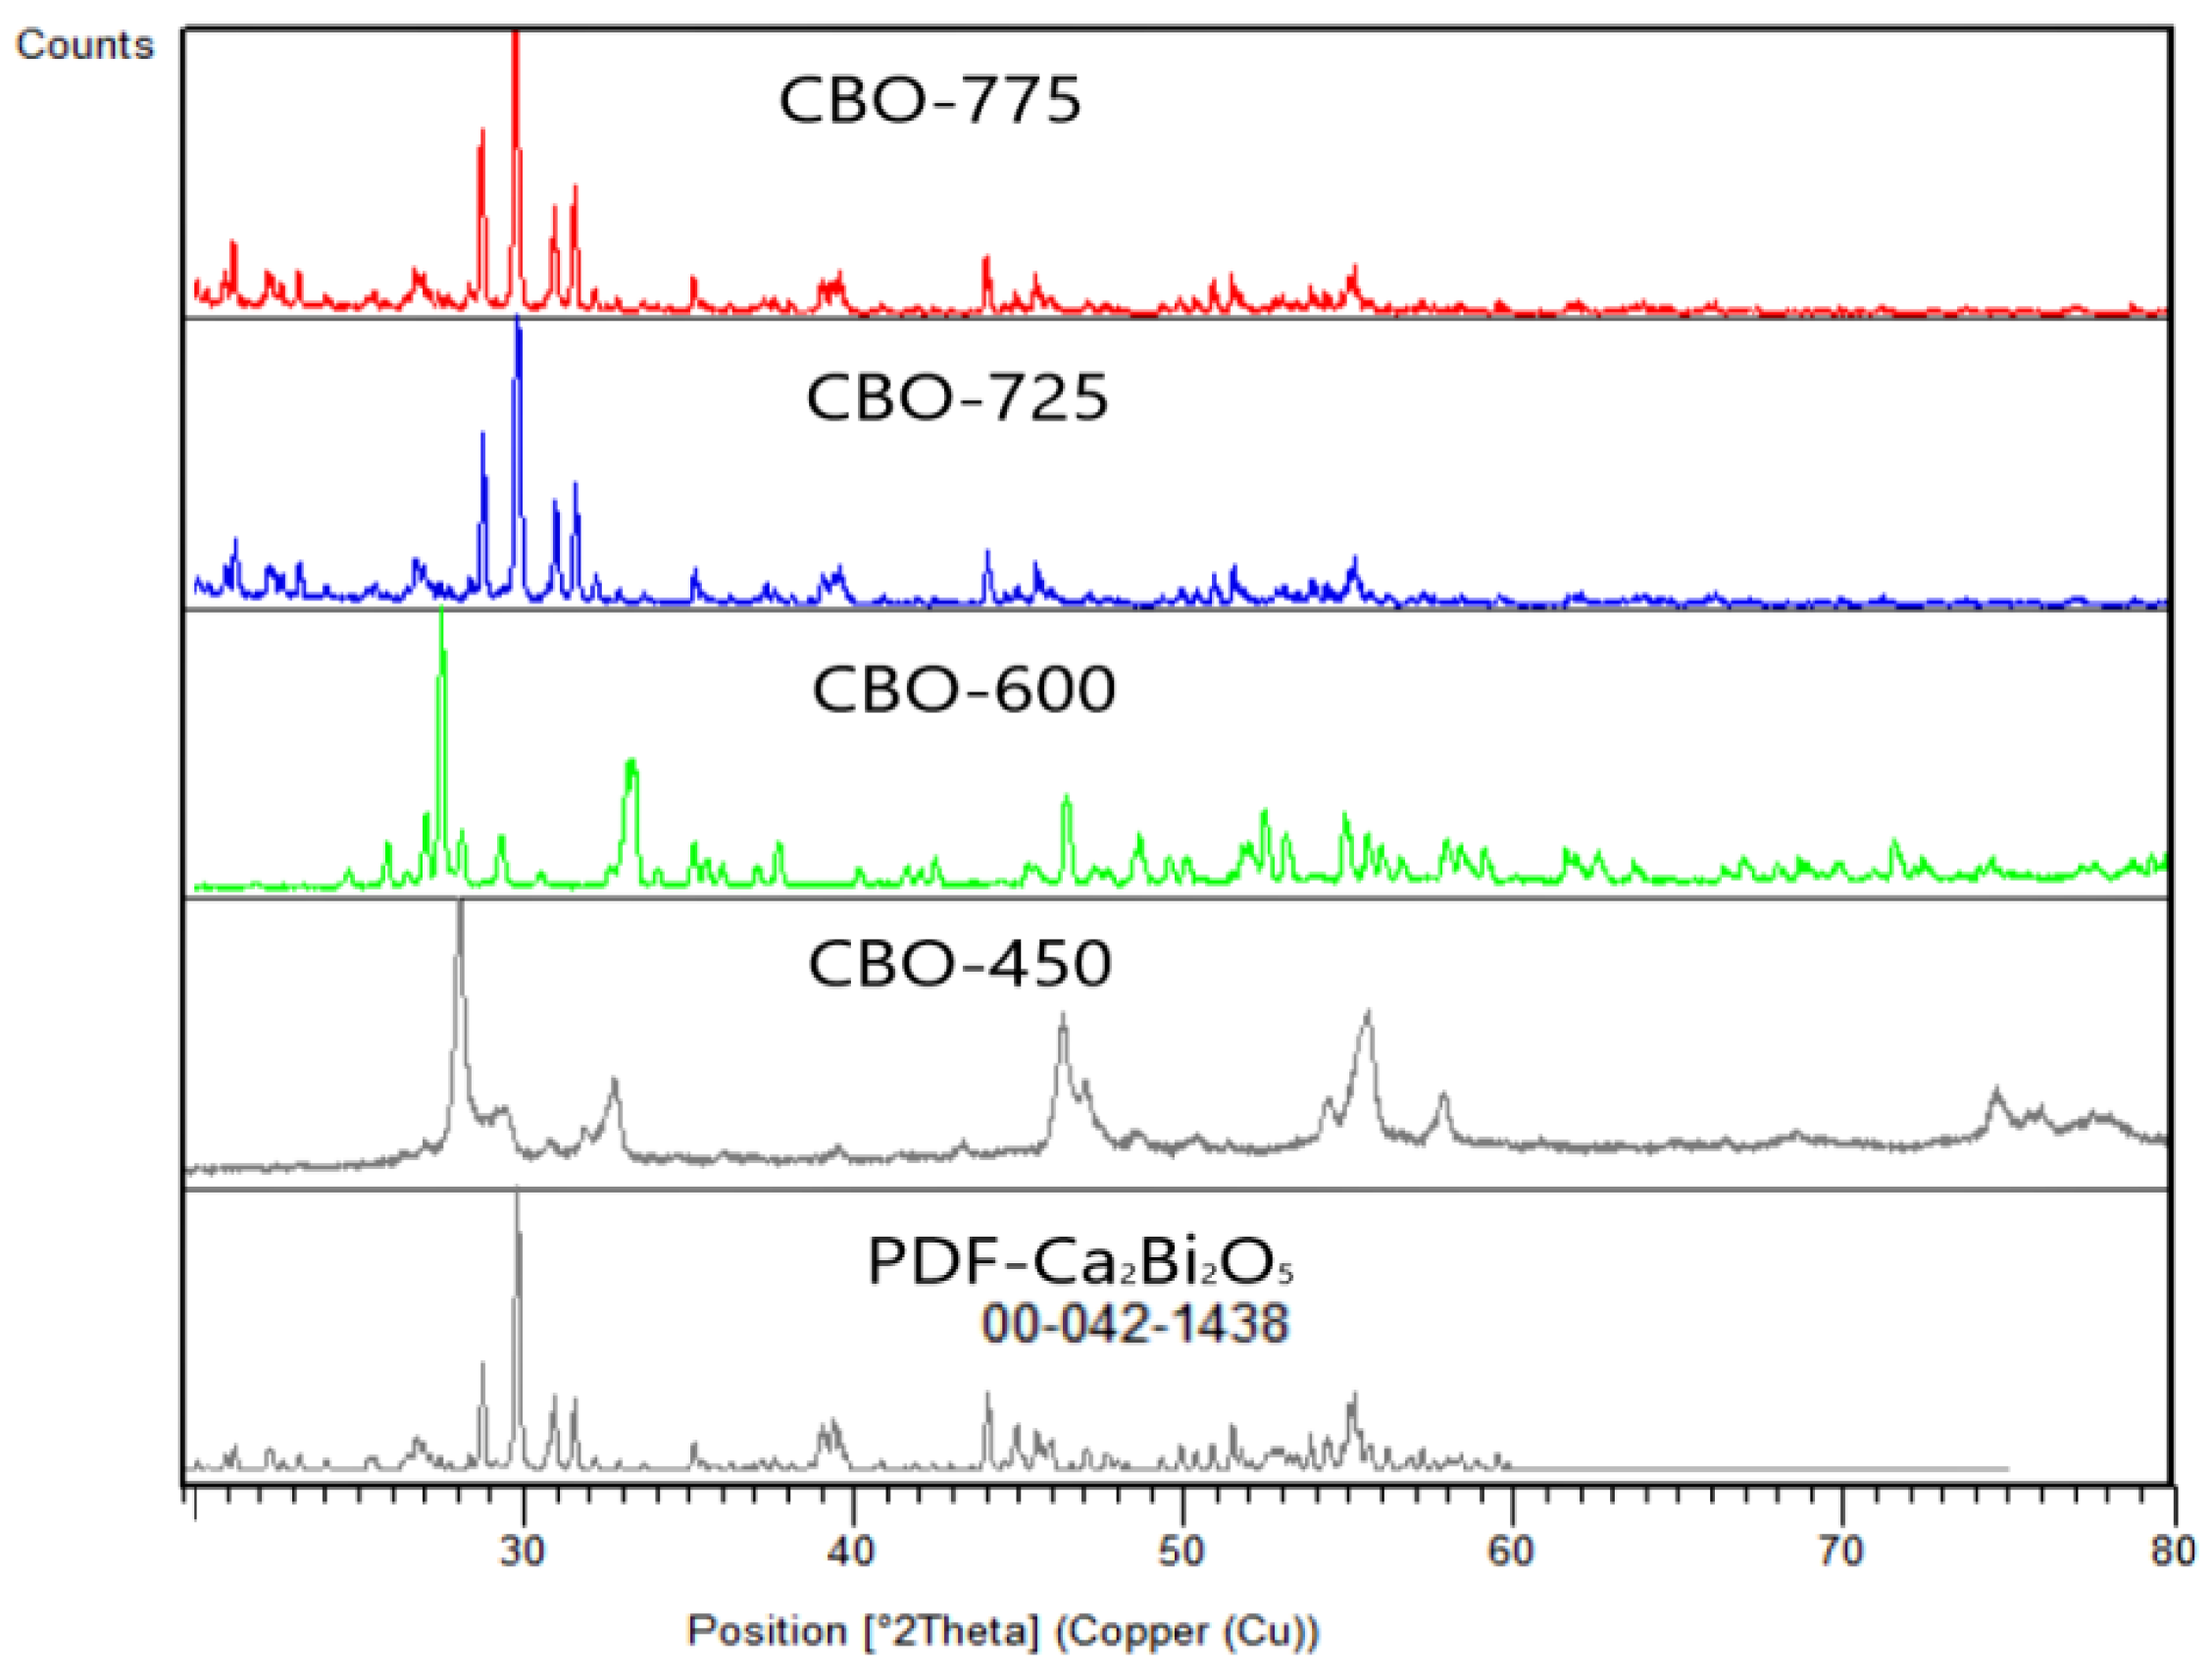
2.1. X-ray Diffraction

The composition at 450 °C consists of two phases: Bi2O3 and CaCO3 indexed in the database by PDF 01-074-1374 and 01-085-1108, [30] respectively. At a temperature of 600 °C, the composition has a two-phase composition of Bi2O3 and Ca2Bi2O5. At 725 °C, the composition becomes single-phase. This can be seen from XRD (Figure 1). On the XRD patterns of these samples, there are pronounced reflections belonging to Ca2Bi2O5 indexed by PDF 00-042-1438. A triclinic cell was found with space group P-1, a = 10.14, b = 10.11, c = 10.47A, α-107.13, β = 116.91, and γ = 92.96°, with a volume of 893 cm3 for the Ca2Bi2O5. We tested the catalyst at 775 °C to verify if the structure was changing. As we could observe, the structure was stable.
The XRD analysis confirmed that the samples calcinated at 725 °C and 775 °C were well-crystallized and can be indexed in the Ca2Bi2O5 structure according to JCPDS card no. 00-042-1438.
The samples calcinated at 450 °C and 600 °C were not single phase; hence, in order to compare the crystallite sizes we calculated the diameter for the samples calcinated at 725 °C and 775 °C from the first 10 highest peaks of both samples. The average of the calculated crystallite sizes were 40.22 nm for the Ca2Bi2O5 sample calcinated at 725 °C and 47.21 nm for the Ca2Bi2O5 sample calcinated at 775 °C.

2.2. FT-IR Analysis

Because each building block and each chemical bond has a distinct vibrational frequency that can be thought of as their fingerprint, FTIR is an effective tool for characterizing the structure. A molecule’s chemical bonds can be identified using FTIR by creating an infrared absorption spectrum. At room temperature, FTIR spectra were used to identify both the building blocks and the chemical bonds within the studied samples. The FTIR spectra presented in Figure 2 of the CBO samples prepared at various temperatures of 450 °C, 600 °C, 725 °C, and 775 °C, were recorded in the range of 400–4000 cm−1 in order to gather information on the presence of functional groups.
According to the FTIR results, some observations can be made:
  • All samples present broad absorption bands at 3426 cm−1 and 1635 cm−1 due to the stretching and scissoring vibrations of the adsorbed water;
  • The peaks from 1422 cm−1, 873 cm−1, and 713 cm−1 are specific for asymmetric C-O stretching, out-of-plane vibration, and in-plane vibration from the traces of trapped carbonate-based compounds that result from the decomposition of oxalates, respectively. This decreases with temperature [31]. The peak from 1795 cm−1 can also be attributed to calcite [32];
  • The 400–650 cm−1 domain, attributed to the Bi-O and Ca-O vibrations, shows that between 450 and 650 cm−1 a structuring of the crystal lattice takes place. The IR absorption spectra of the samples contained additional absorption bands specifically for Ca2Bi2O5 at 428, 449, 492, 522, and 622 cm−1, corresponding to the vibrations of the Bi–O and Ca–O bonds [33];
  • The peak from 3640 cm−1 can be attributed to the OH stretching vibration from a trace of the hydroxy compound formed with water from the atmosphere [31,34]. When CBO particles’ highly reactive surface areas are exposed to air during calcination, CO2 and H2O are formed and then adsorbed as free -OH and carbonate species on the CBO surface. The stretching vibration of water can also indicate the adsorptive properties of the materials. In the heterogeneous catalysis, adsorption is an important step as it precedes the chemical reaction on the catalyst surface and facilitates the reaction path on the active sites [35,36].

2.3. Raman Shift Spectroscopy

Raman analysis was used to investigate the ionic bonding that could not be detected by FTIR. The presence of fingerprint modes in the samples of the Raman spectra enhanced the powder X-ray diffraction results. The Raman spectra of the CBO calcinated at 450 °C, 600 °C, 725 °C, and 775 °C are shown in Figure 3 with the inset of CBO-450 compared with the recorded spectra of CaCO3.
The sample calcinated at 450 °C composed from Bi2O3, calcite, and Ca2Bi2O5 shows several strong Raman bands corresponding to different phases of these mixed metallic oxides for the lattice modes as well as for the internal species at 292, 350, 436, and 490 cm−1 [37] whereas pure Ca2Bi2O5 shows strong peaks at 583 and 625 cm−1, which are attributed to the Ca–O bond vibration from Ca2Bi2O5 [15]. It is important to note that some high frequency modes appear in the spectra of the calcium bismuth oxides similar with Sr2Bi2O5, as reported by Zhang et al. [38].
The CBO peaks increase with increasing calcination temperature, which is consistent with the XRD results. The peak at 1083 cm−1 was observed for the CBO-450 sample, which is attributed to calcite and recorded separately in order to compare. The peak intensity disappeared with calcination temperature, which can also be observed in the XRD results. However, the TG-DTA results presented in Section 2.6 indicates the absence of weight loss when the temperature is higher than 664 °C, thereby excluding the possibility of CaCO3 or Ca(OH)2 formation. This analysis is also confirmed by Raman.
No significant modification of the spectral feature, except a slight frequency shift, is observed for the same set of mixed oxides by increasing the calcination temperature from 725 °C to 775 °C.

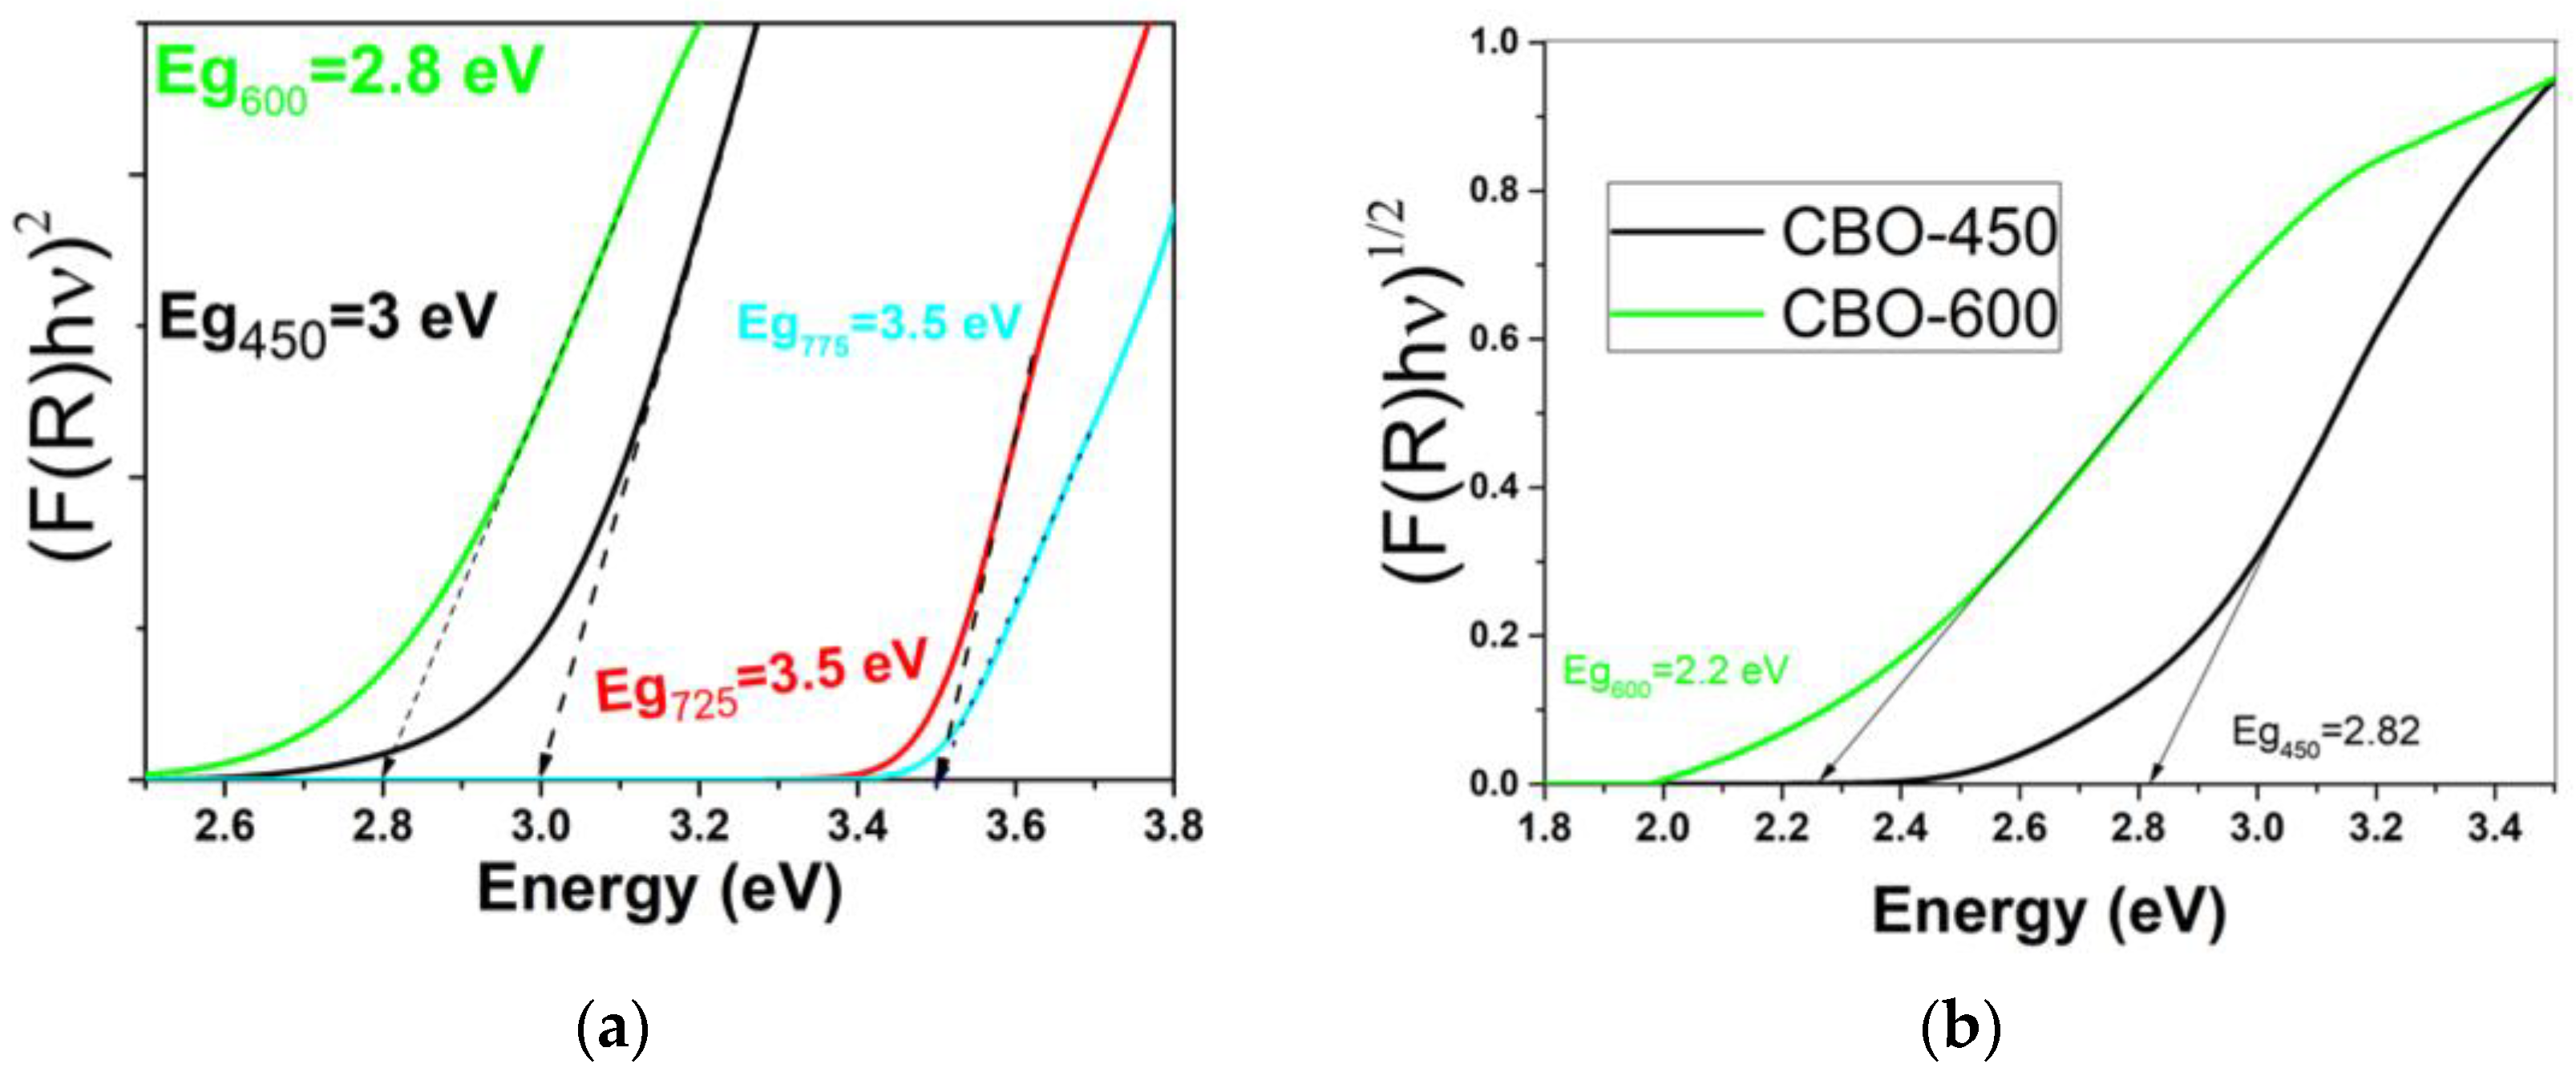
2.4. Ultraviolet-Visible Spectroscopy and Ab Initio Calculations

The acquired diffuse reflectance spectrum was converted to a Kubelka–Munk function.
The band transition shows a close dependence on n, that is, direct allowed (n = 1/2) and indirect allowed (n = 2) transitions. The CBO has a direct allowed type because the best fit is obtained when n is 1/2. The comparison of the estimations of band energies on Equation (2) with n = 1/2 are as shown in Figure 4a. We can observe a minimum band gap of 2.8 eV for the CBO containing intermediate phases of Bi2O3 and Ca2Bi2O5, resulting in absorption of visible spectra, while for CBO-450 the calculated band gap was 3 eV.
Where multiple phases or a mixture are present in the same sample, both direct and indirect optical band gaps can be present [39]. The fundamental absorption edge has been identified from the Kubelka–Munk function. We can estimate an indirect allowed transition for CBO-450 of 2.8 eV while for CBO-600 it is 2.2 eV, as represented in Figure 4b.
We are not aware of any publications presenting first principles calculations on this compound, but there is an entry in the Materials Project database [40]. This entry shows the compound is nonmagnetic and on that basis, we considered calculations without spin polarization and represented the structure in Figure 5a. We calculated the density of states (DOS) in Figure 5b to obtain the band gap using the HSE06 [29] hybrid functional as implemented in Quantum ESPRESSO [41,42]. HSE06 mixes exact (Fock) exchange with the PBE functional.
The results are generally more accurate than those obtained with PBE or other semi-local functionals. The band gap increases and usually becomes closer to the true values. The self-consistent field (scf) calculation used the SG-15 optimized norm-conserving Vanderbilt (ONCV) pseudo-potentials [43], an energy cutoff of 60 Ry, a 4 × 4 × 4 uniform Monkhorst–Pack k-points grid, and a Gaussian smearing of 1 mRy for Brillouin zone integration.
The DOS calculations use the scf calculation results. The DOS is constructed with an energy step of 1 meV and a simple Gaussian broadening of 2 mRy. The energy cutoff, k-points grid, and other parameters used in the HSE06 functional (q-mesh for the sampling of the Fock operator and energy cutoff for the exact exchange operator) were tested for convergence.
A very slight change in the DOS was only seen between the calculations with 3 × 3 × 3 and 4 × 4 × 4 k-points, with no change in the band gap. As a check, we also calculated the DOS with the PBE semi-local functional, obtaining the same DOS shape and band gap (2.5 eV) as in the Materials Project database [40]. The HSE DOS is shown in Figure 5. The zero of energy is set to the valence band maximum. The band gap of 3.5 eV is seen.

2.5. Scanning Electron Microscopy Coupled with Energy Dispersive Spectral Examination and Inductively Coupled Plasma—Optical Emission Spectrometry Analysis

Figure 6 shows the scanning electron microscopy (SEM) images of calcium bismuthate-synthesized particles, demonstrating that the particles’ composition defines not only their crystal structures but also their surface morphology. The sample’s energy dispersive spectral examination at several sites verified the close-to-1:1 molar ratio of Ca:Bi. The inductively coupled plasma—optical emission spectrometry (ICP–OES) results are also shown in Table 2.
The synthesized CBO composites have a similar Bi-to-Ca molar ratio (1:1), indicating that the calcination temperature has a negligible effect on the element concentration.
It can be seen from the SEM images that the resulting samples of the calcium bismuthates are powder agglomeration composed of particles with sizes of around 700 nm. The particles of Ca2Bi2O5 calcinated at 600 °C and 725 °C show similar aspects: sizes of the particles are under one micron with dumbbell-shaped morphology for particles that may increase the specific surface area.

2.6. Thermal Analysis

Thermal analysis provides information on the transformations that occur during thermal treatment of the precalcinated CBO sample in a temperature range of 25–800 °C. The evolution of mass loss during heat treatment at 450 °C for the calcinated sample is depicted in Figure 7. Certainly, no mass loss should be observed under 450 °C.
The TG curve of the sample shows that the total mass loss of the sample is 14.7% and occurs in three steps between 450 °C and 660 °C.
The first step is up to 550 °C with a slight mass loss of 2.4%. The second step is between 550 °C and 602 °C with a mass loss of 4.3%, accompanied on DTA by an endothermic peak at 577 °C. The third step takes place between 602 °C and 660 °C with the greatest mass loss of 7.9%, with an endothermic peak at 641 °C.
After 660 °C, no mass loss is observed. In all these steps, the mass loss is attributed to the release of CO and CO2 by the decomposition of carbonate-based compounds formed by thermal degradation of oxalates.

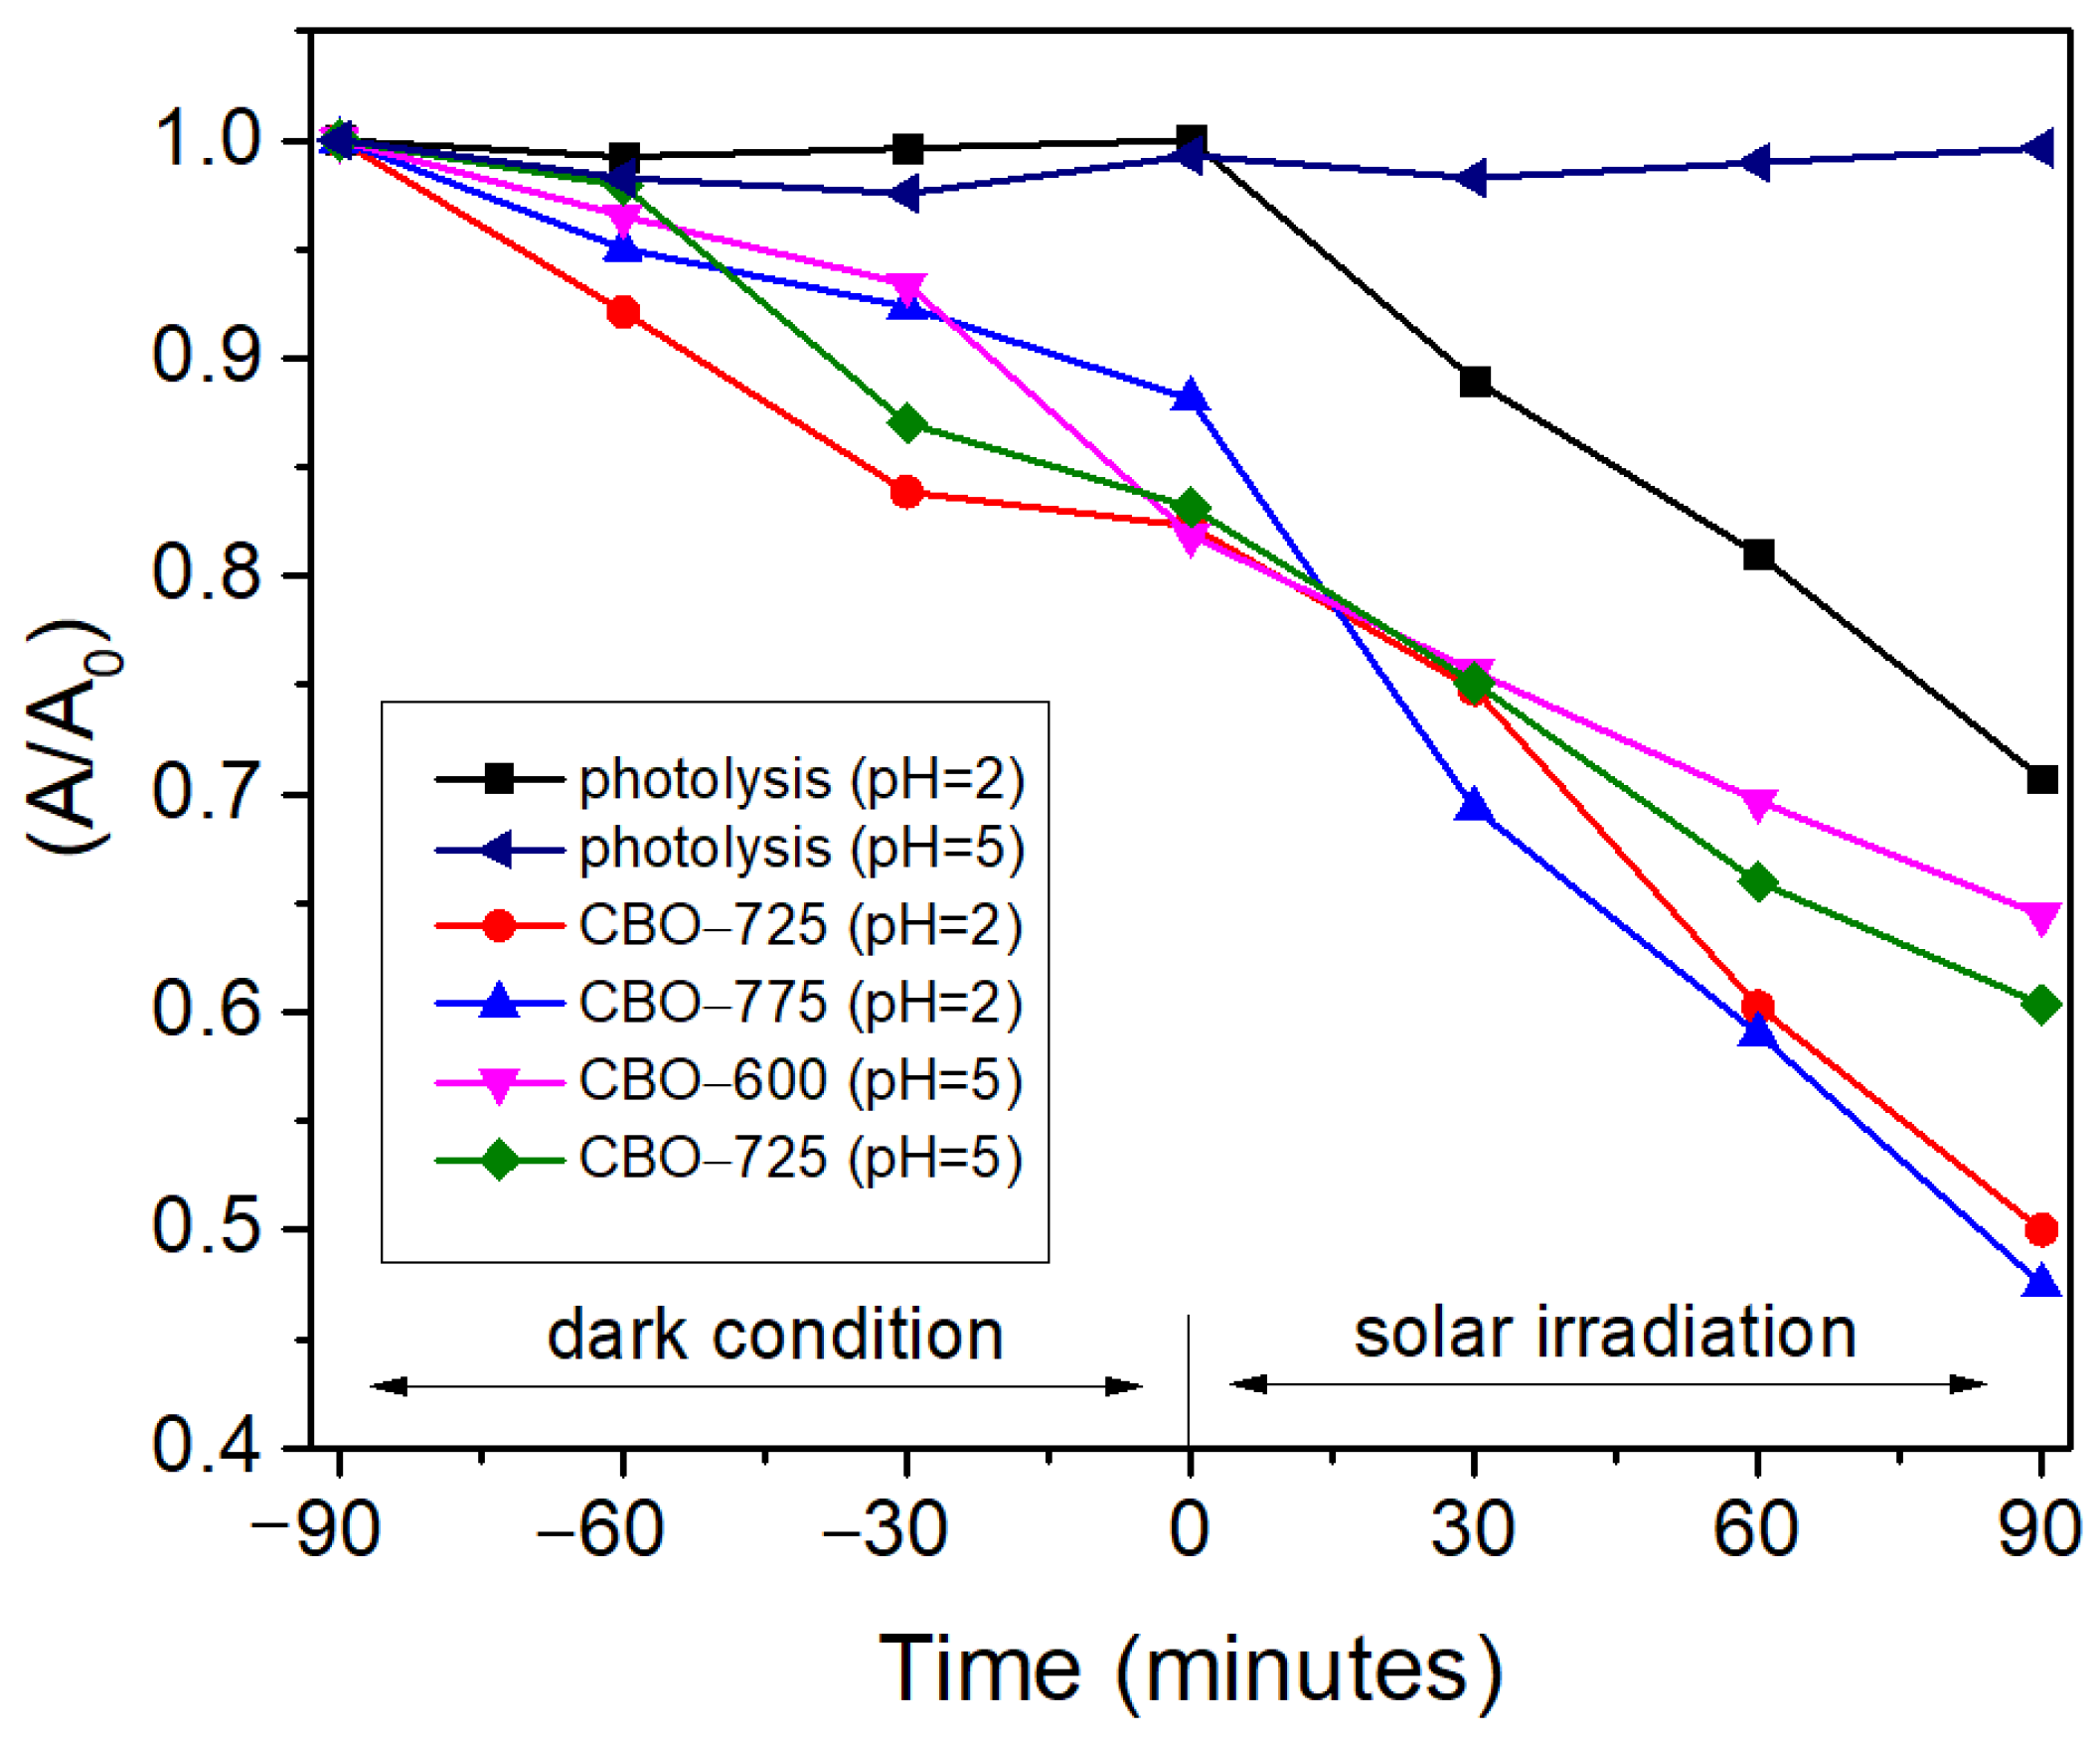
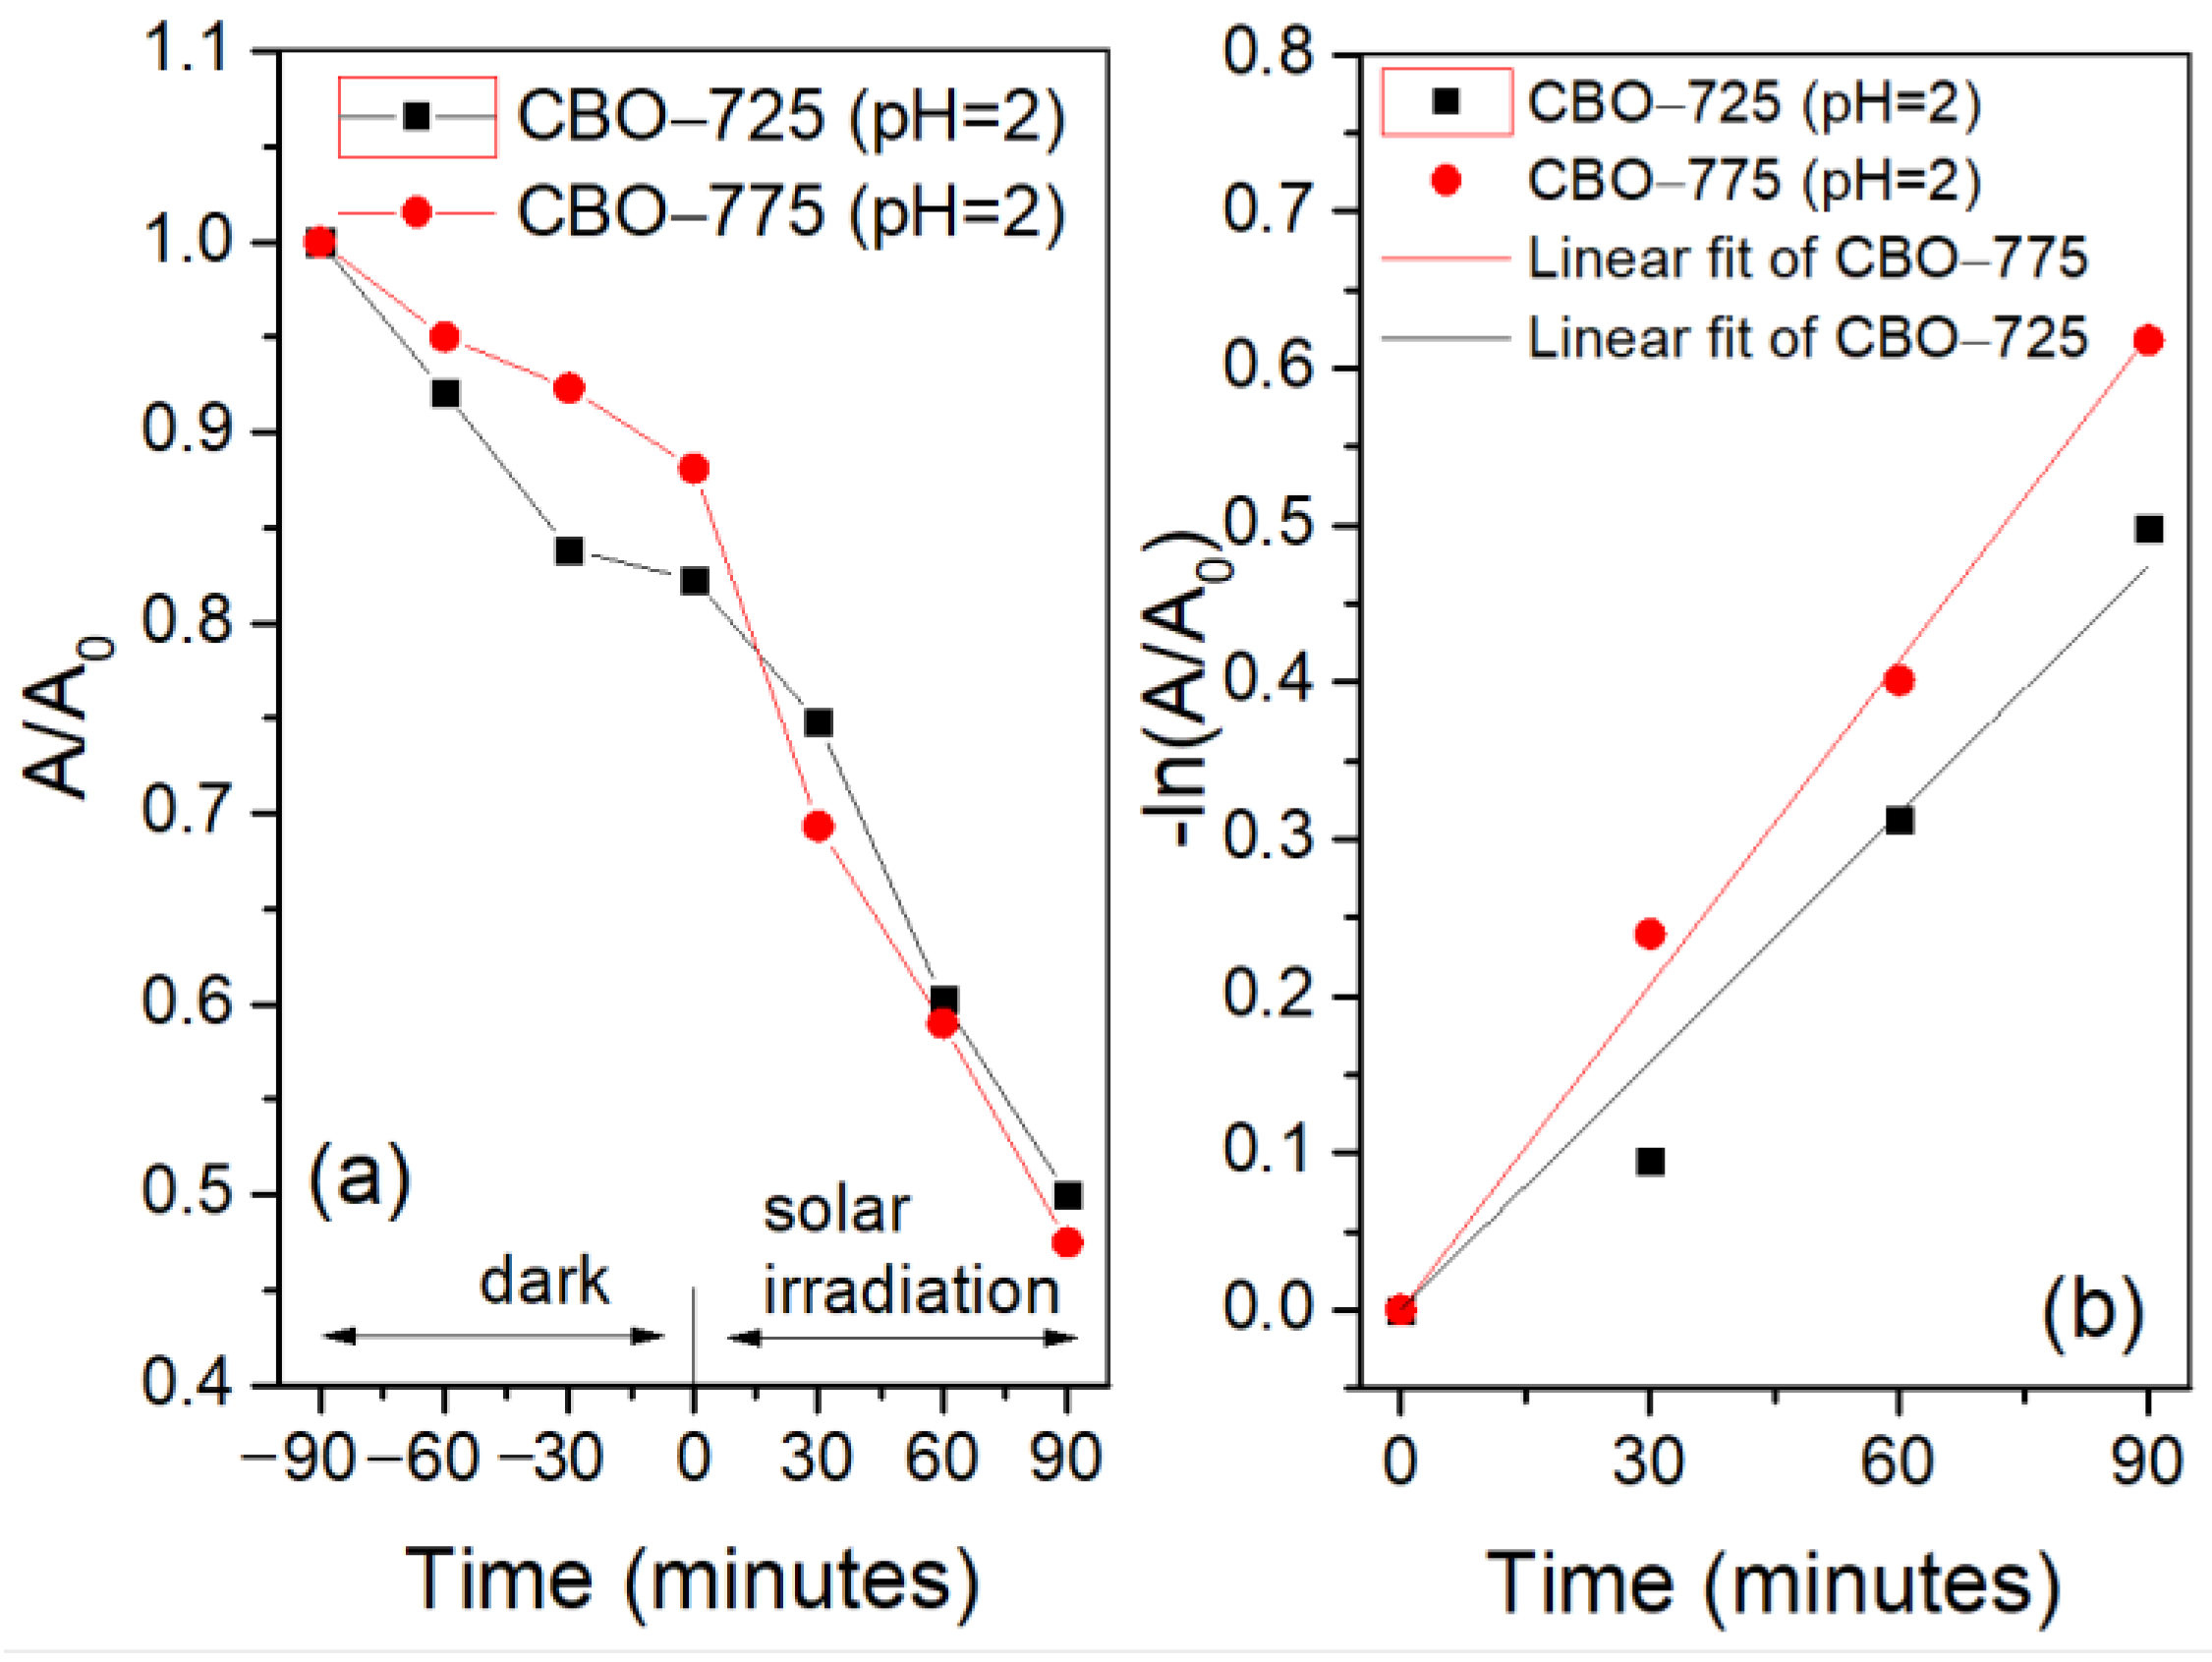
2.7. Catalytic Experiments

Figure 8 demonstrates the ability of all CBO materials to degrade the contaminant during 90 minutes of dark condition followed by 90 minutes of solar irradiation. It can be noticed that after 90 minutes of dark condition, the RhB decolorization percentage is almost the same (around 18%) for CBO-600 and CBO-725 as well as CBO-725 in acidic conditions, whereas CBO-775 contributes to a lower RhB decolorization (12%) in acidic conditions.
After the dark condition and solar irradiation treatments, RhB removal from the solution increases in the following order: 35.5% (CBO-600) < 39.65% (CBO-725) < 50% (CBO-725, pH = 2) < 52.5% (CBO-775, pH = 2). The pH change leads to an enhanced RhB removal when compared with experiments carried out at a normal pH, which is given by two involved processes: RhB photolysis in an acidic medium and photocatalytic degradation. No degradation of RhB occurred during the exposure to solar irradiation without a catalyst at a normal pH while the addition of nitric acid facilitated RhB degradation by photolysis. This can possibly be explained by the fact that nitric acid/nitrates are photochemical reactive species that generate nitrogen oxides and hydroxyl radicals under solar irradiation [44,45,46]. As hydroxyl radicals are strong oxidants, they react with the dye molecules conducting the dye degradation by photolysis [47]. While the share given by the photolysis of RhB was 29.2% after 90 minutes of dark condition and 90 minutes of solar irradiation, the effect given by the catalysts at pH = 2 accounts for 23.22% for CBO-775 and 20.72% for CBO-725.
Figure 9 and Figure 10 present the degradation of RhB (expressed by the A/A0 ratio) for CBO-600 and CBO-725 at normal pH and for CBO-725 and CBO-775 at pH = 2 together with a linear plot of the data under a pseudo-first order reaction in order to emphasize and compare the results obtained in the same conditions.
The fitting parameters (the pseudo-1st order reaction rate constant, k, and regression coefficient, R2) were determined by plotting ln(A0/A) vs. time and are presented in Table 3. By comparing the constant rate values for the experiments carried out at normal pH, it is illustrated that the RhB degradation rate is higher for CBO-725. Similarly, the rate constant is higher for CBO-775 when compared to CBO-725 at pH = 2.
The absorbance peaks of RhB were recorded during the catalytic experiments (adsorption and photocatalytic reaction carried out for different periods of time) and are represented in Figures S1 and S2 (see Supplementary File) by overlapping the spectra in the wavelength range between 460 nm and 620 nm. These time-dependent spectra are represented up to minute 90, 120, or 180, which indicate that the photocatalytic reaction can be maintained for longer periods as the RhB photodegradation progresses after minute 90. Therefore, at pH = 5, the RhB degradation increased from 35.5% (at minute 90) to 46.7% after 30 minutes of the reaction for CBO-600 (Figure S1a) and from 39.65% to 43.16% (at minute 120) and to 50.17% (at minute 180) for CBO-725 (Figure S2b). The degradation percentage was calculated based on the absorbance values recorded at the maximum absorption wavelength of RhB (λmax = 554 nm) and with Equation (3), as described in the Section 4.2.
For the experiments performed in an acidic medium (Figure S2), the pH change led to a shift of the RhB absorbance peak from lower to higher wavelength values, which based on other studies is explained by the carboxylic group dissociation of RhB [48]. In the case of RhB degradation for CBO-725 (Figure S2a), the maximum absorbance was shifted back to lower values and this can explain that the possible RhB degradation mechanism follows a N-deethylation pathway as mentioned in other investigations [49]. This proves that the RhB removal is caused by adsorption and catalytic degradation processes and not only by adsorption.
To the best of our knowledge, there is only one study that has been reported in the literature to evaluate the photodegradation of RhB over Ca2Bi2O5. In study [22], the degradation of RhB after 20 minutes of dark condition and 120 minutes of visible light irradiation was about 93% with a corresponding constant rate for the pseudo-first order reaction of 0.031 min−1. For this result, a 300 mL solution of RhB with a concentration of 10 mg L−1 and 50 mg of catalyst was used, and the catalyst was obtained via the sol-gel method. While our study used a higher catalyst to RhB mass ratio, the degradation of RhB reached a maximum of 52.5% in acidic conditions (for CBO-775) with a corresponding constant rate of 0.0069 min−1. Even if the photocatalytic activity is lower in our study, the novelty of this work consists of testing the photocatalytic properties for the RhB degradation of Ca2Bi2O5 synthesized via the precipitation method, using longer periods for dark condition experiments, and extending the study to an acidic reaction medium.

3. Discussion

Ca2Bi2O5 composite catalysts with a triclinic framework and P-1 space group were prepared via the precipitation method, a simple method where the pure phase was obtained starting at 725 °C. The pure phase was obtained at a similar temperature of 680 °C and 650 °C reported in other studies by Ji et al. [21,22] with the same P-1 space group. Bahmani et al. [50] have used a similar precipitation method starting from different molar ratios of Ca:Bi and obtaining bismuthate structures with particle dimensions of 300 nm. The morphological nature of the obtained catalyst was recorded using SEM from where it was observed that the image presents aggregations from closely packed particles with diameters of less than 1µm, comparable to 180–250 nm as reported by Ji et al. Meanwhile, the EDX spectrum confirmed by ICP-OES shows that the ratio of Ca:Bi is 1:1. The Raman spectra recorded for all the temperatures showed the crystallization structure starting at 725 °C where the shifting is minimally observed and the full width at half-maximum values of the Raman peaks, which is a reflection of the lower structural distribution and presents a sharper Raman line with increasing temperature. The peak recorded for the carbonate disappears with calcination temperature, data that could also be evidenced in the TGA analysis where no mass loss is observed after 664 °C. The change in crystalline structure and phase composition of the CBO materials were also analyzed based on the XRD diffractograms wherein the pure phase is also confirmed for CBO-725 and CBO-775. The crystallite sizes of the Ca2Bi2O5 pure phases were determined from broadening the X-ray diffraction line using the Debye–Scherrer equation (Equation (1)) to calculate the particle size:
D = Kλ/βcosθ
where D is the mean size of crystallites (nm), K is the Scherrer constant, λ is wavelength of the X-ray beam used (1.54, 184 Å), β is the full width at half-maximum (FWHM) of the peak, and θ is the Bragg angle.
The corresponding band energies calculated for the CBO materials in our work are higher than that reported by Ji et al., which is 2.49, and similar to those reported by Shtarev et al. [23] and Wang et al. [28], which are 3.29 eV and 3.34 eV, respectively. This study used HSE functionals to calculate the band energy for the first time and retrieved a value of 3.5 eV, similar to the value of 3.5 eV that was calculated based on recorded UV-VIS data and is in good agreement with the reported value of 3.34 eV by Luo et al. [15] The band gap energies determined by the Tauc plots of the Kubelka–Munk transformation for direct electronic transitions were compared with the mixture phases (CBO-450 and CBO-600). The band gap energies (Eg) of the samples were estimated using the equation:
Ahυ = (Eg)n
Therefore, the band gaps of pure phases are higher than those of the composites of two-phase compositions.
Regarding the photocatalytic study, it was noticed that the RhB removal over CBO materials (calculated with Equation (3) and supported by kinetic parameters) increased along with an increase in calcination temperature and can be attributed to enhanced crystallinity obtained at higher temperatures, which generally facilitates charge mobility in the material [51,52]. The change in photocatalytic properties can be also due to the variation of phases with different corresponding band gap energies and morphologies. The phase transition dictates the modality that the CBO materials absorb light and becomes photoactive. Improved RhB photodegradation efficiency for CBO-775 at pH = 2 when compared with pH = 5 can be explained by the effect of Rhodamine B and nitrate photolysis.
The higher photocatalytic activity of the calcium bismuthate over Bi2O3 is also mentioned in other studies wherein the catalytic properties of CBO materials have been studied [53,54,55].
For future research, we will consider collecting more data on the photocatalytic properties of CBO materials and the underlying mechanisms by extending the experimental conditions, investigations, and calculations for newly synthesized materials.

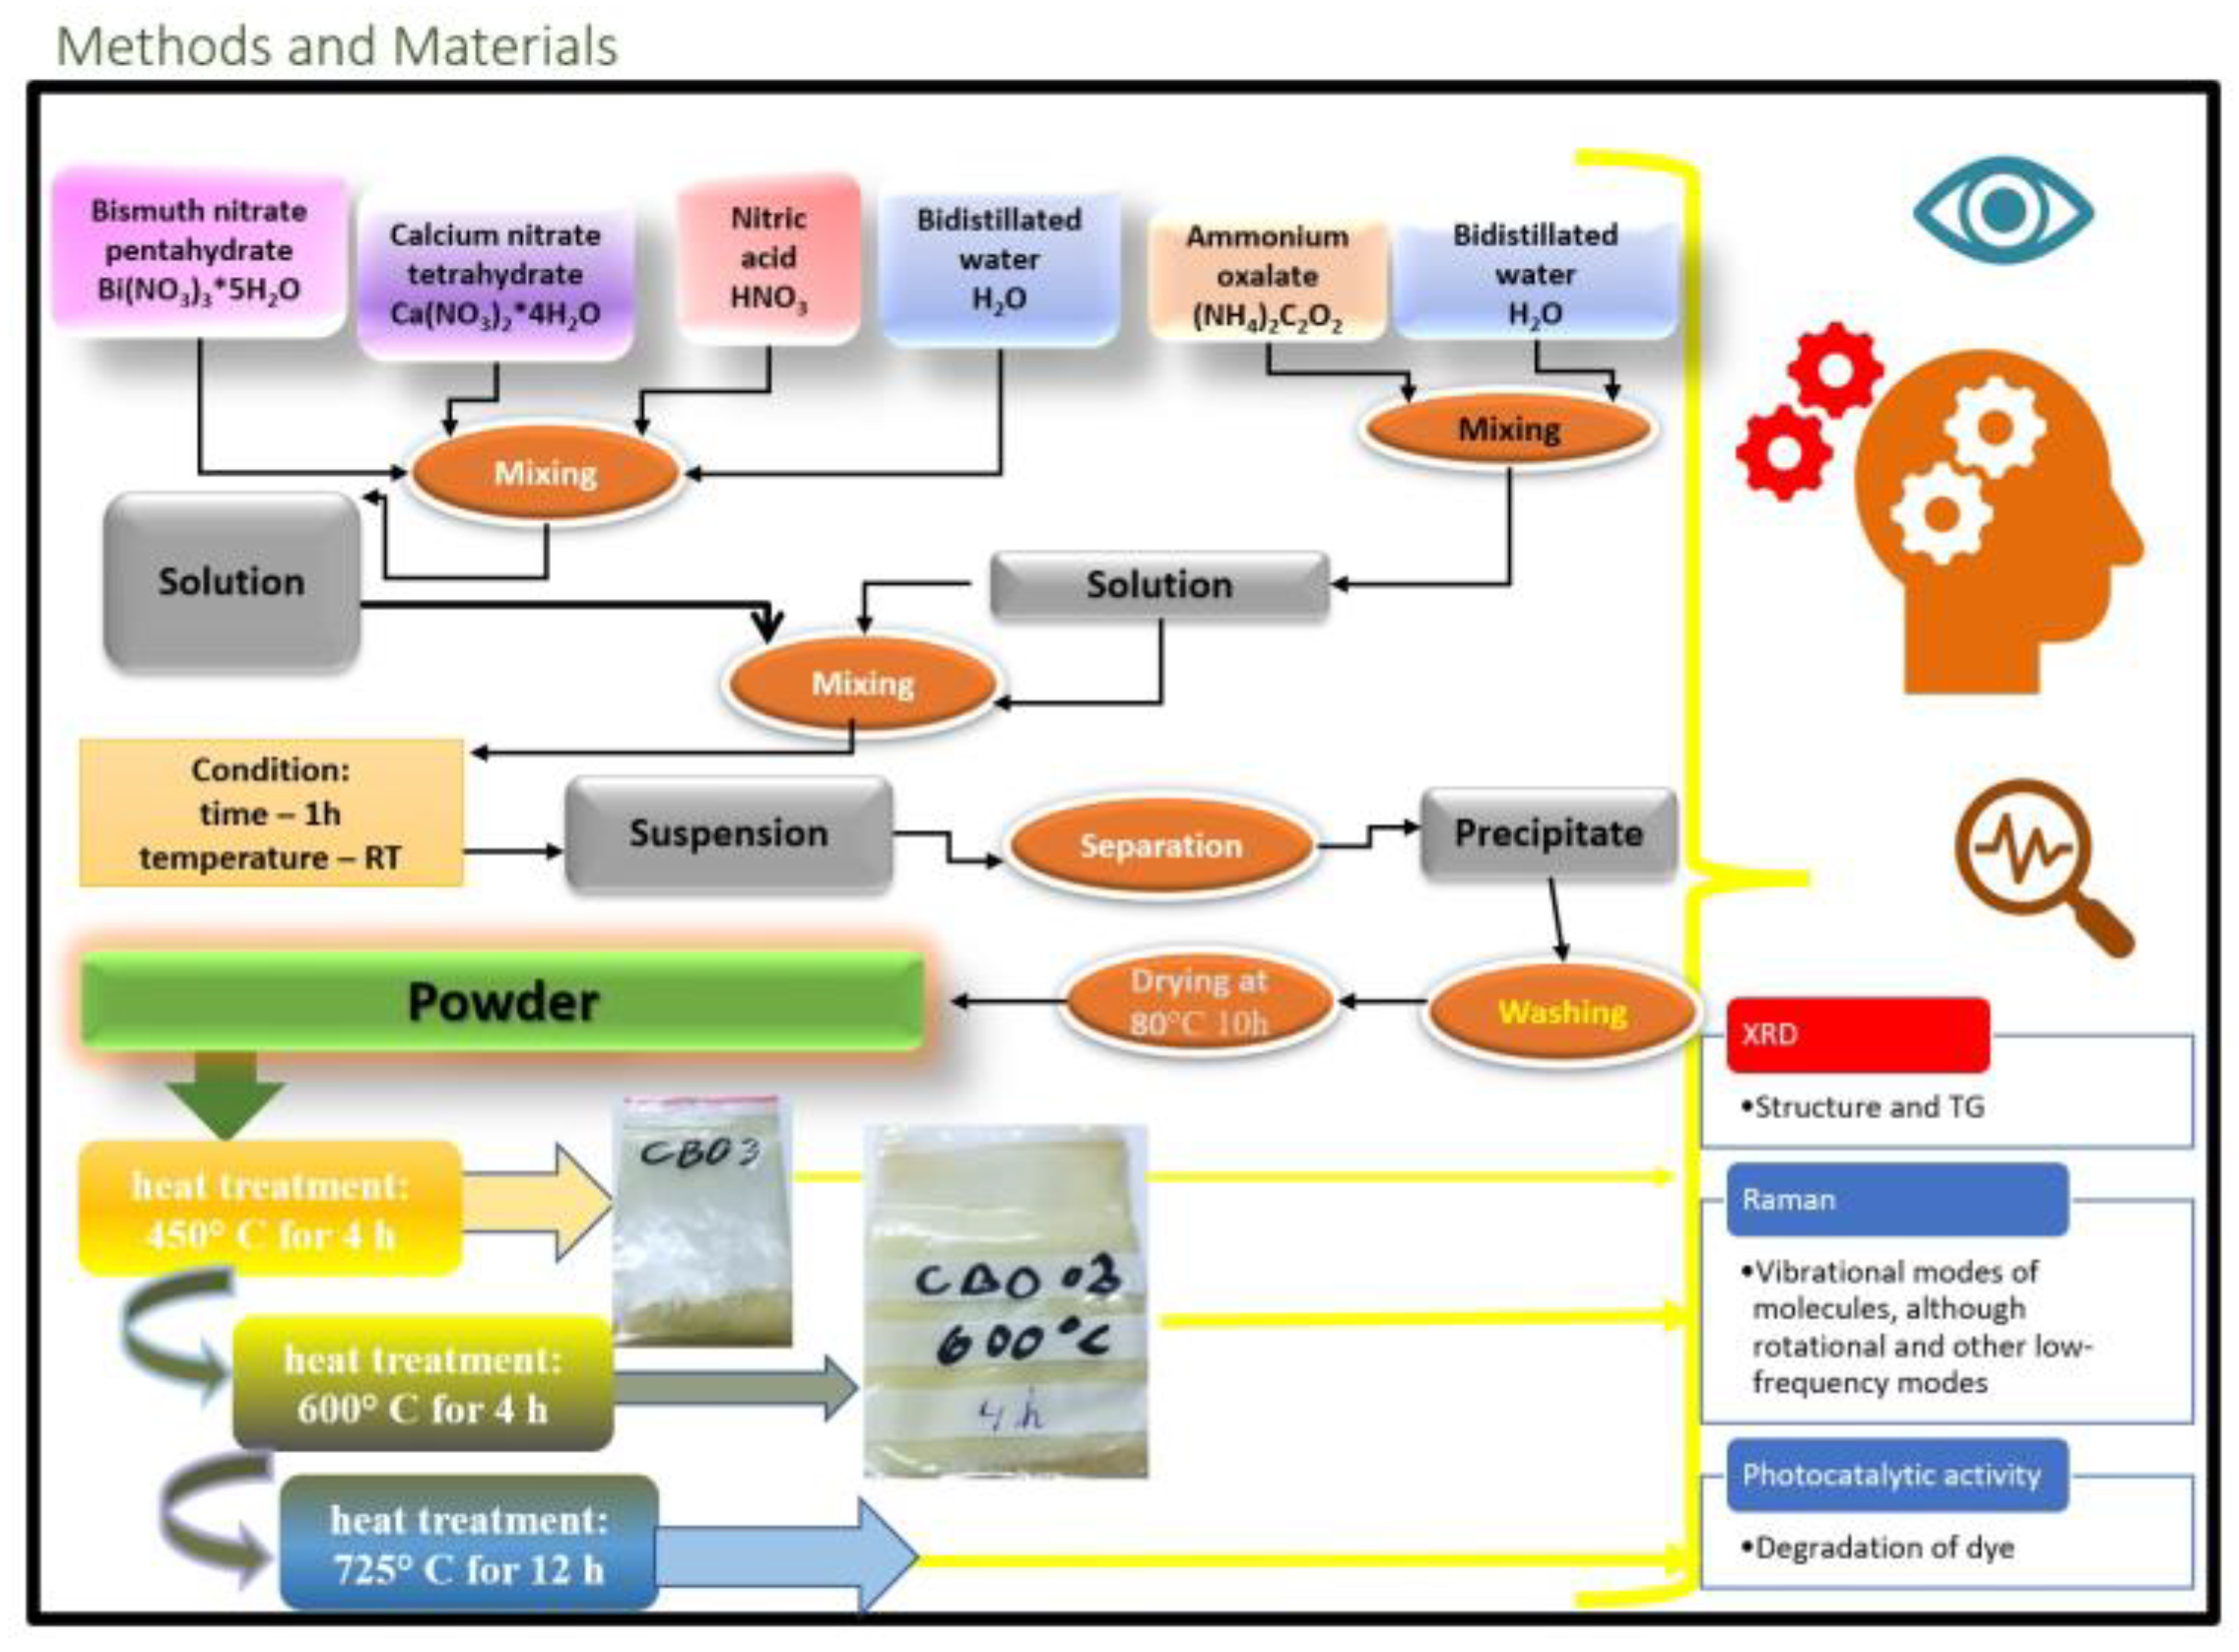
4. Materials and Methods

4.1. Preparation

Calcium bismuth oxide, Ca2Bi2O5 (coded CBO), was prepared via the wet chemical synthesis route using calcium nitrate tetrahydrate (Ca(NO3)2 × 4H2O—Reactivu Bucuresti, p.a.), bismuth nitrate pentahydrate (Bi(NO3)3 × 5H2O—Reactivu Bucuresti, p.a.), nitric acid 65% (HNO3—Chempur, p.a.), and ammonium oxalate ((NH4)2C2O4 × H2O—Reactivu Bucuresti, p.a.). Bi-distilled water was used as a solvent.
In this process, equal volumes of ammonium oxalate 0.4 M and acidified Ca-Bi-nitrate 0.2 M aqueous solutions were prepared and stirred for 1 h to make the solution homogeneous. Afterwards, the ammonium oxalate solution was quickly added to the Ca-Bi solution at room temperature and continually stirred for 1 h for maturation. The precipitate was separated by centrifugation, washed with bi-distilled water, and dried at 80 °C for 10 h. The obtained powder was calcined at 450 °C for 4 h, 600 °C for 4 h, 725 °C for 12 h, and 775 °C for 12 h. Figure 11 shows a schematic representation of the various steps in synthesizing the CBO nanopowder.

4.2. Characterization Techniques

We confirmed the crystal structure and phase purity of Ca2Bi2O5 with powder X-ray diffraction patterns using a PANalytical X’Pert Pro powder diffractometer with a Cu Kα radiation (λ = 0.15406 nm) operating at 45 kV and 30 mA. Infrared spectra (FT-IR) were recorded on a Thermo Scientific Nicolet 6700 FT-IR spectrometer using the KBr pellet method in a wavenumber range of 400–4000 cm−1, 64 scans, and a resolution of 4 cm−1 to study the chemical structures. Raman spectra were obtained using a multi-probe imaging MultiView 1000TM system (Nanonics Imaging, Jerusalem, Israel) and ultraviolet–visible spectroscopy was performed using the UV-Vis spectrometer, Perkin Elmer type Lambda 950, with an integrating sphere module in the 300–1000 nm range. Morphological characterization of the samples was performed by recording the scanning electron microscopy images (SEM, JEOL-6700F). The phase transformations were studied from a thermogravimetric analysis (TGA) with a Mettler–Toledo TGA/SDTA851 in an argon atmosphere in the 50 °C to 1000 °C range with a heating rate of 10 °C min−1. The chemical analysis of the Ca2Bi2O5 powders was carried out through an inductively coupled plasma optical emission spectrometry (ICP-OES) using a PerkinElmer Optima 2100 DV spectrometer. The calcium and bismuth detection was made at 317.933 nm (detection limit 0.00002 mg/L) and 223.061 nm (detection limit 0.02 mg/L), respectively. Ca2Bi2O5 samples were brought in solution by acidic digestion (HNO3 and H2O2). The bismuth-based materials obtained at different temperatures were also studied for environmental application through the investigation of their adsorbent and solar energy catalyst properties. The CBO materials were mixed in a 30 mL suspension together with an aqueous solution of RhB at 500 rpm for 90 minutes during the adsorption process and for 90–180 minutes for the solar-driven catalysis, following the adsorption stage. The solar energy is provided by a solar simulator (Sol2A 94042A, Oriel Instruments/Newport Corporation) with a power of 1 sun and the glass containing the suspension was placed at a distance of 7 cm under the simulator. RhB (extra, manufactured in Hannover, Germany) was selected as a contaminant and the aim was to analyze the removal of RhB in the catalysis and adsorption processes. RhB removal was studied using UV-VIS spectroscopy: the absorbance of the RhB solution was recorded at certain time intervals after small amounts of solution (about 3 mL) were separated from the suspension by centrifugation (3 minutes at 10,000 rpm). The RhB removal was calculated as follows using the well-known formula (Equation (1)):
r e m o v a l   y i e l d   % = 1 A b s t A b s 0 × 100
where Abst is the absorbance recorded at time, t, and Abs0 is the absorbance of the RhB solution at minute 0 at λmax = 554 nm and at λmax = 557 nm (at pH = 2). The pH was modified for the experiments carried out at pH = 2 using HNO3 (0.1 M).
The absorbance was recorded with a UV-VIS spectrophotometer (portable and modular Jaz spectrophotometer from Ocean Optics), which was connected with an optical fiber cable to the cuvette holder where a quartz of cuvette was placed and the cuvette holder was further connected to the light source (LS-1 from Ocean Optics).
The initial concentration of the RhB solution was 1.5 ppm and the catalyst concentration was 1 g/L. The stirring of the suspension was conducted with a magnetic stirrer (magnetic stirrer with hotplate MSH-20D, witeg Labortechnik GmbH, Wertheim, Germany). As well, the separation of the RhB solution from the suspension was carried out with a centrifuge (Nahita mini centrifuge, Germany).

Supplementary Materials

The following supporting information can be downloaded at: https://www.mdpi.com/article/10.3390/inorganics11020079/s1, Figure S1:Variations of RhB corresponding visible absorbance peak for (a) CBO-600 and for (b) CBO-775; Figure S2: Variations of RhB corresponding visible absorbance peak for (a) CBO-725 and for (b) CBO-775 at pH = 2; Figure S3: (a) RhB removal curves over CBO-600 and CBO-725 at normal pH–5; (b) the corresponding pseudo-first-order kinetic curve from 0 to 90 min; (c) the corresponding pseudo-first-order kinetic curve from −90 to 90 min; Figure S4: (a) RhB removal curves over CBO-725 and CBO-775 at pH = 2 and (b) the corresponding pseudo-first-order kinetic curve from 0 to 90 min; (c) the corresponding pseudo-first-order kinetiv curves from −90 to 90 min; Table S1: Table 3. Kinetic parameters resulted in the linear plotting of the first order reaction for photodegradation RhB over all materials from 0 to 90 min and from −90 and 90 min respectively.

Author Contributions

Conceptualization, F.Ș.R. and M.I.; methodology, A.I.C.; software, M.I.; validation, F.Ș.R.; formal analysis; investigation, resources, data curation, writing—original draft preparation, F.Ș.R.; writing—review and editing, A.I.C. and M.I.; visualization, J.N.G.; supervision, F.Ș.R.; project administration, A.I.C. and J.N.G. All authors have read and agreed to the published version of the manuscript.

Funding

F.Ș.R. and M.I. work was carried out through the Nucleu Program within the National Research Development and Innovation Plan 2022–2027, carried out with the support of MCID, project no PN 23 27 02 01, contract no. 29N/2023. A.I.C. work was supported by a grant of the Romanian National Authority for Scientific Research and Innovation, CNCS/CCCDI-UEFISCDI, PN-III-P2-2.1-PED-2021-2421.

Institutional Review Board Statement

Not applicable.

Informed Consent Statement

Not applicable.

Data Availability Statement

Not applicable.

Acknowledgments

We want to thank Corina Orha for the SEM images and Ana Maria Grozescu for the UV-VIS measurements.

Conflicts of Interest

The authors declare no conflict of interest.

References

  1. Okello, C.; Tomasello, B.; Greggio, N.; Wambiji, N.; Antonellini, M. Impact of Population Growth and Climate Change on the Freshwater Resources of Lamu Island, Kenya. Water 2015, 7, 1264–1290. [Google Scholar] [CrossRef]
  2. Lin, Y.; Wu, S.; Li, X.; Wu, X.; Yang, C.; Zeng, G.; Peng, Y.; Zhou, Q.; Lu, L. Microstructure and Performance of Z-Scheme Photocatalyst of Silver Phosphate Modified by MWCNTs and Cr-Doped SrTiO3 for Malachite Green Degradation. Appl. Catal. B Environ. 2018, 227, 557–570. [Google Scholar] [CrossRef]
  3. Lin, Y.; Wu, X.; Han, Y.; Yang, C.; Ma, Y.; Du, C.; Teng, Q.; Liu, H.; Zhong, Y. Spatial Separation of Photogenerated Carriers and Enhanced Photocatalytic Performance on Ag3PO4 Catalysts via Coupling with PPy and MWCNTs. Appl. Catal. B Environ. 2019, 258, 117969. [Google Scholar] [CrossRef]
  4. Martínez, J.; Cortés, J.F.; Miranda, R. Green Chemistry Metrics, A Review. Processes 2022, 10, 1274. [Google Scholar] [CrossRef]
  5. Ritchie, H.; Roser, M. Environmental Impacts of Food Production. Available online: https://ourworldindata.org/environmental-impacts-of-food (accessed on 9 December 2022).
  6. Manisalidis, I.; Stavropoulou, E.; Stavropoulos, A.; Bezirtzoglou, E. Environmental and Health Impacts of Air Pollution: A Review. Front. Public Health 2020, 8, 14. [Google Scholar] [CrossRef]
  7. Jaishankar, M.; Tseten, T.; Anbalagan, N.; Mathew, B.B.; Beeregowda, K.N. Toxicity, Mechanism and Health Effects of Some Heavy Metals. Interdiscip. Toxicol. 2014, 7, 60–72. [Google Scholar] [CrossRef]
  8. Safitri, Y.A.; Indrawan, I.W.A.; Winarsih, S. Rhodamine B Induces Oxidative Stress and Cervical Epithelial Cell Proliferation in the Uterus. Toxicol. Rep. 2015, 2, 1434–1436. [Google Scholar] [CrossRef]
  9. Maryantï, S.A.; Sucïatï, S.; Wahyunï, E.S.; Santoso, S.; Wïyasa, İ.W.A. Rhodamine B Triggers Ovarian Toxicity Through Oxidative Stress. Cukurova Med. J. 2014, 39, 451–457. [Google Scholar] [CrossRef]
  10. Atri, S.; Malik, V.; Uma, S.; Nagarajan, R. Catalytic Applications of Mesoporous CaBi2O4 Obtained from a Single Source Precursor. Res. Chem. Intermed. 2019, 45, 2457–2470. [Google Scholar] [CrossRef]
  11. Tang, J.; Zou, Z.; Ye, J. Efficient Photocatalytic Decomposition of Organic Contaminants over CaBi2O4 under Visible-Light Irradiation. Angew. Chem. Int. Ed. 2004, 43, 4463–4466. [Google Scholar] [CrossRef]
  12. Rokesh, K.; Sakar, M.; Do, T.O. Calcium Bismuthate (CaBiO3): A Potential Sunlight-Driven Perovskite Photocatalyst for the Degradation of Emerging Pharmaceutical Contaminants. ChemPhotoChem 2020, 4, 373–380. [Google Scholar] [CrossRef]
  13. Khosya, M.; Faraz, M.; Khare, N. Enhanced Photocatalytic Reduction of Hexavalent Chromium by Using Piezo-Photo Active Calcium Bismuth Oxide Ferroelectric Nanoflakes. New J. Chem. 2022, 46, 12244–12251. [Google Scholar] [CrossRef]
  14. Parise, J.B.; Torardi, C.C.; Rawn, C.J.; Roth, R.S.; Burton, B.P.; Santoro, A. Synthesis and Structure of Ca6Bi6O15: Its Relationship to Ca4Bi6O13. J. Solid State Chem. 1993, 102, 132–139. [Google Scholar] [CrossRef]
  15. Luo, W.; Tang, J.; Zou, Z.; Ye, J. Preparation and Photophysical Properties of Some Oxides in Ca–Bi–O System. J. Alloys Compd. 2008, 455, 346–352. [Google Scholar] [CrossRef]
  16. Wang, Y.; He, Y.; Li, T.; Cai, J.; Luo, M.; Zhao, L. Novel CaBi6O10 Photocatalyst for Methylene Blue Degradation under Visible Light Irradiation. Catal. Commun. 2012, 18, 161–164. [Google Scholar] [CrossRef]
  17. Li, W.; Kong, D.; Cui, X.; Du, D.; Yan, T.; You, J. Hydrothermal Synthesis of Ca3Bi8O15 Rods and Their Visible Light Photocatalytic Properties. Mater. Res. Bull. 2014, 51, 69–73. [Google Scholar] [CrossRef]
  18. Kumada, N.; Xu, N.; Miura, A.; Takei, T. Preparation and Photocatalytic Properties of New Calcium and Lead Bismuthates. J. Ceram. Soc. Jpn. 2014, 122, 509–512. [Google Scholar] [CrossRef]
  19. Fang, L.; Jiang, X.W.; Guo, H.H. Ultralow Sintering Temperature Stable Type Microwave Dielectric Ceramic Ca5Bi14O26 and Preparation Method Thereof. CN103496972A, 8 January 2014. [Google Scholar]
  20. Solarska, R.; Heel, A.; Ropka, J.; Braun, A.; Holzer, L.; Ye, J.; Graule, T. Nanoscale Calcium Bismuth Mixed Oxide with Enhanced Photocatalytic Performance under Visible Light. Appl. Catal. Gen. 2010, 382, 190–196. [Google Scholar] [CrossRef]
  21. Ji, X.; Lu, J.-F.; Wang, Q.; Zhang, D. Impurity Doping Approach on Bandgap Narrowing and Improved Photocatalysis of Ca2Bi2O5. Powder Technol. 2020, 376, 708–723. [Google Scholar] [CrossRef]
  22. Ji, X.; Wang, Q.; Lu, J.-F.; Zhang, D. Construction of a Novel Ca2Bi2O5/α-Bi2O3 Semiconductor Heterojunction for Enhanced Visible Photocatalytic Application. Ceram. Int. 2020, 46, 13630–13640. [Google Scholar] [CrossRef]
  23. Shtarev, D.S.; Ryabchuk, V.K.; Rudakova, A.V.; Shtareva, A.V.; Molokeev, M.S.; Kirichenko, E.A.; Serpone, N. Phenomenological Rule from Correlations of Conduction/Valence Band Energies and Bandgap Energies in Semiconductor Photocatalysts: Calcium Bismuthates versus Strontium Bismuthates. ChemCatChem 2020, 12, 1551–1555. [Google Scholar] [CrossRef]
  24. Zyryanov, V.V. Mechanochemical Synthesis and Thermal Behavior of Metastable Mixed Oxides in the CaO–Sb2O3–Bi2O3 System. Inorg. Mater. 2003, 39, 1163–1171. [Google Scholar] [CrossRef]
  25. Rawn, C.J.; Roth, R.S.; McMurdie, H.F. Powder X-Ray Diffraction Data for Ca2Bi2O5and C4Bi6O13. Powder Diffr. 1992, 7, 109–111. [Google Scholar] [CrossRef]
  26. Roth, R.S.; Hwang, N.M.; Rawn, C.J.; Burton, B.P.; Ritter, J.J. Phase Equilibria in the Systems CaO–CuO and CaO-Bi2O3. J. Am. Ceram. Soc. 1991, 74, 2148–2151. [Google Scholar] [CrossRef]
  27. Burton, B.P.; Rawn, C.J.; Roth, R.S.; Hwang, N.M. Phase Equilibria and Crystal Chemistry in Portions of the System SrO-CaO-Bi2O3-CuO, Part IV- The System CaO-Bi2O3-CuO. J. Res. Natl. Inst. Stand. Technol. 1993, 98, 469–516. [Google Scholar] [CrossRef]
  28. Wang, H.Y.; Xiong, K.; Hu, Y.C.; Zhang, K.L.; Xiong, R. The Morphology Effect on Ca-Bi-O System Photocatalytic Property under Visible-Light Irradiation. Key Eng. Mater. 2013, 538, 219–222. [Google Scholar] [CrossRef]
  29. Heyd, J.; Scuseria, G.E.; Ernzerhof, M. Hybrid Functionals Based on a Screened Coulomb Potential. J. Chem. Phys. 2003, 118, 8207–8215. [Google Scholar] [CrossRef]
  30. Thongkam, M.; Saelim, J.; Boonchom, B.; Seesanong, S.; Chaiseeda, K.; Laohavisuti, N.; Bunya-atichart, K.; Boonmee, W.; Taemchuay, D. Simple and Rapid Synthesis of Calcium Acetate from Scallop Shells to Reduce Environmental Issues. Adsorpt. Sci. Technol. 2021, 2021, 6450289. [Google Scholar] [CrossRef]
  31. dos Santos, V.H.J.M.; Pontin, D.; Ponzi, G.G.D.; Stepanha, A.S.D.G.; Martel, R.B.; Schütz, M.K.; Einloft, S.M.O.; Dalla Vecchia, F. Application of Fourier Transform Infrared Spectroscopy (FTIR) Coupled with Multivariate Regression for Calcium Carbonate (CaCO3) Quantification in Cement. Constr. Build. Mater. 2021, 313, 125413. [Google Scholar] [CrossRef]
  32. Kiefer, J.; Stärk, A.; Kiefer, A.; Glade, H. Infrared Spectroscopic Analysis of the Inorganic Deposits from Water in Domestic and Technical Heat Exchangers. Energies 2018, 11, 798. [Google Scholar] [CrossRef] [Green Version]
  33. Klyndyuk, A.; Krasutskaya, N.; Khort, A. Synthesis and Properties of Ceramics Based on a Layered Bismuth Calcium Cobaltite. Inorg. Mater. 2018, 54, 509–514. [Google Scholar] [CrossRef]
  34. Wu, Z.; Zhao, H.; Zhou, X.; Wang, Y.; Zuo, K.; Cheng, H. Thermal Migration Behavior of Na+, Cu2+ and Li+ in Montmorillonite. Minerals 2022, 12, 477. [Google Scholar] [CrossRef]
  35. Pan, Y.; Shen, X.; Yao, L.; Bentalib, A.; Peng, Z. Active Sites in Heterogeneous Catalytic Reaction on Metal and Metal Oxide: Theory and Practice. Catalysts 2018, 8, 478. [Google Scholar] [CrossRef]
  36. Parrino, F.; Conte, P.; De Pasquale, C.; Laudicina, V.A.; Loddo, V.; Palmisano, L. Influence of Adsorbed Water on the Activation Energy of Model Photocatalytic Reactions. J. Phys. Chem. C 2017, 121, 2258–2267. [Google Scholar] [CrossRef]
  37. Rubbens, A.; Drache, M.; Roussel, P.; Wignacourt, J.P. Raman Scattering Characterization of Bismuth Based Mixed Oxides with Bi2O3 Related Structures. Mater. Res. Bull. 2007, 42, 1683–1690. [Google Scholar] [CrossRef]
  38. Zhang, F.X.; Manoun, B.; Saxena, S.K.; Zha, C.S. Structural Behavior of Sr2Bi2O5 at High Pressures. J. Solid State Chem. 2006, 179, 544–550. [Google Scholar] [CrossRef]
  39. Roy, D.; Samu, G.F.; Hossain, M.K.; Janáky, C.; Rajeshwar, K. On the Measured Optical Bandgap Values of Inorganic Oxide Semiconductors for Solar Fuels Generation. Catal. Today 2018, 300, 136–144. [Google Scholar] [CrossRef]
  40. The Materials Project. Materials Data on Ca2Bi2O5 by Materials Project; LBNL Materials Project; Lawrence Berkeley National Lab. (LBNL): Berkeley, CA, USA, 2020. [Google Scholar]
  41. Giannozzi, P.; Baroni, S.; Bonini, N.; Calandra, M.; Car, R.; Cavazzoni, C.; Ceresoli, D.; Chiarotti, G.L.; Cococcioni, M.; Dabo, I.; et al. QUANTUM ESPRESSO: A Modular and Open-Source Software Project for Quantum Simulations of Materials. J. Phys. Condens. Matter 2009, 21, 395502. [Google Scholar] [CrossRef]
  42. Giannozzi, P.; Andreussi, O.; Brumme, T.; Bunau, O.; Buongiorno Nardelli, M.; Calandra, M.; Car, R.; Cavazzoni, C.; Ceresoli, D.; Cococcioni, M.; et al. Advanced Capabilities for Materials Modelling with Quantum ESPRESSO. J. Phys. Condens. Matter 2017, 29, 465901. [Google Scholar] [CrossRef]
  43. Schlipf, M.; Gygi, F. Optimization Algorithm for the Generation of ONCV Pseudopotentials. Comput. Phys. Commun. 2015, 196, 36–44. [Google Scholar] [CrossRef] [Green Version]
  44. Ye, C.; Gao, H.; Zhang, N.; Zhou, X. Photolysis of Nitric Acid and Nitrate on Natural and Artificial Surfaces. Environ. Sci. Technol. 2016, 50, 3530–3536. [Google Scholar] [CrossRef]
  45. Chen, L.; Kong, L.; Tong, S.; Yang, K.; Jin, S.; Wang, C.; Wang, L. Aqueous Phase Oxidation of Bisulfite Influenced by Nitrate Photolysis. Sci. Total Environ. 2021, 785, 147345. [Google Scholar] [CrossRef]
  46. Zafiriou, O.C.; True, M.B. Nitrate Photolysis in Seawater by Sunlight. Mar. Chem. 1979, 8, 33–42. [Google Scholar] [CrossRef]
  47. Ferrari, C.; Chen, H.; Lavezza, R.; Santinelli, C.; Longo, I.; Bramanti, E. Photodegradation of Rhodamine B Using the Microwave/UV/H2O2: Effect of Temperature. Int. J. Photoenergy 2013, 2013, e854857. [Google Scholar] [CrossRef]
  48. McHedlov-Petrosyan, N.O.; Kholin, Y.V. Aggregation of Rhodamine B in Water. Russ. J. Appl. Chem. 2004, 77, 414–422. [Google Scholar] [CrossRef]
  49. Chen, F.; Zhao, J.; Hidaka, H. Highly Selective Deethylation of Rhodamine B: Adsorption and Photooxidation Pathways of the Dye on the TiO2/SiO2 Composite Photocatalyst. Int. J. Photoenergy 2003, 5, 209–217. [Google Scholar] [CrossRef]
  50. Bahmani, A.; Sellami, M.; Bettahar, N. Synthesis of Bismuth Mixed Oxide by Thermal Decomposition of a Coprecipitate Precursor. J. Therm. Anal. Calorim. 2012, 107, 955–962. [Google Scholar] [CrossRef]
  51. Huerta-Flores, A.M.; Sánchez-Martínez, D.; del Rocío Hernández-Romero, M.; Zarazúa-Morín, M.E.; Torres-Martínez, L.M. Visible-Light-Driven BaBiO3 Perovskite Photocatalysts: Effect of Physicochemical Properties on the Photoactivity towards Water Splitting and the Removal of Rhodamine B from Aqueous Systems. J. Photochem. Photobiol. Chem. 2019, 368, 70–77. [Google Scholar] [CrossRef]
  52. Patrocinio, A.O.T.; Schneider, J.; França, M.D.; Santos, L.M.; Caixeta, B.P.; Machado, A.E.H.; Bahnemann, D.W. Charge Carrier Dynamics and Photocatalytic Behavior of TiO2 Nanopowders Submitted to Hydrothermal or Conventional Heat Treatment. RSC Adv. 2015, 5, 70536–70545. [Google Scholar] [CrossRef]
  53. Wang, Y.; Li, T.; Cai, J.; Luo, M.; Leihong, Z. Photocatalytic Degradation of Methylene Blue on CaBi6O10/Bi2O3 Composites under Visible Light. Chem. Eng. J. 2012, s189–s190, 473–481. [Google Scholar] [CrossRef]
  54. Shtarev, D.; Doronin, I.; Blokh, A.; Shtareva, A. Dependency of the Optical Properties of Heterogeneous Calcium Bismuthate–Bismuth Oxide Particles on the Order of Layers Alternation. Opt. Quantum Electron. 2016, 48, 1–9. [Google Scholar] [CrossRef]
  55. Wu, Z.; Zeng, D.; Liu, X.; Yu, C.; Yang, K.; Liu, M. Hierarchical δ-Bi2O3/Bi2O2CO3 Composite Microspheres: Phase Transformation Fabrication, Characterization and High Photocatalytic Performance. Res. Chem. Intermed. 2018, 44, 5995–6010. [Google Scholar] [CrossRef]
Figure 1. XRD diffractograms of CBO samples calcinated at different temperatures.
Inorganics 11 00079 g001
Figure 2. FTIR spectra of CBO samples calcinated at different temperatures.
Inorganics 11 00079 g002
Figure 3. Raman spectra recorded vs. wavelength for the CBO at different temperatures; in the inset is the calcite spectra recorded versus CBO-450.
Inorganics 11 00079 g003
Figure 4. (a) The plot of (αhν2 vs. (hν)) with optical band gaps determination; (b) the band gap of CBO-450 and CBO-600.
Inorganics 11 00079 g004
Figure 5. (a) Structure of Ca2Bi2O5 visualizations; (b) Total density of states calculated with HSE06 functional.
Inorganics 11 00079 g005
Figure 6. SEM pictures recorded for (a) CBO-600 at 10 µm, (b) CBO-725 at 10 µm, (c) CBO-725 at 5 µm, and (d) CBO-775 at 5 µm.
Inorganics 11 00079 g006
Figure 7. The thermal behavior (TG, DTA, and DTG curves) of CBO-450.
Inorganics 11 00079 g007
Figure 8. RhB degradation in terms of absorbance ratio for 30 mL RhB solution (of 1.5 ppm initial concentration) over CBO materials (with concentration of 1 g L−1) at pH = 2 and pH = 5 under continuous stirring.
Inorganics 11 00079 g008
Figure 9. (a) RhB removal curves over CBO-600 and CBO-725 at normal pH—5; (b) the corresponding pseudo-first order kinetic curve.
Inorganics 11 00079 g009
Figure 10. (a) RhB removal curves for CBO-725 and CBO-775 at pH = 2 and (b) the corresponding pseudo-first order kinetic curve.
Inorganics 11 00079 g010
Figure 11. Schematic representation of obtaining and characterization of CBO system.
Inorganics 11 00079 g011
Table 1. Scientific literature review for photocatalytic degradation of various contaminants over CBO materials.
CBO TypeCatalyst
Concentration
(ppm)
Contaminant TypeVolume (mL) and Concentration (ppm)
of Contaminant
Degradation
Efficiency of Contaminant (%)
Irradiation
Source
Source
CaBi6O10/Bi2O310Methylene blue300 mL of 1 ppm97% after 180 minutes of irradiation and 1 h of adsorptionVisible light irradiation[16]
CaBi6O1010Methylene blue300 mL of 1 ppm75% after 180 minutes of irradiation and 1 h of adsorptionVisible light irradiation[16]
CaBiO3300Ciprofloxacin100 mL of 10 ppm90.5% after 90 minutes of irradiation and 15 minutes of adsorptionSolar light irradiation[12]
CaBiO3300Tetracycline100 mL of 30 ppm68.6% after 90 minutes of irradiation and 15 minutes of adsorptionSolar light irradiation[12]
CaBi2O4−x1500Methylene blue100 mL of 16 ppm100% after 75 minutes of irradiation and 30 minutes of adsorptionVisible light irradiation[20]
Ca2Bi2O5167Methylene blue300 mL of 10 ppm87% after 40 minutes of irradiation and 30 minutes of adsorptionVisible light irradiation[21]
Ca2Bi2O5167Rhodamine B300 mL of 10 ppm93% after 120 minutes of irradiation and 30 minutes of adsorptionVisible light irradiation[22]
Ca2Bi2O5/0.1α-Bi2O3167Rhodamine B300 mL of 10 ppm100% after 60 minutes of irradiation and 30 minutes of adsorptionVisible light irradiation[22]
CaBiO3900Cr(VI)100 mL of 364 ppm94% after 120 minutes of irradiation and 45 minutes of adsorptionVisible light irradiation[13]
Table 2. The sample’s energy dispersive spectral examination at several sites, verified by ZAF quantification and ICP results.
EDAX ZAF Quantification (Standardless)
Element NormalizedWt %At %
O K14.2956.43
CaK13.8721.86
BiL71.8321.71
ICP
ElementMolar Ratio
Ca1
Bi1
Table 3. Kinetic parameters resulting from the linear plotting of the first order reaction for the photodegradation of RhB over all materials.
CatalystFitting Parameters (First Order Reaction)
k (min−1)R2
pH = 5
CBO-6000.00270.9999
CBO-7250.00360.9978
pH = 2
CBO-7250.00530.9830
CBO-7750.00690.9973
Disclaimer/Publisher’s Note: The statements, opinions and data contained in all publications are solely those of the individual author(s) and contributor(s) and not of MDPI and/or the editor(s). MDPI and/or the editor(s) disclaim responsibility for any injury to people or property resulting from any ideas, methods, instructions or products referred to in the content.

