
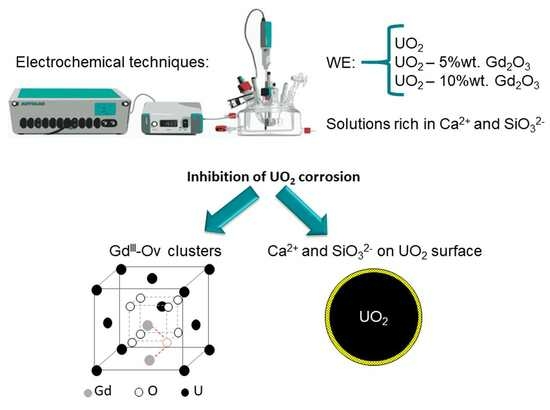
Gd2O3 Doped UO2(s) Corrosion in the Presence of Silicate and Calcium under Alkaline Conditions

Abstract
:
1. Introduction
2. Results and Discussion
2.1. Characterisation of the Gd2O3 Doped UO2 Pellets
2.2. Cyclic Voltammetry
2.3. Potentiostatic Oxidation
2.4. Cathodic Stripping Voltammetry
2.5. Corrosion Potential
3. Materials and Methods
3.1. Electrode Preparation
3.2. Electrochemical Cell and Equipment
3.3. Electrochemical Techniques
3.4. Solution
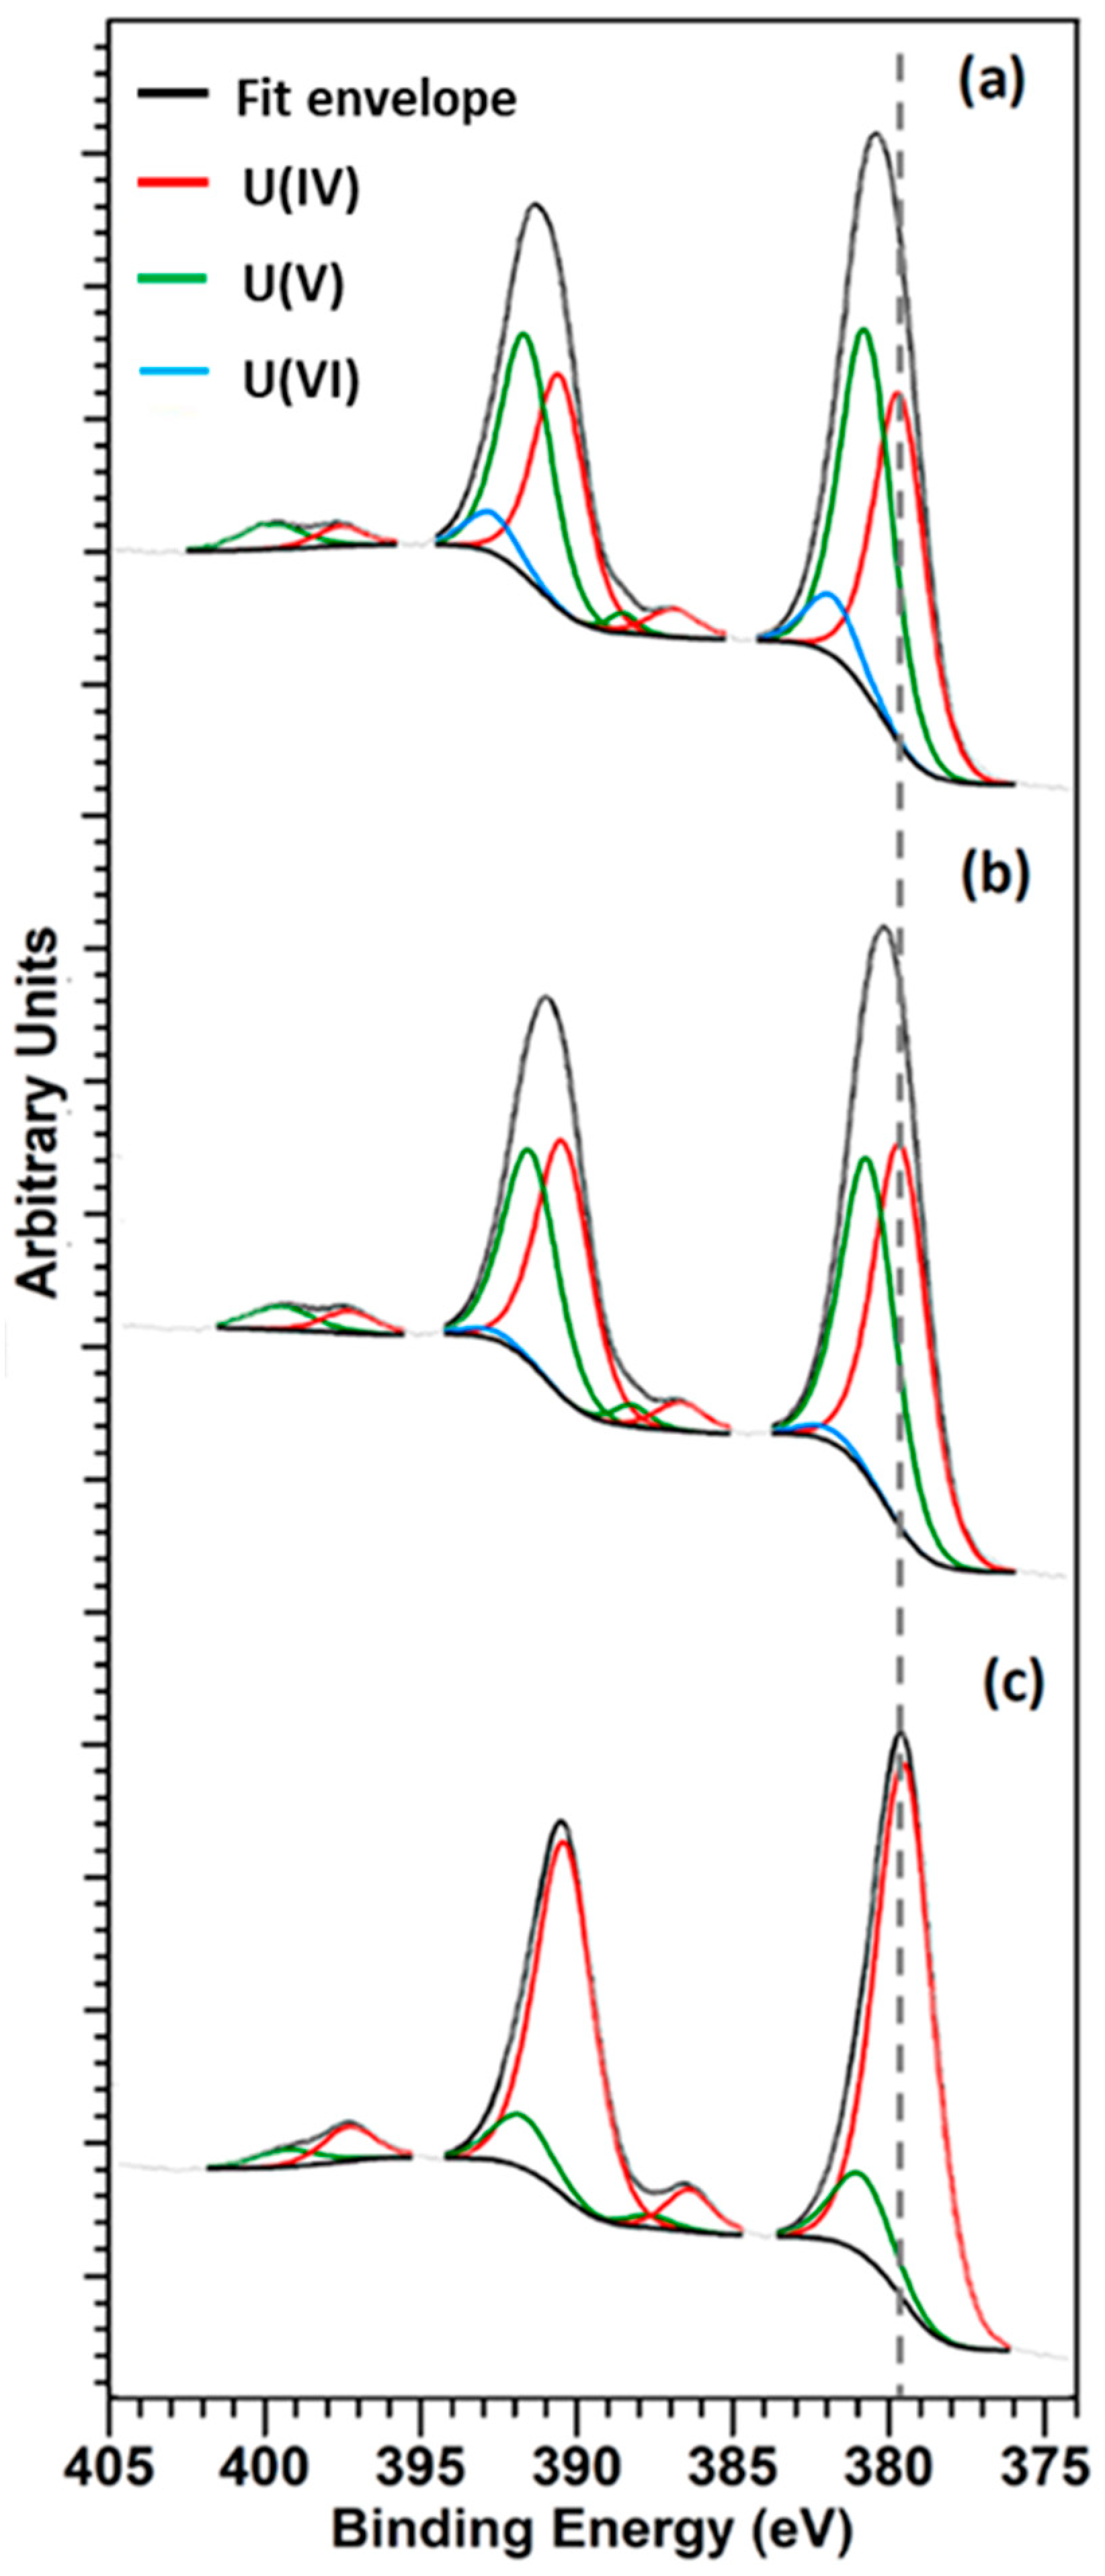
3.5. XPS Analysis
3.6. SEM Measurements
3.7. X-ray Diffraction (XRD)
4. Conclusions
Author Contributions
Funding
Data Availability Statement
Acknowledgments
Conflicts of Interest
References
- He, H.; Keech, P.G.; Broczkowski, M.E.; Noël, J.J.; Shoesmith, D.W. Characterization of the Influence of Fission Product Doping on the Anodic Reactivity of Uranium Dioxide. Can. J. Chem. 2007, 85, 702–713. [Google Scholar] [CrossRef]
- Razdan, M.; Shoesmith, D.W. Influence of Trivalent-Dopants on the Structural and Electrochemical Properties of Uranium Dioxide (UO2). J. Electrochem. Soc. 2014, 161, H105–H113. [Google Scholar] [CrossRef]
- Kim, J.G.; Ha, Y.K.; Park, S.D.; Jee, K.Y.; Kim, W.H. Effect of a Trivalent Dopant, Gd3+, on the Oxidation of Uranium Dioxide. J. Nucl. Mater. 2001, 297, 327–331. [Google Scholar] [CrossRef]
- Wilson, C.N.; Gray, W.J. Measurement of Soluble Nuclide Dissolution Rates from Spent Fuel. MRS Proc. 1989, 176, 489–498. [Google Scholar] [CrossRef]
- Leinweber, G.; Barry, D.P.; Trbovich, M.J.; Burke, J.A.; Drindak, N.J.; Knox, H.D.; Ballad, R.V.; Block, R.C.; Danon, Y.; Severnyak, L.I. Neutron Capture and Total Cross-Section Measurements and Resonance Parameters of Gadolinium. Nucl. Sci. Eng. 2006, 154, 261–279. [Google Scholar] [CrossRef]
- Lee, J.; Kim, J.Y.G.J.; Youn, Y.S.; Liu, N.; Kim, J.Y.G.J.; Ha, Y.K.; Shoesmith, D.W.; Kim, J.Y.G.J. Raman Study on Structure of U1−yGdyO2−x (Y = 0.005, 0.01, 0.03, 0.05 and 0.1) Solid Solutions. J. Nucl. Mater. 2017, 486, 216–221. [Google Scholar] [CrossRef]
- Liu, N.; Kim, J.; Lee, J.; Youn, Y.S.; Kim, J.G.; Kim, J.Y.; Noël, J.J.; Shoesmith, D.W. Influence of Gd Doping on the Structure and Electrochemical Behavior of UO2. Electrochim. Acta 2017, 247, 496–504. [Google Scholar] [CrossRef]
- Scheele, R.D.; Hanson, B.D.; Casella, A.M. Effect of Added Gadolinium Oxide on the Thermal Air Oxidation of Uranium Dioxide. J. Nucl. Mater. 2021, 552, 153008. [Google Scholar] [CrossRef]
- García-Gómez, S.; Giménez, J.; Casas, I.; Llorca, J.; De Pablo, J. X-ray Photoelectron Spectroscopy (XPS) Study of Surface Oxidation of UO2 Doped with Gd2O3 at Different Temperatures and Atmospheres. Appl. Surf. Sci. 2023, 629, 157429. [Google Scholar] [CrossRef]
- Kim, J.; Lee, J.; Youn, Y.S.; Liu, N.; Kim, J.G.; Ha, Y.K.; Bae, S.E.; Shoesmith, D.W.; Kim, J.Y. The Combined Influence of Gadolinium Doping and Non-Stoichiometry on the Structural and Electrochemical Properties of Uranium Dioxide. Electrochim. Acta 2017, 247, 942–948. [Google Scholar] [CrossRef]
- Casella, A.; Hanson, B.; Miller, W. The Effect of Fuel Chemistry on UO2 Dissolution. J. Nucl. Mater. 2016, 476, 45–55. [Google Scholar] [CrossRef]
- García-Gómez, S.; Giménez, J.; Casas, I.; Llorca, J.; De Pablo, J. Oxidative Dissolution Mechanism of Both Undoped and Gd2O3-Doped UO2(s) at Alkaline to Hyperalkaline pH. Dalton Trans. 2023, 52, 9823–9830. [Google Scholar] [CrossRef] [PubMed]
- Barreiro Fidalgo, A.; Jonsson, M. Radiation Induced Dissolution of (U, Gd)O2 Pellets in Aqueous Solution—A Comparison to Standard UO2 Pellets. J. Nucl. Mater. 2019, 514, 216–223. [Google Scholar] [CrossRef]
- Park, K.; Olander, D.R. Defect Models for the Oxygen Potentials of Gadolinium-and Europium-Doped Urania. J. Nucl. Mater. 1992, 187, 89–96. [Google Scholar] [CrossRef]
- Razdan, M.; Shoesmith, D.W. The Electrochemical Reactivity of 6.0 Wt% Gd-Doped UO2 in Aqueous Carbonate/Bicarbonate Solutions. J. Electrochem. Soc. 2014, 161, H225–H234. [Google Scholar] [CrossRef]
- Heath, T.; Schofield, J.; Shelton, A. Understanding Cementitious Backfill Interactions with Groundwater Components. Appl. Geochem. 2020, 113, 104495. [Google Scholar] [CrossRef]
- Huertas, F.J.; Hidalgo, A.; Rozalén, M.L.; Pellicione, S.; Domingo, C.; García-González, C.A.; Andrade, C.; Alonso, C. Interaction of Bentonite with Supercritically Carbonated Concrete. Appl. Clay Sci. 2009, 42, 488–496. [Google Scholar] [CrossRef]
- Santos, B.G.; Noël, J.J.; Shoesmith, D.W. The Influence of Calcium Ions on the Development of Acidity in Corrosion Product Deposits on SIMFUEL, UO2. J. Nucl. Mater. 2006, 350, 320–331. [Google Scholar] [CrossRef]
- Santos, B.G.; Noël, J.J.; Shoesmith, D.W. The Influence of Silicate on the Development of Acidity in Corrosion Product Deposits on SIMFUEL (UO2). Corros. Sci. 2006, 48, 3852–3868. [Google Scholar] [CrossRef]
- Espriu-Gascon, A.; Shoesmith, D.W.; Giménez, J.; Casas, I.; de Pablo, J. Study of SIMFUEL Corrosion under Hyper-Alkaline Conditions in the Presence of Silicate and Calcium. MRS Adv. 2017, 2, 543–548. [Google Scholar] [CrossRef]
- Shoesmith, D.W. Used Fuel and Uranium Dioxide Dissolution Studies—A Review. In Proceedings of the Corrosion Conference and Expo (Corrosion 2008), New Orleans, LA, USA, 16–20 March 2008; p. 56. [Google Scholar]
- Shoesmith, D.W. Fuel Corrosion Processes under Waste Disposal Conditions. J. Nucl. Mater. 2000, 282, 1–31. [Google Scholar] [CrossRef]
- Keech, P.G.; Goldik, J.S.; Qin, Z.; Shoesmith, D.W. The Anodic Dissolution of SIMFUEL (UO2) in Slightly Alkaline Sodium Carbonate/Bicarbonate Solutions. Electrochim. Acta 2011, 56, 7923–7930. [Google Scholar] [CrossRef]
- Maia, F.M.S.; Ribet, S.; Bailly, C.; Grivé, M.; Madé, B.; Montavon, G. Evaluation of Thermodynamic Data for Aqueous Ca-U(VI)-CO3 Species under Conditions Characteristic of Geological Clay Formation. Appl. Geochem. 2021, 124, 104844. [Google Scholar] [CrossRef]
- Scheele, R.D.; Hanson, B.D.; Cumblidge, S.E.; Jenson, E.D.; Kozelisky, A.E.; Sell, R.L.; Macfarlan, P.J.; Snow, L.A. Effect of Gadolinium Doping on the Air Oxidation of Uranium Dioxide. Mat. Res. Soc. Symp. Proc. 2004, 824, CC8.8.1–CC8.8.6. [Google Scholar] [CrossRef]
- Kegler, P.; Neumeier, S.; Klinkenberg, M.; Bukaemskiy, A.; Deissmann, G.; Brandt, F.; Bosbach, D. Accelerated Dissolution of Doped UO2-Based Model Systems as Analogues for Modern Spent Nuclear Fuel under Repository Conditions. MRS Adv. 2023, 8, 255–260. [Google Scholar] [CrossRef]
- Shoesmith, D.W.; Sunder, S.; Bailey, M.G.; Miller, N.H. Corrosion of Used Nuclear Fuel in Aqueous Perchlorate and Carbonate Solutions. J. Nucl. Mater. 1996, 227, 287–299. [Google Scholar] [CrossRef]
- Baena, A.; Cardinaels, T.; Vos, B.; Binnemans, K.; Verwerft, M. Synthesis of UO2 and ThO2 Doped with Gd2O3. J. Nucl. Mater. 2015, 461, 271–281. [Google Scholar] [CrossRef]
- Ofori, D.; Keech, P.G.; Noël, J.J.; Shoesmith, D.W. The Influence of Deposited Films on the Anodic Dissolution of Uranium Dioxide. J. Nucl. Mater. 2010, 400, 84–93. [Google Scholar] [CrossRef]
- Ilton, E.S.; Bagus, P.S. XPS Determination of Uranium Oxidation States. Surf. Interface Anal. 2011, 43, 1549–1560. [Google Scholar] [CrossRef]
- Ilton, E.S.; Boily, J.F.; Bagus, P.S. Beam Induced Reduction of U(VI) during X-Ray Photoelectron Spectroscopy: The Utility of the U4f Satellite Structure for Identifying Uranium Oxidation States in Mixed Valence Uranium Oxides. Surf. Sci. 2007, 601, 908–916. [Google Scholar] [CrossRef]
- Teterin, Y.A.; Popel, A.J.; Maslakov, K.I.; Teterin, A.Y.; Ivanov, K.E.; Kalmykov, S.N.; Springell, R.; Scott, T.B.; Farnan, I. XPS Study of Ion Irradiated and Unirradiated UO2 Thin Films. Inorg. Chem. 2016, 55, 8059–8070. [Google Scholar] [CrossRef] [PubMed]
- Schindler, M.; Hawthorne, F.C.; Freund, M.S.; Burns, P.C. XPS Spectra of Uranyl Minerals and Synthetic Uranyl Compounds. I: The U 4f Spectrum. Geochim. Cosmochim. Acta 2009, 73, 2471–2487. [Google Scholar] [CrossRef]
- Boily, J.F.; Ilton, E.S. An Independent Confirmation of the Correlation of Uf4 Primary Peaks and Satellite Structures of UVI, UV and UIV in Mixed Valence Uranium Oxides by Two-Dimensional Correlation Spectroscopy. Surf. Sci. 2008, 602, 3637–3646. [Google Scholar] [CrossRef]


| Sample | UIV(%) | UV(%) | UVI(%) |
|---|---|---|---|
| UO2 | 8 ± 5 | 26 ± 5 | 66 ± 5 |
| UO2—5 wt.% Gd2O3 | 7 ± 5 | 35 ± 5 | 58 ± 5 |
| UO2—10 wt.% Gd2O3 | 15 ± 5 | 62 ± 5 | 23 ± 5 |
| Sample | UIV(%) | UV(%) | UVI(%) |
|---|---|---|---|
| UO2 | 38 ± 5 | 48 ± 5 | 14 ± 5 |
| UO2—5 wt.% Gd2O3 | 49 ± 5 | 47 ± 5 | 4 ± 5 |
| UO2—10 wt.% Gd2O3 | 87 ± 5 | 13 ± 5 | 0 ± 5 |
Disclaimer/Publisher’s Note: The statements, opinions and data contained in all publications are solely those of the individual author(s) and contributor(s) and not of MDPI and/or the editor(s). MDPI and/or the editor(s) disclaim responsibility for any injury to people or property resulting from any ideas, methods, instructions or products referred to in the content. |
© 2023 by the authors. Licensee MDPI, Basel, Switzerland. This article is an open access article distributed under the terms and conditions of the Creative Commons Attribution (CC BY) license (https://creativecommons.org/licenses/by/4.0/).
Share and Cite
García-Gómez, S.; Giménez, J.; Casas, I.; Llorca, J.; De Pablo, J. Gd2O3 Doped UO2(s) Corrosion in the Presence of Silicate and Calcium under Alkaline Conditions. Inorganics 2023, 11, 469. https://doi.org/10.3390/inorganics11120469
García-Gómez S, Giménez J, Casas I, Llorca J, De Pablo J. Gd2O3 Doped UO2(s) Corrosion in the Presence of Silicate and Calcium under Alkaline Conditions. Inorganics. 2023; 11(12):469. https://doi.org/10.3390/inorganics11120469
Chicago/Turabian StyleGarcía-Gómez, Sonia, Javier Giménez, Ignasi Casas, Jordi Llorca, and Joan De Pablo. 2023. "Gd2O3 Doped UO2(s) Corrosion in the Presence of Silicate and Calcium under Alkaline Conditions" Inorganics 11, no. 12: 469. https://doi.org/10.3390/inorganics11120469