Article

Combined Effect of Halogenation and SiO2 Addition on the Li-Ion Conductivity of LiBH4

1
Department of Chemistry, NIS-INSTM, University of Turin, Via Pietro Giuria 7, 10125 Torino, Italy
2
Materials Chemistry and Catalysis, Debye Institute for Nanomaterials Science, Utrecht University, Universiteitsweg 99, 3584 CG Utrecht, The Netherlands
*
Authors to whom correspondence should be addressed.
Inorganics 2023, 11(12), 459; https://doi.org/10.3390/inorganics11120459
Submission received: 7 October 2023 / Revised: 18 November 2023 / Accepted: 24 November 2023 / Published: 26 November 2023

Abstract

:
In this work, the combined effects of anion substitution (with Br and I) and SiO2 addition on the Li-ion conductivity in LiBH4 have been investigated. Hexagonal solid solutions with different compositions, h-Li(BH4)1−α(X)α (X = Br, I), were prepared by ball milling and fully characterized. The most conductive composition for each system was then mixed with different amounts of SiO2 nanoparticles. If the amount of added complex hydride fully fills the original pore volume of the added silica, in both LiBH4-LiBr/SiO2 and LiBH4-LiI/SiO2 systems, the Li-ion conductivity was further increased compared to the h-Li(BH4)1−α(X)α solid solutions alone. The use of LiBH4-LiX instead of LiBH4 in composites with SiO2 enabled the development of an optimal conductive pathway for the Li ions, since the h-Li(BH4)1−α(X)α possesses a higher conductivity than LiBH4. In fact, the Li conductivity of the silica containing h-Li(BH4)1−α(X)α is higher than the maximum reached in LiBH4-SiO2 alone. Therefore, a synergetic effect of combining halogenation and interface engineering is demonstrated in this work.

Graphical Abstract

1. Introduction

Today, much effort is devoted to increasing the safety of Li-ion batteries, making electrolytes more stable in temperature and less prone to decomposition, limiting in such a way the flammability risk [1]. Solid-state electrolytes were proposed as candidates that are intrinsically able to overcome such limitations. Their thermal conductivity, generally higher for a solid than for a liquid, might avoid the formation of hot spots when high currents are required, and consequently limiting thermal runaway [2,3]. The use of solid electrolytes in an all-solid-state Li-ion battery can also allow for the use of Lithium metal as an anode, replacing the conventional graphite anode [4]. In fact, Lithium metal possesses a significantly higher theoretical specific capacity (3862 mA hg−1) with respect to graphite (372 mA hg−1), leading to a substantial gain of both gravimetric and volumetric energy density of batteries [5,6].
Lithium borohydride (LiBH4), a low-density (0.666 g/cm3) material, has been extensively studied as a solid electrolyte, since the discovery of its remarkable ionic conductivity (σ) above 120 °C [7]. The room temperature (RT) polymorph of LiBH4 has an orthorhombic unit cell (o-LiBH4); space group (s.g.), Pnma; and low ionic conductivity (around 10−8 S cm−1), while, after a phase transition at 110 °C, the high-temperature polymorph (h-LiBH4) has a hexagonal unit cell (s.g. P63mc) [8] and shows high ionic conductivity (~ 10 3 S cm−1 at 120 °C) [9]. The activation energy (EA) for Li-ion conductivity reported in the literature for the orthorhombic LiBH4 is 0.75 ± 0.07 eV [10]. Recently, the electrochemical stability of LiBH4 has been reported to be up to about 2.0 V vs. Li+/Li [11,12].
Different approaches have been adopted to enhance the RT Li-ion conductivity in LiBH4 [7]. Halide substitution, replacing BH4 with I, Br and Cl, stabilizes the hexagonal LiBH4 by forming solid solutions (SSs) [11,13,14,15]. Mixing LiBH4 with other complex anions (e.g., NH2 and NH2−) leads to the formation of compounds with different structures, and improved ionic conductivity at RT [16,17]. Making borohydride–oxide composites, by nanoconfinement of LiBH4 in suitable scaffolds, also leads to highly improved RT Li-ion conductivity [18,19,20,21]. The enhanced Li-ion conductivity relies on the formation of a conductive interface, which can be described with a core–shell model [22,23]. The fraction of LiBH4 (the core) in direct contact with the oxide (the shell) forms an interfacial layer, featuring an increased Li-ion conductivity. In the LiBH4-SiO2 system, Li conductivity is optimized when LiBH4 completely fills the oxide pores [21], and the thickness of the conductive interfacial layer has been estimated to be around 1–2 nm [24]. In addition, different LiBH4-oxide composite systems (LiBH4-ZrO2, LiBH4-MgO and LiBH4-LiBF4) have been prepared by ball milling, showing improved RT conductivity (~ 10 4 S cm−1) with respect to the o-LiBH4, thanks to a suitable interface engineering [19,20,21].
Recently, it has been reported that halogenation and nanoconfinement can be combined to further enhance the ionic conductivity of LiBH4 [25,26]. However, the exact interplay between the composition of the hexagonal SS and the confinement in the oxide was not fully unraveled. In fact, only a single composition of h-Li(BH4)1−α(I)α SSs in combination with silica was studied in Ref. [26]. The aim of this work is to extend the study to the effect of the SiO2 content in both LiBH4-LiI/SiO2 and LiBH4-LiBr/SiO2 nanocomposites. The goal is to obtain a deeper understanding of the synergetic effects arising between halogenation and interface engineering on the ionic conductivity of ion-substituted metal hydride/oxide nanocomposites, which are quite promising electrolytes for all-solid-state batteries. The results show that the amount of SiO2, LiI, LiBr and LiBH4 has a significant influence on the ionic conductivity, and optimizing the composition is thus crucial for obtaining high-conductivity nanocomposites, making them suitable for all-solid-state batteries.

2. Experimental Section

2.1. Synthesis

LiBH4 (purity > 95%, from Sigma-Aldrich, St. Louis, MO, USA), LiBr (purity > 99%, from Sigma-Aldrich) and LiI (purity > 99%, from Sigma-Aldrich) were mechanochemically treated in different ratios, to stabilize the hexagonal SSs at RT. Before mixing, LiBr was dried at 120 °C in a furnace under a dynamic vacuum, while LiI was already purchased in an inert atmosphere. A Fritsch Pulverisette 6 planetary mill was used to ball mill the reactants under an argon atmosphere in 80 mL tungsten carbide vials, with tungsten carbide balls (10 mm diameter) and a ball-to-sample mass ratio of 30:1. All LiBH4-LiX (X = Br, I) mixtures were ball milled for 1.5 h at 350 r.p.m., in steps of 10 min, separated by 2 min breaks, to minimize possible heating effects [11]. Samples were annealed at 250 °C for 2 or 4 h in a quartz tube under a static vacuum, with a heating/cooling rate of 5 °C/min, to reach the equilibrium conditions. Thereafter, samples were mixed with SiO2 (Aerosil 300, Evonik, Essen, Germany) by ball milling. Prior to mixing, SiO2 was pelletized and dried at 300 °C for 6 h under a dynamic vacuum, to remove any physisorbed/chemisorbed water. All h-Li(BH4)1−α(X)α-SiO2 composites were ball milled at 300 r.p.m. for three 10 min intervals, separated by 1 min breaks. All manipulations were performed in an argon-filled glovebox (MBraun Lab Star Glove Box supplied with pure 5.5 grade argon, <1 ppm O2, <1 ppm H2O). The nomenclature and compositions of prepared samples are reported in Table 1.
The density of SiO2 has been taken as 2.20 g/cm3 from the literature [27]. The surface properties and porosity of the SiO2 were obtained by N2 adsorption at 77 K in a TriStar Plus II gas-volumetric apparatus (Micromeritics, Norcross, GA, USA). The specific surface area (SBET) was calculated by fitting with a Brunauer–Emmett–Teller isotherm [28], and it turned out to be equal to 294 m2/g. The total pore volume (Vp) was derived from the absorbed volume of the nitrogen at p/p0 = 0.95 and it was determined to be 2.30 cm3/g.

2.2. Powder X-ray Diffraction (PXD)

Powdered samples were characterized by PXD at RT using a Panalytical X-pert Pro MPD (Cu Kα1 = 1.54059 Å, Kα2 = 1.54446 Å) in Debye–Scherer geometry. Patterns were collected from the 10° to 70° 2θ range, with a step size of 0.016. Glass capillaries (0.5 mm) were filled with the sample powder and sealed under an Ar atmosphere. The Rietveld refinement of diffraction patterns was performed using Materials Analysis Using Diffraction (MAUD) software v 2.992 [29], considering Rwp and χ as indicators for the quality of the fitting.

2.3. Electrochemical Impedance Spectroscopy (EIS)

The total conductivity was measured with electrochemical impedance spectroscopy (EIS) using a PARSTAT 2273 potentiostat (frequency range of 1 Hz–1 MHz, applied voltage of 10 mV rms), with the measuring cell placed inside an Ar-filled glovebox. Using an axial hydraulic press, samples were compacted into pellets (diameter of 13 mm, thickness of 1−2 mm) with about 200 MPa pressure. Lithium foils (Sigma-Aldrich, purity of 99.9%, 0.38 mm thick) were used as non-blocking electrodes. EIS was performed every 10 °C in the temperature range of RT < T < 130 °C during the heating ramp and every 20 °C during cooling. The impedance spectra showed a single arc in the Nyquist plot; therefore, they were all fitted using an (RQ) equivalent circuit model, i.e., a resistance in parallel with a constant phase element (CPE). Impedance data were analyzed via EqC software v. 0.6 rev.2 [30], following the data validation described in Ref. [31]. All fits performed resulted in a chi-squared test (χ2 test) < 10−3. Because the electronic conduction is very low, the measured conductivity was assigned entirely to Li-ion conductivity, as demonstrated previously [21,32].

3. Results and Discussion

3.1. h-Li(BH4)1−xXx Solid Solutions

The reported values of the solubility limits for h-Li(BH4)1−α(Br)α SSs are 0.30 ≤ α ≤ 0.5 [11,33], and for h-Li(BH4)1−α(I)α SSs, they are 0.18 ≤ α ≤ 0.50 [13]. A range of h-Li(BH4)1−α(Br)α samples, containing 0.30, 0.40 and 0.50 molar fractions of LiBr (denoted as Br0.3, Br0.4 and Br0.5), and of h-Li(BH4)1−α(I)α samples, containing 0.20, 0.30, 0.40 and 0.50 molar fractions of LiI (denoted as I0.2, I0.3, I0.4 and I0.5), were synthetized. Diffraction patterns collected after the synthesis are shown in Figure 1a,b. A single crystalline phase was found for all synthetized samples, namely h-Li(BH4)1−α(Br)α (Figure 1a) and h-Li(BH4)1−α(I)α (Figure 1b). Neither cubic halides (c-LiBr or c-LiI) nor o-LiBH4 starting materials were detected. These results were expected, as the chosen compositions are in the solubility range of hexagonal SSs reported in the literature [11,33].
Using Rietveld refinement, all patterns were analyzed in detail. A structural model for the hexagonal polymorph of LiBH4 (P63mc) was used to describe the structure of h-Li(BH4)1−α(X)α SSs, where Br or I ions were considered to be located in correspondence with the boron position (i.e., 2b Wyckoff site). The obtained lattice parameters (a and c) and unit cell volume (V/Z) of the hexagonal phase, obtained from the Rietveld refinement of the PXD patterns, are reported in Figure 1c,d, as a function of the halide content, for the LiBH4-LiBr and LiBH4-LiI systems, respectively. Figure 1c shows that both the lattice parameters, as well as the unit cell volume, decrease with increasing bromide concentration. The opposite behavior is observed for the LiBH4-LiI system, as highlighted in Figure 1d, which demonstrates how the lattice parameters and the unit cell volume expand when the iodide concentration increases above 0.3.
The value of cell volume for the hexagonal pure LiBH4 was estimated at RT by using the volumetric thermal expansion coefficient (2.9 × 10⁻⁴ K−1) [34], and it turned out to be equal to 106.5 Å3, corresponding to a unit cell volume (V/Z) of 53.3 Å3. The extrapolated RT cell volume of pure h-LiBH4 is larger than that of sample Br0.3 (51.6 Å3) and even larger than Br0.4 and Br0.5. In fact, a contraction of the cell volume of the hexagonal SS is expected after halogenation, considering the smaller ionic radius of Br compared to BH4 (Br = 1.96 Å, BH4 = 2.03 Å) [35]. On the contrary, considering the h-Li(BH4)1−α(I)α SSs, the volume of sample I0.2 (57.0 Å3) is larger than the RT extrapolated volume of h-LiBH4, indicating an expansion of the lattice. The expansion of the hexagonal lattice is even more pronounced for increased I content, as observed for samples I0.3, I0.4 and I0.5. In this case, the expansion is due to the larger anion radius of I compared to BH4 (I = 2.20 Å, BH4 = 2.03 Å) [35].
As expected, both lattice constants and unit cell volume decrease monotonically as a function of composition for the LiBH4-LiBr system, as shown in Figure 1c. On the contrary, Figure 1d shows that lattice parameter a linearly increases with the iodide concentration, while lattice parameter c is found to shrink when increasing the iodide content up to 0.3 and then to expand between 0.3 and 0.5. This nonmonotonic evolution of the c-axis seems illogical, but it was already reported by Sveinbjörnsson et al. [13], and it has been explained by the possible formation of some intermediate phases [13,36]. This could also be the origin of the asymmetric peak shape and peak broadening observed in Figure 1b for sample I0.2. A more detailed crystal structure analysis on this sample would be necessary to define the exact structure and explain this nonmonotonic expansion of the c-axis. Considering the I concentration above 0.3, the expansion of the c-axis is as expected, in agreement with the values previously reported [37,38].
The effect of halogenation on the vibrational properties was explored with IR-ATR spectroscopy (see Supporting Information for experimental details) and the results are shown in Figure S1a for h-Li(BH4)1−α(Br)α SSs and in Figure S1b for h-Li(BH4)1−α(I)α SSs, together with the spectrum for pure orthorhombic LiBH4. The stabilization of the high-temperature hexagonal polymorph of LiBH4, through anion substitution, results in a general broadening of both B-H stretching and bending bands. Increasing the halide content, the B-H stretching bands progressively merge in a single and broad band, reflecting an increase in the lattice distortion and disordering effects, as discussed in Refs. [37,39].
To investigate the trend of Li-ion conductivity as a function of the SSs’ composition, temperature-dependent EIS measurements were performed in the temperature range of 30 < T < 130 °C and an example of EIS spectra can be seen in Figure S2. Figure 2 shows the Li+ conductivities, as a function of the inverse temperature, for all samples, including pure LiBH4 for comparison.
As expected, for hexagonal SSs, the change in the conductivity due to the polymorphic transition above 110 °C, as observed for pure LiBH4, disappears. In the h-Li(BH4)1−α(Br)α system (Figure 2a), sample Br0.3, i.e., h-Li(BH4)0.7(Br)0.3, shows the highest value for conductivity at 30 °C (1.8 ×   10 - 6 S cm−1), while in the h-Li(BH4)1−α(I)α system (Figure 2b) is the sample I0.2, i.e., h-Li(BH4)0.8(I)0.2, that shows the highest Li-ion conductivity (3.6 ×   10 - 5 S cm−1 at 30 °C). It is worth noting that these values are three and four orders of magnitude higher than that of pure LiBH4 at RT, respectively. Before the phase transition, all samples show higher Li-ion conductivity with respect to LiBH4, confirming that halogenation is a robust approach to enhance the Li-ion conductivity of the LiBH4.
A correlation between composition and ionic transport properties exists, and in general, the incorporation of a halide results in an enhanced conductivity compared to LiBH4 [11,15]. However, increasing the halide/BH4 ratio decreases the Li-ion conductivity. These results indicate that the presence of BH4 anions in the structure promotes Li-ion mobility. In fact, the higher Li-ion conductivity of the h-LiBH4, compared to the orthorombic structure, is due to the rapid reorientation of the BH4 anions, i.e., a higher frequency of rotational jumps [40,41]. This is in agreement with our results, where increasing the halide concentration causes a decrease in the Li-ion conductivity, both for the incorporation of I- as well as Br-.
Activation energies have been calculated based on the data shown in Figure 2, and they are shown in Figure 3, as a function of the h-Li(BH4)1−α(X)α halide content. Figure S3 shows an example of the linear fit used to calculate the activation energies. The lowest activation energy was observed for both h-Li(BH4)1−α(X)α SSs when α = 0.3 (i.e., 0.517 ± 0.01 eV for sample Br0.3 and 0.54 ± 0.03 eV for sample I0.3). Above α = 0.3, the activation energy increases. Unexpected behavior is evidenced for sample I0.2, i.e., h-Li(BH4)0.8(I)0.2, which shows the highest conductivity, but it has an activation energy higher than that of sample I0.3. This behavior could be linked to the nonmonotonic expansion of the c-axis and/or to the not completely ordered structure of the h-Li(BH4)0.8(I)0.2 SS (Figure 1d) [13].
As a conclusion, the incorporation of halide ions in the LiBH4 structure leads to the stabilization of the hexagonal phase, thereby improving Li-ion conductivity. The extent of this improvement depends on the exact solid solution composition, becoming smaller with increasing halide content.

3.2. (h-Li(BH4)1−α(X)α)1−β-(SiO2)β Systems

Table 1 (see experimental section) shows v/v % of SiO2 and the corresponding pore filling fraction of the (h-Li(BH4)1−α(X)α)1−β-(SiO2)β synthesized samples. The values of β (i.e., v/v % of SiO2) have been calculated considering densities of h-Li(BH4)1−α(X)α SSs, as calculated from the cell volume data obtained with Rietveld refinement of PXD patterns (Figure S4). The SiO2 pore filling fraction was calculated as the ratio between the volume of Li(BH4)1−α(X)α SSs and the total pore volume of the SiO2.
h-Li(BH4)0.7(Br)0.3 and h-Li(BH4)0.8(I)0.2 showed the highest Li-ion conductivity; therefore, the effect of SiO2 content in these composites was analyzed in more detail. After the synthesis, the PXD patterns were collected at RT for each sample (Figure S5; Figure S5a shows the PXD pattern of h-Li(BH4)0.7(Br)0.3 mixed with different v/v % of SiO2, while Figure S5b shows the PXD pattern of h-Li(BH4)0.8(I)0.2-SiO2 composites). Considering that SiO2 is amorphous, from results reported in Figure S5, it is possible to assume the absence of both h-Li(BH4)1−α(X)α SSs’ structural modifications, due to the mechanochemical treatment, and the formation of new compounds. So, the PXD analysis clearly indicates no interactions between the Li(BH4)1−α(X)α SSs and SiO2.
Additional structural/chemical information was obtained using vibrational (ATR-IR) measurements. From the ATR-IR spectra of the (h-Li(BH4)1−α(X)α)1−β-(SiO2)β composites shown in Figure S6, the absorption bands related to B-H stretching (2400–2000 cm−1 region) of both h-Li(BH4)1−α(X)α SSs are not affected significantly by the mechanochemical treatment with SiO2, showing a rather similar shape with the bands already reported in Figure S1. This result supports the PXD results, which indicate that the addition of SiO2 did not lead to noticeable changes in the structural properties of the h-Li(BH4)1−α(X)α.
It is worth noting that an electrochemical stability of 2.5 V has been observed for h-Li(BH4)0.8(I)0.2 mixed with 16 v/v % of SiO2, which is higher than that of LiBH4 alone (2.2 V) [26]. The effect of silica addition to the h-Li(BH4)1−α(X)α SSs on the Li-ion conductivity of all the prepared samples was determined using EIS measurements. The Li-ion conductivity as a function of the inverse temperature in h-Li(BH4)0.7(Br)0.3 and h-Li(BH4)0.8(I)0.2 SSs, with different v/v % of SiO2, is shown in Figure 4.
Results show that the Li-ion conductivity is enhanced upon SiO2 addition, when the SiO2 content is lower than 21 v/v % for h-Li(BH4)0.7(Br)0.3 and 20% for h-Li(BH4)0.8(I)0.2, respectively. These volume fractions correspond to the filling of more than 75% and 78% of the original SiO2 total pore volume (2.30 cm3/g) in the case of h-Li(BH4)0.7(Br)0.3 and h-Li(BH4)0.8(I)0.2, respectively. Among all h-Li(BH4)0.8(I)0.2-SiO2 mixtures (Figure 4b), those with v/v % of SiO2 between 13% and 20% show very similar conductivities (9.3 ×   10 - 5 ÷ 1.1 ×   10 - 4 S cm−1 at 40 °C), indicating that the addition of a small amount of silica has a small effect on the Li-ion conductivity. Similar behavior was observed for h-Li(BH4)0.7(Br)0.3-SiO2 mixtures (Figure 4a), even though the composite containing 13 v/v % of SiO2 shows a more evident enhancement of the Li-ion conductivity with respect to the h-Li(BH4)0.7(Br)0.3 SS, reaching a Li-ion conductivity of 4.9 ×   10 - 5 S cm−1 at 40 °C. On the other hand, for composites containing v/v % of SiO2 higher than 21, the Li-ion conductivity decreases with respect to the SS alone for both h-Li(BH4)0.7(Br)0.3 and h-Li(BH4)0.8(I)0.2 composites.
To better understand the trend in the Li-ion conductivity as a function of SiO2 content (shown in Figure 4), the dependence of the Li conductivity at 40 °C, as well as that of the EA, is shown in Figure 5 as a function of the SiO2 pore filling fraction.
Figure 5 shows that the Li-ion conductivity increases with the pore filling, reaching a nearly constant value when it is higher than 80%. For a pore filling >20%, the EA is lower than that obtained for the hexagonal SSs without SiO2 and the lowest value of activation energy is observed for the sample containing an amount of h-Li(BH4)1−α(X)α close to 100% of the pore volume of the SiO2. Finally, a complete overview of the conductivity of the composites synthesized is provided in Figure 6, which highlights how the combination of halide concentration and SiO2 content affects the Li-ion conductivity.
For both systems, a synergetic effect occurs when the fraction of SiO2 is between 20 and 30 v/v %, and the maximum Li-ion conductivity is reached for samples with SSs with the highest BH4 content. The maximum (highlighted with the red point in Figure 6) of the Li conductivity reached in both (h-Li(BH4)1−α(X)α)1−β-(SiO2)β systems is higher than the maximum reached in the LiBH4-SiO2 (taken from Ref. [21]).

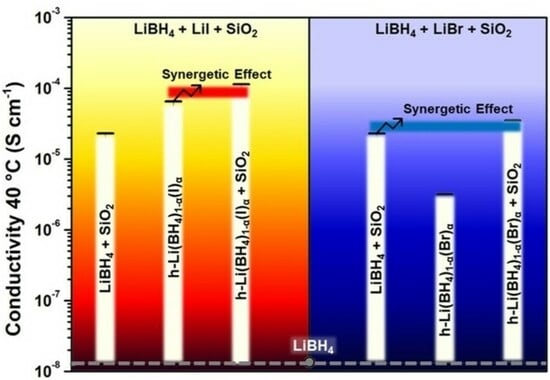
3.3. Synergetic Effect

The enhancement of the Li-ion conductivity of LiBH4 with the addition of SiO2 can be explained with a core–shell model, different from what was reported for a polymer electrolyte [42], where two different conductive phase fractions are present: the first is at the interface, in direct contact with the oxide, and highly conductive, and the second fraction is in the bulk, maintaining the low conductivity of the orthorhombic phase [21,23,43]. This core–shell model can also be applied to both (h-Li(BH4)1−α(X)α)1−β-(SiO2)β systems considered here, since the conductivities of the h-Li(BH4)1-α(X)α can be enhanced by a certain amount of SiO2. More specifically, in samples for which too much SiO2 is added (with the hydride present corresponding to a silica pore filling below 70%), the insulator (i.e., SiO2) interrupts the Li-ion pathway of the highly conductive interface layer, leading to a conductivity that is lower than the h-Li(BH4)1−α(X)α SS without silica. The EA obtained for these samples (i.e., containing an excess of silica) is similar to that of the pure h-Li(BH4)1−α(X)α, indicating that the Li-ion conductivity is dominated by the conduction inside the h-Li(BH4)1−α(X)α SSs.
Interestingly, a high Li-ion conductivity is observed even when the volume of the h-Li(BH4)1−α(X)α exceeds the SiO2 pore volume (pore filling > 100%). Differently from the LiBH4-SiO2 system (see Figure 6), when the volume of h-Li(BH4)1−α(X)α SS exceeds the pore volume (pore filling > 100%), the interface layer is interrupted no more by the low-conductive o-LiBH4, but the connectivity of the Li-ion pathway is provided by the high-conductive h-Li(BH4)1−α(X)α SS [23]. In addition, the calculated values of the EA show that, when the amount of hydride exceeds the complete pore filling, it returns to be comparable to that of h-Li(BH4)1−α(X)α SSs without silica, indicating that the excess of the SS dominates the conduction mechanism. Therefore, since the h-Li(BH4)1−α(X)α SSs display a rather good conductivity, an excess of it does not negatively impact the conductivity of the composites.
This work underlines that the combination of different approaches to increase the Li-ion conductivity is a powerful method to obtain novel solid-state electrolytes to be used in all-solid-state batteries. At the same time, a clear trend between the amount of SiO2 and Li-ion conductivity was determined.

4. Conclusions

In this work, the effect of halide composition on the Li-ion conductivity of h-Li(BH4)1−α(X)α has been investigated for the LiBH4-LiI and LiBH4-LiBr systems. Once the most conductive composition for each system was determined, the effect of adding SiO2 was investigated. In the LiBH4-LiX/SiO2 systems, the Li-ion conductivity was further increased if the amount of hydride added corresponded to the original pore volume of the silica in the composite. The use of LiBH4-LiX instead of LiBH4 in the SiO2-containing composites ensured an optimal pathway for fast Li-ion conduction due to the higher conductivity of LiBH4-LiX SSs compared to LiBH4. The Li-conductivity of the halide-containing composites was higher than that of LiBH4-SiO2 [21] (at 40 °C, 1.1 ×   10 - 4 S cm−1 for h-Li(BH4)0.8(I)0.2—13 v/v % of SiO2 vs. 4.1   ×   10 - 5 S cm−1 for LiBH4—20 v/v % of SiO2). Thus, a synergetic effect of combining halogenation and interface engineering is demonstrated in this work.

Supplementary Materials

The following supporting information can be downloaded at: https://www.mdpi.com/article/10.3390/inorganics11120459/s1, Figure S1: IR−ATR spectrum of h-Li(BH4)1-α(X)α SSs and pure LiBH4; Figure S2: Density of h-Li(BH4)1-α(X)α SSs as a function of halide concentration; Figure S3: PXD patterns of h-Li(BH4)1-α(X)α SSs with different v/v % of SiO2; Figure S4: IR−ATR spectrum of h-Li(BH4)1-α(X)α SSs with different v/v % of SiO2.

Author Contributions

Conceptualization, V.G. and P.d.J.; methodology, V.G. and L.d.K.; validation, P.N., P.d.J. and M.B.; formal analysis, V.G. and P.N.; resources, P.d.J. and M.B.; data curation, V.G. and L.d.K.; writing—original draft preparation, V.G.; writing—review and editing, P.N., P.d.J. and M.B.; supervision, P.d.J.; funding acquisition, P.d.J. and M.B. All authors have read and agreed to the published version of the manuscript.

Funding

P.N. and P.d.J. gratefully acknowledge financial support from “The Netherlands Organization for Scientific Research” (NWO-ECHO and NWO-RELEASE). M.B. acknowledges support from Project CH4.0 under the MUR program “Dipartimenti di Eccellenza 2023–2027” (CUP: D13C22003520001).

Data Availability Statement

The authors declare that data supporting the findings of this study are available within the paper and its Supplementary Information files. Should any raw data files be needed in another format, they are available from the corresponding authors upon reasonable request.

Conflicts of Interest

The authors declare no conflict of interest.

References

  1. Goodenough, J.B.; Kim, Y. Challenges for Rechargeable Li Batteries. Chem. Mater. 2010, 22, 587–603. [Google Scholar] [CrossRef]
  2. Bachman, J.C.; Muy, S.; Grimaud, A.; Chang, H.-H.; Pour, N.; Lux, S.F.; Paschos, O.; Maglia, F.; Lupart, S.; Lamp, P.; et al. Inorganic Solid-State Electrolytes for Lithium Batteries: Mechanisms and Properties Governing Ion Conduction. Chem. Rev. 2016, 116, 140–162. [Google Scholar] [CrossRef] [PubMed]
  3. Manthiram, A.; Yu, X.; Wang, S. Lithium Battery Chemistries Enabled by Solid-State Electrolytes. Nat. Rev. Mater. 2017, 2, 16103. [Google Scholar] [CrossRef]
  4. Goodenough, J.B.; Singh, P. Review—Solid Electrolytes in Rechargeable Electrochemical Cells. J. Electrochem. Soc. 2015, 162, A2387–A2392. [Google Scholar] [CrossRef]
  5. Culver, S.P.; Koerver, R.; Krauskopf, T.; Zeier, W.G. Designing Ionic Conductors: The Interplay between Structural Phenomena and Interfaces in Thiophosphate-Based Solid-State Batteries. Chem. Mater. 2018, 30, 4179–4192. [Google Scholar] [CrossRef]
  6. Muldoon, J.; Bucur, C.B.; Gregory, T. Quest for Nonaqueous Multivalent Secondary Batteries: Magnesium and Beyond. Chem. Rev. 2014, 114, 11683–11720. [Google Scholar] [CrossRef] [PubMed]
  7. Ikeshoji, T.; Tsuchida, E.; Morishita, T.; Ikeda, K.; Matsuo, M.; Kawazoe, Y.; Orimo, S.-I. Fast-ionic conductivity of Li+ in LiBH4. Phys. Rev. B-Condens. Matter Mater. Phys. 2011, 83, 144301. [Google Scholar] [CrossRef]
  8. El Kharbachi, A.; Pinatel, E.; Nuta, I.; Baricco, M. A Thermodynamic Assessment of LiBH4. Calphad 2012, 39, 80–90. [Google Scholar] [CrossRef]
  9. Matsuo, M.; Nakamori, Y.; Orimo, S.; Maekawa, H.; Takamura, H. Lithium Superionic Conduction in Lithium Borohydride Accompanied by Structural Transition. Appl. Phys. Lett. 2007, 91, 224103. [Google Scholar] [CrossRef]
  10. Gulino, V.; Wolczyk, A.; Golov, A.A.; Eremin, R.A.; Palumbo, M.; Nervi, C.; Blatov, V.A.; Proserpio, D.M.; Baricco, M. Combined DFT and Geometrical–Topological Analysis of Li-Ion Conductivity in Complex Hydrides. Inorg. Chem. Front. 2020, 7, 3115–3125. [Google Scholar] [CrossRef]
  11. Gulino, V.; Brighi, M.; Dematteis, E.M.; Murgia, F.; Nervi, C.; Černý, R.; Baricco, M. Phase Stability and Fast Ion Conductivity in the Hexagonal LiBH4–LiBr–LiCl Solid Solution. Chem. Mater. 2019, 31, 5133–5144. [Google Scholar] [CrossRef]
  12. Asakura, R.; Duchêne, L.; Kühnel, R.-S.; Remhof, A.; Hagemann, H.; Battaglia, C. Electrochemical Oxidative Stability of Hydroborate-Based Solid-State Electrolytes. ACS Appl. Energy Mater. 2019, 2, 6924–6930. [Google Scholar] [CrossRef]
  13. Sveinbjörnsson, D.; Myrdal, J.S.G.; Blanchard, D.; Bentzen, J.J.; Hirata, T.; Mogensen, M.B.; Norby, P.; Orimo, S.; Vegge, T. Effect of Heat Treatment on the Lithium Ion Conduction of the LiBH4–LiI Solid Solution. J. Phys. Chem. C 2013, 117, 3249–3257. [Google Scholar] [CrossRef]
  14. Unemoto, A.; Chen, C.; Wang, Z.; Matsuo, M.; Ikeshoji, T.; Orimo, S.I. Pseudo-Binary Electrolyte, LiBH4-LiCl, for Bulk-Type All-Solid-State Lithium-Sulfur Battery. Nanotechnology 2015, 26, 254001. [Google Scholar] [CrossRef] [PubMed]
  15. Maekawa, H.; Matsuo, M.; Takamura, H.; Ando, M.; Noda, Y.; Karahashi, T.; Orimo, S.-I. Halide-stabilized LiBH4, a room-temperature lithium fast-ion conductor. J. Am. Chem. Soc. 2009, 131, 894–895. [Google Scholar] [CrossRef] [PubMed]
  16. Matsuo, M.; Remhof, A.; Martelli, P.; Caputo, R.; Ernst, M.; Miura, Y.; Sato, T.; Oguchi, H.; Maekawa, H.; Takamura, H.; et al. Complex Hydrides with (BH4) and (NH2) Anions as New Lithium Fast-Ion Conductors. J. Am. Chem. Soc. 2009, 131, 16389–16391. [Google Scholar] [CrossRef] [PubMed]
  17. Wang, H.; Bolarin, J.A.; Zhang, B.; Liu, W. Evaluation of a new lithium complex hydride: A derivative of BH4- and NH2- for fast Li-ion conduction and H2 sorption. Dalton Trans. 2023. accepted manuscript. [Google Scholar] [CrossRef] [PubMed]
  18. Luo, X.; Rawal, A.; Aguey-Zinsou, K.-F. Investigating the factors affecting the ionic conduction in nanoconfined NaBH4. Inorganics 2021, 9, 2. [Google Scholar] [CrossRef]
  19. Lefevr, J.; Cervini, L.; Griffin, J.M.; Blanchard, D. Lithium Conductivity and Ions Dynamics in LiBH4/SiO2 Solid Electrolytes Studied by Solid-State NMR and Quasi-Elastic Neutron Scattering and Applied in Lithium-Sulfur Batteries. J. Phys. Chem. C 2018, 122, 15264–15275. [Google Scholar] [CrossRef]
  20. Yang, G.; Xie, C.; Li, Y.; Li, H.-W.; Liu, D.; Chen, J.; Zhang, Q. Enhancement of the ionic conductivity of lithium borohydride by silica supports. Dalton Trans. 2021, 50, 15352–15358. [Google Scholar] [CrossRef]
  21. Gulino, V.; Barberis, L.; Ngene, P.; Baricco, M.; de Jongh, P.E. Enhancing Li-Ion Conductivity in LiBH4-Based Solid Electrolytes by Adding Various Nanosized Oxides. ACS Appl. Energy Mater. 2020, 3, 4941–4948. [Google Scholar] [CrossRef]
  22. Suwarno, S.; Nale, A.; Suwarta, P.; Wijayanti, I.D.; Ismail, M. Designing Nanoconfined LiBH4 for Solid-State Electrolytes. Front. Chem. 2022, 10, 866959. [Google Scholar] [CrossRef]
  23. Luo, X.; Rawal, A.; Salman, M.S.; Aguey-Zinsou, K.-F. Core–Shell NaBH4@Na2B12H12 Nanoparticles as Fast Ionic Conductors for Sodium-Ion Batteries. ACS Appl. Nano Mater. 2022, 5, 373–379. [Google Scholar] [CrossRef]
  24. Choi, Y.S.; Lee, Y.-S.; Oh, K.H.; Cho, Y.W. Interface-enhanced Li ion conduction in a LiBH4-SiO2 solid electrolyte. Phys. Chem. Chem. Phys. 2016, 18, 22540–22547. [Google Scholar] [CrossRef]
  25. de Kort, L.M.; Gulino, V.; de Jongh, P.E.; Ngene, P. Ionic Conductivity in Complex Metal Hydride-Based Nanocomposite Materials: The Impact of Nanostructuring and Nanocomposite Formation. J Alloys Compd. 2022, 901, 163474. [Google Scholar] [CrossRef]
  26. de Kort, L.; Ngene, P.; Baricco, M.; de Jongh, P.; Gulino, V. Improving the Cycle Life of Solid-State Batteries by Addition of Oxide Nanoparticles to a Complex Hydride Solid Electrolyte. J. Phys. Chem. C 2023, 127, 3988–3995. [Google Scholar] [CrossRef]
  27. Dimitrov, V.; Sakka, S. Electronic Oxide Polarizability and Optical Basicity of Simple Oxides. J. Appl. Phys. 1996, 79, 1736–1740. [Google Scholar] [CrossRef]
  28. Brunauer, S.; Emmett, P.H.; Teller, E. Adsorption of Gases in Multimolecular Layers. J. Am. Chem. Soc. 1938, 60, 309–319. [Google Scholar] [CrossRef]
  29. Lutterotti, L.; Matthies, S.; Wenk, H.R. MAUD: A Friendly Java Program for Material Analysis Using Diffraction. Newsletter CPD 1999, 21, 14–15. [Google Scholar]
  30. Boukamp, B.A. Electrochemical Impedance Spectroscopy in Solid State Ionics: Recent Advances. Solid State Ion. 2004, 169, 65–73. [Google Scholar] [CrossRef]
  31. Boukamp, B.A. A Package for Impedance/Admittance Data Analysis. Solid State Ion. 1986, 19, 136–140. [Google Scholar] [CrossRef]
  32. Liu, Z.; Xiang, M.; Zhang, Y.; Shao, H.; Zhu, Y.; Guo, X.; Li, L.; Wang, H.; Liu, W. Lithium Migration Pathways at the Composite Interface of LiBH4 and Two-Dimensional MoS2 Enabling Superior Ionic Conductivity at Room Temperature. Phys. Chem. Chem. Phys. 2020, 22, 4096–4105. [Google Scholar] [CrossRef] [PubMed]
  33. Cascallana-Matias, I.; Keen, D.A.; Cussen, E.J.; Gregory, D.H. Phase Behavior in the LiBH4–LiBr System and Structure of the Anion-Stabilized Fast Ionic, High Temperature Phase. Chem. Mater. 2015, 27, 7780–7787. [Google Scholar] [CrossRef]
  34. Filinchuk, Y.; Chernyshov, D.; Cerny, R. Lightest Borohydride Probed by Synchrotron X-Ray Diffraction: Experiment Calls for a New Theoretical Revision. J. Phys. Chem. C 2008, 112, 10579–10584. [Google Scholar] [CrossRef]
  35. Paskevicius, M.; Jepsen, L.H.; Schouwink, P.; Černý, R.; Ravnsbæk, D.B.; Filinchuk, Y.; Dornheim, M.; Besenbacher, F.; Jensen, T.R. Metal Borohydrides and Derivatives–Synthesis, Structure and Properties. Chem. Soc. Rev. 2017, 46, 1565–1634. [Google Scholar] [CrossRef] [PubMed]
  36. Oguchi, H.; Matsuo, M.; Hummelshøj, J.S.; Vegge, T.; Nørskov, J.K.; Sato, T.; Miura, Y.; Takamura, H.; Maekawa, H.; Orimo, S. Experimental and Computational Studies on Structural Transitions in the LiBH4–LiI Pseudobinary System. Appl. Phys. Lett. 2009, 94, 141912. [Google Scholar] [CrossRef]
  37. Sveinbjörnsson, D.; Christiansen, A.S.; Viskinde, R.; Norby, P.; Vegge, T. The LiBH4-LiI solid solution as an electrolyte in an all-solid-state battery. J. Electrochem. Soc. 2014, 161, A1432. [Google Scholar] [CrossRef]
  38. Miyazaki, R.; Karahashi, T.; Kumatani, N.; Noda, Y.; Ando, M.; Takamura, H.; Matsuo, M.; Orimo, S.; Maekawa, H. Room Temperature Lithium Fast-Ion Conduction and Phase Relationship of LiI Stabilized LiBH4. Solid State Ion. 2011, 192, 143–147. [Google Scholar] [CrossRef]
  39. Rude, L.H.; Zavorotynska, O.; Arnbjerg, L.M.; Ravnsbæk, D.B.; Malmkjær, R.A.; Grove, H.; Hauback, B.C.; Baricco, M.; Filinchuk, Y.; Besenbacher, F.; et al. Bromide Substitution in Lithium Borohydride, LiBH4–LiBr. Int. J. Hydrogen Energy 2011, 36, 15664–15672. [Google Scholar] [CrossRef]
  40. Martelli, P.; Remhof, A.; Borgschulte, A.; Ackermann, R.; Strässle, T.; Embs, J.P.; Ernst, M.; Matsuo, M.; Orimo, S.-I.; Züttel, A. Rotational Motion in LiBH4/LiI Solid Solutions. J. Phys. Chem. A 2011, 115, 5329–5334. [Google Scholar] [CrossRef]
  41. Buchter, F.; Łodziana, Z.; Mauron, P.; Remhof, A.; Friedrichs, O.; Borgschulte, A.; Züttel, A.; Sheptyakov, D.; Strässle, T.; Ramirez-Cuesta, A.J. Dynamical Properties and Temperature Induced Molecular Disordering of LiBH4 and LiBD4. Phys. Rev. B 2008, 78, 094302. [Google Scholar] [CrossRef]
  42. Lin, D.; Liu, W.; Liu, Y.; Lee, H.R.; Hsu, P.-C.; Liu, K.; Cui, Y. High Ionic Conductivity of Composite Solid Polymer Electrolyte via In Situ Synthesis of Monodispersed SiO2 Nanospheres in Poly(Ethylene Oxide). Nano Lett. 2016, 16, 459–465. [Google Scholar] [CrossRef] [PubMed]
  43. Blanchard, D.; Nale, A.; Sveinbjörnsson, D.; Eggenhuisen, T.M.; Verkuijlen, M.H.W.; Suwarno; Vegge, T.; Kentgens, A.P.M.; De Jongh, P.E. Nanoconfined LiBH4 as a Fast Lithium Ion Conductor. Adv. Funct. Mater. 2015, 25, 184–192. [Google Scholar] [CrossRef]
Figure 1. PXD patterns of (a) Br0.3, Br0.4 and Br0.5 samples and (b) I0.2, I0.3, I0.4 and I0.5 samples. Lattice parameters (a,c) and unit cell volume (V/Z) of the hexagonal (P63mc) structure as a function of the halide content (molar fraction) of (c) h-Li(BH4)1−α(Br)α and (d) h-Li(BH4)1−α(I)α.
Inorganics 11 00459 g001
Figure 2. Li-ion conductivity of (a) Br0.3, Br0.4 and Br0.5 samples and (b) I0.2, I0.3, I0.4 and I0.5 samples. All data were obtained from the second heating temperature-dependent EIS cycle. The Li-ion conductivity of the LiBH4 during the second heating temperature-dependent EIS cycle is shown for comparison. The impedance spectroscopy measurements result in a Nyquist plot showing a single arc.
Inorganics 11 00459 g002
Figure 3. Activation energy as a function of halide concentration in the h-Li(BH4)1−α(X)α (X = Br, I) SSs. The activation energy was calculated from data collected during the second heating ramp. Error bars were obtained from the linear fit of the Arrhenius plot (95% confidence).
Inorganics 11 00459 g003
Figure 4. Li-ion conductivities of (a) h-Li(BH4)0.7(Br)0.3 and (b) h-Li(BH4)0.8(I)0.2 samples, with different v/v % of SiO2. Data were obtained from the second heating temperature-dependent EIS cycle. An enlargement of the vertical axes of figure (b) is also shown. The Li-ion conductivities of (a) h-Li(BH4)0.7(Br)0.3 and (b) h-Li(BH4)0.8(I)0.2 samples during the second heating temperature-dependent EIS cycle are reported for comparison.
Inorganics 11 00459 g004
Figure 5. Li-ion conductivity at 40 °C (circles) and activation energy (squares) as a function of pore filling fraction (%) for (a) h-Li(BH4)0.7(Br)0.3 and (b) h-Li(BH4)0.8(I)0.2 SSs, with different v/v % of SiO2. Dashed lines indicate the Li-ion conductivity at 40 °C of the h-Li(BH4)1−α(X)α hexagonal phases without oxide; dash–dotted lines correspond to the activation energy calculated for the h-Li(BH4)1−α(X)α SSs without oxide; dotted lines are a guide for the eye.
Inorganics 11 00459 g005
Figure 6. Contour map of Log σ at 40 °C as a function of the amount of SiO2 and of (a) h-Li(BH4)1−α(Br)α and (b) h-Li(BH4)1−α(I)α composition. Iso-conductivity dashed lines correspond to the values and lines shown in the legend. The red circles indicate the highest Log σ reached in each system. In the bottom of both figures, the grey circle indicates the Log σ of the o-LiBH4, while white circles give the Log σ values of LiBH4-SiO2 composites, as taken from Ref. [21].
Inorganics 11 00459 g006
Table 1. Composition, fraction of pore filling and thickness of LiBH4 of investigated samples.
NameHalideOxideρ 1Fraction of
Pore Filling 2
Thickness of
h-Li(BH4)1−α(X)α 3
Molar Fractionwt.%v/v %g/cm3%nm
I0.2I0.2//1.30//
I0.2-13I0.220131.3013410.5
I0.2-16I0.225161.301007.8
I0.2-20I0.230201.30786.1
I0.2-33I0.245331.30413.2
I0.2-47I0.260471.30221.7
I0.3I0.3//1.66//
I0.3-24I0.330241.66614.8
I0.3-38I0.345381.66322.5
I0.4I0.4//1.95//
I0.4-28I0.430281.95524.1
I0.4-42I0.445421.95272.1
I0.5I0.5//2.23//
I0.5-45I0.545452.23241.9
Br0.3Br0.3//1.36//
Br0.3-13Br0.320131.3612810.0
Br0.3-21Br0.330211.36755.8
Br0.3-34Br0.345341.36393.1
Br0.3-48Br0.360481.36211.7
Br0.4Br0.4//1.60//
Br0.4-24Br0.430241.60635.0
Br0.4-37Br0.445371.60332.6
Br0.5Br0.5//1.83//
Br0.5-26Br0.530261.83554.3
Br0.5-40Br0.545401.83292.3
1 Calculation performed using the h-Li(BH4)1−α(X)α volume obtained from the Rietveld refinement. 2 Calculation was performed dividing the h-Li(BH4)1−α(X)α occupied volume per gram of SiO2 by the pore volume (Vp). 3 Calculation was performed considering the BET surface area of the SiO2 and assuming it as a plane.
Disclaimer/Publisher’s Note: The statements, opinions and data contained in all publications are solely those of the individual author(s) and contributor(s) and not of MDPI and/or the editor(s). MDPI and/or the editor(s) disclaim responsibility for any injury to people or property resulting from any ideas, methods, instructions or products referred to in the content.

