Article

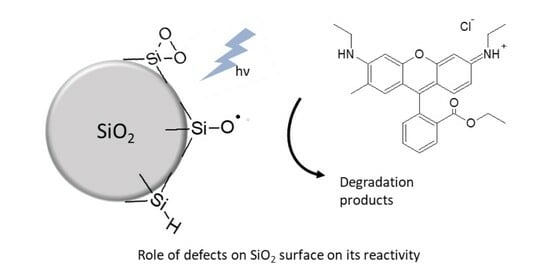
Role of Surface Defects on Photoinduced Reactivity in SiO2 Nanoparticles

1
Nano4Light, Department of Chemistry, Biology and Biotechnology, University of Perugia, Via Elce di Sotto 8, 06123 Perugia, Italy
2
Department of Chemistry, Biology and Biotechnology, University of Perugia, Via Elce di Sotto 8, 06123 Perugia, Italy
*
Author to whom correspondence should be addressed.
Inorganics 2023, 11(11), 430; https://doi.org/10.3390/inorganics11110430
Submission received: 5 October 2023 / Revised: 22 October 2023 / Accepted: 25 October 2023 / Published: 2 November 2023
(This article belongs to the Special Issue Nanocomposites for Photocatalysis)

Abstract

:
Silica nanostructured materials find application in different fields, since they are cheap, versatile, and easy to functionalize as materials. However, silica reactivity has not been deeply investigated yet, mainly due to a poor understanding of how it is affected by superficial defects. In the present study, the electronic and optical properties of nanoparticles have been investigated using bare silica nanoparticles (SNP) and amino- or phosphonate-functionalized silica nanoparticles (SNP–APTES and SNP-phosphonate), prepared by a sol-gel procedure, and their morphology has been investigated using transmission electron microscopy (TEM) analysis. The prepared silica nanomaterials were characterized by means of reflectance and emission spectroscopies to determine the types of defects that can be found on silica nanoparticles’ surface. In order to understand the effect of surface defects on the reactivity of silica, the nanoparticles were employed for the photocatalytic degradation of Rhodamine 6G (R6G), upon selective irradiation at 320 nm, where only silica colloids absorb. The photoreaction was carried out in ethanol and in water and was monitored following the fluorescence signal of the dye. The evaluation of the fluorescent intensities allowed for the determination of the degradation efficiencies.

Graphical Abstract

1. Introduction

Silica (SiO2) nanoparticles have raised a lot of interest in recent decades, and they have been deeply characterised and studied. Indeed, silica nanostructures have found applications in many fields such as microelectronics [1,2], drug delivery [3,4], biological labelling [5], and photocatalysis [6,7,8,9,10]. Amorphous silica nanomaterials are non-toxic, can be prepared with cost-effectiveness methods, and their surface-to-volume ratio can be enhanced by the proper choice of the synthetic conditions. Silica has a very wide band gap (nominally 8.9 eV) making this material transparent to UV and visible radiation; these electronic properties foster the use of silica to entrap dyes [11,12] and drugs in order to improve stability as well as delivery [13,14]. However, little importance was given to their reactivity and on how it is related to the defect on their surfaces. Even though some papers focused on the attribution of luminescence phenomena to the defect on SiO2 surface [15,16,17], studies have to be conducted to improve our understanding on silica reactivity. These studies will lead to enhanced knowledge of silica reactivity which will increase the fields of applications where SiO2 nanostructures could be deployed. The reported catalytic activity of silica nanoparticles upon UV or Vis irradiation has been assigned to the presence of superficial chemical defects, which decrease the band gap energy or enhance the material photoactivation capacities in the UV-region [18,19,20,21,22]. The literature data clearly reports that the silica surface presents optically active structural defects. Oxygen deficient centres are responsible for the UV-Vis absorption and emission [16,23,24]. The photoinduced activation of these centres is assigned to irradiation-induced conversion between different configurations. The variation of silica electronic properties is known to be also due to the presence of several types of defects, such as oxygen vacancies with a trapped hole, 3-fold-coordinated silicones or oxygen-deficiency centres [24]. The number of silanol groups in the proximity of the defect centres influences the energy of these centres and hence the stability more than the number of defects [25].
In the present study, to achieve deeper insights on the electronic properties of silica colloids, three silica nanoparticles with different surface functionalization were synthesised and characterised. Their reflectance and emission spectra were taken into consideration to assign the various bands to the corresponding defects. Lastly, photodegradation tests of Rhodamine 6G (R6G) were carried out. These tests were used to investigate the how diverse defects and chemical surroundings affect the reactivity of silica nanoparticles.

2. Results

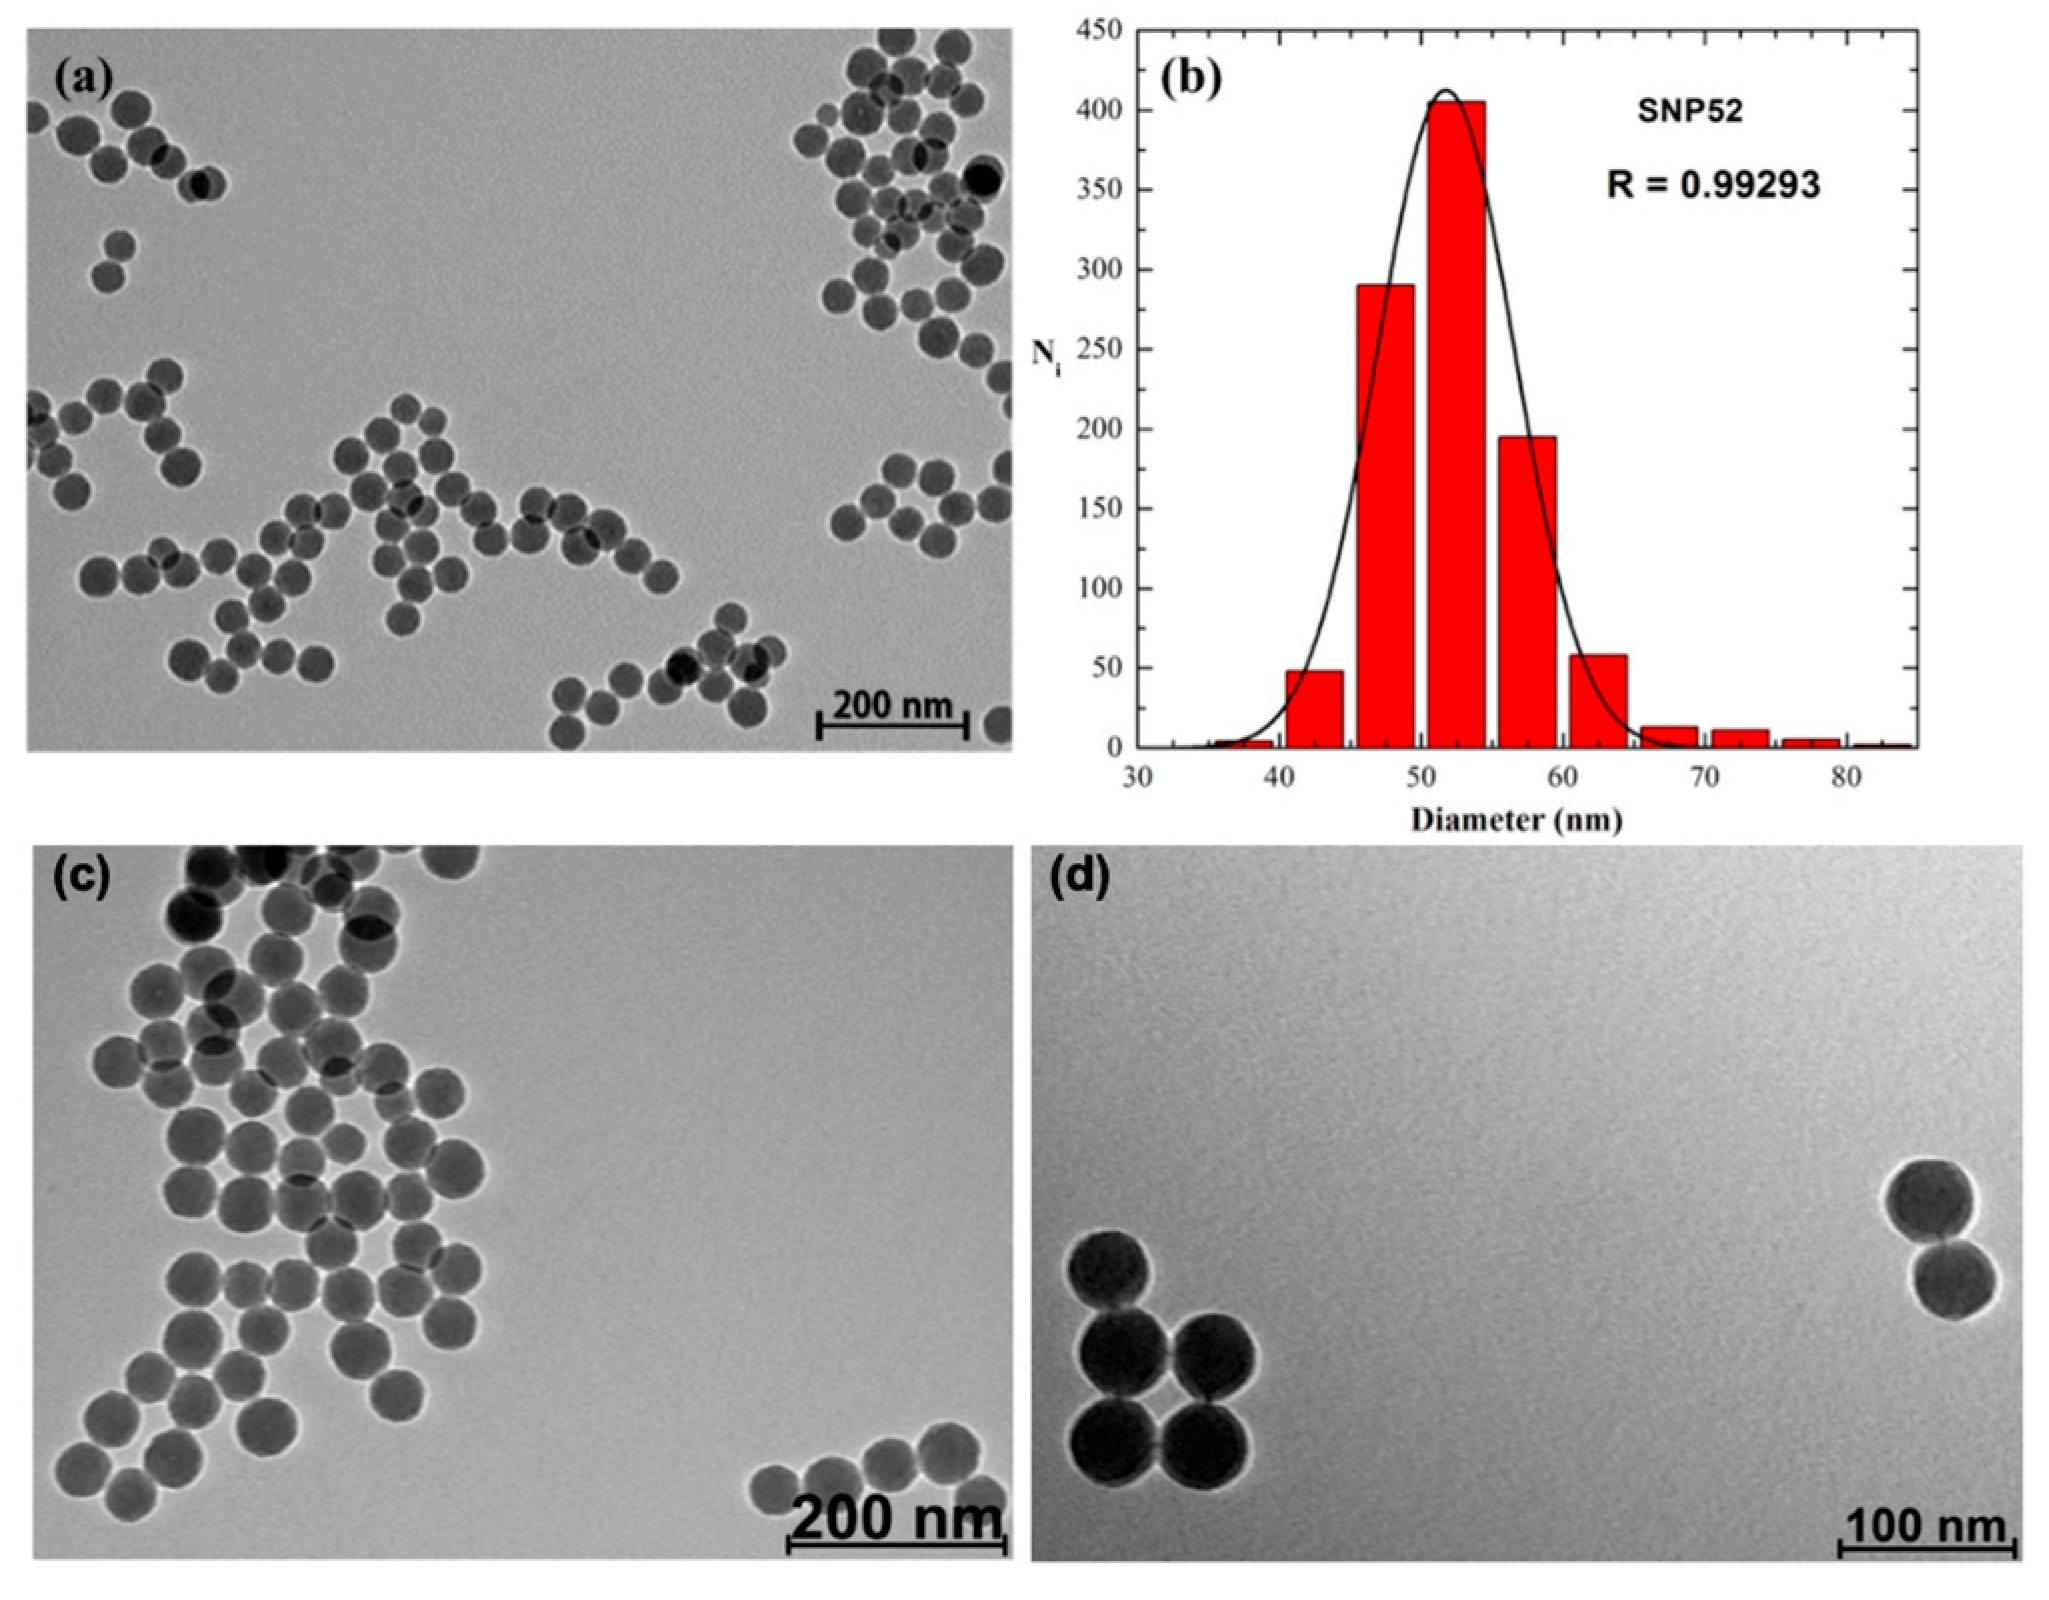
2.1. Morphological Characterization of the Materials

2.1.1. TEM Analyses

The morphology of silica nanoparticles (see scheme in Figure S1 for the preparation) was examined by transmission electron microscopy (TEM). The images (Figure 1a) revealed that the particles were spherical in shape and that a good dispersion had been achieved through the control of the preparation conditions. The size distribution analysis (Figure 1b) allowed for the determination of an average diameter of 52 ± 5 nm and a relative standard deviation (RSD) of 9.2%. The functionalization with 3-aminopropyltriethoxysilane (APTES) and 3-(trihydroxysilyl) propylmethylphosphonate (HPMP) to obtain SNP–APTES and SNP–Phosphonate samples, respectively, did not alter the shape and size distribution of the particles.

2.1.2. Surface Analyses

The nitrogen adsorption–desorption isotherms recorded for all silica samples indicated that, in the examined pressure conditions, the adsorbed nitrogen volume was slightly smaller for the functionalized silica. Thus, a decrease in the surface area upon grafting of functional groups was measured for the samples under investigation (Table 1). The adsorption and desorption isotherms of the three samples presented similar profiles reflecting a negligible mesoporous structure for all the samples (Figure S2). This was also confirmed by Barrett-Joyner-Halenda (BJH) analysis of the adsorption and desorption data, which evidenced pore volume values below 0.1 cm3 g−1 for the three samples (0.012–0.001 cm3 g−1).

2.1.3. Zeta Potential Measurements

Zeta potential measurements were used to evaluate the surface charge distribution of the nanoparticle aqueous dispersions. The zeta potential of SNP, SNP–APTES and SNP–phosphonate in water and ethanol are listed in Table 1. SNP and SNP–phosphonate particles presented a clearly negative surface potential values ranging from −20 to −56 mV, regardless the solvent in which the NPs were dissolved, due to the presence of deprotonated silanol groups and anionic oxygens of the phosphonate moieties, respectively. The silica sample modified with amino groups had a less negative surface potential, confirming that the functionalization conferred a positive contribution to the surface charge distribution. In water the samples presented, more negative surface charge values were likely due to the larger degree of dissociation of surface groups.

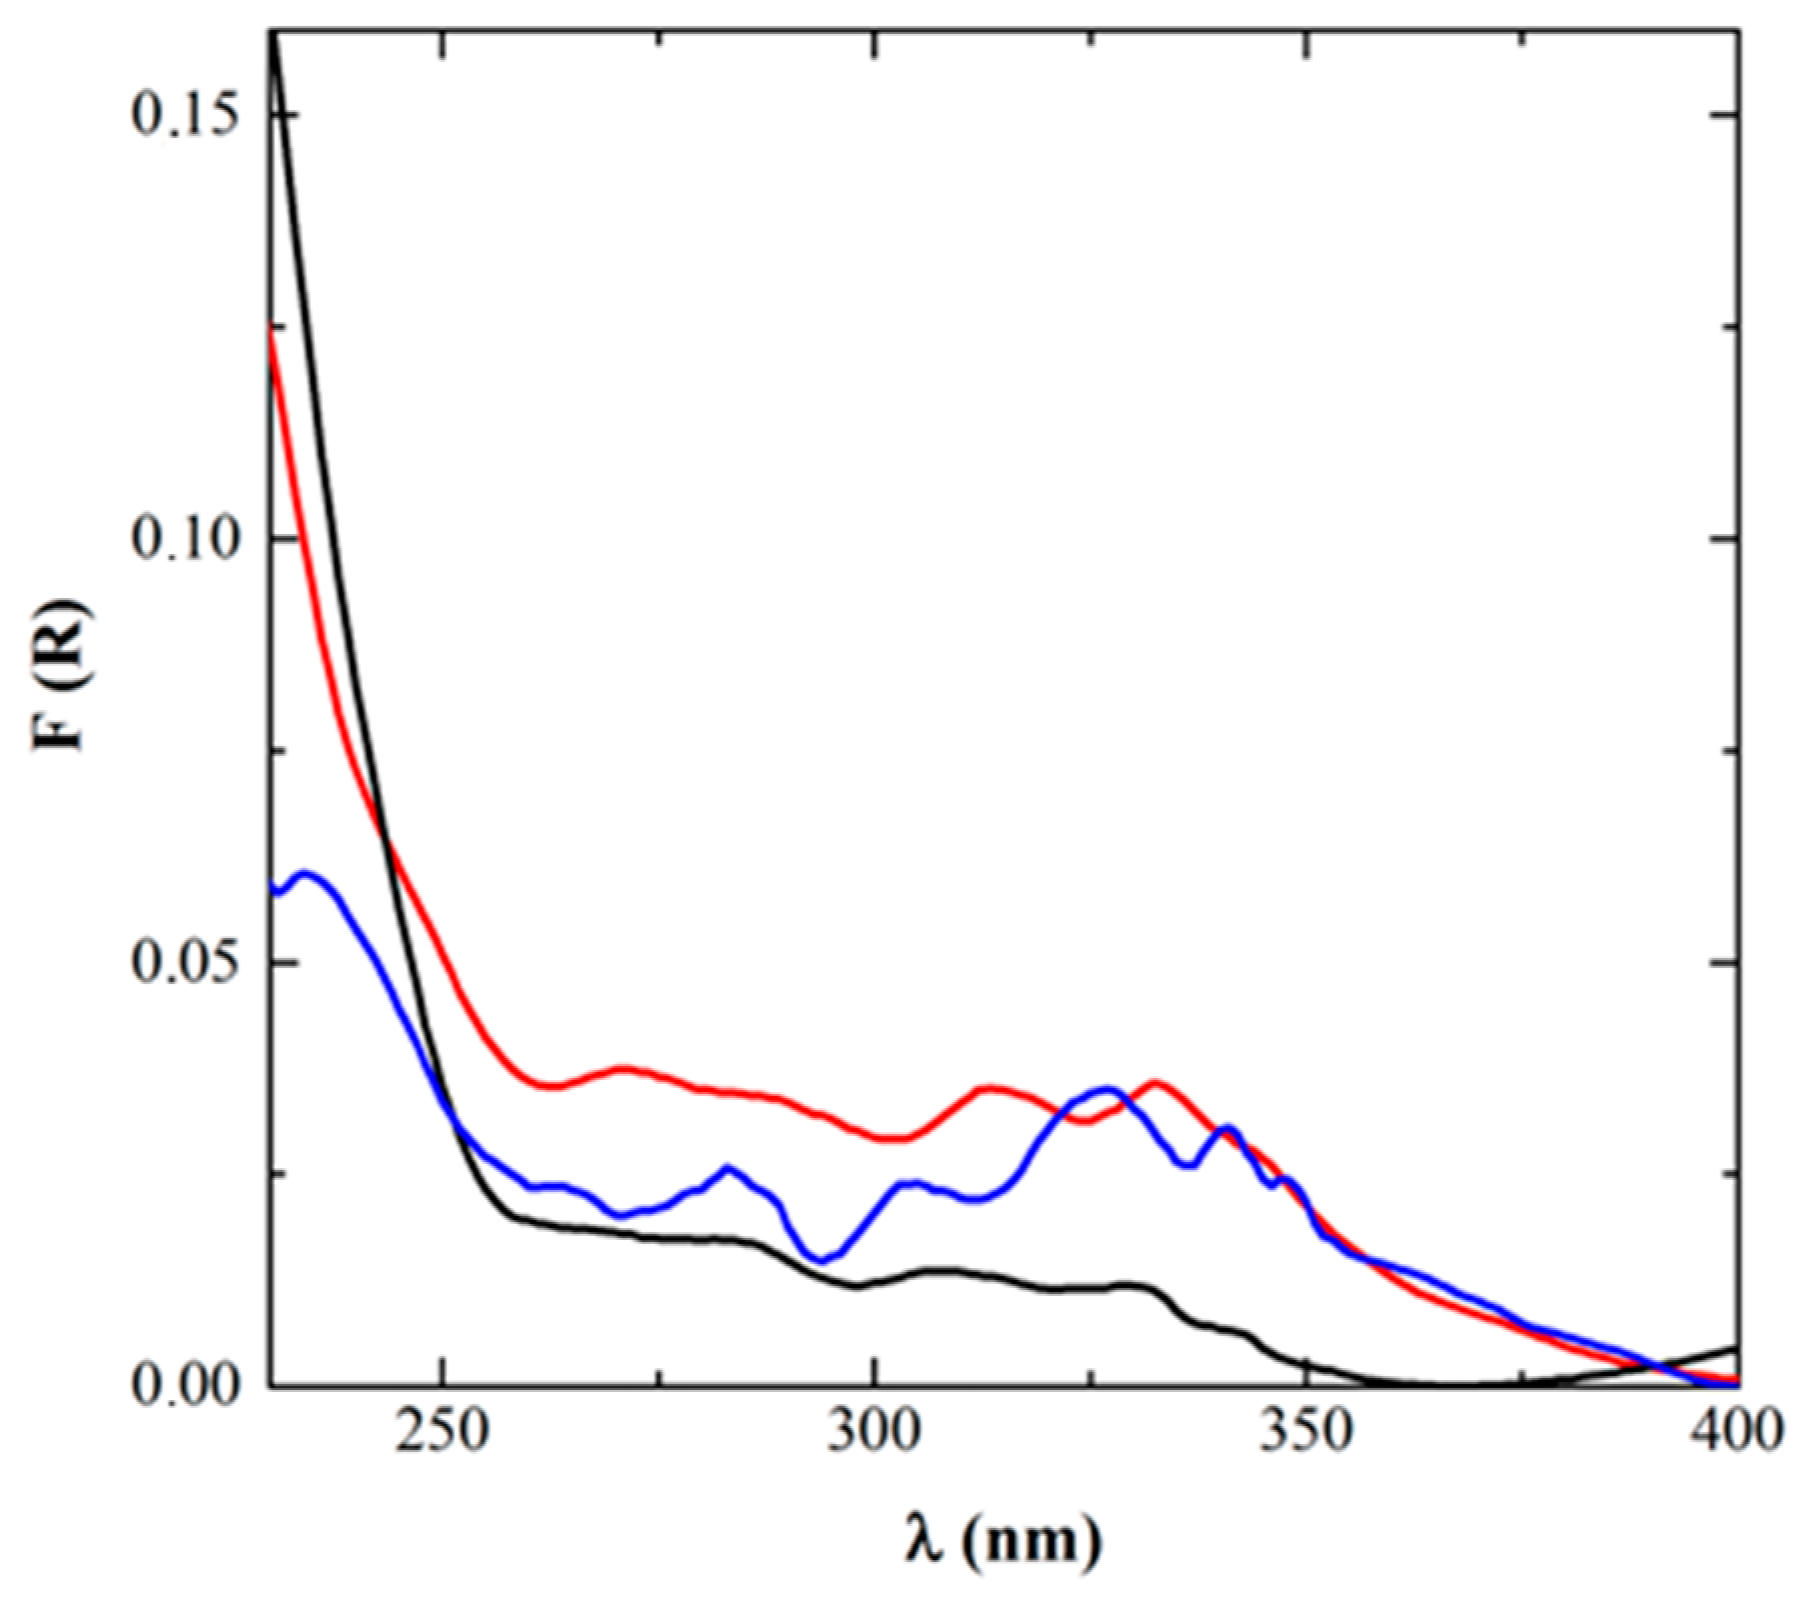
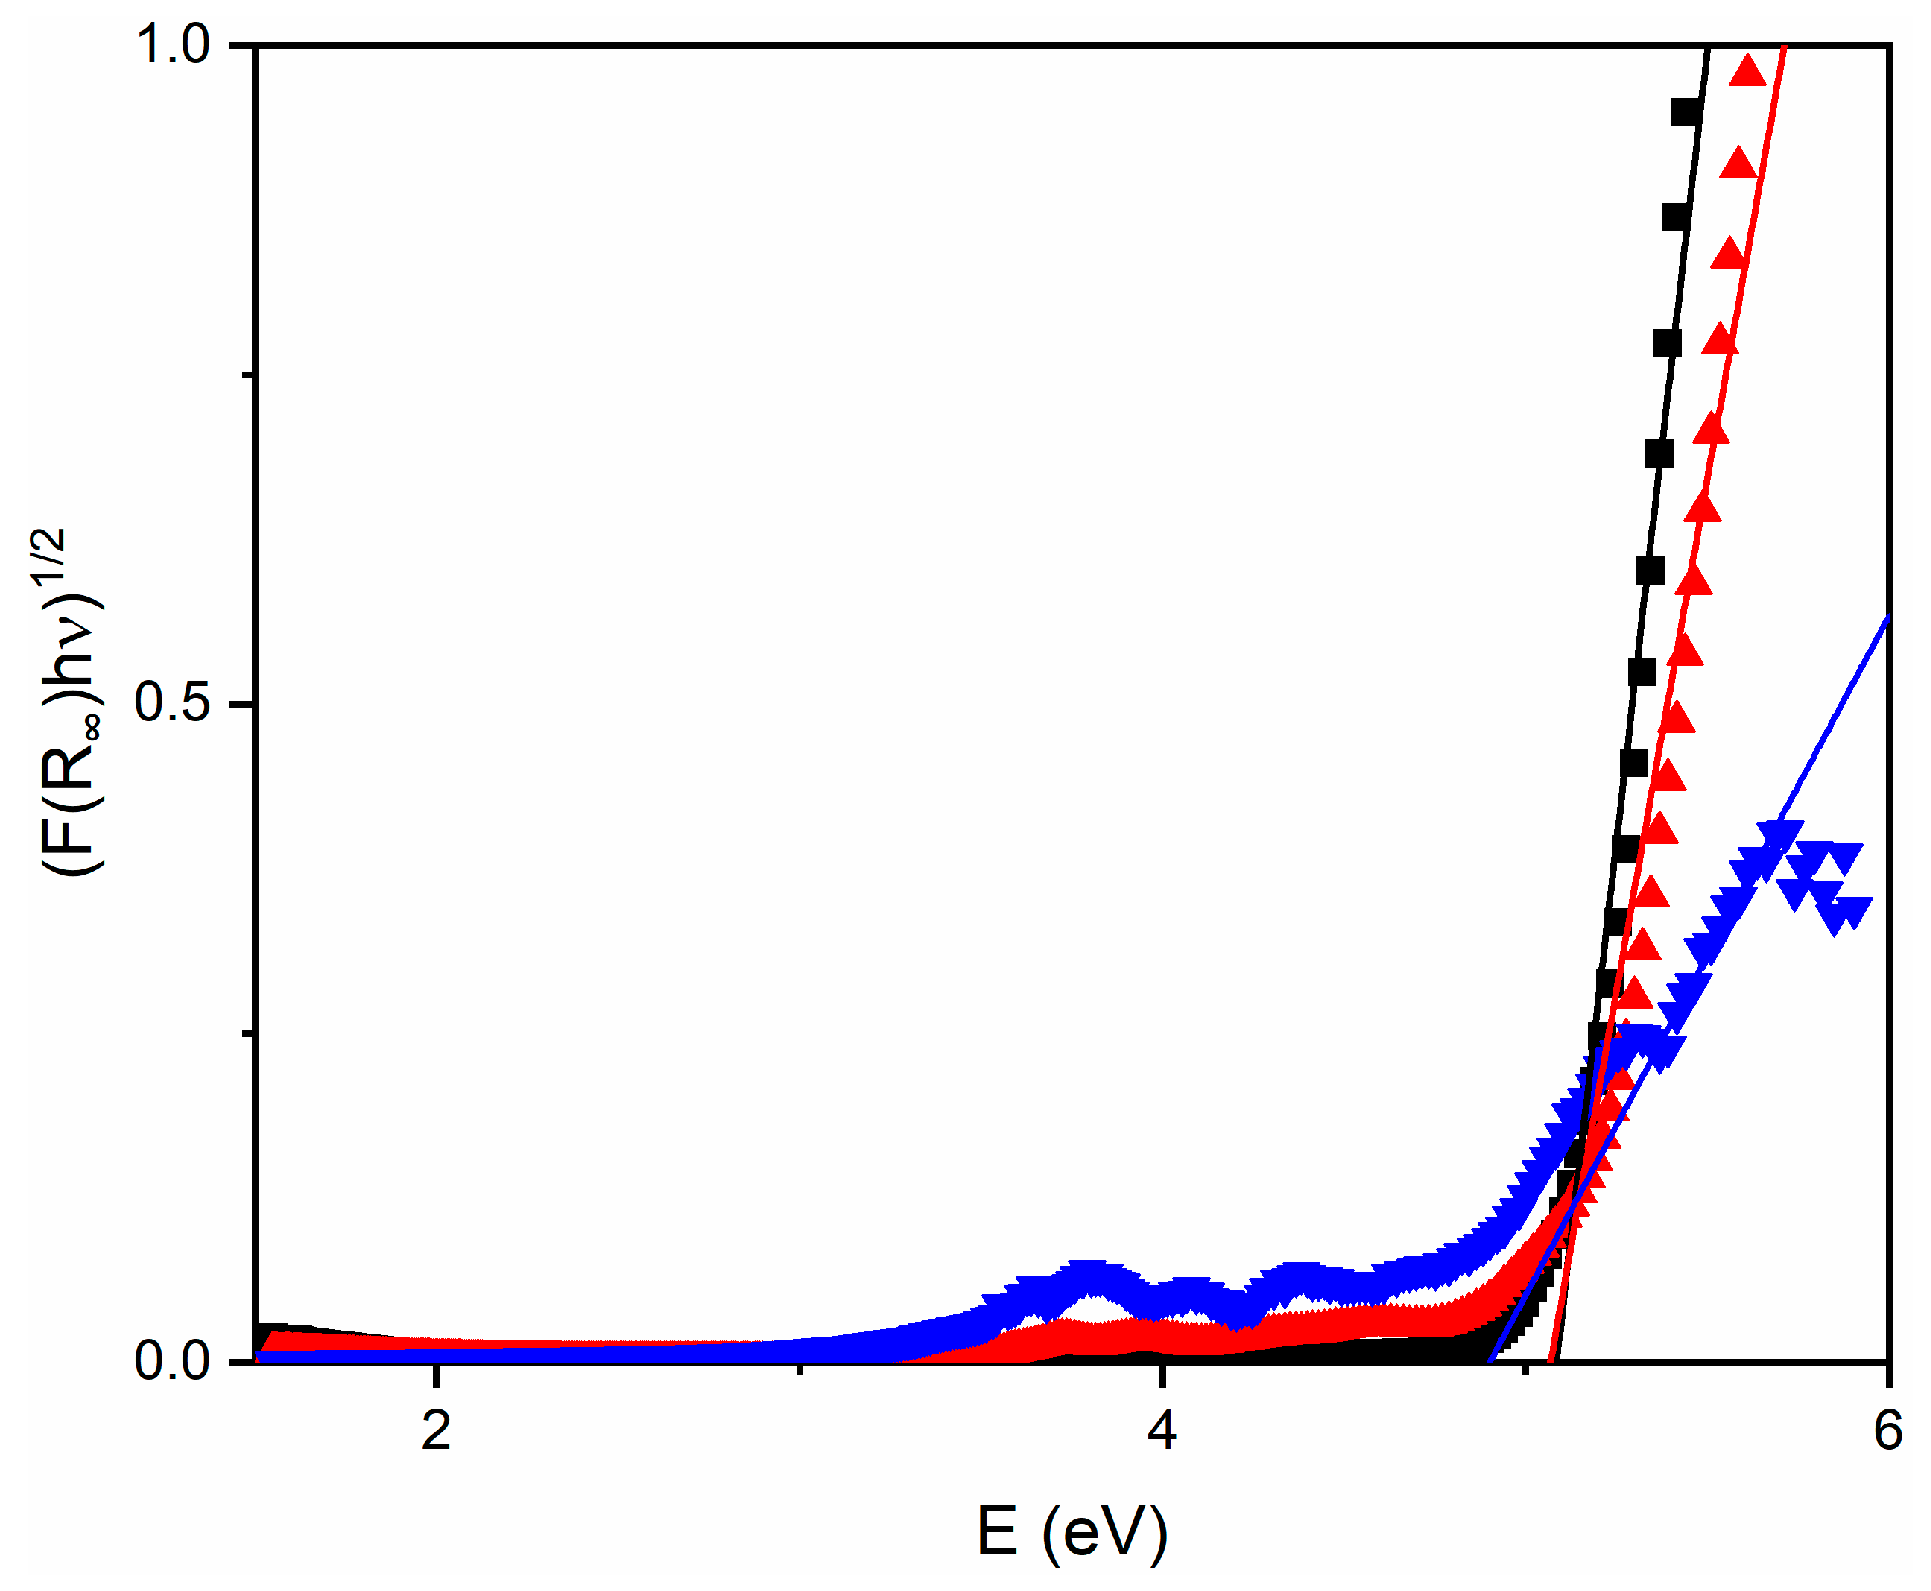
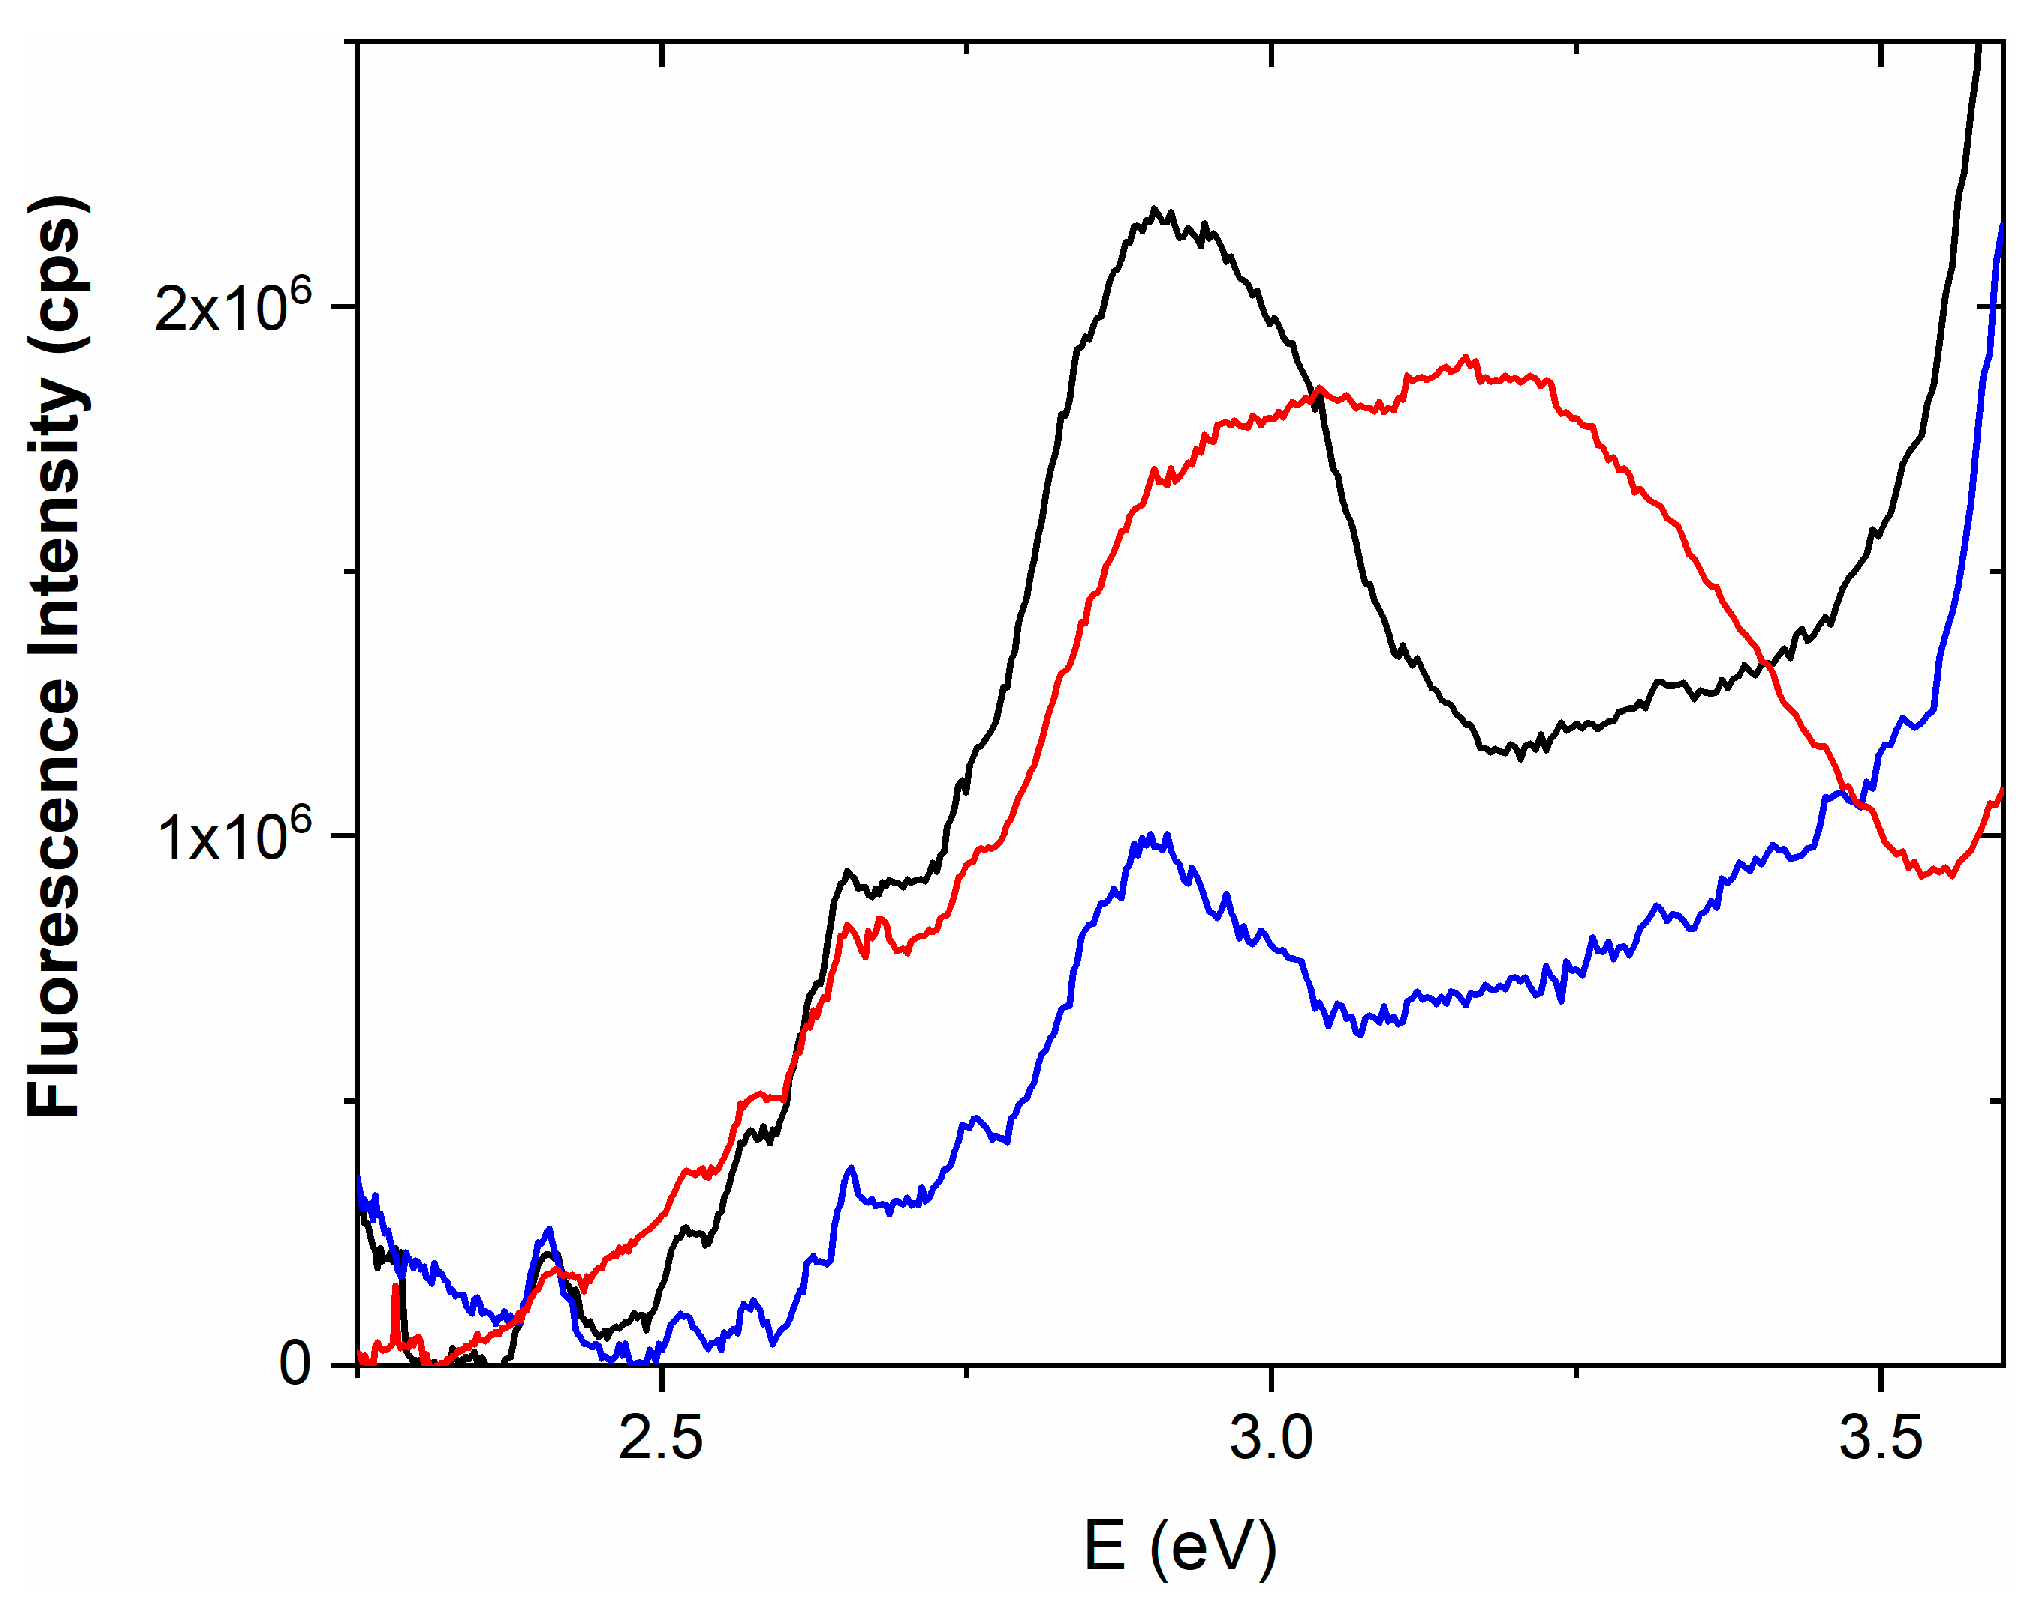
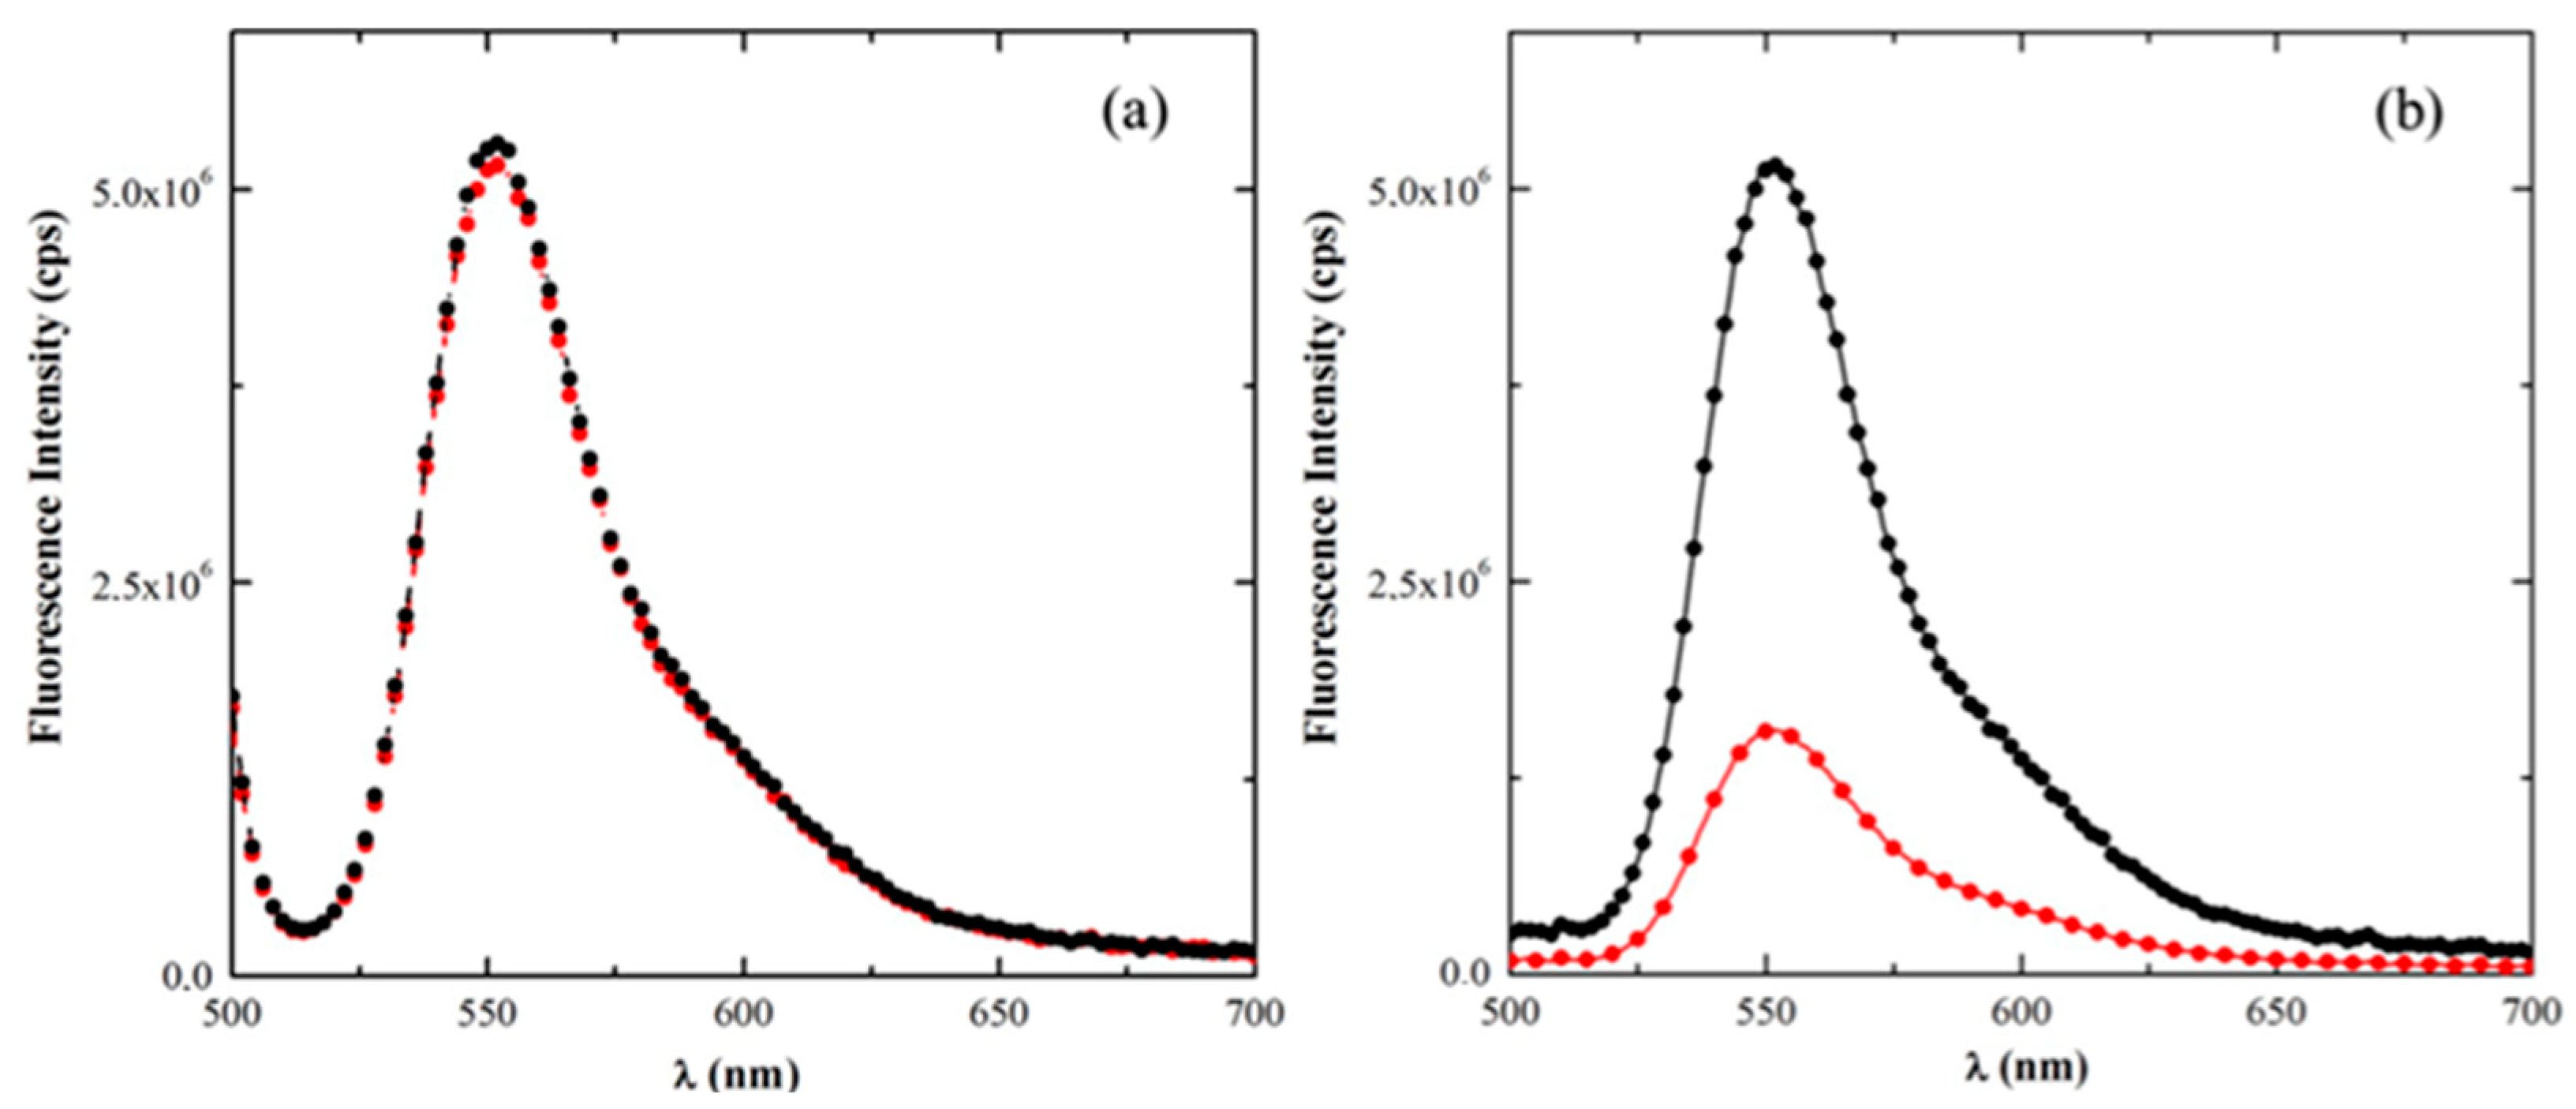
2.1.4. Spectral Characterization

The UV–Vis absorption spectra of SNP, SPN–APTES, and SNP–phosphonate powder samples are showed in Figure 2. Variations in the band profiles were observed when the nanoparticles were chemically modified with APTES or HPMP.
The surface functionalization with amino groups resulted in a red-shift of the absorption maximum and in a subsequential reduction in the band gap, ascribable to modifications of the surface defects (Figure 2). A similar effect was observed when the nanoparticles were chemically modified with phosphonate groups.
From the Tauc plot (Figure 3) the band gap values of the three materials were determined; the results are reported in Table 2.
From the obtained results, it is clear that the surface functionalization affects the electronic properties of silica nanoparticles. In more detail, the SNP–phosphonate has the smallest band gap, followed by SNP–APTES, and then by SNP. The emission spectra of the three materials were also recorded exciting the materials at 313 nm (Figure 4). The recorded spectra displayed three different band profiles that diverged both in intensity and shape due to the number of defects on nanoparticles surface.

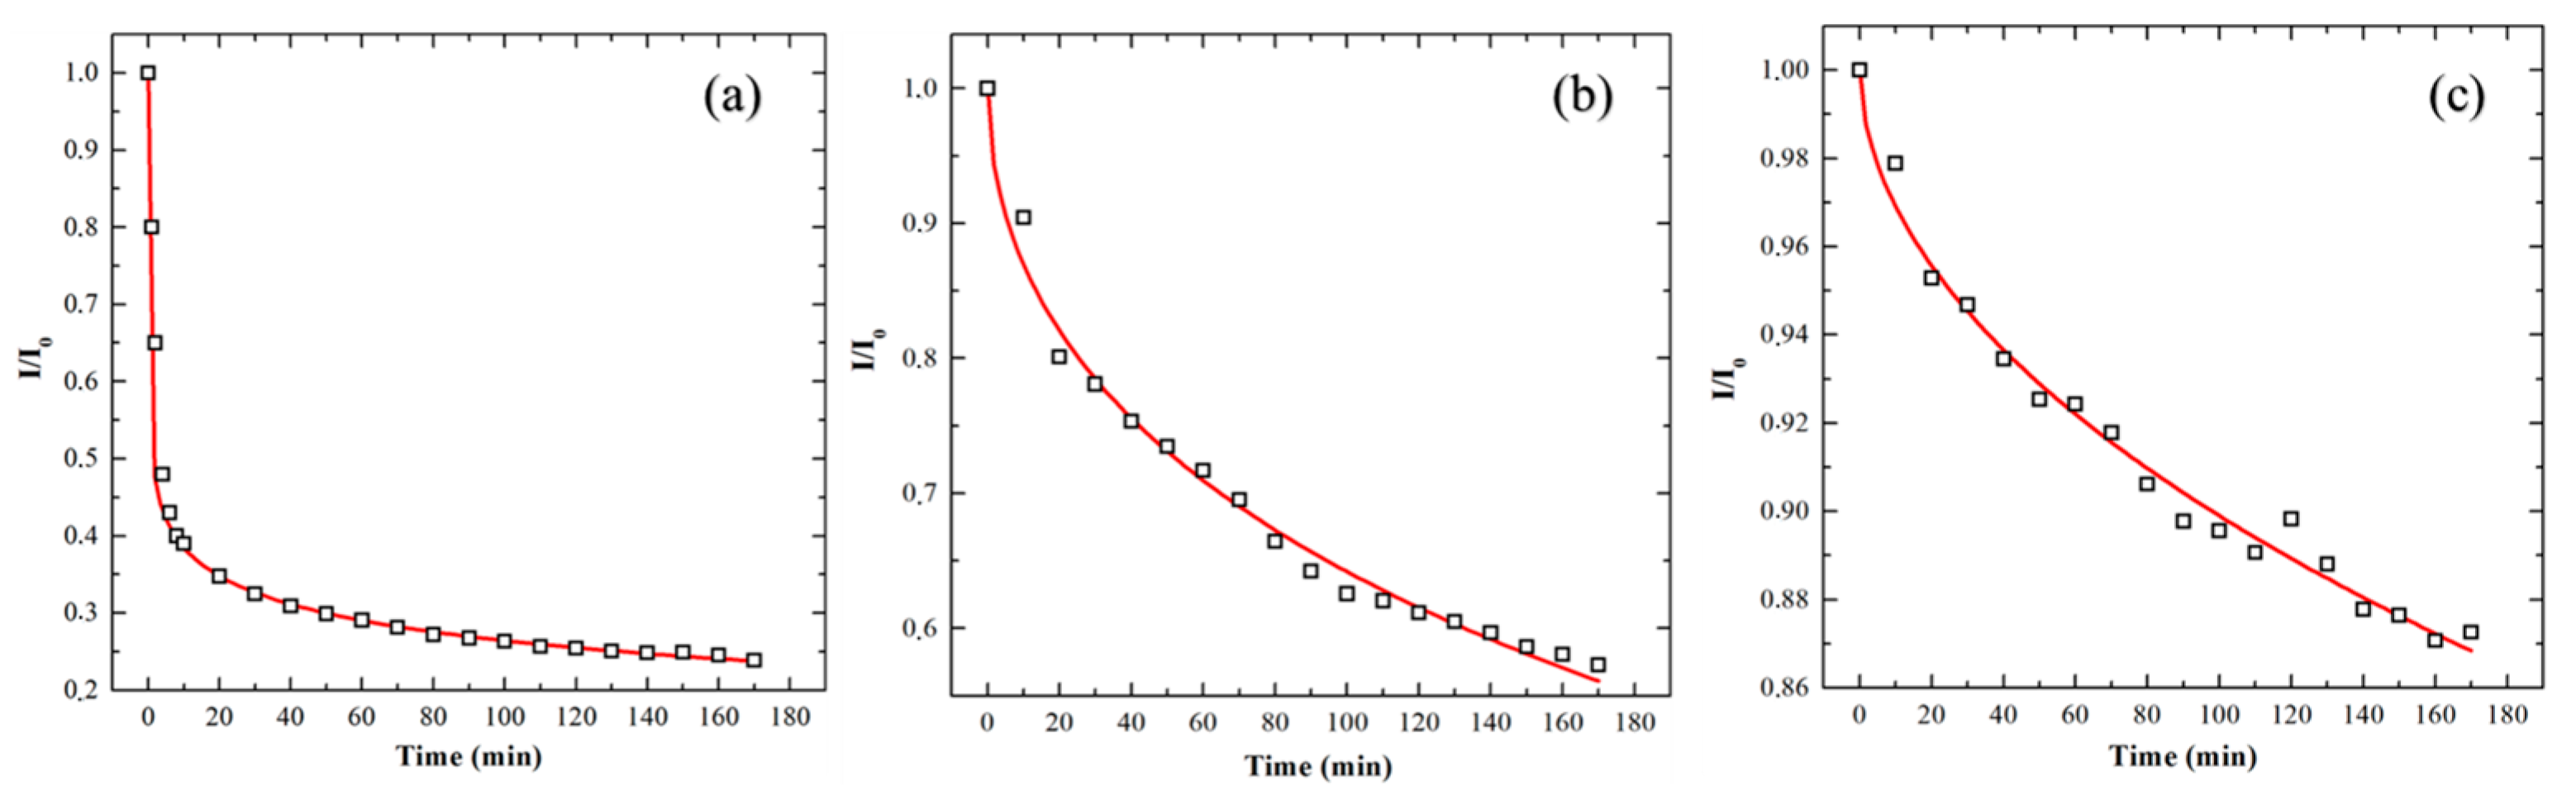
2.1.5. Photodegradation of R6G in Ethanol and Aqueous Solutions

In order to test the photoinduced reactivity of silica surfaces, photocatalytic tests were performed; in particular, the prepared nanoparticles were used as photocatalysts for the degradation of R6G. The irradiation tests were carried out upon irradiation at 320 nm, where the absorption of R6G is negligible (at a dye concentration of 2.87 × 10⁻⁷ M) and the photodegradation only upon UV absorption by R6G was excluded (Figure S2) in the presence of differently functionalized silica colloids (1.67 g/L). The irradiation was performed using water or ethanol as solvents in the presence of SNP, SNP–APTES, or SNP–phosphonate samples. The fluorescence intensity is an accurate tool to monitor the dye concentration (Figure 5). Recording the fluorescence spectra of the dye (λexc = 490 nm) at different irradiation times, the occurrence of photodegradation processes was observed in water (Figure 5b).
No intensity changes, within the experimental error, were detected in ethanol suspensions for all the silica samples (Figure 5a, as an example); while a progressive intensity decrease was observed in the presence of SNP, SNP–APTES, or SNP–phosphonate samples in aqueous suspensions (Figure 5b, as an example). Control irradiation experiments were carried out on the dye aqueous solutions, without silica nanoparticles, and they were used as reference experiments.

2.1.6. Degradation Analysis

Figure 6 shows the decrease in R6G fluorescence intensity as a function of time in the presence of SNP, SNP–APTES, and SNP–phosphonate in aqueous dispersions as determined by the I/I0 ratio where I0 is the fluorescence intensity collected before starting the irradiation. The adsorption of R6G on the surface of SNP was analysed by keeping them in contact in the dark for 3 h and recording the fluorescence spectra of R6G (Figure S3); intensity changes in few percentages were observed. The resulting plots presented a non-exponential behaviour suggesting that a first-order model was not adequate to describe the degradation of the silica catalysts. The kinetics of R6G degradation over SNP nanoparticles presents a complex exponential behaviour, similar to that reported by Bergamini [26] or Flomenbom [27].
The results obtained from the degradation tests are reported in Table 3.

3. Discussion

The obtained data open to some crucial considerations of silica reactivity and how it is related to its defects and electronic properties. The functionalization with APTES and HPMP leads to some modifications of UV-Vis spectra of SiO2. Because of the different functionalization, the band gap of the nanoparticles remains almost the same for SNP and SNP–APTES, 5.08 and 5.05, respectively, while it decreases to 4.90 in SNP–phosphonate (Table 2). The presence of two different bands in the emission spectra (Figure 4) centred at around 2.9 eV and 2.65 eV are symptomatic of the presence of defects in the materials. As previously reported, the shape of the emission spectra can be attributed to hydrogen-related defects (≡Si–H), neutral oxygen vacancy centres (≡Si–Si≡), and to an isolated non-bridging oxygen atom (≡Si–O) [15,16]. However, some differences among the spectra of the samples can be highlighted. Even though the emission spectrum of SNP–phosphonate displays the same bands as the unmodified SiO2, they are less intense probably due to a lower concentration of defects on the surface or due to other defects that quench the emission from the particles. Concerning the emission of SNP–APTES, a broad band at higher energy is displayed. The full width at half-maximum (FWHM) of the band peaked at 2.9 eV is 0.24 eV for SNP, while it increases to 0.80 eV for SNP–APTES. The broadening of this peak in the emission spectrum was due to oxygen divacancies defects, which own a photoluminescence signal in the range from 3 to 3.5 eV [24]. This kind of defect becomes relevant only when the functionalization is carried out with APTES, as in the case of SNP and SNP–phosphonate of which bands are not detectable. The absorption spectra (Figure 2) of the three samples showed some bands in the region from 260 to 290 nm due to oxygen-excess-related defects [24]. Those bands are mainly visible for SNP–phosphonate while they are slightly detectable in the SNP–APTES spectrum. The presence of different surface chemistries on the three nanoparticle surfaces is also supported by the different Z potential values (Table 1). SNP and SNP–phosphonate are negatively charged both in water and in ethanol, with the latter being more negative than the former. Concerning the Z potential of SNP–APTES, it is almost negatively charged in both the environments. In Table 4 the defects present on each material surface are summarised.
To validate that the reactivity of silica nanoparticles is affected by both the chemical surroundings and the defects on their surfaces, degradation tests on R6G were carried out in presence of the three samples. Parameters such as the dimensions of the three silica nanoparticles were not taken into consideration since they are comparable. We found that R6G was efficiently photodegraded in the aqueous suspensions of the silica colloids. The water molecules adsorbed on the catalyst surface could promote the formation of reactive oxygen species. The lack of observing photodegradation in ethanol suspensions can also be related to the binding modes of ethanol on silica surfaces; it has been reported that ethanol is able to bind to both silanol and the siloxane moieties and form a coating on silica [28]. Water binds only to silanol groups and tends to cluster on silica [28,29], limiting the hindrance for the leakage of reactive intermediates.
On the basis of the collected data, some considerations of nanoparticles surface defects and their reactivity can be made. Firstly, the photocatalytic properties are not related to band gap transitions as we irradiated the systems at 3.96 eV (313 nm), which is not enough to allow for the transition in the silica samples. Then, the functionalization modified the chemical surroundings of the nanoparticles, also altering the defects on their surface, i.e., oxygen related-defects, hydrogen-related defects, etc., as detected from the UV-Vis absorption spectra and emission spectra. Those defects are strictly related to the photoinduced activities of the nanoparticles. In our work, SNP is the material with the best reactivity among the three synthesized nanoparticles with a photocatalytic efficiency (PE) of 76%. Its reactivity is mainly due to higher superficial defects concentration compared to the other silica. SNP–APTES displays the second-best reactivity PE = 43%, even though the photoluminescence (PL) emission suggests that different defects can be found on its surface. Lastly, SNP–phosphonate is the material with the worst reactivity: PE = 13%. The higher PE of SNP is due to a greater concentration of photoactivable defects on the surface. Moreover, taking into consideration the Z-potential values, the reactivity of the particles is mainly related to their defects. Indeed, SNP and SNP–phosphonate showed the same surface charge potential; thus, the electrostatic interactions between these nanoparticles and the dye in water should be similar but the PEs are extremely different. However, at this stage, it is not possible to rule out that the different R6G degradation efficiencies could be associated with the ability of the different surfaces to make specific interactions with the dye. In addition, the kinetic data (as t1/2) are incredibly different considering that the irradiation of the systems were carried out in the same experimental conditions. Those modifications could not be justified by only the decrease in the surface areas since, for SNP–phosphonate, it was only 30% lower than that of bare SNP whereas its t1/2 was 629 times higher.

4. Materials and Methods

4.1. Materials

1-hexanol, cyclohexanol, Triton X-100, 3-aminopropyltriethoxysilane (APTES), 3-(trihydroxysilyl) propylmethylphosphonate (HPMP) monosodium salt solution (50 wt. % in H2O), acetone, and aqueous ammonia solution (28–30% NH3 basis) were purchased from Sigma-Aldrich (Sigma-Aldrich, St. Louis, MO, USA) and used without further purification. Tetraethoxysilane (TEOS) and ethanol were obtained from Fluka (Milwaikee, WI, USA), whereas Rhodamine 6G was from K&K Laboratories, Inc. (Carlsbad, CA, USA). Analytical grade water was used for the preparation of the solutions.

4.2. Preparation of the Nanoparticles

4.2.1. Preparation of Silica Nanoparticles

The nanoparticles were prepared according to the microemulsion method described elsewhere [6,30,31]. Briefly, TEOS (1.0 mL) was added to a reverse microemulsion formed by mixing 75.0 mL of cyclohexane, 17.7 mL of TX-100, 5.4 mL of deionized water, and 18.8 mL of 1-hexanol. Then, by pouring ammonia (0.7 mL) into the microemulsion under vigorous stirring, the hydrolysis and condensation reactions started. After 24 h, the silica nanoparticles were precipitated with acetone (40 mL) and separated from the unreacted species by centrifugation at 3000× g for 30 min. The white pellet containing the nanoparticles was washed several times with ethanol and water to remove the residual surfactant. After the purification, the nanoparticles were dispersed in 50 mL of ethanol or water to give the final sample (SNP).

4.2.2. Preparation of Amine- and Phosphonate-Functionalized Silica Nanoparticles

To functionalize the surface of the silica nanoparticles, APTES or HPMP were added to the ethanol dispersion of SNP and the mixture was stirred at room temperature for 24 h. The sample was separated by centrifugation and washed twice with ethanol. The resulting functionalized nanoparticles were then dispersed in ethanol (10 mL). The functionalization of 10.0 mL of SNP solution was achieved using 5.0 μL of APTES and 9.6 μL of HPMP, respectively.
A schematic representation of the synthetic procedures is reported on the Supporting Information (Figure S1).

4.3. Nanoparticles Characterization

The morphology of SNP sample was investigated by transmission electron microscopy (TEM) using a Philips model 208 microscope (Philips, Eindhoven, The Netherlands) working at 80 kV of beam acceleration. The average dimension of NPs was measured by statistical analysis of TEM images using ImageJ software 1.54d (National Institutes of Health, Bethesda, MD, USA). The particle size data were based on the image analysis of more than 300 particles.
Nitrogen adsorption–desorption isotherms at 77 K were determined using computer-controlled Micromeritics (Norcross, GA, USA) ASAP 2010 apparatus. Prior to adsorption measurements, samples were outgassed at room temperature overnight. The specific surface area was determined by the Brunauer, Emmett, and Teller (B.E.T.) technique [32]; mesopore volume was analysed by the BJH method [33].

4.4. Zeta Potential Measurment

The zeta-potential values of NPs in water and ethanol suspensions (SNP, SNP–APTES and SNP–phosphonate) were determined by a NICOMP 380 ZLS instrument equipped with a HeNe Laser source at 632.8 nm (Particle Sizing System, Inc., Santa Barbara, CA, USA).

4.5. UV-Vis Absorption and Fluorescence Spectra of Nanoparticles Suspensions and Dye Solutions

Absorption spectra of the solid samples were recorded by a Cary4000 (Varian Inc., Palo Alto, CA, USA) spectrophotometer, equipped with a 150 mm integration sphere and a barium sulphate tablet as reference. The spectra were processed with the Kubelka–Munk equation in order to make possible the comparison. Absorption spectra of the colloidal suspensions of the silica nanoparticles and the dye were recorded with a PerkinElmer Lambda 800 spectrophotometer (Waltham, MA, USA)
A Fluorolog-2model F112AI (Spex Industries Inc., Edison, NJ, USA) spectrofluorometer was used to record fluorescence spectra of the dye and photocatalyst suspensions in water and ethanol, using a front face configuration between the excitation and the emission light.

4.6. Photodegradation Experiments

To monitor the effect of silica nanoparticles on the photodegradation of R6G, 2.0 mL of the dye aqueous or ethanol solution (4.3 × 10⁻⁷ M) was added to 1.0 mL of the photocatalyst water or ethanol dispersion (1.7 g/L); the resulting suspensions were irradiated for 170 min with UV light. Steady state irradiation experiments were performed using a 150 W Xenon lamp as light source and selecting the excitation wavelength (320 nm) by a monochromator. The impact of irradiation on the dye concentration was monitored by recording the intensity of dye fluorescence at 530 nm at different irradiation times (λexc = 490). Control experiments were carried out by irradiating the dye solutions, using the same experimental conditions, in the absence of silica nanoparticles.

5. Conclusions

Three different silica nanoparticles were synthesised and characterised by mean of reflectance and emission spectra. The main aim of the work was to investigate the modifications induced by superficial functionalization in terms of defects and reactivities of the surface of silica nanoparticles. The experimental results suggest that on SNP and SNP–phosphonate the main defects are hydrogen-related defects (≡Si–H), neutral oxygen vacancy centre (≡Si–Si≡), and isolated non-bridging oxygen atom (≡Si–O), whereas on SNP–APTES oxygen divacancies can also be detected at higher energies on the emission spectra. To determine the role of those defects on the photoreactivity of silica nanoparticles, R6G photodegradation tests were carried out. In the used experimental conditions, the UV light was mainly absorbed by the silica nanoparticles through the involvement of defect electronic states and chemical surroundings, whose excitation led to the formation of reactive intermediates. The dye concentration did not change when irradiation in the presence of silica catalysts was carried out in ethanol; instead, when water was used as solvent, the photodegradation reaction proceeded and the PE of bare silica (76%) was considerably higher than that of organically functionalized catalysts (43–13%). The lack of observed dye photodegradation in ethanol can be related to the coating that this solvent is able to form on silica surfaces, which can limit the leakage of reactive intermediates.
In summary, the defects on silica nanoparticle surfaces are the main factor responsible for their reactivity. Increasing their concentration can promote silica as a promising heterogeneous photocatalytic system, also opening the way for others photoprocesses, as its band-gap can be tuned by varying the concentration of defects modifying the surface chemistry of nanoparticles.

Supplementary Materials

The following supporting information can be downloaded at: https://www.mdpi.com/article/10.3390/inorganics11110430/s1, Figure S1: Schematic synthetic procedures for the preparation of SNP, SNP-APTES and SNP-Phosphonate; Figure S2: Nitrogen adsorption and desorption isotherms, at 77K, of SNP on the left and pore size distribution calculated from nitrogen adsorption data of SNP on the right; Figure S3: UV–Vis absorption (solid) and fluorescence (λexc = 490 nm; dotted) spectra of Rhodamine 6G in ethanol (black) and in water (red); Figure S4: Fluorescence spectra of Rhodamine 6G in the presence of SNP52 in water and ethanol (λexc = 490 nm); Inset: fluorescence intensity recorded at 552 nm upon storage in the dark the samples.

Author Contributions

R.D. data curation, formal analysis, writing—original draft preparation G.Q. Investigation, writing—review and editing R.S. Investigation, data curation, writing—review and editing F.M. Investigation, data curation L.L. conceptualization, formal analysis, writing—original draft preparation. All authors have read and agreed to the published version of the manuscript.

Funding

This research received no external funding.

Data Availability Statement

Data is contained within the present article or Supplementary Material.

Acknowledgments

RD acknowledges PON—Ricerca & Innovazione—2014-2020-FSE-REACT EU Action IV.6 for financial support.

Conflicts of Interest

The authors declare no conflict of interest.

References

  1. Arcaro, S.; Wermuth, T.B.; Zampiva, R.Y.S.; Venturini, J.; Ten Caten, C.S.; Bergmann, C.P.; Alves, A.K.; De Oliveira, A.P.N.; Moreno, R. Li2O-ZrO2-SiO2/Al2O3 Nanostructured Composites for Microelectronics Applications. J. Eur. Ceram. Soc. 2019, 39, 491–498. [Google Scholar] [CrossRef]
  2. Ayoub, B.; Lhostis, S.; Moreau, S.; Mattei, J.-G.; Mukhtarov, A.; Frémont, H. Investigation into Cu Diffusion at the Cu/SiO2 Hybrid Bonding Interface of 3D Stacked Integrated Circuits. Microelectron. Reliab. 2023, 143, 114934. [Google Scholar] [CrossRef]
  3. Raffaini, G.; Catauro, M. Surface Interactions between Ketoprofen and Silica-Based Biomaterials as Drug Delivery System Synthesized via Sol–Gel: A Molecular Dynamics Study. Materials 2022, 15, 2759. [Google Scholar] [CrossRef] [PubMed]
  4. Mehmood, Y.; Shahid, H.; Rashid, M.A.; Alhamhoom, Y.; Kazi, M. Developing of SiO2 Nanoshells Loaded with Fluticasone Propionate for Potential Nasal Drug Delivery: Determination of Pro-Inflammatory Cytokines through mRNA Expression. J. Funct. Biomater. 2022, 13, 229. [Google Scholar] [CrossRef]
  5. Collantes, C.; González Pedro, V.; Bañuls, M.-J.; Maquieira, Á. Monodispersed CsPb2 Br5 @SiO2 Core–Shell Nanoparticles as Luminescent Labels for Biosensing. ACS Appl. Nano Mater. 2021, 4, 2011–2018. [Google Scholar] [CrossRef]
  6. Selvaggi, R.; Tarpani, L.; Santuari, A.; Giovagnoli, S.; Latterini, L. Silica Nanoparticles Assisted Photodegradation of Acridine Orange in Aqueous Suspensions. Appl. Catal. B Environ. 2015, 168–169, 363–369. [Google Scholar] [CrossRef]
  7. Jadhav, S.A.; Garud, H.B.; Patil, A.H.; Patil, G.D.; Patil, C.R.; Dongale, T.D.; Patil, P.S. Recent Advancements in Silica Nanoparticles Based Technologies for Removal of Dyes from Water. Colloid Interface Sci. Commun. 2019, 30, 100181. [Google Scholar] [CrossRef]
  8. El-Shamy, A.G. Novel In-Situ Synthesis of Nano-Silica (SiO2) Embedded into Polyvinyl Alcohol for Dye Removal: Adsorption and Photo-Degradation under Visible Light. Polymer 2022, 242, 124579. [Google Scholar] [CrossRef]
  9. Quaglia, G.; Ambrogi, V.; Pietrella, D.; Nocchetti, M.; Latterini, L. Solid State Photoreduction of Silver on Mesoporous Silica to Enhance Antifungal Activity. Nanomaterials 2021, 11, 2340. [Google Scholar] [CrossRef]
  10. Romolini, G.; Gambucci, M.; Ricciarelli, D.; Tarpani, L.; Zampini, G.; Latterini, L. Photocatalytic Activity of Silica and Silica-Silver Nanocolloids Based on Photo-Induced Formation of Reactive Oxygen Species. Photochem. Photobiol. Sci. 2021, 20, 1161–1172. [Google Scholar] [CrossRef]
  11. Latterini, L.; Tarpani, L. Hierarchical Assembly of Nanostructures to Decouple Fluorescence and Photothermal Effect. J. Phys. Chem. C 2011, 115, 21098–21104. [Google Scholar] [CrossRef]
  12. Gubala, V.; Giovannini, G.; Kunc, F.; Monopoli, M.P.; Moore, C.J. Dye-Doped Silica Nanoparticles: Synthesis, Surface Chemistry and Bioapplications. Cancer Nanotechnol. 2020, 11, 1. [Google Scholar] [CrossRef]
  13. Yang, P.; Gai, S.; Lin, J. Functionalized mesoporous silica materials for controlled drug delivery. Chem. Soc. Rev. 2012, 41, 3679–3698. [Google Scholar] [CrossRef] [PubMed]
  14. Manzano, M.; Vallet-Regí, M. Mesoporous Silica Nanoparticles for Drug Delivery. Adv. Funct. Mater. 2020, 30, 1902634. [Google Scholar] [CrossRef]
  15. Tarpani, L.; Ruhlandt, D.; Latterini, L.; Haehnel, D.; Gregor, I.; Enderlein, J.; Chizhik, A.I. Photoactivation of Luminescent Centers in Single SiO2 Nanoparticles. Nano Lett. 2016, 16, 4312–4316. [Google Scholar] [CrossRef]
  16. Gogoi, S.H.; Banerjee, A. Datta, Photoluminescent Silica Nanostructures and Nanohybrids. ChemPhysChem 2022, 23, e202200280. [Google Scholar] [CrossRef]
  17. Glinka, Y.D.; Lin, S.-H.; Chen, Y.-T. Time-Resolved Photoluminescence Study of Silica Nanoparticles as Compared to Bulk Type-III Fused Silica. Phys. Rev. B 2002, 66, 035404. [Google Scholar] [CrossRef]
  18. Ogata, A.; Kazusaka, A.; Enyo, M. Photoactivation of Silica Gel with UV Light during the Reaction of Carbon Monoxide with Oxygen. J. Phys. Chem. 1986, 90, 5201–5205. [Google Scholar] [CrossRef]
  19. Yoshida, H.; Kimura, K.; Inaki, Y.; Hattori, T. Catalytic Activity of FSM-16 for Photometathesis of Propene. Chem. Commun. 1997, 1, 129–130. [Google Scholar] [CrossRef]
  20. Yoshida, H.; Tanaka, T.; Matsuo, S.; Funabiki, T.; Yoshida, S. Alkene Metathesis on Photoirradiated Silica Surface. J. Chem. Soc. Chem. Commun. 1995, 7, 761–762. [Google Scholar] [CrossRef]
  21. Inaki, Y.; Yoshida, H.; Kimura, K.; Inagaki, S.; Fukushima, Y.; Hattori, T. Photometathesis Activity and Thermal Stability of Two Types of Mesoporous Silica Materials, FSM-16 and MCM-41. Phys. Chem. Chem. Phys. 2000, 2, 5293–5297. [Google Scholar] [CrossRef]
  22. Inaki, Y.; Yoshida, H.; Yoshida, T.; Hattori, T. Active Sites on Mesoporous and Amorphous Silica Materials and Their Photocatalytic Activity:  An Investigation by FTIR, ESR, VUV−UV and Photoluminescence Spectroscopies. J. Phys. Chem. B 2002, 106, 9098–9106. [Google Scholar] [CrossRef]
  23. Spallino, L.; Vaccaro, L.; Agnello, S.; Cannas, M. Effects Induced by UV Laser Radiation on the Blue Luminescence of Silica Nanoparticles. J. Lumin. 2013, 138, 39–43. [Google Scholar] [CrossRef]
  24. Skuja, L. Optically Active Oxygen-Deficiency-Related Centers in Amorphous Silicon Dioxide. J. Non-Cryst. Solids 1998, 239, 16–48. [Google Scholar] [CrossRef]
  25. Rahman, I.A.; Vejayakumaran, P.; Sipaut, C.S.; Ismail, J.; Chee, C.K. Size-Dependent Physicochemical and Optical Properties of Silica Nanoparticles. Mater. Chem. Phys. 2009, 114, 328–332. [Google Scholar] [CrossRef]
  26. Bergamini, R.B.M.; Azevedo, E.B.; de Araújo, L.R.R. Heterogeneous Photocatalytic Degradation of Reactive Dyes in Aqueous TiO2 Suspensions: Decolorization Kinetics. Chem. Eng. J. 2009, 149, 215–220. [Google Scholar] [CrossRef]
  27. Flomenbom, O.; Velonia, K.; Loos, D.; Masuo, S.; Cotlet, M.; Engelborghs, Y.; Hofkens, J.; Rowan, A.E.; Nolte, R.J.M.; Van der Auweraer, M.; et al. Stretched Exponential Decay and Correlations in the Catalytic Activity of Fluctuating Single Lipase Molecules. Proc. Natl. Acad. Sci. USA 2005, 102, 2368–2372. [Google Scholar] [CrossRef]
  28. Sulpizi, M.; Gaigeot, M.-P.; Sprik, M. The Silica–Water Interface: How the Silanols Determine the Surface Acidity and Modulate the Water Properties. J. Chem. Theory Comput. 2012, 8, 1037–1047. [Google Scholar] [CrossRef]
  29. Wu, D.; Guo, X.; Sun, H.; Navrotsky, A. Energy Landscape of Water and Ethanol on Silica Surfaces. J. Phys. Chem. C 2015, 119, 15428–15433. [Google Scholar] [CrossRef]
  30. Morris, C.A.; Rolison, D.R.; Swider-Lyons, K.E.; Osburn-Atkinson, E.J.; Merzbacher, C.I. Modifying Nanoscale Silica with Itself: A Method to Control Surface Properties of Silica Aerogels Independently of Bulk Structure. J. Non-Cryst. Solids 2001, 285, 29–36. [Google Scholar] [CrossRef]
  31. Santra, S.; Zhang, P.; Wang, K.; Tapec, R.; Tan, W. Conjugation of Biomolecules with Luminophore-Doped Silica Nanoparticles for Photostable Biomarkers. Anal. Chem. 2001, 73, 4988–4993. [Google Scholar] [CrossRef]
  32. Brunauer, S.; Emmett, P.H.; Teller, E. Adsorption of Gases in Multimolecular Layers. J. Am. Chem. Soc. 1938, 60, 309–319. [Google Scholar] [CrossRef]
  33. Barrett, E.P.; Joyner, L.G.; Halenda, P.P. The Determination of Pore Volume and Area Distributions in Porous Substances. I. Computations from Nitrogen Isotherms. J. Am. Chem. Soc. 1951, 73, 373–380. [Google Scholar] [CrossRef]
Figure 1. TEM image of SNP (a), SNP–APTES (c), SNP–phosphonate (d) size distribution histogram obtained through the analysis of the TEM images of the SNP sample, together with the Gaussian fit (b).
Inorganics 11 00430 g001
Figure 2. Absorption spectra versus wavelength of SNP (black line), SNP-APTES (red line) and SNP–phosphonate (blue line).
Inorganics 11 00430 g002
Figure 3. Tauc plot of SNP (black squares), SNP–APTES (red triangles), and SNP–phosphonate (blue triangls) with the determination of their Eg shown, black, red and blue lines, respectively.
Inorganics 11 00430 g003
Figure 4. Emission spectra (λexc = 313 nm) of SNP (black), SNP–APTES (red), and SNP–phosphonate (blue). (Baseline Corrected).
Inorganics 11 00430 g004
Figure 5. Fluorescence spectra (λexc = 490 nm) of Rhodamine 6G in the presence of SNP in ethanol (a) and water (b) recorded before (black lines and circles) and after (red lines and symbols) 170 min of irradiation at 320 nm.
Inorganics 11 00430 g005
Figure 6. Normalized fluorescence intensity of R6G as function of the irradiation time in the presence of SNP52 (a), SNP52–APTES (b), and SNP52–phosphonate (c) in aqueous suspension.
Inorganics 11 00430 g006
Table 1. Surface area and Zeta potential values of silica nanoparticle.
CatalystSurface Area (m2/g)Z (mV)
in EtOH
Z (mV)
in H2O
SNP102.4−20 ± 5−37 ± 4
SNP-APTES72.9+5 ± 5−4 ± 3
SNP–phosphonate73.1−30 ± 5−56 ± 5
Table 2. Band gap values of silica nanoparticle.
MaterialBand Gap (eV)
SNP5.08
SNP–APTES5.05
SNP–phosphonate4.90
Table 3. Photodegradation efficiencies of SNP, SNP–APTES, and SNP–phosphonate catalysts for R6G under UV light irradiation for 170 min and the reactions half-time.
CatalystPhotodegradation Efficiency (R%)t1/2
(min)
SNP765.7
SNP–APTES43243
SNP–phosphonate133586
Table 4. Summary of defects owned by the three SNP, SNP–APTES, and SNP–phosphonate. Bullets indicates where the defect is found.
Defect TypeSNPSNP–APTESSNP–Phosphonate
≡Si–H
≡Si–Si≡
≡Si–O
O divacancy
O excess
Disclaimer/Publisher’s Note: The statements, opinions and data contained in all publications are solely those of the individual author(s) and contributor(s) and not of MDPI and/or the editor(s). MDPI and/or the editor(s) disclaim responsibility for any injury to people or property resulting from any ideas, methods, instructions or products referred to in the content.

