Article

Revealing the Minimum Energy Pathways for Formamide Hydrogenation Reactions in the Presence of Platinum and Platinum–Vanadium Clusters: A Quantum Chemical DFT/Nudged Elastic Band Study

by
Natalia S. Panina
1,*,†,
Ilya N. Klyukin
2,†,
Tatyana M. Buslaeva
3,† and
Andrei I. Fischer
1,†
1
St. Petersburg State Institute of Technology, Technical University, 26 Moskovsky pr., 190013 St. Petersburg, Russia
2
Kurnakov Institute of General and Inorganic Chemistry, Russian Academy of Sciences, 31 Leninskii pr., 117907 Moscow, Russia
3
Lomonosov Institute of Fine Chemical Technologies, MIREA-Russian Technological University, 86 Vernadsky Ave., 119454 Moscow, Russia
*
Author to whom correspondence should be addressed.
These authors contributed equally to this work.
Inorganics 2023, 11(10), 384; https://doi.org/10.3390/inorganics11100384
Submission received: 31 August 2023 / Revised: 15 September 2023 / Accepted: 19 September 2023 / Published: 25 September 2023

Abstract

:
A detailed study on the stages of catalytic reactions involving platinum and platinum-vanadium clusters has been carried out. Minimum energy pathways (MEP) of reactions have been constructed via the DFT/PBE0/def2tzvp method using NEB functional and optimized structures, and points of minima and transition states have been calculated. A two-step process for the conversion of formamide to methylamine under the action of H2 has been considered as a test reaction. The energy barriers of this reaction, not previously described in the literature, have been evaluated. It has been shown that the main changes in the structural characteristics of the reagents, as well as the migration of single H atoms from one metal center of clusters to another or to an organic substrate, are initiated at the molecular level by shifts corresponding to the vectors of normal vibrations of systems in transition states.

Graphical Abstract

1. Introduction

In the last decade, due to the development of modern computational methods and the emergence of powerful software packages, more and more theoretical works devoted to the study of chemical reaction mechanisms have appeared [1,2,3,4]. Theoretical calculations enable information to be obtained about key intermediates and transition states in a clear and simple way [5,6,7,8]. Particular attention is paid in molecular modelling to processes used in chemical technology [9,10,11,12,13]. In particular, there has been activity relating to processes involving molecular hydrogen, such as hydrogenation, dehydrogenation, reforming and hydrodeoxygenation [14,15,16,17,18]. In these processes, mono- and bimetallic catalysts based on d-element metals, including platinum (Pt) and platinum-vanadium (Pt/V) catalysts, have been widely used [19,20,21,22,23]. The mechanism of the interaction of hydrogen molecules with the metal surface (or individual metal clusters) has been investigated in a number of studies [24,25,26,27,28]. Usually, this process involves dissociative adsorption of H2 with the cleavage of H–H bonds and the formation of M–H bonds [29,30,31,32,33].
The present work is a continuation of the authors’ earlier quantum chemical study on the catalytic activation of H2 molecules by Pd4 clusters [34] and its extension to mono- and bimetallic Pt and Pt/V hydrogenation catalysts [35]. Using the model systems Pt4 and Pt3V as examples, the minimum energy pathways of reactions (MEP) were constructed via DFT/PBE0/def2tzvp using the NEB (Nudged Elastic Band) functional, confirming the ability of these catalysts to accumulate hydrogen on these metal centers, almost barrier-free [35].
The aim of this work is to identify the peculiarities of the catalytic processes of hydrogenation of organic substrates with the participation of platinum (Pt) and platinum-vanadium (Pt/V) clusters, and to carry out a comparative evaluation of the activation barriers arising in this process, as well as to ascertain the structures of key intermediates. The search for transition states in catalytic processes is a challenging task. Conclusions about the chemical reaction pathway are often based on analogies with other chemical processes or on some intuitive assumptions. The advantage of using the NEB optimization method in quantum chemical calculations is that it can be used to predict reaction pathways based only on the structures of the reagents and products. Therefore, a decision was made to apply this method to hydrogenation processes of some substrates using mono- and bimetallic catalysts, where very little is known about the reaction pathway and, even, about the progression of the reagents towards one another.
An additional goal of this paper is to discuss, in detail, some of the problems arising in the construction of complex MEPs when using the NEB method [36]. This method currently represents a promising trend in computational quantum chemistry and makes it possible to localize intermediate and transition states on a complex potential energy surface [37,38,39]. The authors have previously successfully applied this relatively new method in [35,40]. Nevertheless, in order to use the method for the comparative evaluation of other catalytic systems and to verify the correctness of the results obtained, it was necessary to choose, as a test, a simple chemical process with an already studied reaction mechanism including hydrogenation steps. The transformation of amides into amines under the action of hydrogen, previously described in [41], was chosen as such a process. The direct reduction of amides to amines is a convenient way to obtain organic systems with a wide range of useful properties [42,43,44,45]. The mechanism of this process proceeding on a Pt/V catalyst was considered in [41], using the example of the simplest formamide and methylamine:
H C O N H 2 + 2 H 2 C H 3 N H 2 + H 2 O
The metal centers of such a catalyst with accumulating H2 molecules were modelled in [41], using the surface of platinum nanoparticles with a diameter of ~2 nm decorated with vanadium centers—VO33− anions. The difference between the current work and [41] is that mono- and bimetallic catalysts are presented in the form of fragments of crystal phases Pt0 and Pt0/V0. Such a catalyst, based on the solid solution of Pt03V0, is formed under autoclave conditions and is available to the authors of [35,46] in quantities that are sufficient to enable its catalytic activity in the hydrogenation/dehydrogenation reaction to be studied.

2. Results and Discussion

In [34], a quantum chemical study of the Pd4 system led to the conclusion that the metal cluster vertices become centers in the elementary act of the catalytic reaction. In the present work, formamide hydrogenation was modelled using Pt4 and Pt3V particles. According to [47,48,49] (ICSD database numbers 180976, 180978, 105840, 105841), the tetrahedral structures of Pt4 and Pt3V belong to the simplest fragments of platinum and platinum-vanadium catalysts. Note that the distance between the metal atoms in these fragments did not exceed 2.8 Å. The planar structure of Pt3V fragments was also given in [48] (in the ICSD database, number 649828). It represents a rhombus in which one diagonal between Pt and V atoms has a length of 2.7 Å, while the other diagonal between two Pt atoms has a length of 4.8 Å.
The results of geometry optimization of model structures of tetrahedral clusters of Pt4 and Pt3V in several spin states presented in [35] enabled the authors to choose clusters with minimum energy values (Eel + ZPE) and to restrict consideration to triplet reaction channels involving Pt4 and quartet channels involving Pt3V. The average value of the interatomic distance in the optimized triplet Pt4 cluster was 2.59 Å, which is very close to the distance obtained in the DFT calculation [27], which was 2.58 Å.
For Pt4 and Pt3V, in addition to tetrahedral fragments, the simplest planar structures were also considered. The optimized triplet planar structure with slightly non-equivalent bonds (approximate symmetry D4h) for the Pt4 cluster was 62 kJ/mol, which is less stable than the tetrahedral structure, and it was not considered further. In the case of the Pt3V cluster in the quartet state, the transition of the distorted tetrahedral structure to a planar structure required only 16 kJ/mol, so the planar structures were also considered in the study of reaction pathways.

2.1. Modelling of the Formamide Hydrogenation Reaction in the Absence of a Catalyst

According to the mechanism of the process of formamide hydrogenation to form methylamine described in [41], reaction (1) proceeds in two stages. In stage I, the H atoms of the first molecule, H2, are attached to the O and C atoms of formamide HCONH2 to form the intermediate compound H─O─CH2─NH2 with a single C─O bond. In stage II, the hydrogen atoms of the second molecule H2 are attached to the O and C atoms of this compound, resulting in the formation of the reaction products (1): molecules H2O and CH3NH2.
The MEP curves of stages I and II of reaction (1) and their corresponding structures are shown in Figure 1.
Here and subsequently, all MEP curves of reaction stages presented in the figures are constructed using the NEB method, and each point of these curves corresponds to a certain Eel value. In the present work, the energies of minima and transition states on the MEP curves were refined using a standard geometry optimization scheme taking into account the zero-point energy (ZPE), so they may sometimes differ slightly from the energy values presented in figures (see Section 3. Calculation details). At the same time, for a better understanding of the magnitudes of the energy barriers counted from the reagents or corresponding minima, their values are given in units of free energy change ΔG0, taking into account entropic contributions. The free energy G0 values, calculated at 298.15 K, as well as the values of Eel + ZPE and the coordinates of all compounds considered in this work, are given in Tables S1–S4 of the Supplementary Materials.
At the first stage of reagent optimization, an electrostatic complex {H2 + HCONH2}, denoted here as reagent I, was formed between one hydrogen molecule and the substrate. Let us consider the changes in the structures describing the conversion of formamide to methylamine. For better visualization, in the transition states (TS) shown in Figure 1 (and below), the red arrows show only the largest displacements of atoms involved in normal vibrations with imaginary frequencies that cause changes in the structure. The experimental value of the H–H bond energy in the H2 molecule is 436 kJ/mol [50]. The calculated value of the energy required to break the H–H bond in the H2 molecule, in the current study, was 475 kJ/mol. The formation of new bonds, H–O and H–C, as the reagents move closer together should lead to a decrease in the H–H bond energy. In the TS1 transition state, the change in the H─H bond length occurred along the normal vibration vector with the frequency υ = 2267i cm−1. The value of the energy barrier ∆G0 for TS1 at stage I of reaction (1) was 289 kJ/mol, which is less than the bond-breaking energy of an isolated hydrogen molecule. Judging by the interatomic distances obtained in the TS1 structure, in addition to the H–H bond breaking, the weakening of the C=O double bond to a single bond contributed to this rather large activation barrier.
At stage II of the reaction, another molecule, H2, was attached to the intermediate compound H–O–CH2NH2, obtained at stage I, where the bond-breaking of H─H occurred in TS2 along the vector of normal vibration with frequency υ = 542i cm−1. At the same time, one H atom approached the O atom, and the other H atom approached the C atom. The large value of the activation energy ∆G0 = 292 kJ/mol in TS2 was also due not only to the breaking of the H–H bond, but also to the final breaking of the C–O bond, which led to the formation of reaction products—molecules H2O and CH3NH2—united by hydrogen bonding.

2.2. Modelling of the Formamide Hydrogenation Reaction in the Presence of Pt4 Clusters

The reaction of the conversion of formamide into methylamine under the action of hydrogen with the participation of Pt4 clusters can be formally described by the following equation:
( P t 4 ) + 2 H 2 + H C O N H 2 ( P t 4 ) + H 2 O + C H 3 N H 2
The model cluster Pt4 is weakly polarized due to the asymmetry of the common cloud of 5d-electrons in its most stable triplet state. The calculated values of the charges on each pair of metal atoms are ±0.039e (Mulliken) and ±0.033e (Hirschfeld). The values of the charges on the formamide atoms are q(O) = −0.35e, q(N) = −0.41e, q(C) = 0.21e (Mulliken); q(O) = −0.29e, q(N) = −0.14e and q(C) = 0.14e (Hirschfeld). Thus, this simplest amide can form stable structures by attaching almost any of its atoms, including H atoms, to the corresponding metal center. However, optimization of the geometry of the Pt4 cluster, surrounded by several formamide molecules initially located at a relatively large distance from the cluster (~8 Å), showed that the formamide molecules were barrier-free and coordinated by oxygen.
Moreover, keeping in mind not only formamide, chosen as the molecule under study, but also other practically important complex amides with extensive alkyl or other groups, the C and N atoms may be met by significant steric hindrances to forming bonds with the cluster. In the present study, calculations of an amide with –CH3 groups have shown that, in this case, the bonding to the metal occurs only via the oxygen atom. Therefore, in the present work, it was this reaction channel that was considered for the addition of formamide to model clusters.
The process considered for the addition of one molecule of formamide to the model cluster Pt4 led to the formation of a stable structure Pt3Pt(10)–OC(H)NH2 with the Pt–O bond and was accompanied by the release of ΔG0 of the order of 31 kJ/mol. Here, and subsequently in this paper, for convenience, complex structures are formally represented by a sequence of bonded atoms, where the lower index without parentheses corresponds to the number of identical metal atoms and with parentheses, it corresponds to the atom number indicated in the corresponding figures.
The addition of the first H2 molecule to the Pt4 complex led to the barrier-free formation of the {Pt3Pt(3)(H)2} structure, in which the bonding between hydrogen atoms on the cluster was no longer present. This process was accompanied by a ΔG0 energy release of the order of 119 kJ/mol. It is possible that the two exothermic processes mentioned above—the addition of formamide and the H2 molecule to the Pt4 cluster—change places in the sequence or occur simultaneously.
The ability of Pt4 clusters to enable the barrierless accumulation of H2 molecules during homolytic cleavage of the H–H bond is explained at the level of the MO method. In the optimized system {Pt4 + H2}, there are two occupied MOs that are very close in energy, and which consist of the σ-bonding MO of H2 and the MO with the largest contribution of Pt 5d-AO. Their energetic proximity creates a condition for the formation of separate hybrid MOs corresponding to the formation of two Pt–H bonds on one metal center with separated H atoms and rather short lengths (about 1.5 Å) [35]. As a rule, the most significant changes in the energy of the system correspond to the weakening or breaking of some chemical bonds and the formation of new, stronger ones. On each reaction pathway, activation barriers corresponding to these processes always exist. The MEP curve connecting reagents and products in the NEB calculations often contains several points corresponding to stable structures that are following one after another (min) and to transition states (TS). In this case, the reaction rate along the pathway for each individual MEP is determined by its highest activation barrier TS, counted from the energy of the most stable structure preceding it. For the subsequent comparative analysis of the catalytic ability of the clusters under consideration, it is necessary, based on the data for all obtained MEPs, to select the catalytic system for which the above-mentioned highest TS barriers have the lowest activation energies.
Note that the structures of minima and TS presented in the figures reflect changes not only in the bond lengths of molecules interacting on the cluster surface, but also in the distances between the metal atoms of the clusters, which sometimes lead to significant distortions in their simplest three-dimensional polyhedral structure.
In Figure 2, MEP(a), an electrostatic complex {H2 + Pt3Pt(10)–O–CHNH2} formed by the first H2 molecule with a formamide molecule on the Pt4 cluster is considered as the reagent (a). As the H2 approaches, its dissociative adsorption occurs with a significant decrease in free energy during the formation of the bound system {Pt2Pt(8)(H)2Pt(10)–O–CHNH2}: ΔG0 = −156 kJ/mol. On the MEP(a) curve, this corresponds to the deepest minimum in the formation of the min1(a) structure, which will be the reference point for estimating the energy barriers of formamide hydrogenation at stage I.
The section from the deep min1(a) to the min5(a) points of the MEP(a) curve describes the migration of both H atoms towards the Pt(10) atom, with which the formamide molecule is coordinated. The low-frequency barrier TS1= 90i cm−1) with ΔG0 values of 56 kJ/mol corresponds to conformation transformations leading to an increase in the valence angle H(11)–Pt(8)–H(12) from 760 in min1(a) to 940 in min2(a). Further, at the activation barriers in TS2 to TS4 with values ΔG0 of 62, 70 and 71 kJ/mol, respectively, migration of H atoms along vectors of normal vibrations with imaginary frequencies occurs. The formation of bridging groups of the Pt–H–Pt type is one of the most important steps in the migration of single H atoms along the active centers of metal atoms. At vibration displacements corresponding to the normal vibrations of the system at the saddle point, the overlap region of hydrogen AOs with the orbitals of some metal centers decreases and increases with the orbitals of others. In this process, stronger bonds are formed. As a result of this migration, similar to the hydrogen spillover phenomenon described at the molecular interaction level, both H atoms with relatively small barriers gradually reach the Pt(10) atom bound directly to the substrate molecule (see structure min5(a)).
In the MEP(a) curve, TS4 is followed by the transition state TS5 (υ = 295i cm−1) with a large barrier ΔG0 of 191 kJ/mol, corresponding to the breaking of the bond of the H(11) atom with the Pt(10) atom and its transfer to the substrate to form the group –CH2. In this transition state, in addition to the Pt(10)–H(11) bond, the weak Pt(10)–C bond formed in TS5 at a distance of about 2.3–2.4 Å is also broken.
In the last part of the MEP(a) curve, the TS6(a) transition state (υ = 1156i cm−1) with an even larger barrier (ΔG0 = 228 kJ/mol) is found, which at first slightly corresponds to the breaking of the Pt(10)–H(12) bond and the transition of the hydrogen atom to oxygen with the formation of the –O–H group. Increasing the number of images on the MEP(a) curve made it possible to establish that the TS6(a) barrier corresponds not simply to the detachment of the H(12) atom from Pt(10), but to the initial formation of the Pt(10)–H(12)–O– bond, followed by the breaking of the Pt(10)–H(12) bond and the formation of the –OH group. The latter effects were established through point-by-point examination of images from multiple xyz files (see images TS6_1(a) to TS6_4(a) in Figure 2).
Stage II of the formamide hydrogenation process (interaction of the product(a), {Pt3Pt(10)–O(H)–CH2NH2}, with the second H2 molecule) is described by two different curves: a preliminary MEP(b), obtained via the standard NEB calculation, and the total MEP(c), also constructed via the NEB method, but constructed from four sections (shown in different colors) with refinement of the energies at the points of minima and transition states. These MEPs are shown together in Figure 3 as an illustration of the difficulties in correctly describing the energy barriers for some complex cases when using the NEB approach to calculate only a single MEP curve. The point is that the NEB method does not always work well when there are many minima on the MEP curve.
On the previously obtained MEP(b) curve, several points of minima were located below the level of the first minimum in energy. Therefore, it was not clear which energy was the reference point for the estimation of activation barriers. In the unlicensed ORCA-5.0.1 software package [51] that implements the NEB method, a warning is issued during the MEP calculation when an intermediate minimum has been found. If this minimum proves to be lower than the energy level of reagents or previous structures, it is recommended to split the previously obtained MEP curve into several sections, refining, in each of them, the position of the minimum points and the values of energies at these points using the standard optimization method. When the curves of individual sections are stitched together, a general MEP curve is obtained.
In Figure 3, the optimized electrostatic complex {H2 + Pt3Pt(10)–O(H)CH2NH2} formed by the second molecule H2 with the product (a) of stage I is considered as the reagent (c) within the MEP site highlighted in black. The barrierless dissociative adsorption of the H2 molecule on the Pt atom of the above product is accompanied by a large exothermic effect ΔG0 of the order of 151 kJ/mol, with the formation of a stable min1(c) structure. The counting of TS energies belonging to the sections of the MEP curve of stage II starts from its deep minimum.
The transition state TS1(c) (υ = 228i cm−1) with a ΔG0 barrier of 82 kJ/mol is due to the C─O bond breaking and the formation of a min2(c) structure with H–O–Pt(10)–CH2NH2 bonds at the coordination of two substrate fragments on one platinum center. Furthermore, in the red and green sections of the MEP(c) curves in TS2(c) (υ = 174i cm−1), the Pt(10)─CH2NH2 bond is broken with a barrier ΔG0 of 62 kJ/mol, and a Pt(9)–H(14)–CH2NH2 bridge is formed in min3(c). Then, in TS3(c) (υ = 121i cm−1), the Pt(9)–H(14) bond breaks with a barrier of ΔG0 63 kJ/mol to form free methylamine.
The process of methylamine production described by reaction (2), however, does not stop here, because the molecule H2O has not yet been formed. Moreover, at the boundary of the regions highlighted in green and turquoise, there is a min4(c) point that has the lowest energy value, which corresponds to the attachment of methylamine to the Pt(7) atom of the cluster by a strong bond, Pt–NH2CH3, and the formation of a bridging bond, Pt(9)–H(13)–Pt(10). Furthermore, it is the stability of the min4(c) structure that will determine the large barriers of the subsequent TS and the activation energy Ea of stage II of the reaction (2) as a whole. The resulting visualization of the transformation of the TS3(c) molecular structure to min4(c), using ChemCraft software, also appears inconclusive. Therefore, as in the case of the last structure of TS6(a) stage I hydrogenation on the Pt4 cluster, it was necessary to perform a point-by-point examination of images from several xyz files (see images min4_a(c) and min4_b(c) in Figure 2). In TS3(c), the formation of a bridging group, Pt(9)─H(13)─Pt(10), and Pt(9)─H(14) bond breaking were observed. The liberated methylamine in TS3(c) performed rotational displacements, orientating the N atom with a negative charge of about −0.5e towards the nearest Pt(7) atom with a small positive charge of 0.1e. In the min4_a(c) structure, the distance between these atoms was 3.308 Å, in min4_b(c), it decreased to 2.518 Å and at a distance of 2.110, the Pt(7)–NH2CH3 bond stabilized in the min4(c) structure corresponding to the deepest minimum on the MEP(c) curve. The transformations described can be seen by watching the video Pt4.avi in slow motion.
The last section of MEP(c) stage II is shown in Figure 3 in a turquoise color. The TS4(c) barrier (υ = 1035i cm−1), counting from the indicated min4(c) structure, had a ∆G0 value of ~102 kJ/mol. This corresponded to the bond-breaking of the aforementioned bridging group Pt(9)–H(13)–Pt(10) and the transition of the H(13) atom onto the O atom to form a coordinated H2O molecule in min5(c). The largest TS on the MEP(c) curve, however, was the TS5(c) barrier (υ = 170i cm−1) with a ∆G0 value of 132 kJ/mol. This was due to the breaking of the strong Pt(7)–N bond and the withdrawal of the nucleophilic center, –NH2, of the resulting methylamine molecule from the cluster atom Pt(7). As a consequence, the new Pt–N bond of methylamine was not formed with any other Pt atom, but was held close to the platinum cluster structure by the H-bond of Pt(7)–(OH2)∙∙∙∙NH2CH3.
Therefore, in stage I of the formamide hydrogenation reaction, the most significant activation barrier occurred in TS6(a) with ∆G0 = 228 kJ/mol, which was due to the complete detachment of the H atom from the Pt atom and its transition to the O atom of formamide. In stage II, the highest activation energy in TS5, estimated at ∆G0 = 132 kJ/mol, was due to the breaking of the strong Pt–N bond formed during the reaction. Both of these barriers were smaller than the activation barriers in this reaction, arising from the H─H bond breaking without a catalyst (289 and 292 kJ/mol).

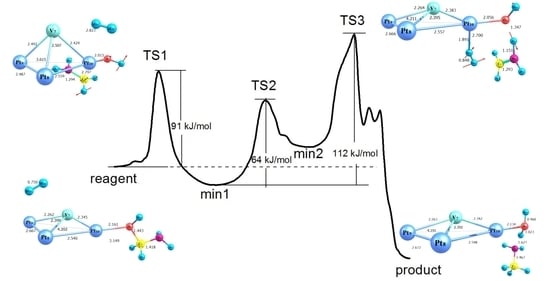
2.3. Modelling of the Formamide Hydrogenation Reaction in the Presence of Pt3V Clusters

Modelling of the reaction of formamide conversion to methylamine under the action of hydrogen with the participation of Pt3V clusters is performed as follows:
( P t 3 V ) + 2 H 2 + H C O N H 2 ( P t 3 V ) + H 2 O + C H 3 N H 2
This also begins with the attachment of the HCONH2 molecule to one of the atoms of this cluster. Formamide can be attached either to a vanadium atom (reaction 3a) or to a platinum atom (reaction 3b) of the Pt3V cluster. Let us consider both variants.
In the reaction 3a the formamide molecule attaches to the V atom of the Pt3V cluster without a barrier, with the release of energy ∆G0 of 65 kJ/mol. The total MEP curves of the hydrogenation reaction (3a) with refined structures are shown in Figure 4 and Figure 5.
In the MEP(a) curve of Figure 4, the reagent (a), as in the case of reaction (2) involving the Pt4 cluster, is the electrostatic complex {H2 + Pt3V(10)─O─CHNH2}. As the H2 molecule approaches the Pt3V(10)─O─CHNH2 cluster, dissociative adsorption of hydrogen on Pt(7) also occurs with a large energy decrease (∆G0 = −176 kJ/mol) in the course of formation of the compound {Pt2Pt(7)(H)2V(10)─O─CHNH2}. In min1(a), the Pt─Pt and Pt─V distances are in the range of 2.5–2.7 Å, i.e., the initial state of the metal cluster can be defined as a weakly distorted tetrahedron. In the region from min1(a) to min3(a), the MEP(a) curve mainly describes the migration of H atoms along the metal centers of the clusters—the spillover zone of H. Compared with min1(a), the structure of TS1(a) is strongly distorted: the distances between V and Pt(8) atoms decreased from about 2.5 to 2.4 Å, and between Pt(7) and Pt(9), they increased to 3.9 Å. Thus, the distorted Pt3V tetrahedron becomes noticeably flatter when one of the edges, say in its base, is lengthened. In Section 2, in the case of the Pt4 cluster, the energy difference between the tetrahedral and planar structures was ~62 kJ/mol, whereas for Pt3V, the transition of the tetrahedral structure to a planar structure required only 16 kJ/mol. The system stabilized in min2(a), due to the formation of the bridging group Pt(7)─H(11)─Pt(8), and the metallic framework V─Pt(7)─Pt(8)─Pt(9) in this structure became nearly planar as the diagonal distance Pt(7)─Pt(9) increased to about 4.1 Å.
One of the high activation barriers in TS3(a) (υ = 87i cm−1) with ΔG0 116 kJ/mol corresponds to the low-frequency molecular vibrations, which can be classified as slow anharmonic molecular vibrations occurring in the spectral area below 100 cm−1. This vibration shift results in the Pt(7)─H(11) and V─C bonds breaking with the forming of a ─CH2 group in the fragment substrate. The highest activation barrier in TS4(a) with ΔG0 163 kJ/mol corresponds to the high-frequency vibrational shift along the normal vibration with frequency υ = 966i cm−1, which leads to Pt(7)─H(12) bond breaks with the formation of a ─OH group. These processes lead to the formation of the structure {Pt3V─O(H)CH2NH2}, the product (a) of hydrogenation of formamide by the first H2 molecule, in which the substrate is attached to a planar Pt3V cluster.
Stage II of formamide hydrogenation in reaction (3) is described by the MEP(b) curve and its corresponding structures, shown in Figure 5.
When approaching the second molecule H2 to the product (a) {Pt3V─O(H)CH2NH2} of stage I hydrogenation (Figure 4), optimization of the geometry of the planar bimetallic cluster again led to a distorted tetrahedral structure. In stage II (Figure 5), the electrostatic complex {H2 + Pt2Pt(7)(H)2V─O(H)CH2NH2} is considered to be reagent (b). The sharp decrease of ΔG0 energy by about 170 kJ/mol in the MEP curve (b) in min1(b) was due, as in the previous cases, to the dissociative adsorption of hydrogen on the platinum center.
In TS1(b) with the barrier ΔG0 45 kJ/mol, a vibration shift corresponding to a normal vibration with frequency υ = 131i cm−1 leads to the breaking of the O─C bond and the formation of the V–N bond in min2(b). In TS2(b) (υ = 72i cm−1), complex low-frequency conformational transformations result in the transfer of the H(13) atom from Pt(7) to the ─CH2 group, and a stable –CH3 group is formed in min3(b). Therefore, the deepest minimum at MEP(b) corresponds to the min3(b) structure. It is this minimum that determines the height of the subsequent barrier. Further, in TS3(b) (υ = 60i cm−1), a similar complex low-frequency conformational transformation initiates the transition of the H(14) atom from Pt(7) to the ─NH2 groups. Such transformation leads to the breaking of the V─N bond and transfer of the “extra” H(14) atom in the amide group to the –OH(12) group.
This process completed the formation of a vanadium-coordinated H2O molecule with a hydrogen bond to the N atom of methylamine in product (b) {Pt3V–(OH2)∙∙∙NH2CH3}. The MEP(b) curve in TS3(b) had the highest barrier with ΔG0 = 209 kJ/mol. However, its value is determined not only by the breaking of the aforementioned bonds, but also by the energy of the deepest minimum for the min3(b) structure.
Therefore, upon the addition of the substrate to the vanadium atom of the Pt3V cluster in stage I of formamide hydrogenation, the highest activation barrier in TS4(a)G0 = 163 kJ/mol) was associated with the detachment of the H atom from the Pt atom. This large value was due to the starting point at MEP(a) being the deep minimum of the reagent (a). In stage II of the hydrogenation reaction, the activation energy in TS3(b) was about 209 kJ/mol. This was also due to the previous deep energy minimum of the structure with the V─N bond.
In the reaction 3b, the formamide molecule is bound to the Pt atom of the Pt3V cluster. As in the previous cases, the process of substrate addition to the Pt is barrier-free, and the calculated energy release ΔG0 is about 26 kJ/mol, which is close to the exo-effect of the interaction of formamide with the Pt4 cluster (see Section 2.2). The total MEP curves of the hydrogenation reaction 3b, with refined structures and energies at the corresponding points of minima and TSs, are shown in Figure 6 and Figure 7.
The electrostatic complex {H2 + VPt2Pt(10)–OC(H)NH2} is considered as the reagent (a) in the MEP(a) section of the stage I curve of the formamide hydrogenation reaction. As the H2 molecule approaches the bimetallic cluster, its barrier-free molecular adsorption by the V atom occurs, and the formation of the distorted tetrahedral structure min1(a) of the bimetallic cluster {V(H)2Pt2Pt(10)–OC(H)NH2} occurs. In this case, the energy ΔG0 decrease is only 18 kJ/mol. At the same time, when H2 was adsorbed by the Pt atoms, the estimated exo-effect was much larger (see Section 2.2 and Section 2.3). The point is that, when coordinated by a V atom in the {Pt3V + H2}, the σ-binding MO of H2 is energetically too far from the MOs consisting of V 3d-AO or their combination with Pt 5d-AO. Therefore, these MOs cannot mix with each other when the reagents get closer in order to form separate hybrid MOs describing two V–H bonds on the same V atom without H─H binding, as was possible in the Pt3Pt(H)2 cluster [35]. Thus, molecular adsorption of H2 with preservation of the H–H bond and formation of weak V–H bonds of about 2.0 Å in length occurs on vanadium centers with a much smaller exo-effect than in the case of dissociative adsorption of hydrogen on platinum centers.
In the flattened version, the min2(a) structure of the bimetallic cluster V(H)2Pt2Pt(10)–OC(H)NH2 is about 12 kJ/mol more stable than the distorted tetrahedral min1(a). The activation barrier in TS1(a), located between min1(a) and min2(a), is also small, with a ΔG0 of about 13 kJ/mol.
Further, in TS2(a) (υ = 285i cm−1), with a barrier ΔG0 of 29 kJ/mol, the H(11)–H(12) bond in the H2 molecule adsorbed by vanadium is broken and the H(12) atom is transferred to the Pt(10) center. When the bond lengths of V–H(11), Pt(10)–H(12) and, importantly, the bond length of Pt(9)–Pt(10) are reduced by more than 1.1 Å, a min3(a) structure is formed in which the metal framework reverts to a distorted tetrahedral configuration with a short and strong Pt(10)–H(12) bond. In the MEP(a) curve, the min3(a) structure corresponds to the deepest minimum.
Then, the TS3(a) barrier (υ = 135i cm−1) appears on the MEP(a) curve, the value ΔG0 of which, counted from the energy of the min3(a) structure, is 126 kJ/mol. This energy is required in order to break the Pt(10)–H(12) bond (and the Pt(10)–C bond formed in TS3), but is partially compensated for by the formation of the H(12)─C bond in the min4(a) structure. Under the action of the displacement corresponding to the normal vibration with frequency υ = 591i cm−1 in TS4(a), there is a migration of the H(11) atom from vanadium to the Pt(10) atom, with the formation of structure min5(a). The TS4(a) barrier is 121 kJ/mol. This value is too high for the usual migration of H atoms over the considered metal centers. However, in this situation, it is explained by the depth of min3(a), from which the subsequent TS barriers are counted.
In the final stage I, hydrogenation of formamide, the largest TS5(a) barrier of 148 kJ/mol, occurs in the MEP(a) curve, caused by the breaking of the Pt(10)─H(11) bonds. The transfer of H(11) to the O atom of the substrate fragment practically completes the formation of the product of stage I hydrogenation of formamide.
Stage II of the process of interaction of the product (a) with the second H2 molecule is described by the complete MEP(b) curve, which is made up of nine sections; the corresponding structures are shown in Figure 7.
The electrostatic complex {H2 + {VPt2Pt(10)–O(H)CH2NH2} is considered as reagent (b) of the reaction 3b. The energy decrease ΔG0 in the formation of the min1(b) structure is one of only 15 kJ/mol, which is due, as in stage I, to the barrier-free molecular adsorption of the hydrogen molecule by the V atom. In the region from TS2(b) to TS4(b), the MEP(b) curve mainly describes the migration of H atoms along the metal centers of the clusters—the spillover zone of H. In TS2(b), there is a transition of the H(14) atom to Pt(10), with the formation of a much stronger Pt–H bond than with the V–H bond. The stabilization of the min3(b) structure is, however, small, since most of the activation energy is spent on breaking the molecular bond H(13)–H(14).
The most significant stabilization of the system occurs in the min5(b) structure, when the transition of the second, already single, H(13) atom from the V atom to Pt(8) takes place. On the MEP(b) curve, the min5(b) structure corresponds to the deepest minimum, which will determine the relative heights of the subsequent TS5(b) to TS8(b) barriers of reaction 3b. The most significant of these are TS5(b) and TS8(b), which are 131 and 129 kJ/mol and are due to the breaking of C–O and Pt(10)–H(13), respectively.
Therefore, for both stages of the process of formamide hydrogenation to methylamine in the case of catalytic reaction 3b (the substrate is coordinated to the platinum center of the Pt3V cluster and H2 molecules are attached to the vanadium atom), the lowest activation barriers ΔG0 among all model reactions considered here were obtained (Table 1). In all these reactions, methylamine was the final product of hydrogenation, forming a hydrogen bond with the H2O molecule coordinated on the metal atom of the cluster: {Pt3Pt–O(H)–H∙∙∙NH2CH3}, {VPt2Pt–O(H)–H∙∙∙NH2CH3} and {Pt3V–O(H)–H∙∙∙ NH2CH3}. The estimated energies ΔG0 of formation of such bonds were 20, 21 and 36 kJ/mol, respectively.

3. Details of Calculations

The study of catalytic systems with the description of structures corresponding to the most important MEP points (minima and TS) and estimation of the TS energy barriers of individual reaction steps was carried out via the DFT/PBE0/def2tzvp method [51], using the NEB function [36,52,53] implemented in the ORCA software package [54,55,56]. The family of Def2 basis sets for platinum includes effective core potentials constructed with scalar-relativistic corrections [57]. This makes it possible to avoid the use of all-electron basis sets and relativistic Hamiltonians. The def2tzvp basis is widely used at present and is a Gaussian basis of medium quality. It is suitable for determining ground state geometries of a wide range of compounds, including transition metal compounds, and its use in combination with DFT methods represents a reasonable compromise between the costs of machine time and the quality of the results obtained. A thorough analysis of DFT methods for optimizing the geometry of platinum compounds was carried out in [58]. The authors concluded that, for such compounds, the most efficient DFT method is PBE0/def2tzvp.
The MEP curve connecting reagents and products was obtained through interpolation of a set of energies of a discrete number of intermediate structures (images), and the geometry of each image was minimized under certain conditions. The number of images is specified in the input data. The more images that are selected, the more accurate the MEP interpolation curve will be, but the longer the calculations will take. The results of calculations are formed as a discrete set of optimal values of image energies, from which an MEP curve is constructed using re-parametrization and interpolation, which should be further processed using available graphical software.
All main points of the MEP curves (minima and TS) obtained via the NEB method are further refined using one of the standard optimization schemes [59]. To identify the highest activation barriers that determine the reaction rate, all values of TS maxima are evaluated not relative to one another, but relative to stable structures formed on the reaction path with the deepest minima. Activation barriers are calculated from free energy changes ΔG0 at saddle points relative to these minima. The values ΔG0 include the change in entropic contribution TΔS, calculated in this work for 298.15 K, and a pressure of 1.00 atm. The points of the MEP curves obtained via the NEB method, however, include only the electronic energy Eel and do not include the ZPE correction and the entropic component. Therefore, the relative values of the barriers obtained from the MEP profile and from the calculation of ΔG0 may differ.
All calculations were performed for the gas phase case. Molecular structures and normal vibrations were visualized using the ChemCraft program [60].

4. Conclusions

To reveal the peculiarities of reactions of formamide hydrogenation to methylamine under the action of metal clusters Pt4 and Pt3V using NEB functional, the minimum energy pathway (MEP) was constructed by estimating energy barriers of reaction steps and determining intermediate structures at critical points—minima and transition states (TS).
Based on the results of DFT/NEB studies on the aforementioned reactions, it was concluded that intramolecular vibrations with the largest amplitude, corresponding to the vectors of normal vibrations in transition states, are responsible for the migration of single H atoms over the considered metal centers and are also the reason for the breaking or formation of bonds during the interaction of the reagent with the substrate. At such vibrations, the formation of Pt–H–Pt and V–H–Pt bridging groups at the cluster units promotes a change in the overlapping region of the bonding orbitals of the H and metal atoms, which, in turn, allows single H atoms to migrate from one metal cluster center to another with relatively low barriers.
It was found that the highest TS barrier values in the reactions studied, on which their rates depend, are largely determined by several factors. One of these is the exothermic processes relating to the addition of H2 molecules to the clusters under consideration, leading to the formation of stable products and corresponding to deep minima on the MEP curves, which become reference points for the estimation of energy barriers. Another factor is the formation of intermediate strong metal–N bonds during catalytic processes, which also leads to the appearance of deep minima on the reaction pathway, often determining large barriers of subsequent TSs and activation energy Ea for the reaction as a whole. The third factor is the formation of single H atoms that hydrogenate the substrate, which occurs at their complete detachment from the metal cluster and is characterized by relatively large TS barriers.
From Table 1, it is seen that the model reaction 3b involving the Pt3V catalyst with the formamide attached to one of the Pt atoms moves via TSs with the lowest barrier values, when compared with other model reactions under consideration. This reaction is the most profitable one and can determine the reaction rate in the process of formamide hydrogenation. It is also the NEB method that made it possible to find the minimum energy path.
The NEB method has established that low-barrier transitions of Pt3V clusters of the tetrahedral form of the metal framework into its planar structures play an active role in hydrogenation processes. Such transitions, found on the paths of minimum energy of formamide hydrogenation reactions on Pt3V clusters, provide the most favorable paths for chemical reactions. This phenomenon requires particular research focus, but it is possible that among the reasons for the lower activation barriers in the case of Pt3V clusters is their ability to flexibly change the geometry of their metal framework during vibration shifts of the reagent. For Pt4 clusters, such structural transformations require much higher energy.
In the final hydrogenation products {Pt3Pt–O(H)–H∙∙∙NH2CH3}, {VPt2Pt–O(H)–H∙∙∙ NH2CH3} and {Pt3V–O(H)–H∙∙∙NH2CH3}, methylamine forms hydrogen bonds with H2O molecules, coordinated on the metal atoms of the cluster with energies ΔG0 of about 20, 29 and 36 kJ/mol, respectively. The role of hydrogen bond formation in the reaction product is very important: it prevents the reorientation of the nucleophilic N atom of the formed methylamine toward other atoms of the metal framework in order to form new structures with a strong Pt–N bond.
The construction of MEP curves via the NEB method in the case of complex molecular processes involving multi-electron systems is a time-consuming and technical task. As this study progressed, useful experience in their construction was gained, allowing the authors to state that the NEB method, which requires only the geometry of reagents and products to start the MEP search, is quite reliable. The following advantages of the NEB method can be noted: (1) it gives reasonable MEPs if a sufficient number of images are included in the chain and (2) all intermediate images can be optimized in parallel, significantly reducing the total computer time required.
Brief description of NEB method origin [61,62,63] and practical hints for the construction of MEP curves in the case of complex molecular processes are given in the Supplementary Materials section.

Supplementary Materials

The following supporting information can be downloaded at: https://www.mdpi.com/article/10.3390/inorganics11100384/s1: Calculation Details of Nudged Elastic Band Method; Tables S1–S4 include the Cartesian coordinates of compounds and their energy characteristics for critical points (minima and transition states) of the MEP curves of reactions; Video S1: Energy path of hydrogenation reaction: formamide.avi, Pt4.avi, VPt3.avi, Pt3V.avi.

Author Contributions

Conceptualization, N.S.P. and T.M.B.; methodology, N.S.P.; investigation, N.S.P.; writing—original draft preparation, N.S.P., writing—review and editing, N.S.P., I.N.K., T.M.B. and A.I.F. All authors have read and agreed to the published version of the manuscript.

Funding

This work was supported by the Ministry of Science and Higher Education of the Russian Federation as part of the State Assignment of the Kurnakov Institute of General and Inorganic Chemistry of the Russian Academy of Sciences.

Institutional Review Board Statement

Not applicable.

Informed Consent Statement

Not applicable.

Data Availability Statement

Not applicable.

Acknowledgments

The present research was carried out using computer resources provided by the High-Performance Computing Centre of St. Petersburg State Institute of Technology (Technical University).

Conflicts of Interest

The authors declare no conflict of interest.

References

  1. Wu, Y.; Sun, H.; Wu, L.; Deetz, J.D. Extracting the mechanisms and kinetic models of complex reactions from atomistic simulation data. J. Comput. Chem. 2019, 40, 1586–1592. [Google Scholar] [CrossRef]
  2. Morgante, P.; Peverati, R. The devil in the details: A tutorial review on some undervalued aspects of density functional theory calculations. Int. J. Quantum Chem. 2020, 120, e26332. [Google Scholar] [CrossRef]
  3. Chun, H.-J.; Zeng, Z.; Greeley, J. DFT Insights into NO Electrochemical Reduction: A Case Study of Pt(211) and Cu(211) Surfaces. ACS Catal. 2022, 12, 1394–1402. [Google Scholar] [CrossRef]
  4. Yang, B.; Mendez-Arroyo, J.; May, C.; Yao, J.; Ess, D.H. Transition-State Analysis Reveals Unexpected Coordination-Specific Reactivity That Drives Alkene Dimerization by Sulfated Metal–Organic Frameworks. J. Phys. Chem. C 2023, 127, 8539–8546. [Google Scholar] [CrossRef]
  5. Kostyukovich, A.Y.; Gordeev, E.G.; Ananikov, V.P. A computational mapping of the R–NHC coupling pathway—The key process in the evolution of Pd/NHC catalytic systems. Mendeleev Commun. 2022, 32, 571–575. [Google Scholar] [CrossRef]
  6. Schwartz, S.D. Perspective: Path Sampling Methods Applied to Enzymatic Catalysis. J. Chem. Theory Comput. 2022, 18, 6397–6406. [Google Scholar] [CrossRef]
  7. Du, J.; Sun, X.; Chen, J.; Jiang, G. A Theoretical Study on Small Iridium Clusters: Structural Evolution, Electronic and Magnetic Properties, and Reactivity Predictors. J. Phys. Chem. A 2010, 114, 12825–12833. [Google Scholar] [CrossRef]
  8. Nikiforov, A.A.; Dubrov, E.N.; Blinou, D.O.; Gurzhiy, V.V.; Selyutin, A.A.; Klyukin, I.N.; Zhdanov, A.P.; Minkovich, A.E.; Panina, N.S.; Eremin, A.V. Penta- and dinuclear carboxylate nickel(II) complexes with pyrazole-based ligands: Syntheses, magnetic properties and DFT calculations. Polyhedron 2021, 195, 114971. [Google Scholar] [CrossRef]
  9. Zhang, X.; Xu, C.; Zhang, Y.; Cheng, C.; Yang, Z.; Hermansson, K. Regulation of CO oxidation with Pd additives on Nb2CO2 MXene. Int. J. Hydrogen Energy 2021, 46, 8477–8485. [Google Scholar] [CrossRef]
  10. Zhang, Y.; Chu, B.-S.; Yu, H.-L.; Li, K.; Wang, W.-H.; Yang, W. Molecular dynamics simulations of the initial oxidation process on ferritic Fe–Cr alloy surfaces. RSC Adv. 2022, 12, 9501–9511. [Google Scholar] [CrossRef]
  11. van der Hoeven, J.E.S.; Jelic, J.; Olthof, L.A.; Totarella, G.; Van Dijk-moes, R.J.A.; Krafft, J.; Louis, C.; Studt, F.; Van Blaaderen, A.; Jongh, P.E. De Unlocking synergy in bimetallic catalysts by core—Shell design. Nat. Mater. 2021, 20, 1216–1220. [Google Scholar] [CrossRef]
  12. Popov, A.A.; Shubin, Y.V.; Bauman, Y.I.; Plyusnin, P.E.; Mishakov, I.V.; Sharafutdinov, M.R.; Maksimovskiy, E.A.; Korenev, S.V.; Vedyagin, A.A. Preparation of porous Co-Pt alloys for catalytic synthesis of carbon nanofibers. Nanotechnology 2020, 31, 495604. [Google Scholar] [CrossRef]
  13. Melnikov, D.; Stytsenko, V.; Saveleva, E.; Kotelev, M.; Lyubimenko, V.; Ivanov, E.; Glotov, A.; Vinokurov, V. Selective Hydrogenation of Acetylene over Pd-Mn/Al2O3 Catalysts. Catalysts 2020, 10, 624. [Google Scholar] [CrossRef]
  14. Zavelev, D.E.; Zhidomirov, G.M.; Tsodikov, M.V. Theoretical Study of Deoxygenation of Esters on Small Pt–Sn Intermetallic Clusters. Kinet. Catal. 2020, 61, 1–39. [Google Scholar] [CrossRef]
  15. Damte, J.Y.; Zhu, Z.; Lin, P.; Yeh, C.; Jiang, J. B, N-co-doped graphene-supported Ir and Pt clusters for methane activation and C─C coupling: A density functional theory study. J. Comput. Chem. 2020, 41, 194–202. [Google Scholar] [CrossRef]
  16. Li, K.; An, H.; Yan, P.; Yang, C.; Xiao, T.; Wang, J.; Zhou, S. Hydrogenation of Toluene to Methyl Cyclohexane over PtRh Bimetallic Nanoparticle-Encaged Hollow Mesoporous Silica Catalytic Nanoreactors. ACS Omega 2021, 6, 5846–5855. [Google Scholar] [CrossRef]
  17. Dadayan, A.K.; Borisov, Y.A.; Zolotarev, Y.A.; Myasoedov, N.F. Modeling Hydrogen Spillover on Oxide Catalytic Centers. Russ. J. Phys. Chem. A 2021, 95, 944–948. [Google Scholar] [CrossRef]
  18. Deng, Q.; Li, X.; Gao, R.; Wang, J.; Zeng, Z.; Zou, J.; Deng, S.; Tsang, S.C.E. Hydrogen-Catalyzed Acid Transformation for the Hydration of Alkenes and Epoxy Alkanes over Co–N Frustrated Lewis Pair Surfaces. J. Am. Chem. Soc. 2021, 143, 21294–21301. [Google Scholar] [CrossRef]
  19. Ferrante, F.; Prestianni, A.; Bertini, M.; Duca, D. H2 transformations on graphene supported palladium cluster: Dft-md simulations and neb calculations. Catalysts 2020, 10, 1306. [Google Scholar] [CrossRef]
  20. Rungnim, C.; Faungnawakij, K.; Sano, N.; Kungwan, N.; Namuangruk, S. Hydrogen storage performance of platinum supported carbon nanohorns: A DFT study of reaction mechanisms, thermodynamics, and kinetics. Int. J. Hydrogen Energy 2018, 43, 23336–23345. [Google Scholar] [CrossRef]
  21. Liu, L.; Lou, H.; Chen, M. Selective hydrogenation of furfural over Pt based and Pd based bimetallic catalysts supported on modified multiwalled carbon nanotubes (MWNT). Appl. Catal. A Gen. 2018, 550, 1–10. [Google Scholar] [CrossRef]
  22. Su, J.; Shi, W.; Liu, X.; Zhang, L.; Cheng, S.; Zhang, Y.; Botton, G.A.; Zhang, B. Probing the performance of structurally controlled platinum-cobalt bimetallic catalysts for selective hydrogenation of cinnamaldehyde. J. Catal. 2020, 388, 164–170. [Google Scholar] [CrossRef]
  23. Zavelev, D.E.; Zhidomirov, G.M.; Tsodikov, M.V. Theoretical Study of Interaction between Hydrogen and Small Pt–Sn Intermetallic Clusters. Kinet. Catal. 2018, 59, 405–417. [Google Scholar] [CrossRef]
  24. Subramani, M.; Arumugam, D.; Ramasamy, S. Revealing the interfacial phenomenon of metal-hydride formation and spillover effect on C48H16 sheet by platinum metal catalyst (Pt (n = 1–4)) for hydrogen storage enhancement. Int. J. Hydrogen Energy 2023, 48, 4016–4034. [Google Scholar] [CrossRef]
  25. Szarek, P.; Urakami, K.; Zhou, C.; Cheng, H.; Tachibana, A. On reversible bonding of hydrogen molecules on platinum clusters. J. Chem. Phys. 2009, 130, 084111. [Google Scholar] [CrossRef]
  26. Xiong, M.; Gao, Z.; Qin, Y. Spillover in Heterogeneous Catalysis: New Insights and Opportunities. ACS Catal. 2021, 11, 3159–3172. [Google Scholar] [CrossRef]
  27. Sihag, A.; Xie, Z.L.; Thang, H.V.; Kuo, C.L.; Tseng, F.G.; Dyer, M.S.; Chen, H.Y.T. DFT Insights into Comparative Hydrogen Adsorption and Hydrogen Spillover Mechanisms of Pt4/Graphene and Pt4/Anatase (101) Surfaces. J. Phys. Chem. C 2019, 123, 25618–25627. [Google Scholar] [CrossRef]
  28. Guo, J.; Li, X.-D.; Cheng, X.; Liu, H.; Li, S.; Chen, G. The theoretical study of the bimetallic Ni/Pd, Ni/Pt and Pt/Pd catalysts for hydrogen spillover on penta-graphene. Int. J. Hydrogen Energy 2018, 43, 19121–19129. [Google Scholar] [CrossRef]
  29. Yang, G.; Akhade, S.A.; Chen, X.; Liu, Y.; Lee, M.; Glezakou, V.; Rousseau, R.; Lercher, J.A. The Nature of Hydrogen Adsorption on Platinum in the Aqueous Phase. Angew. Chem. Int. Ed. 2019, 58, 3527–3532. [Google Scholar] [CrossRef]
  30. Christmann, K. Interaction of hydrogen with solid surfaces. Surf. Sci. Rep. 1988, 9, 1–163. [Google Scholar] [CrossRef]
  31. Ruppert, A.M.; Weinberg, K.; Palkovits, R. Hydrogenolysis goes bio: From carbohydrates and sugar alcohols to platform chemicals. Angew. Chem.-Int. Ed. 2012, 51, 2564–2601. [Google Scholar] [CrossRef] [PubMed]
  32. Rozanov, V.V.; Krylov, O.V. Hydrogen spillover in heterogeneous catalysis. Russ. Chem. Rev. 1997, 66, 107–119. [Google Scholar] [CrossRef]
  33. Shen, H.; Li, H.; Yang, Z.; Li, C. Magic of hydrogen spillover: Understanding and application. Green Energy Environ. 2022, 7, 1161–1198. [Google Scholar] [CrossRef]
  34. Matsura, V.A.; Panina, N.S.; Potekhin, V.V.; Ukraintsev, V.B.; Khokhryakov, K.A.; Platonov, V.V.; Tatsenko, O.M.; Panin, A.I. A Quantum-Chemical Study of Dissociation of H2 Molecule on Palladium Clusters. Russ. J. Gen. Chem. 2004, 74, 975–979. [Google Scholar] [CrossRef]
  35. Panina, N.S.; Buslaeva, T.M.; Fischer, A.I. Activation of H2 molecules on platinum and platinum-vanadium clusters: Quantum-chemical DFT modeling. Kinet. Catal. 2023, 64, 588–602 . [Google Scholar]
  36. Ásgeirsson, V.; Birgisson, B.O.; Bjornsson, R.; Becker, U.; Neese, F.; Riplinger, C.; Jónsson, H. Nudged Elastic Band Method for Molecular Reactions Using Energy-Weighted Springs Combined with Eigenvector Following. J. Chem. Theory Comput. 2021, 17, 4929–4945. [Google Scholar] [CrossRef]
  37. Häfner, M.; Bredow, T. Hydrogenation of CO and CO2 Catalyzed by Potassium Chloride F Centers. J. Phys. Chem. C 2022, 126, 9713–9723. [Google Scholar] [CrossRef]
  38. Mitsuta, Y.; Asada, T. Curvature-weighted nudged elastic band method using the Riemann curvature. J. Comput. Chem. 2023, 44, 662–669. [Google Scholar] [CrossRef]
  39. Bende, A.; Farcaş, A.A. Intermolecular-Type Conical Intersections in Benzene Dimer. Int. J. Mol. Sci. 2023, 24, 2906. [Google Scholar] [CrossRef]
  40. Nikiforov, A.; Panina, N.; Blinou, D.; Gurzhiy, V.; Nashchekina, J.; Korzhikova-Vlakh, E.; Eremin, A.; Stepanova, M. Ring-Opening Polymerization of rac-Lactide Catalyzed by Octahedral Nickel Carboxylate Complexes. Catalysts 2023, 13, 304. [Google Scholar] [CrossRef]
  41. Mitsudome, T.; Miyagawa, K.; Maeno, Z.; Mizugaki, T.; Jitsukawa, K.; Yamasaki, J.; Kitagawa, Y.; Kaneda, K. Mild Hydrogenation of Amides to Amines over a Platinum-Vanadium Bimetallic Catalyst. Angew. Chem. 2017, 129, 9509–9513. [Google Scholar] [CrossRef]
  42. Zhang, T.; Zhang, Y.; Zhang, W.; Luo, M. A Convenient and General Reduction of Amides to Amines with Low-Valent Titanium. Adv. Synth. Catal. 2013, 355, 2775–2780. [Google Scholar] [CrossRef]
  43. Ke, D.; Zhou, S. General Construction of Amine via Reduction of N=X (X = C, O, H) Bonds Mediated by Supported Nickel Boride Nanoclusters. Int. J. Mol. Sci. 2022, 23, 9337. [Google Scholar] [CrossRef] [PubMed]
  44. Núñez Magro, A.A.; Eastham, G.R.; Cole-Hamilton, D.J. The synthesis of amines by the homogeneous hydrogenation of secondary and primary amides. Chem. Commun. 2007, 30, 3154–3156. [Google Scholar] [CrossRef] [PubMed]
  45. Pennetier, A.; Hernandez, W.Y.; Kusema, B.T.; Streiff, S. Efficient hydrogenation of aliphatic amides to amines over vanadium-modified rhodium supported catalyst. Appl. Catal. A Gen. 2021, 624, 118301. [Google Scholar] [CrossRef]
  46. Fesik, E.V.; Buslaeva, T.M.; Arkhipushkin, I.A. Reaction of [Pt(NH3)4]Cl2 with NH4VO3 in an Alkaline Solution at 190 °C in Autoclave. Russ. J. Gen. Chem. 2020, 90, 2147–2151. [Google Scholar] [CrossRef]
  47. Corbel, G.; Topić, M.; Gibaud, A.; Lang, C.I. Selective dry oxidation of the ordered Pt–11.1at.% V alloy surface evidenced by in situ temperature-controlled X-ray diffraction. J. Alloys Compd. 2011, 509, 6532–6538. [Google Scholar] [CrossRef]
  48. Waterstrat, R.M. The vanadium-platinum constitution diagram. Metall. Trans. 1973, 4, 455–466. [Google Scholar] [CrossRef]
  49. Maldonado, A.; Schubert, K. Crystal Structure. Investigation in Some Alloy Systems Homologous and Quasihomologous to T5-T10. Z. Met. 1964, 55, 619–626. [Google Scholar]
  50. Luo, Y.-R. Comprehensive Handbook of Chemical Bond Energies; CRC Press: Boca Raton, FL, USA, 2007; ISBN 9780429128684. [Google Scholar]
  51. Adamo, C.; Barone, V. Toward reliable density functional methods without adjustable parameters: The PBE0 model. J. Chem. Phys. 1999, 110, 6158–6170. [Google Scholar] [CrossRef]
  52. Neese, F.; Wennmohs, F. ORCA Manual, Version 5.0.1. Max Planck Institute for Coal Research: Mülheim, Germany, 2021. [Google Scholar]
  53. Henkelman, G.; Uberuaga, B.P.; Jónsson, H. A climbing image nudged elastic band method for finding saddle points and minimum energy paths. J. Chem. Phys. 2000, 113, 9901–9904. [Google Scholar] [CrossRef]
  54. Neese, F. The ORCA program system. WIREs Comput. Mol. Sci. 2012, 2, 73–78. [Google Scholar] [CrossRef]
  55. Neese, F.; Wennmohs, F.; Becker, U.; Riplinger, C. The ORCA quantum chemistry program package. J. Chem. Phys. 2020, 152, 224108. [Google Scholar] [CrossRef] [PubMed]
  56. Neese, F. Software update: The ORCA program system—Version 5.0. WIREs Comput. Mol. Sci. 2022, 12, e1606. [Google Scholar] [CrossRef]
  57. Weigend, F.; Ahlrichs, R. Balanced basis sets of split valence, triple zeta valence and quadruple zeta valence quality for H to Rn: Design and assessment of accuracy. Phys. Chem. Chem. Phys. 2005, 7, 3297–3305. [Google Scholar] [CrossRef]
  58. Debefve, L.; Pollock, C. Systematic assessment of DFT methods for geometry optimization of mononuclear platinum-containing complexes. Phys. Chem. Chem. Phys. 2021, 23, 24780–24788. [Google Scholar] [CrossRef]
  59. Schlegel, H.B. Optimization of equilibrium geometries and transition structures. J. Comput. Chem. 1982, 3, 214–218. [Google Scholar] [CrossRef]
  60. Chemcraft—Graphical Software for Visualization of Quantum Chemistry Computations. Available online: https://www.chemcraftprog.com (accessed on 15 September 2023).
  61. Elber, R.; Karplus, M. A method for determining reaction paths in large molecules: Application to myoglobin. Chem. Phys. Lett. 1987, 139, 375–380. [Google Scholar] [CrossRef]
  62. Czerminski, R.; Elber, R. Self-avoiding walk between two fixed points as a tool to calculate reaction paths in large molecular systems. Int. J. Quantum Chem. 1990, 38, 167–185. [Google Scholar] [CrossRef]
  63. Gillian, R.E.; Wilson, K.R.J. Shadowing, rare events, and rubber bands. A variational Verlet algorithm for molecular dynamics. Chem. Phys. 1992, 97, 1757–1772. [Google Scholar] [CrossRef]
Figure 1. MEP curves and their corresponding structural units of stage I: reagent I—{H2 + HCONH2}; TS1; product I—HOCH2NH2; stage II: reagent II—{H2 + HOCH2NH2}; TS2; product II—H2 O∙∙∙CH3NH2.
Inorganics 11 00384 g001
Figure 2. MEP curve of reaction (2) and the corresponding structures: a—stage I (hydrogenation of formamide by the first H2 molecule on the Pt4 cluster). Images of TS6_1(a)—TS6_4(a) were obtained from multiple xyz file.
Inorganics 11 00384 g002
Figure 3. MEP curves of reaction (2) and the corresponding structures. b, c: stage II of hydrogenation by the second H2 molecule on the Pt4 cluster; preliminary curves MEP(b) and MEP(c) with refined values of energies.
Inorganics 11 00384 g003
Figure 4. MEP curve of reaction 3a and the corresponding structures: a—stage I, hydrogenation by the first H2 molecule on the Pt3V cluster.
Inorganics 11 00384 g004aInorganics 11 00384 g004b
Figure 5. MEP curve of reaction 3a and the corresponding structures: b—stage II, hydrogenation by the second H2 molecule on the Pt3V cluster.
Inorganics 11 00384 g005aInorganics 11 00384 g005b
Figure 6. MEP curve of reaction 3b and the corresponding structures: a—stage I, hydrogenation by the first molecule H2 on the Pt3V cluster.
Inorganics 11 00384 g006aInorganics 11 00384 g006b
Figure 7. MEP curve of reaction 3b and the corresponding structures: b—stage II, hydrogenation of the substrate by a second molecule H2 on the Pt3V cluster.
Inorganics 11 00384 g007
Table 1. Calculated energy values ΔG0 (kJ/mol) of the highest TS barriers arising on the path of the minimum energy of the formamide hydrogenation reactions.
ReactionsΔG0
Stage I
ΔG0
Stage II
(1) {2H2 + OC(H)NH2} 289 (TS1)292 (TS2)
(2) {2H2 + Pt3Pt─OC(H)NH2} 228 (TS6)132 (TS5)
(3a) {2H2 + Pt3V─OC(H)NH2} 163 (TS4)209 (TS3)
(3b) {2H2 + VPt2Pt─OC(H)NH2} 148 (TS5) 131(TS5), 129(TS8)
Disclaimer/Publisher’s Note: The statements, opinions and data contained in all publications are solely those of the individual author(s) and contributor(s) and not of MDPI and/or the editor(s). MDPI and/or the editor(s) disclaim responsibility for any injury to people or property resulting from any ideas, methods, instructions or products referred to in the content.

