1. Introduction
Low-temperature fuel cells (LTFCs) are a critical component of the rapidly developing hydrogen energy [
1]. The oxidation of different types of fuel, e.g., hydrogen, methanol, ethanol, etc., proceeds on the fuel cell anode, with the oxygen reduction proceeding on its cathode [
2,
3]. To accelerate the rate of the cell reactions, the highly dispersive catalysts, i.e., the nanoparticles of platinum or its alloys deposited on the highly dispersive carbon black, are used on the cathode and the anode of LTFCs [
4,
5,
6]. To produce high-performance LTFCs, it is necessary to increase the specific catalytic activity and the stability of the Pt-based catalysts, which are a critical component of these devices. It is noteworthy that the commercial use of direct methanol fuel cells (DMFCs) poses a considerable challenge. One needs to develop synthesis methods of high-performance and cost-effective electrocatalysts of the methanol oxidation [
7]. The materials should be characterized by high values of the electrochemical surface area (ESA) and the activity in the methanol electrooxidation reaction (MOR). The Pt/C materials are successfully used on the anode and the cathode of LTFCs as the catalysts. However, since the platinum surface is easily poisoned by the CO molecules, which can be found in hydrogen as an impurity or which can be an intermediate product of the oxidation of alcohols, the search for the catalysts with the high robustness against CO is still ongoing [
8,
9,
10,
11]. Therefore, the bimetallic PtRu/C materials with the metals’ atomic ratio of 1:1 and with the high tolerance to the CO poisoning due to the implementation of the bifunctional and/or electron oxidation mechanism are currently most widespread for use in LTFCs as the anodic catalysts [
12,
13,
14,
15,
16]. Due to the implementation of this mechanism, the oxidation of methanol to CO
2 proceeds in the PtRu/C catalysts at less positive potentials than in the Pt/C material [
16,
17]. The activity of the PtRu/C catalysts depends on the size of metal nanoparticles (NPs), the metals’ mass fraction in the catalyst, the distribution of metal NPs over the support surface, etc. All the aforementioned characteristics of the PtRu/C catalysts, in turn, are defined by conditions of their synthesis [
18,
19,
20,
21,
22].
To obtain the PtRu/C catalysts, a number of different synthesis methods are currently used, including the microemulsion method [
18], the electrodeposition [
19], the method of impregnating the carbon support with the metals’ precursors followed by the high-temperature reduction in a stream of hydrogen [
20], the liquid-phase synthesis methods, during which the metals are reduced from the precursor compound solution, e.g., by ethylene glycol [
17,
21], sodium borohydride [
22], or dimethylamine borane [
22]. Despite a wide variety of methods for obtaining the PtRu/C catalysts, each of them has its own advantages and disadvantages. Moreover, the question of choosing a scalable synthesis method for commercial production of the catalysts still remains unclear and requires further research.
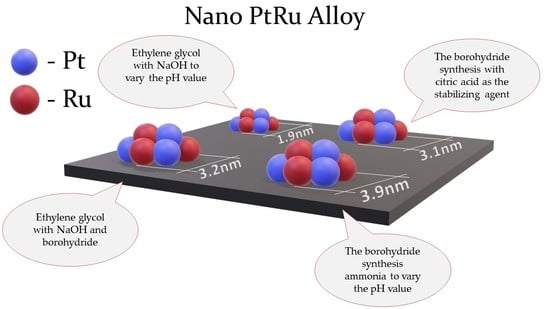
The PtRu/C catalysts’ synthesis methods in the liquid phase are widespread, having a number of advantages, i.e., ample opportunities to vary the composition and the structure of the obtained materials by changing the synthesis parameters [
23], low energy demands, producibility, and scalability. Therefore, the most widespread synthesis methods of the platinum–ruthenium catalysts in the liquid phase using ethylene glycol and sodium borohydride as reducing agents were chosen for comparison, given the prospects of these syntheses for further scaling. Scaling up synthesis will help reduce the cost of producing catalysts for the transition to alternative energy sources with zero emissions into the atmosphere. It was necessary to compare different synthesis methods of the PtRu/C catalysts and to study the effect of the metal NPs’ average size, their size dispersion, and the uniformity of their distribution over the carbon support surface on the ESA and the activity in the MOR as well as the tolerance to intermediate products of the methanol oxidation. The originality of this work lies in the consideration of the structure and activity of catalysts obtained by various modified synthesis methods directly in one work when comparing the obtained characteristics with commercial ones.
2. Results and Discussion
Four samples of the PtRu/C catalysts with the theoretical ratio of Pt:Ru = 1:1 and the metals’ mass fraction of about 27% have been obtained by the different synthesis methods described above. Nevertheless, for the material obtained by the polyol method, the content of Pt and Ru has proved to be slightly lower than the theoretically calculated loading of the precursors (~40% loading of the metals). This indicates certain losses of the metals during the synthesis. In this regard, most of these losses fall on ruthenium, which is confirmed by the materials’ composition according to the XRF analysis (
Table 1).
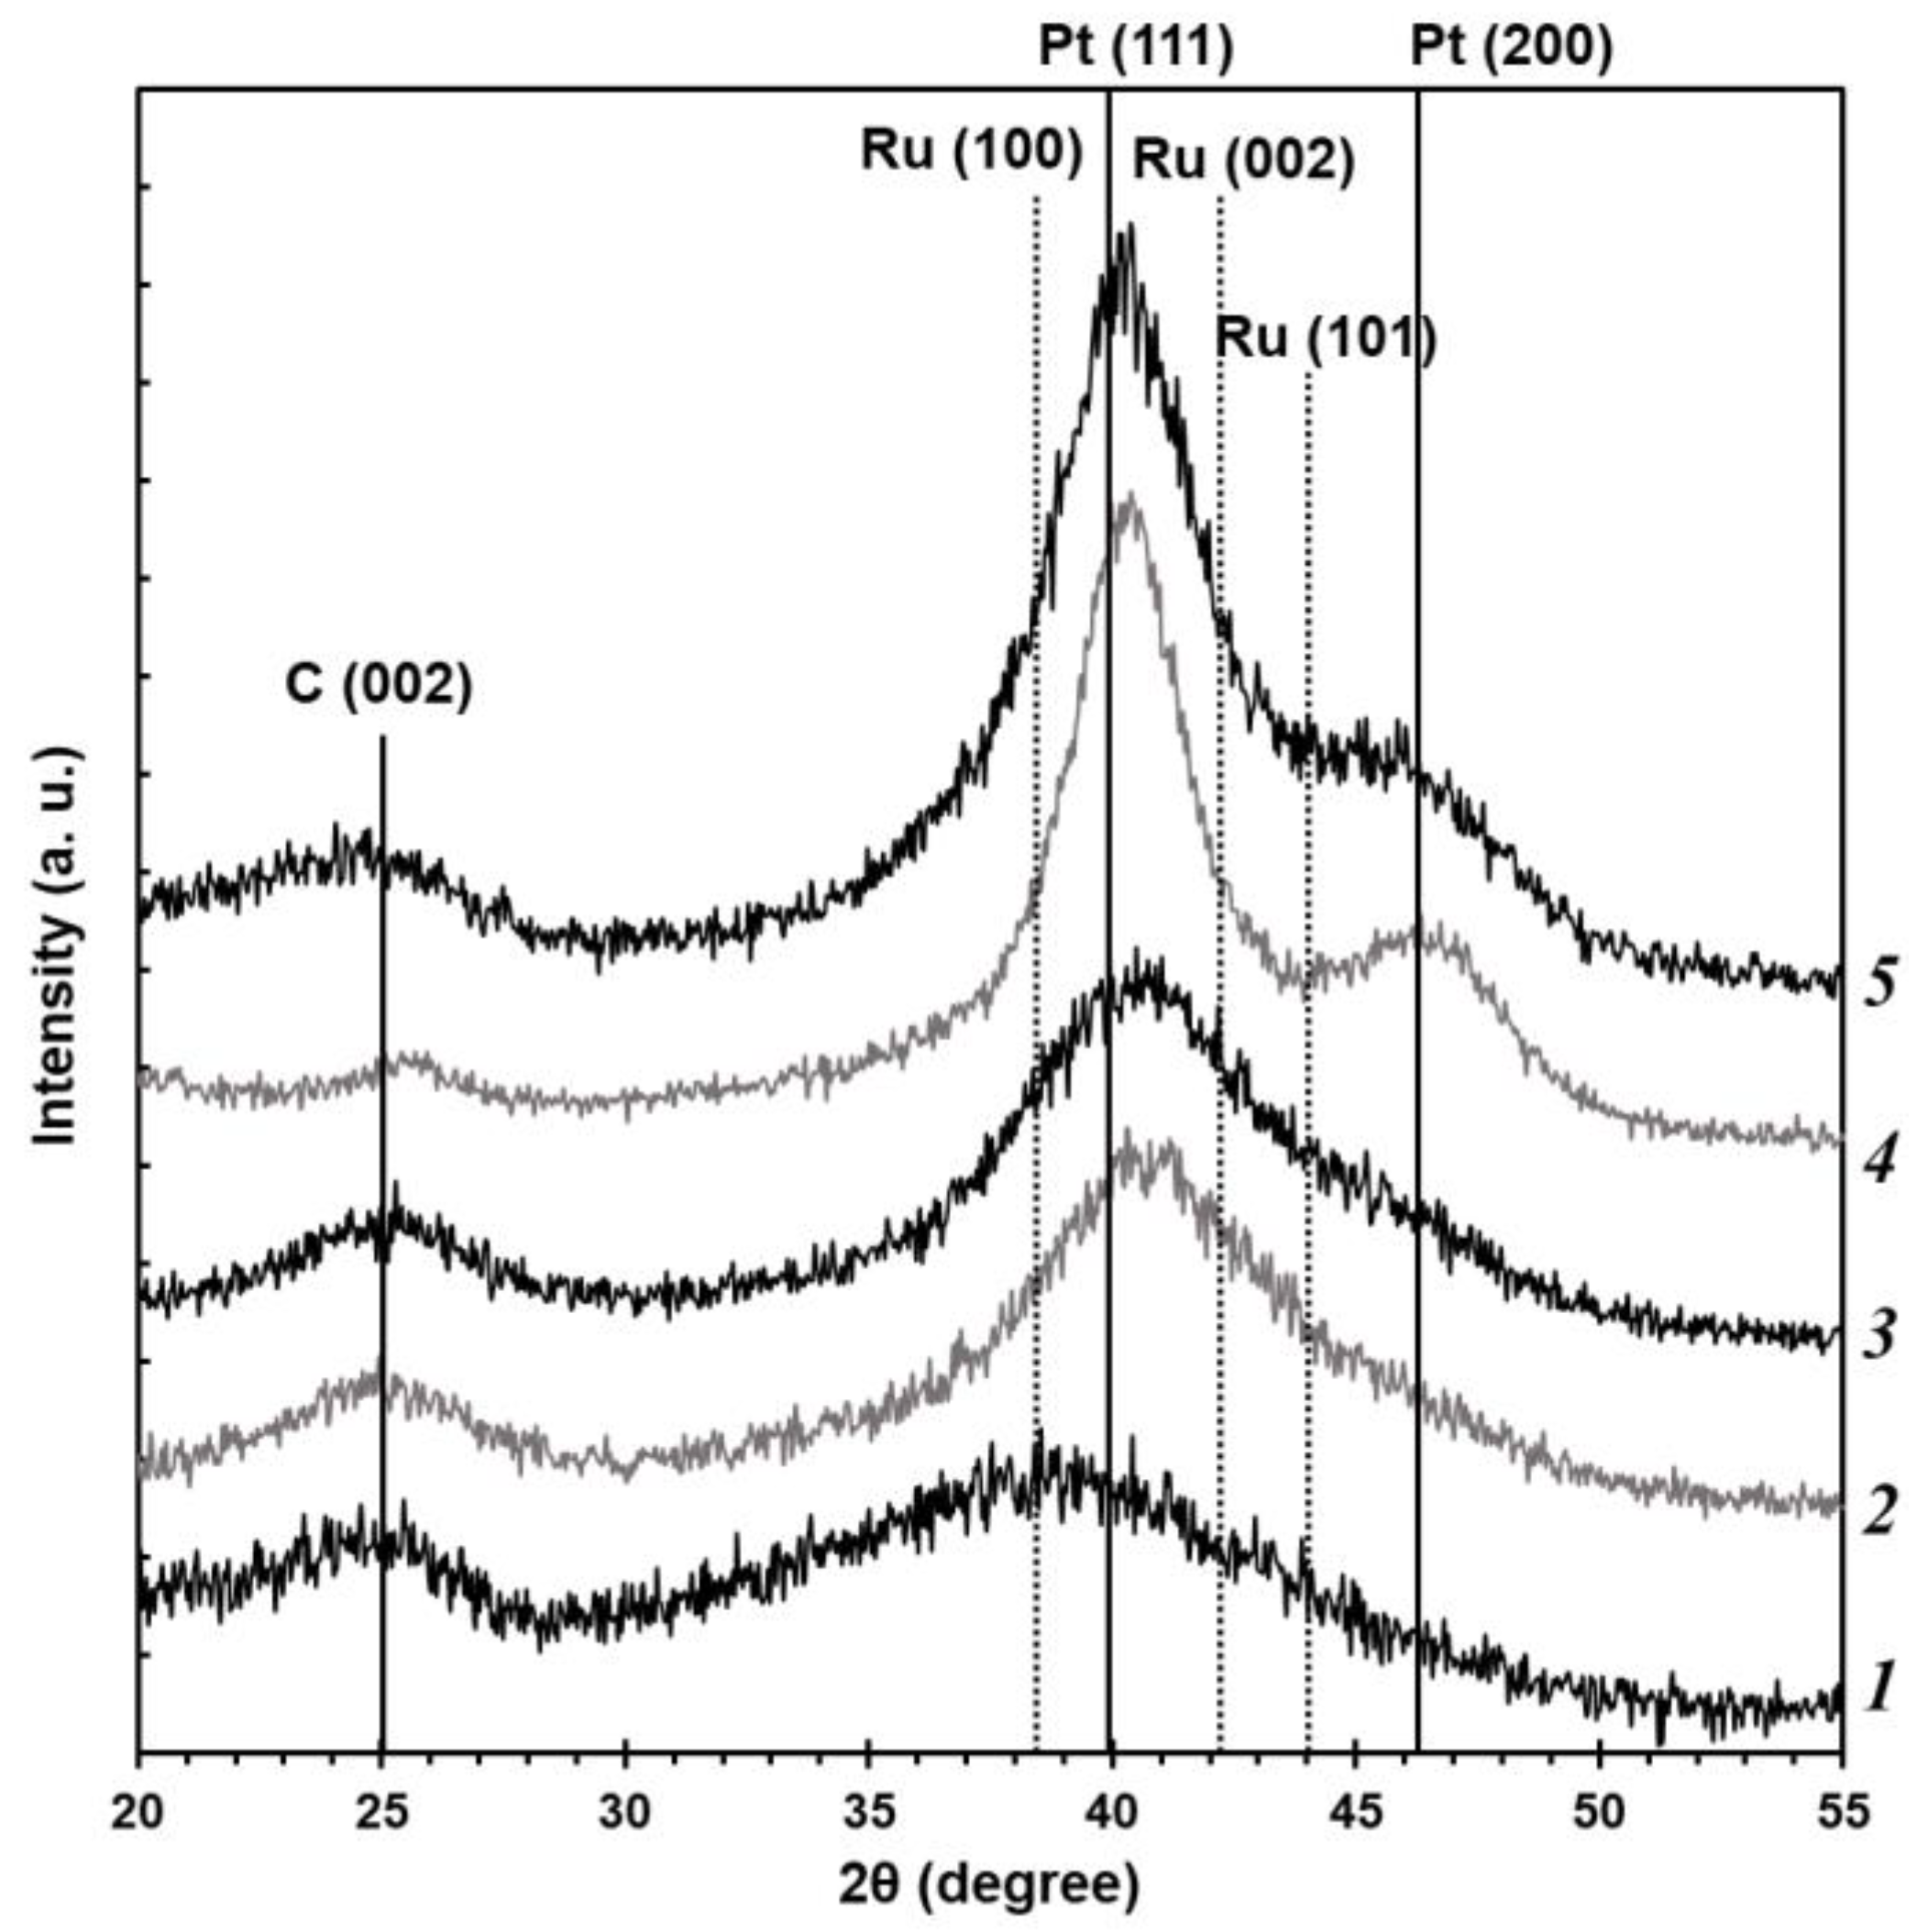
Based on the results of the X-ray powder diffraction (
Figure 1), all the studied PtRu/C catalysts demonstrate characteristic reflections of the carbon support C (002) in the region of values of about 25° 2θ and reflections of the metal phase of platinum with the face-centered cubic structure. The reflections of the platinum metal phase are shifted to the high-angle region of 2θ, which can be connected with the formation of the PtRu solid solution. It is noteworthy that the maximum shift value and, thus, the crystal lattice parameter differ depending on the synthesis method. The greatest shift is observed for the BH and BHC materials (
Figure 1). The P material obtained by the polyol method is significantly different from the other samples. The material demonstrates a distinctly wide reflection with the maximum shifted to the low-angle region of 2θ compared with the platinum phase. This appears to be due to the overlap of several wide reflections, e.g., for ruthenium, platinum, or PtRu alloy.
On the other hand, the X-ray diffraction patterns of the obtained PtRu/C catalysts show no reflections of the ruthenium metal phase (
Figure 1), although this does not exclude the presence of the X-ray amorphous phases of ruthenium oxide in the synthesized materials. The commercial PtRu/C-AA catalyst containing the same phases as the obtained materials has been studied for comparison. The reflections of the metal phase for all the studied materials are significantly widened, which testifies to the smaller size of crystallites. The size of metal crystallites (D
av, nm(XRD)) for the studied PtRu/C samples has been calculated by the Scherrer formula (
Table 1). The PtRu/C catalysts obtained by different synthesis methods are characterized by the smaller size of crystallites (less than 2 nm) than the commercial PtRu-AA analogue (3.2 nm). The size of the material obtained by the polyol method has not been calculated due to distinctly wide reflections with low intensity that appear to result from the overlap of reflections of various phases. Moreover, the smaller size of Pt NPs can result in the appearance of the Pt
3O
4 phase [
24], reflections of which may also be observed in the X-ray diffraction patterns.
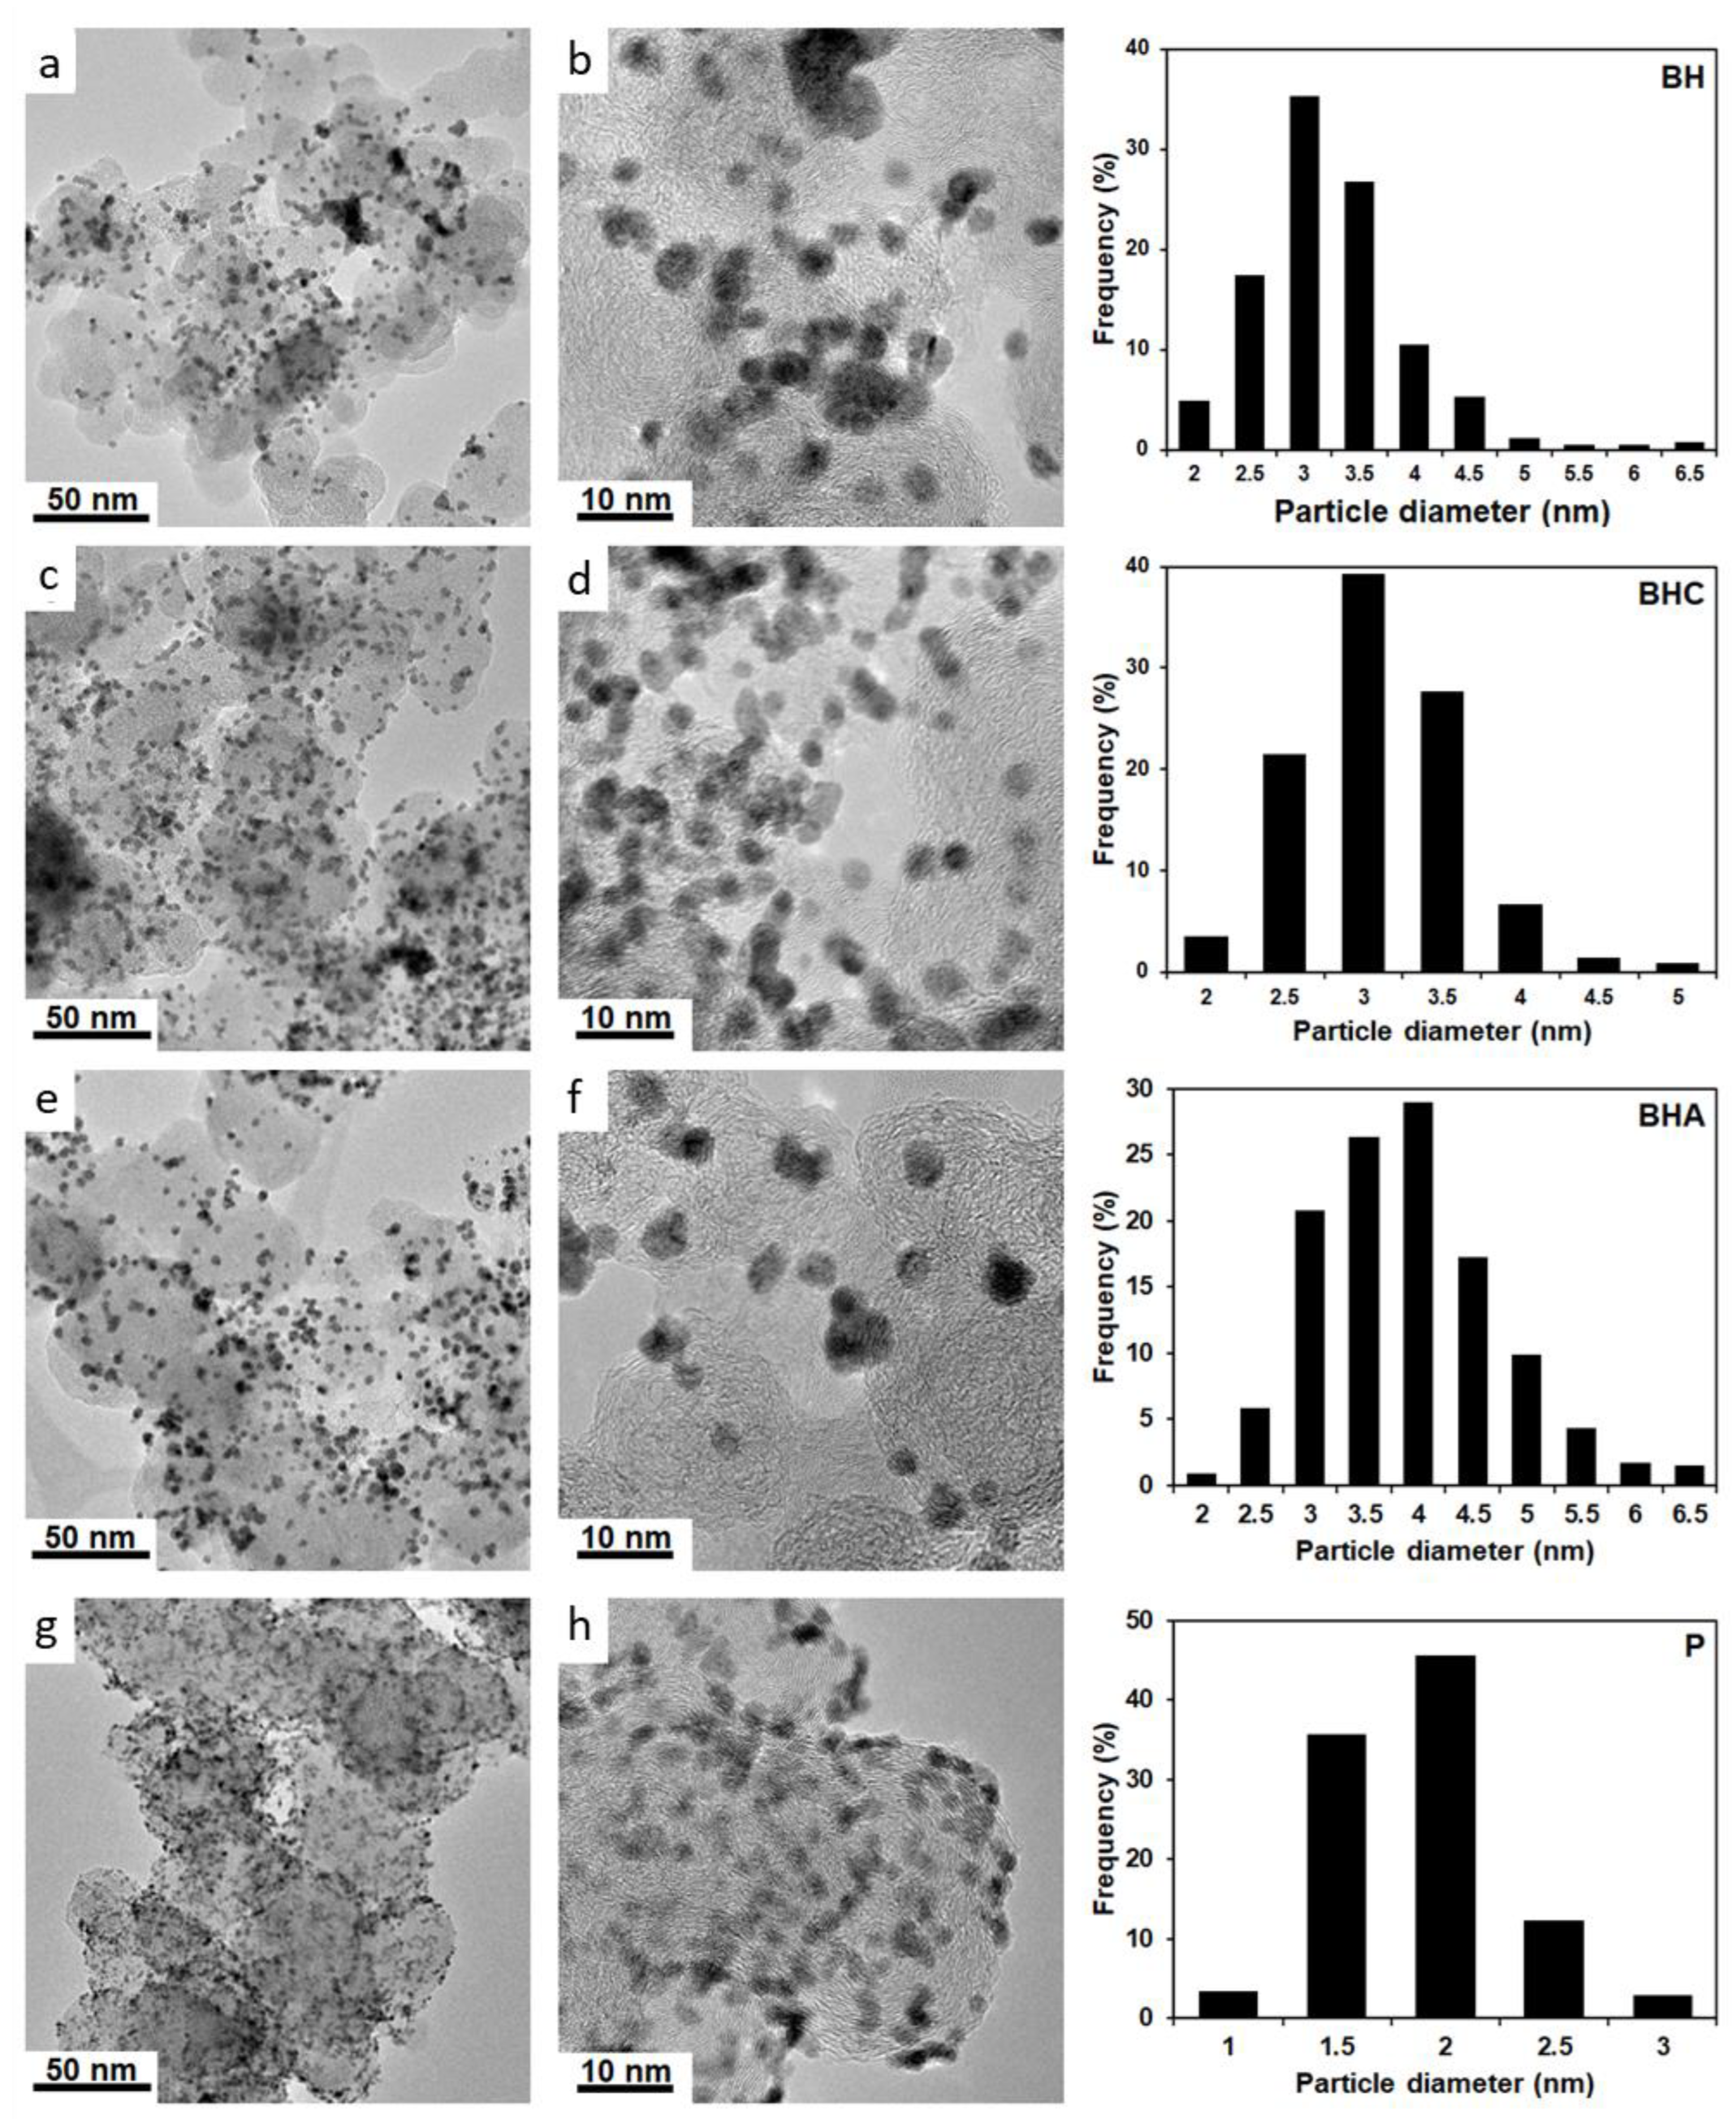
According to the results of transmission electron microscopy (
Figure 2), the presence of the metal NPs of 1 to 7 nm in size (D
av (NPs), nm (TEM)) deposited on the carbon support surface has been confirmed for all four obtained PtRu/C catalysts. It should be noted that there is a significant difference in the size of NPs and the uniformity of their distribution over the carbon support surface depending on the synthesis method. For example, according to the TEM data, the P material obtained by the polyol method exhibits the smallest size of metal NPs, i.e., about 2 nm (
Table 1). At the same time, these NPs are uniformly distributed over the support surface (
Figure 2c,d) and characterized by the narrow size dispersion (
Figure 2, the histogram). The other materials obtained using NaBH
4 demonstrate the larger NPs with the average size of 3.1 to 3.9 nm and the wide size dispersion. Meanwhile, a substantial number of agglomerates are observed in the TEM micrographs. According to the TEM data, the BHA material exhibits the biggest average size of particles (3.9 nm), the widest size dispersion of NPs, and the most pronounced agglomeration on the carbon support surface among the studied samples (
Figure 2a,b).
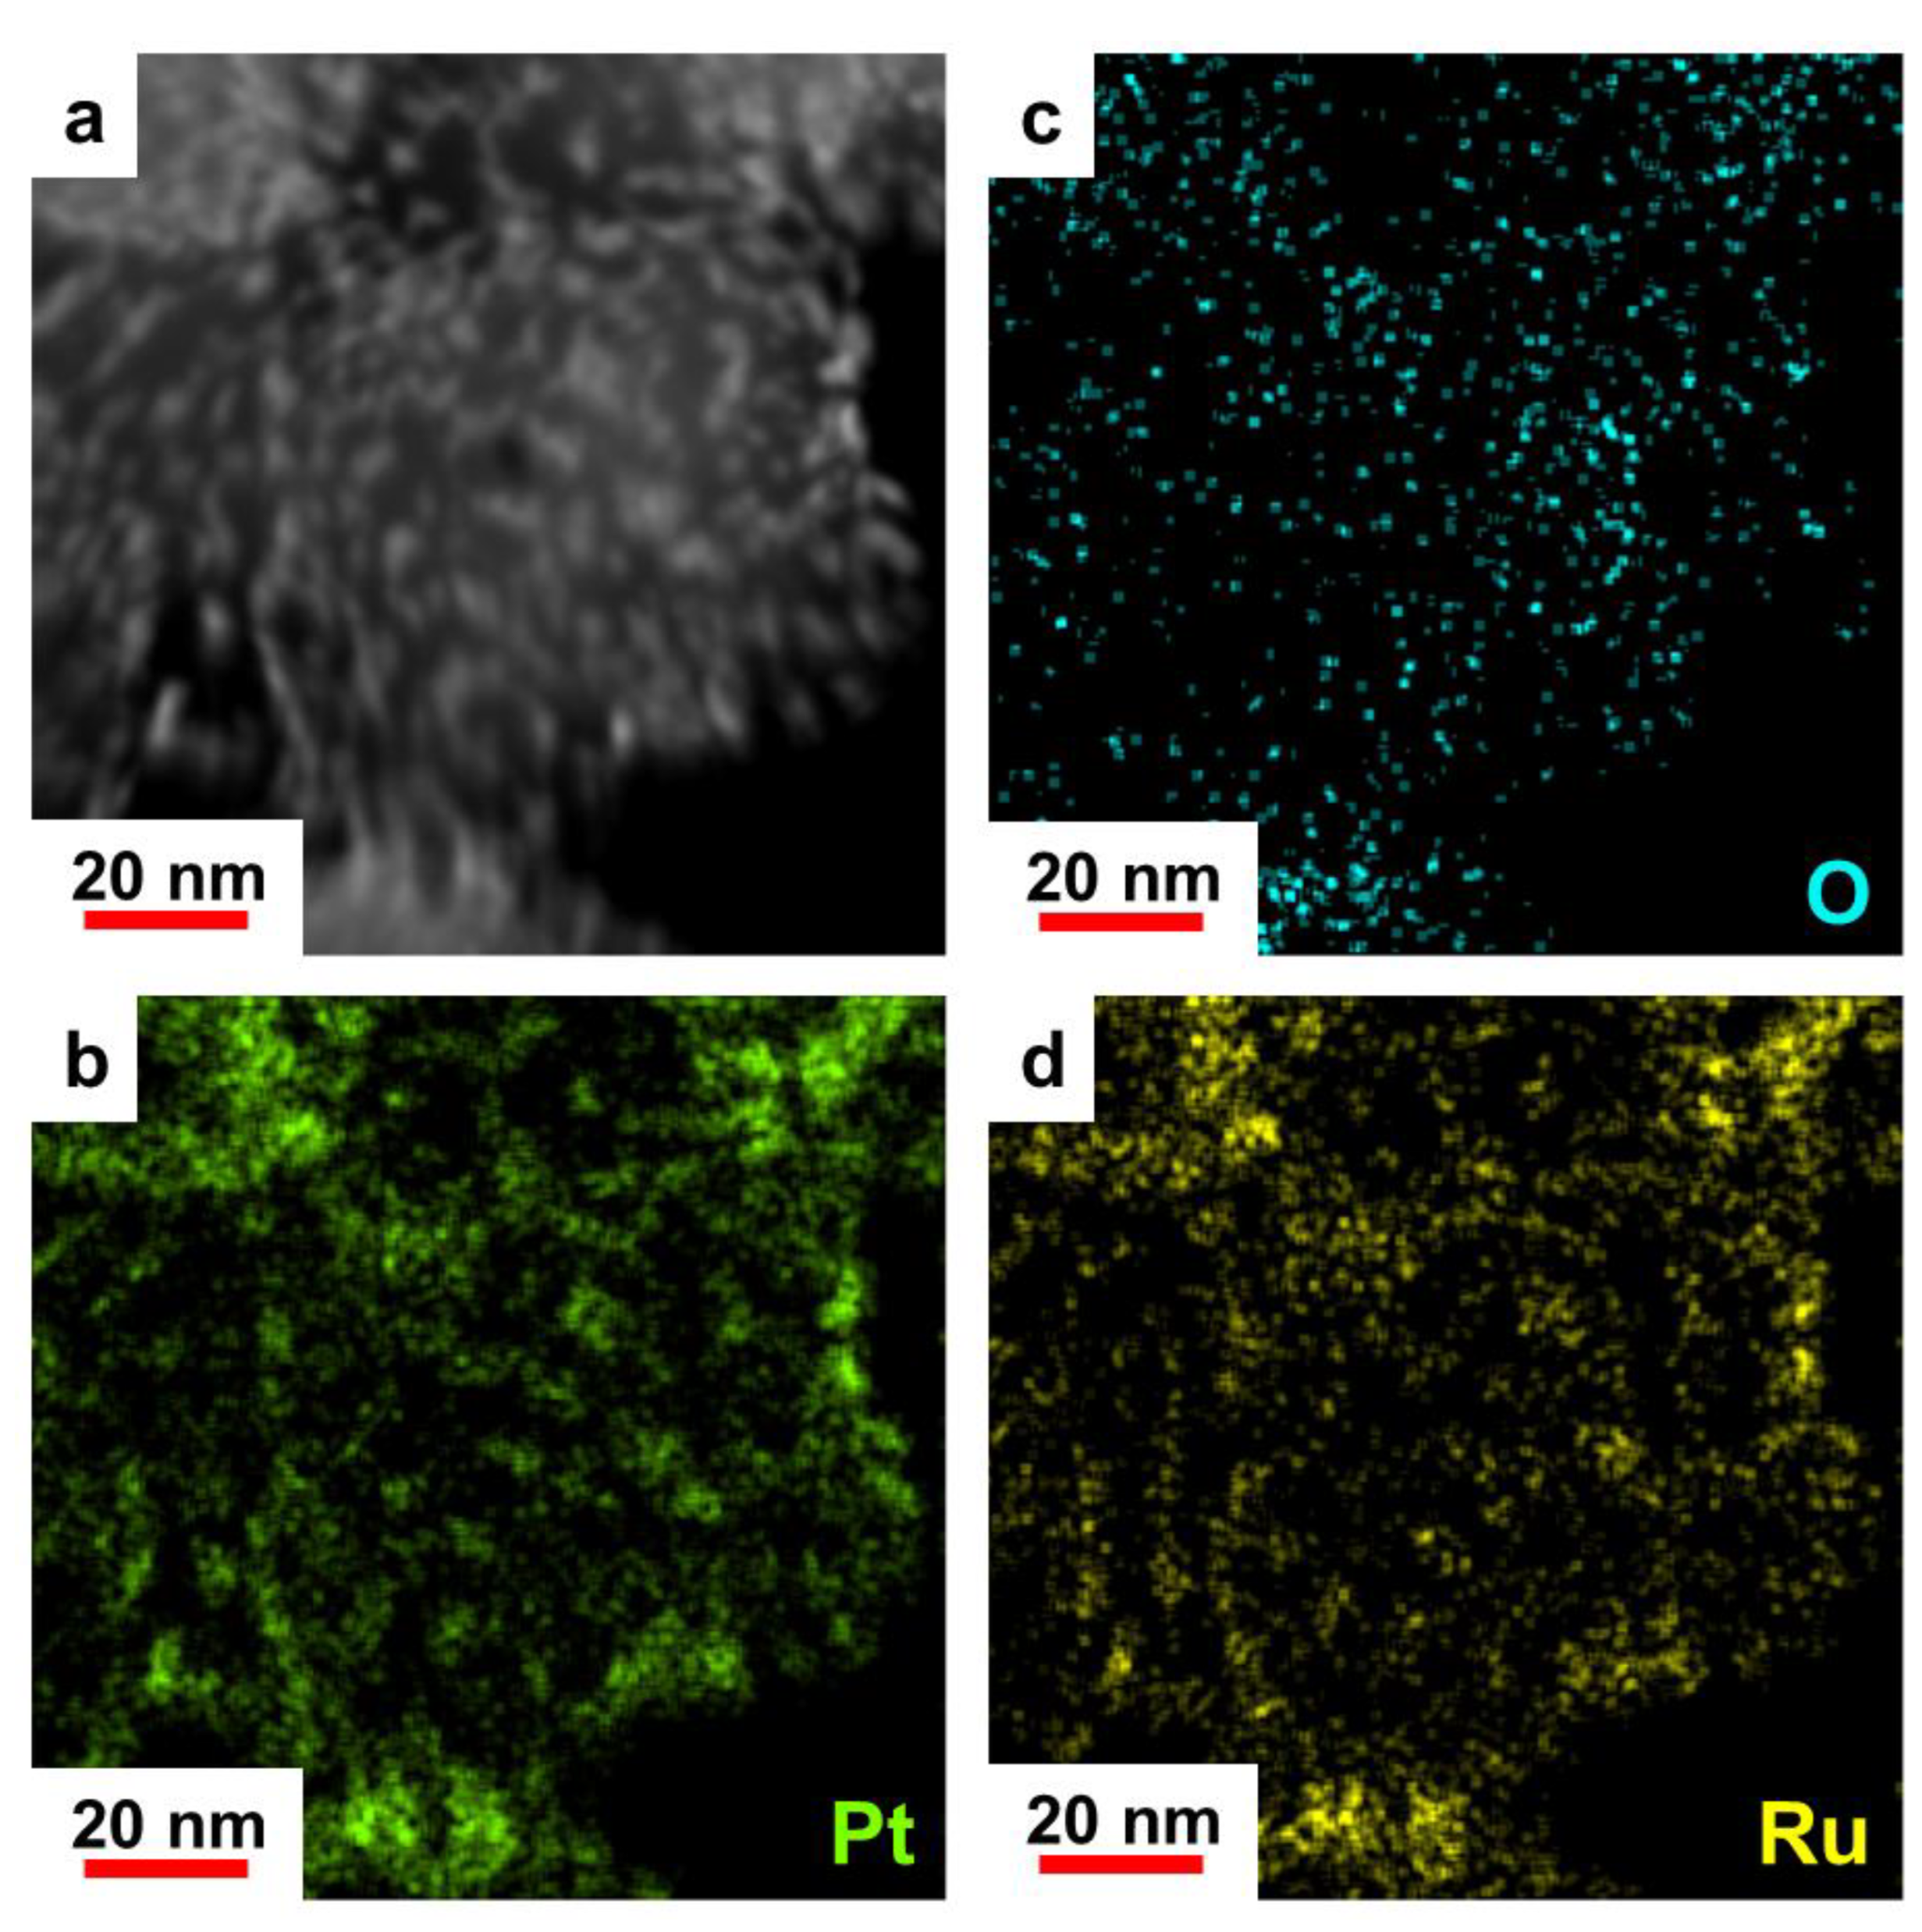
The elemental mapping of separate sections of the PtRu/C catalysts has shown the presence of bimetallic Pt and Ru NPs on the carbon support surface and the almost complete absence of individual Pt or Ru NPs for all the studied materials. The results for the P material are presented as an illustrative example (
Figure 3). Notably, the greatest intensity of the oxygen response for all the materials is compliant with the position of bimetallic NPs, which testifies to the presence of oxygen in the composition of NPs. This phenomenon may be caused by the partial oxidation of the metal NPs’ surface, which conforms to the literature data [
25].
It is worth noting that the average size of NPs in regard to the TEM data is bigger than the average crystallite size based on the XRD results for all the studied materials (
Table 1). This fact may be due to a complex structure of NPs that can consist of several individual crystallites. Moreover, the X-ray amorphous layer can be present on the surface of NPs. Moreover, due to the features of the size determination for different synthesis methods, the obtained average sizes may vary.
Therefore, the use of the polyol method allows the PtRu/C materials with the smallest average size of bimetallic NPs uniformly distributed over the carbon support surface to be obtained. On the other hand, during the polyol synthesis, significant losses of the metals are observed. The introduction of citric acid or ammonia during the borohydride synthesis allows decreasing of the average size of NPs as well as reductions in the number of agglomerates.
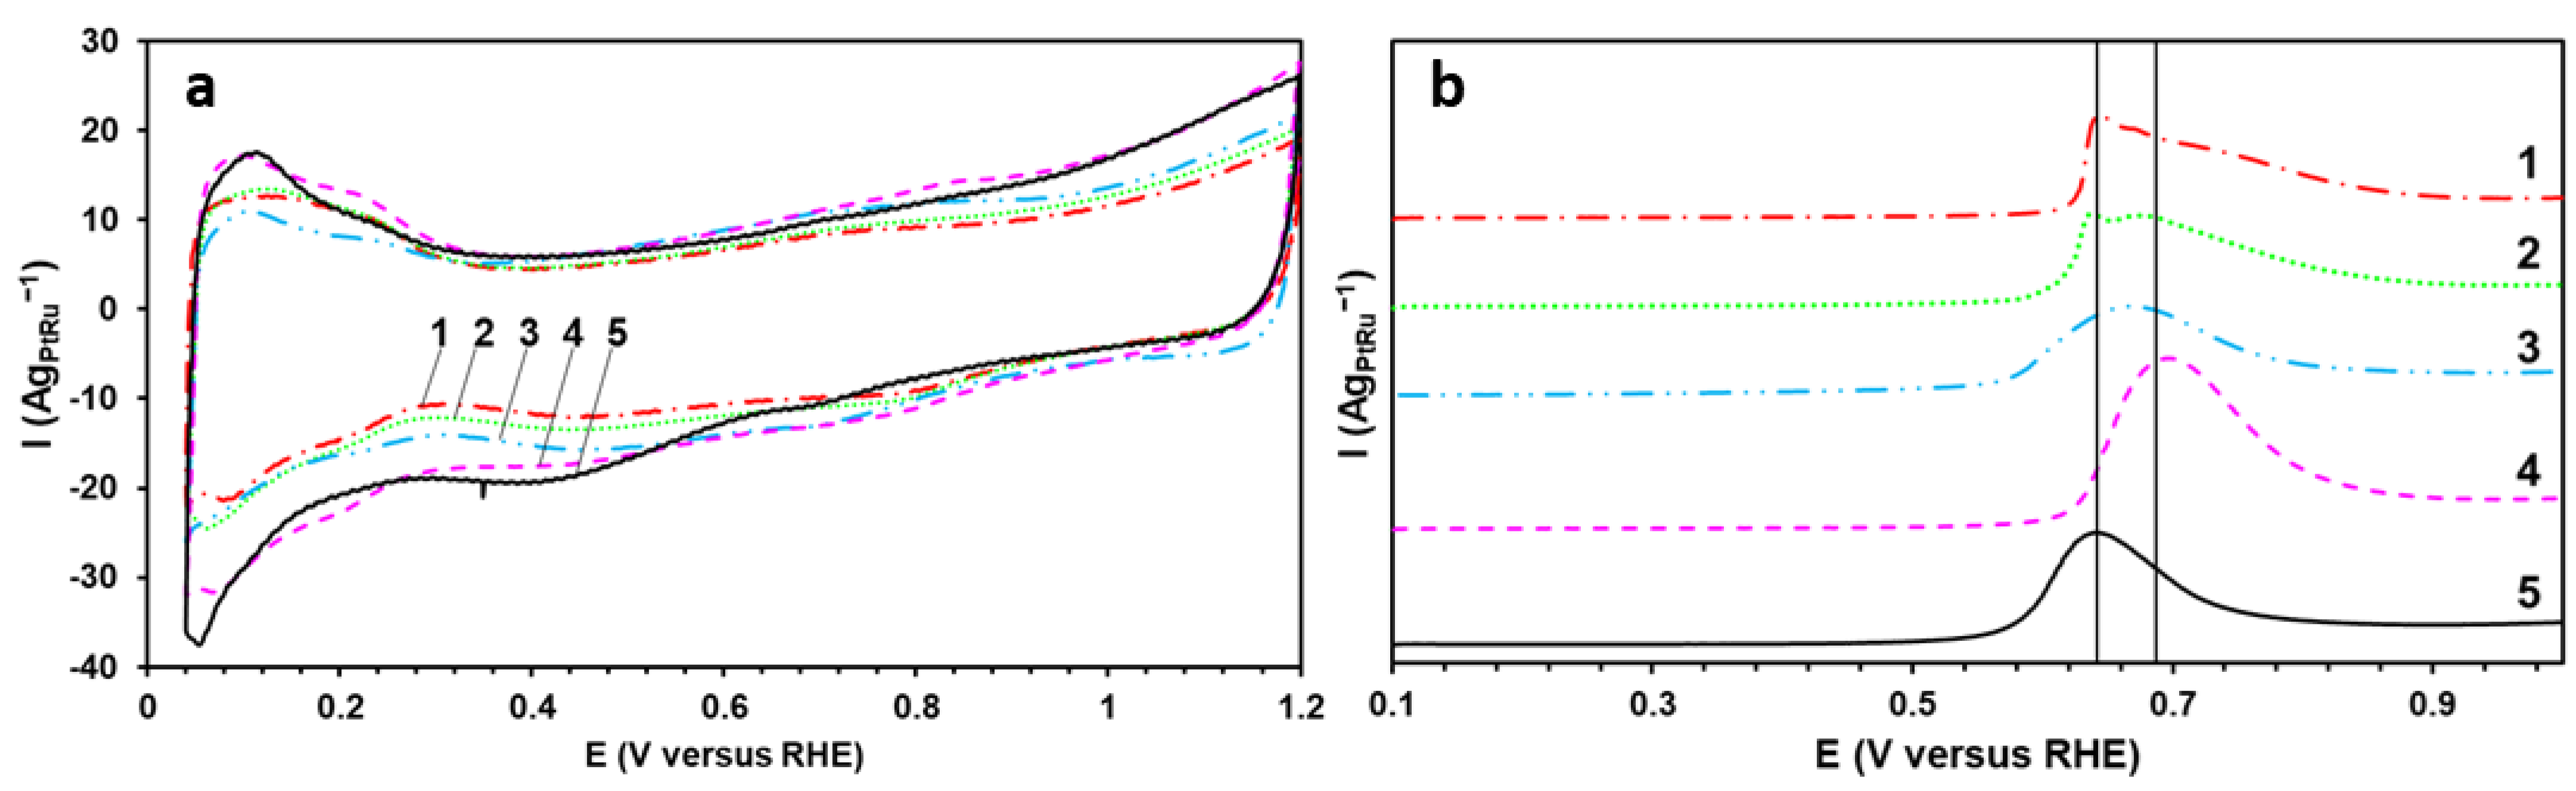
The CVs of the obtained materials have the appearance typical for the Pt-based catalysts (
Figure 4a). At the same time, all the studied samples demonstrate the higher current values in the double-layered region of the CVs of 0.3 to 0.6 V (
Figure 4a). The wide double-layered region proves the enrichment of the Pt-based catalysts’ surface with Ru atoms [
25,
26]. Since the same carbon support has been used for all the catalysts, the current value of the double layer is proportional to the number of the surface Ru atoms in this case [
26,
27]. The largest thickness of the double-layered region is typical for the commercial sample and the P material (
Figure 4a).
One of the key functional parameters of the Pt-based catalysts used in fuel cells is the FESA. However, due to the higher current values in the double-layered region of the CVs (
Figure 4a), the determination of the ESA by the adsorption/desorption of hydrogen is rather complicated [
26,
28]. Therefore, to determine the ESA value, the method to calculate the surface area by the oxidation of the chemisorbed CO monolayer has been used (
Figure 4b). The higher ESA value (~120 m
2g
PtRu−1) (
Table 2) for the P material is due primarily to the smaller size of NPs and the lower degree of the agglomeration (
Table 1). This also appears to be caused by the greater content of Pt and Ru atoms on the carbon support surface than for the other studied samples. The potentials in the beginning of the CO oxidation (
Figure 4b) for several studied catalysts have proved to be 200–300 mV less positive than for the commercial Pt/C sample (JM20), the study of which has been conducted in previous works [
3,
29]. This indicates the CO oxidation to be occurring more easily on the surface of the PtRu/C materials. This phenomenon may be due to both the electronic effect of Ru atoms, which reduce the energy of the Pt d-band and provide the higher robustness and rate of the CO oxidation [
30], and the implementation of the bifunctional catalysis mechanism [
12,
13,
14,
15,
16]. Notably, the BHC and BHA materials are characterized by the presence of two CO oxidation peaks at the potentials of 0.637 V and 0.675 V. The appearance of two peaks can testify to the presence of individual Pt and Ru NPs on the catalyst’s surface [
31,
32].
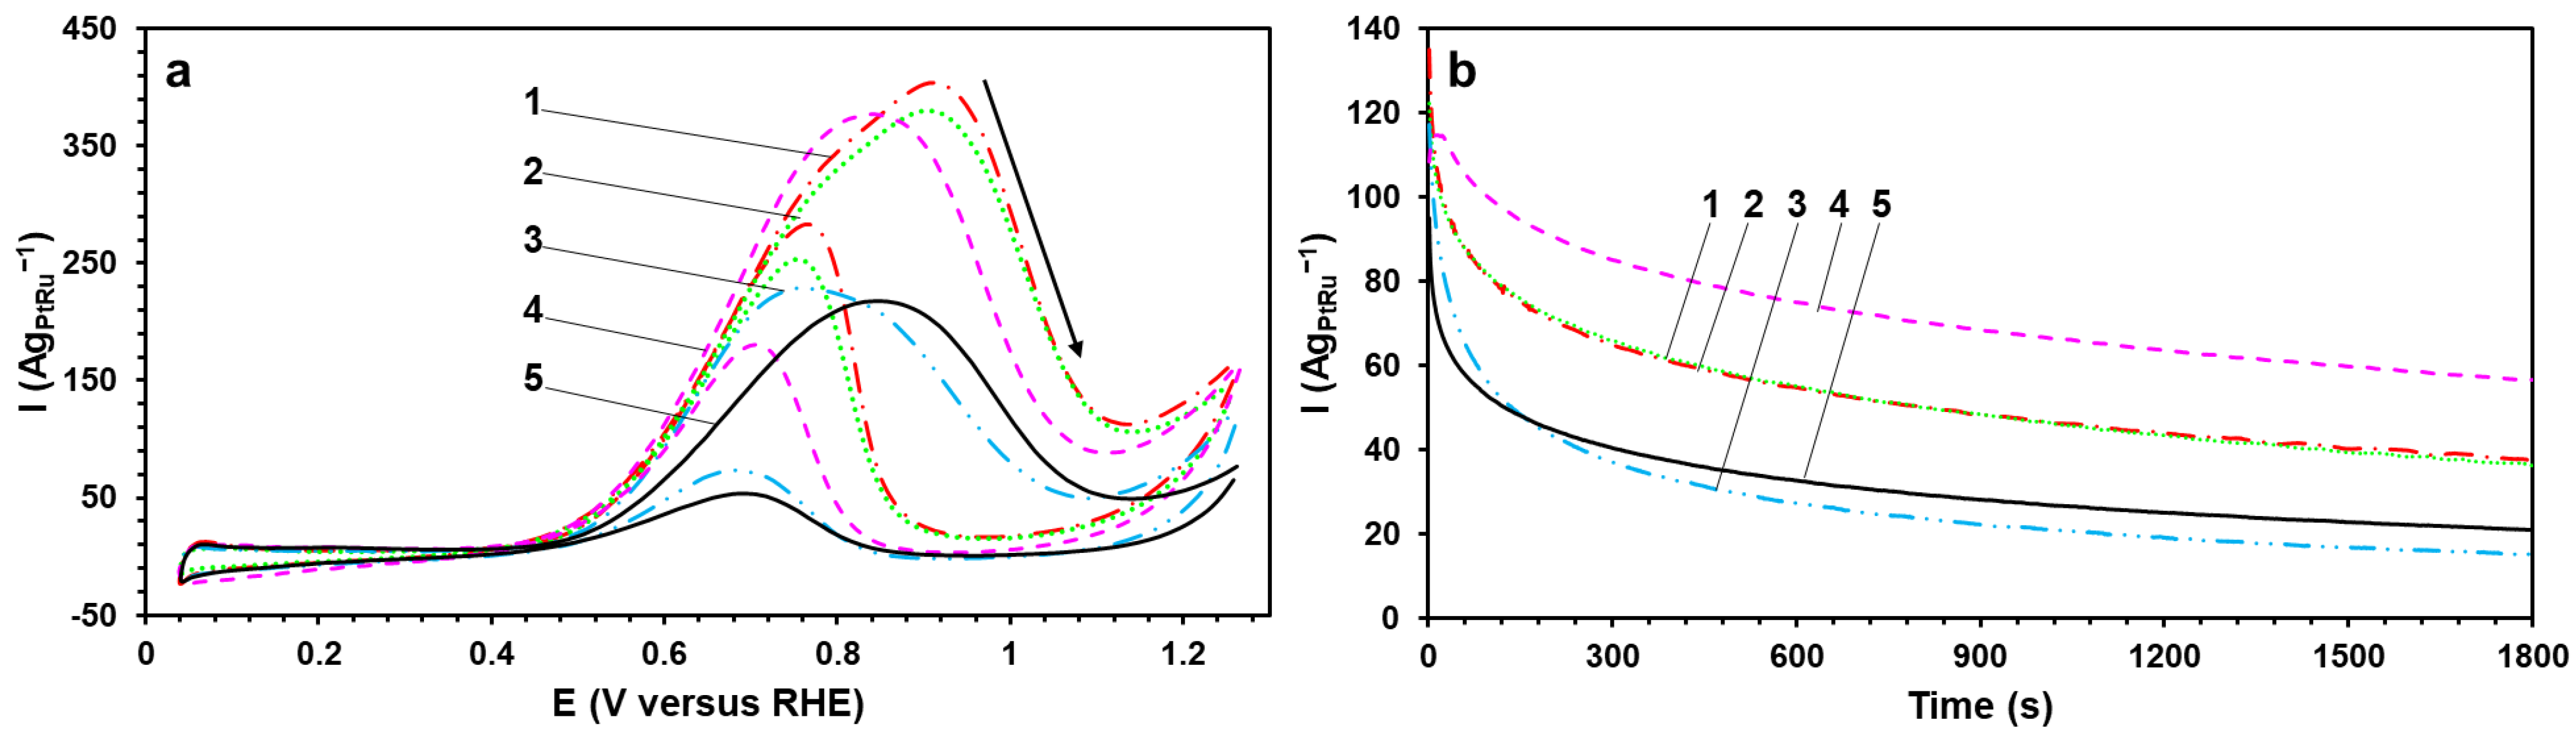
The MOR activity of the obtained catalysts has been estimated by the corresponding parameters of the direct methanol oxidation peak in the CVs (
Figure 5a). The direct peak (0.7–1.0 V) is due to the methanol adsorption on the catalyst’s surface and its successive dehydrogenation with the formation of the adsorbed particles [
33]. Furthermore, it is worthwhile to understand that the increase in the potential in the CVs leads to the accumulation of oxygen groups on the Pt surface and its “blocking” at the potential of the direct peak maximum (
Figure 5a). The BH, BHC, and P materials demonstrate the highest values of the charge amount consumed for the oxidation of methanol (Q
CH3OH) and the peak current density (I
max) (normalized to the masses of Pt and Ru). They are 1.5–2 times higher than for the commercial PtRu/C-AA catalyst. Interestingly, the potential values in the beginning of the oxidation of the direct peak for all the obtained catalysts are 100–200 mV less positive than for the commercial PtRu/C-AA sample (
Figure 5a). At the same time, the curves’ slope of the subsequent methanol oxidation at the potentials of 0.6–0.8 V for the obtained catalysts has the smaller angle and the larger steepness, which indicates the faster dehydrogenation of the CH
3OH molecule accompanied by the C–H bond breaking [
34].
The catalysts’ tolerance to intermediate products of the methanol oxidation (CO) has been estimated by the chronoamperometry method (
Figure 5b). At the initial time, the studied catalysts are characterized by close values of the current density (I
initial) (normalized to the masses of Pt and Ru). The current’s rapid decline on the curves during the first 100–200 s is due to the adsorption of different by-products of the methanol oxidation on the surface of the catalysts. After testing for 1800 s at the constant potential of 0.6 V (
Figure 5b), the P material has been proved to obtain the highest current value, which is almost double that for the commercial PtRu/C catalyst (I
final). The increased MOR activity and tolerance to CO of the P sample can be connected with the greater availability of Ru atoms on the catalyst’s surface compared with the other studied materials. The calculated poisoning rate (δ
CO) is predictive of the long-term tolerance to CO. The P material is characterized by the lowest δ
CO rate, which again confirms its high MOR activity and tolerance to intermediate products of the methanol oxidation.
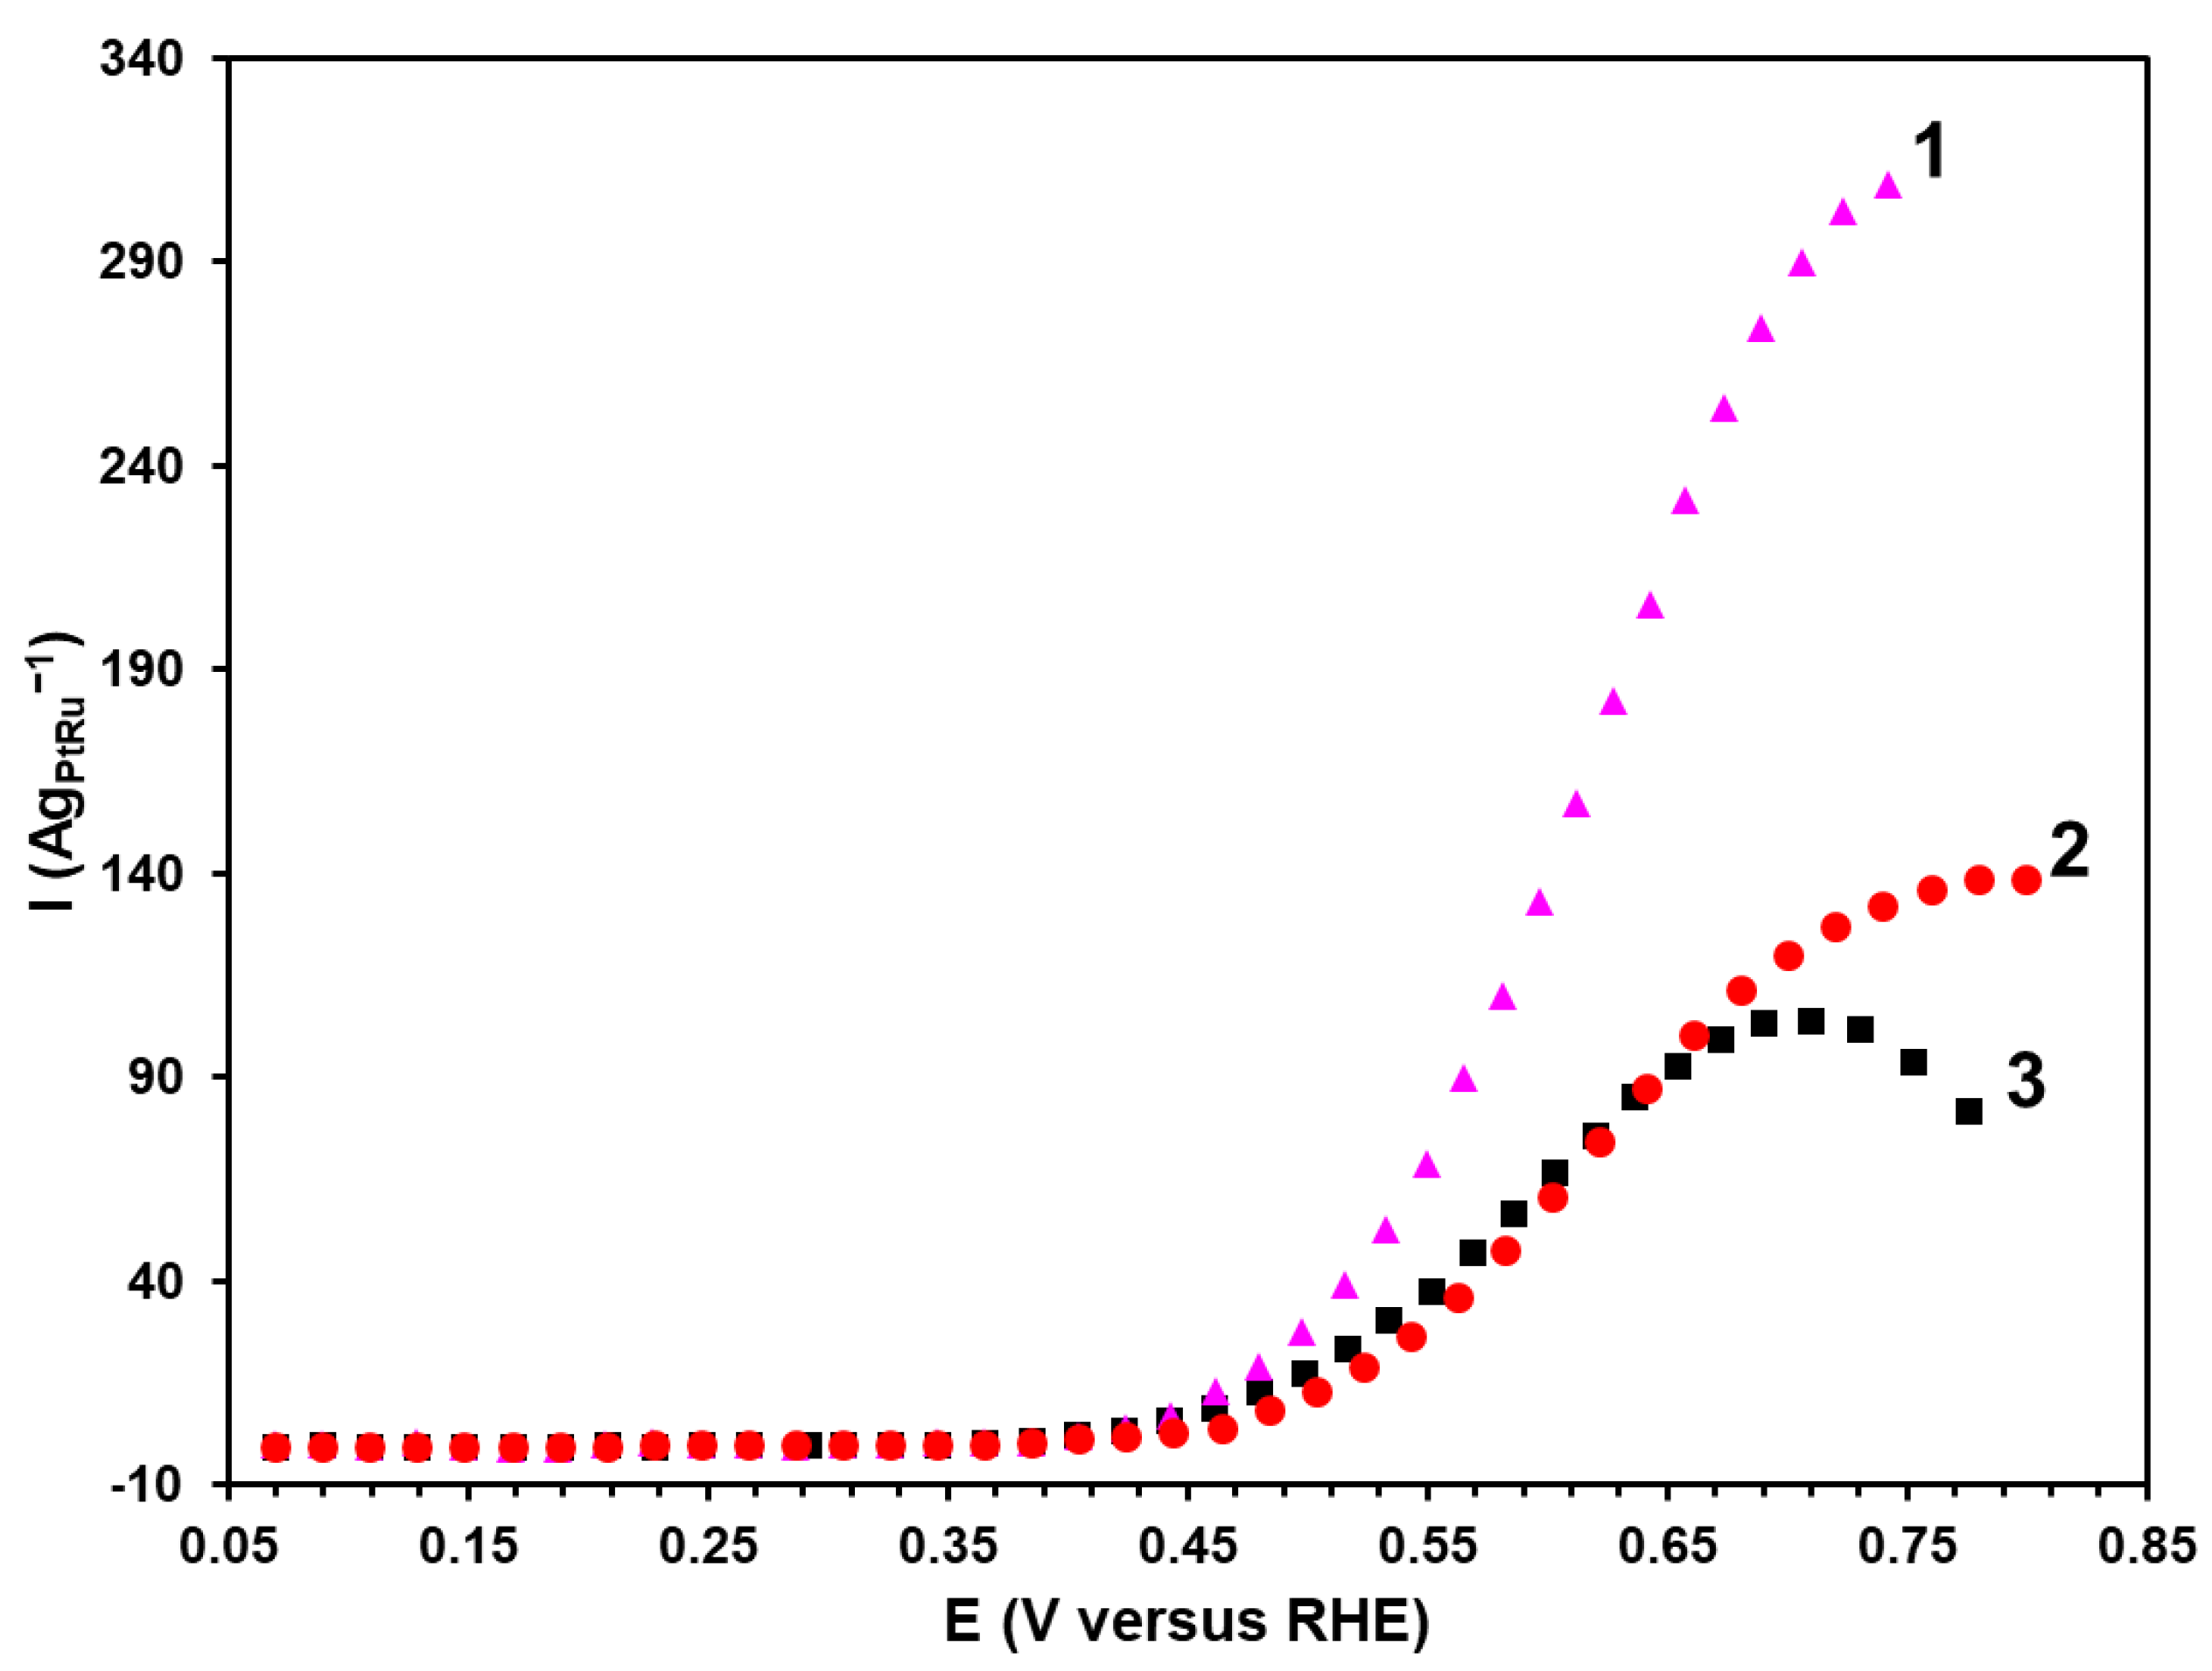
The experiments with the potentiostatic polarization are promising for studying the electrochemical oxidation of methanol since they allow for the direct comparison of the electrochemical performance due to the decreased contribution of the capacitive current [
35]. The most promising materials demonstrating the higher current values according to the results of chronoamperometry and CV of the methanol oxidation have been chosen for the potentiodynamic studies (
Figure 6). The potentiodynamic curves at the potential of about 0.45 V demonstrate a sharp increase in the current. This potential is referred to as the potential in the beginning of the oxidation (E
onset). The P material has been established to have the lowest E
onset value (0.44 V) compared with the BH samples (0.48 V) and the commercial PtRu/C catalyst (0.46 V). To compare the materials’ activity, the current values have been recorded at the potential of 0.6 V. In this regard, the P material is characterized by the highest value of the specific current (119 Ag
PtRu–1), which is twice as high as that for the commercial PtRu/C catalyst. Therefore, the results of the potentiodynamic studies are compliant with those obtained by chronoamperometry and illustrate the highest activity of the P material synthesized by the polyol method.
Therefore, the MOR activity and the tolerance to CO of the PtRu/C catalysts significantly depend on the synthesis method. In totality of characteristics, the material obtained by the polyol method is considered to be the best MOR catalyst. The smaller size of NPs and their more uniform distribution over the carbon support surface is conducive to the increase in the proportion of active centers both of Pt and Ru, thus largely enhancing the electrochemical characteristics of the P material in the methanol electrooxidation reaction compared with the commercial analogue and the materials synthesized by the borohydride method. The most common and generally accepted mechanism of methanol oxidation on the surface of binary PtRu/C catalysts is the electronic and/or bifunctional mechanism of catalysis. The first is the dissociation of methanol into Pt-(CO)
ads and H
ads on Pt, as well as the dissociation of water into Ru-OH and H
ads on Ru. Then Pt-(CO)
ads and Ru-OH react to form the final products CO
2 and H. In this way, Ru eliminates the appearance of the poisonous intermediate product CO [
25].
3. Materials and Methods
The synthesis of the PtRu/C catalysts was conducted in the liquid phase using ethylene glycol (the polyol method) or sodium borohydride (the borohydride method) as reducing agents. The Vulcan XC-72 carbon black (Cabot Corporation, the surface area by BET = 250–280 m2g−1) was used as the support. The commercial PtRu/C catalyst (Alfa Aesar) with the metals’ mass fraction of 60% and their ratio of 1:1 was used as the reference sample.
A weighed amount (0.15 g) of the Vulcan XC-72 carbon support was introduced with constant stirring into the mixture of ethylene glycol and bidistilled water in volumes of 40 and 20 mL, respectively. The carbon suspension was then dispersed. A weighed amount (0.0463 g) of RuCl3, 6.3 mL of H2PtCl6*6H2O with the concentration of 0.0179 gmL–1, and 2.2 mL of the aqueous 1 M NaOH solution (with the pH of about 11) were introduced into the carbon suspension. After 30 min of stirring, 10 mL of 0.1 M NaBH4 (reducing agent) was added. The mixture was kept at room temperature for 1 h with constant stirring. The obtained product was filtered with repeated rinsing with isopropyl alcohol and bidistilled water. The material was desiccator-dried over P2O5 for 24 h. The obtained PtRu/C catalyst is hereinafter referred to as BH.
The borohydride synthesis of the PtRu/C material using 0.5 mL of 1 M citric acid as the stabilizing agent, which was introduced into the system before the stage of introducing the reducing agent, was conducted similarly [
36]. The obtained PtRu/C catalyst is hereinafter referred to as BHC. As previously described [
36], in some instances, introducing the citric acid has a positive effect on the PtRu/C catalyst’s composition and structure and, thus, its activity.
The borohydride synthesis of the PtRu/C material with the introduction of ammonia to vary the pH value before introducing the reducing agent was conducted similarly. A weighed amount (0.0721 g) of RuCl3 was dissolved in hot bidistilled water at 60 °C for 1 h. A total of 9.8 mL of the H2PtCl6*6H2O solution with the concentration of 0.0179 gmL–1 and 0.15 g of the Vulcan XC-72 carbon support were then added with constant stirring. Next, the obtained suspension was dispersed. A total of 5 mL of the saturated aqueous ammonia solution was then added until the pH was equal to about 11. After 20 min, 15 mL of 0.1 M NaBH4 (reducing agent) was added with constant stirring and the reaction mixture was kept at 60 °C for 1 h. After the heating, the suspension was allowed to cool naturally to room temperature with constant stirring for about 30 min. After the natural cooling, the product was filtered with repeated rinsing with isopropyl alcohol and bidistilled water. The material was desiccator-dried over P2O5 for 24 h. The obtained PtRu/C catalyst is hereinafter referred to as BHA.
A weighed amount (0.2 g) of the Vulcan XC-72 carbon support was dispersed in 40 mL of ethylene glycol (reducing agent) [
37]. A total of 0.2327 g of H
2PtCl
6*6H
2O and 0.0934 g of RuCl
3 were then added with constant stirring. After 20 min of stirring, 0.1081 g of NaOH were introduced until the pH was equal to about 11. After 20 min, the reaction mixture was heated (in 15 min) to 160 °C with constant stirring (for the quickest possible heating, the PMS20 thermal medium, which was pre-heated to 160 °C and into which the reaction flask was immersed, was used). The reaction mixture was kept at this temperature for 3 h. Next, the heating was ceased and the mixture was left to cool to room temperature. After the natural cooling, the product was filtered with repeated rinsing with isopropyl alcohol and bidistilled water. The material was desiccator-dried over P
2O
5 for 24 h. The obtained PtRu/C catalyst is hereinafter referred to as P.
The metals’ mass fraction was determined by the thermogravimetry method from the mass of the unburned residue. A weighed amount of the studied sample was placed into the calcined crucible with the constant mass and heat-treated at 800 °C for 40 min. During the calculation of the mass fraction of Pt and PtRu, it should be taken into account that the unburned residue left after the calcination contains Pt and Ru oxide (IV).
The ratio of Pt:Ru in the obtained samples was determined by the X-ray fluorescence (XRF) analysis using the RFS-001 spectrometer (Research Institute of Physics, Southern Federal University, Russia). The analysis conditions were as follows: the voltage on the X-ray tube was 50 kV, the current was 150 μA, the anode’s material was molybdenum, the spectrum acquisition time was 300 s. The X-ray fluorescence spectra were recorded and processed using the UniveRS software (Southern Federal University, Russia).
The X-ray phase composition and the average crystallite size were determined by the X-ray powder diffraction (XRD) method using the ARL X’TRA powder diffractometer (Cu Kα). The analysis conditions were as follows: the experiment was conducted at room temperature and the angle range of 2θ was 15 to 55 degrees. The average crystallite size was determined by the Scherrer formula [
38]: D = Kλ/(FWHMcosθ), where K = 0.98 is the Scherrer’s constant, λ is the wavelength of the monochromatic radiation (in Å), FWHM is the reflex full width at half-maximum (in radians), D is the average crystallite size (nm), and θ is the angle of incidence (in radians).
The size of metal NPs and the features of their size and spatial distributions were studied by the transmission electron microscopy (TEM) method. The TEM micrographs were obtained using the JEOL JEM F200 microscope (the voltage of 200 kV, the current of 12–15 μA). A weighed amount (0.5 mg) of the sample was placed into 1 mL of isopropyl alcohol and dispersed with ultrasound for 10 min. A drop of the obtained suspension was deposited on the standard copper grid covered with the amorphous carbon layer with a thickness of 5–6 nm. The sample was then dried in air at room temperature for 60 min. The histograms of the NPs’ size distribution were plotted based on the results of the size determination of not less than 400 particles randomly selected in the micrographs in different sections of the sample.
The catalysts’ electrochemical behavior was studied in the three-electrode cell by the cycling voltammetry (CV) and chronoamperometry methods using the VersaSTAT 3 potentiostat. A platinum wire was used as the counter electrode whereas a silver-chloride electrode was used as the reference one. All the potentials used in this work were considered with regard to the reversible hydrogen electrode (RHE). Temperature during measurements was 25 °C. A weighed amount (0.0060 g) of the catalyst was placed into the mixture containing 100 μL of deionized water, 100 μL of the Nafion 0.5% aqueous solution, and 1800 μL of isopropyl alcohol (of extra-pure grade). The obtained suspension was dispersed with ultrasound for 5 min. At the same time, the process was monitored to make sure that the temperature of water would not exceed 20 °C. The suspension was then stirred using the magnetic stirrer for the same period of time. The dispersing was repeated several times. Next, an 8 μL aliquot of the inks was applied to the end face of the disk electrode. The electrode was dried at the rotation at room temperature.
The surface standardization was conducted in the 0.1 M electrolyte solution (HClO
4, Sigma Aldrich, St. Louis, MI, USA) saturated with argon at the atmospheric pressure in the potential range of 0.04–1.20 V at the rate of the potential sweep of 100 mVs
−1. To determine the ESA by the oxidation of the chemisorbed CO monolayer, the system was kept at the potential of 0.1 V. The electrolyte was saturated with CO for 20 min and then purged with argon for 40 min to remove the non-chemisorbed CO. Next, two cycles of the CV were measured, starting from the potential of 0.1 V. The ESA was determined by the following formula: ESA(CO
ad) = Q
CO/Rm1000, where Q
CO is the charge amount consumed for the oxidation of the chemisorbed CO monolayer in the voltammogram measured at the rate of the potential sweep of 40 mVs
−1 [
3,
29], R is the charge amount consumed for the oxidation of CO (420 μQ/cm
2), and m is the PtRu weight on the electrode (g).
The MOR activity of the catalysts was determined in 0.1 M HClO
4 with the introduction of the methanol solution until the concentration was equal to 0.5 M CH
3OH. The cyclic voltammograms (CVs) were recorded in the same way as when determining the ESA. Moreover, to estimate the activity, the generally accepted parameters were used [
3]: Q
CH3OH is the charge amount consumed for the oxidation of methanol in the direct course of the potential sweep, I
max is the maximum current density in the direct course of the potential sweep, and E
onset is the potential in the beginning of the oxidation of the direct anodic peak. The tolerance of the materials to CO was determined by the chronoamperometry method at the constant potential of 0.6 V, in regard to which the current values were estimated in the beginning of the experiment and after 30 min. To quantify the tolerance to CO, the δ
CO coefficient (the effective CO poisoning rate) was used [
36] and calculated by the following formula: δ
CO = 100/I
0 × (dI/dt)t > 500 s (%×s
–1), where (dI/dt)t > 500 s is the slope of the linear region of the current decay after 500 s of the experiment and I0 is the current in the beginning of the polarization back-extrapolated from the successive linear current decay. This criterion is considered to be integrated due to the fact that it allows both the I0 current value and the slope of the chronoamperogram after reaching the constant rate of the current decay to be taken into account. The potential in the beginning of the methanol oxidation was determined in the similar electrolyte solution by the anodic current–voltage curves. The current value was registered after 200 s of the polarization every 20 mV in the potential range of 0.05–0.80 V in regard to the RHE.
4. Conclusions
According to the approbation data in terms of different liquid-phase synthesis methods of the PtRu/C catalysts, the materials with the metals’ mass fraction of about 27% and the metals’ atomic ratio close to 1:1 have been obtained. Depending on the synthesis method, the average crystallite size and the average size of metal NPs change from 3.9 to 1.9 nm. At the same time, with the decrease in the average size of NPs, the ESA, respectively, grows from 65 to 120 m2gPtRu–1.
According to the results of testing the PtRu/C catalysts in the methanol electrooxidation reaction, it has been revealed that the synthesized P, BH, and BHC materials are characterized by close values of the MOR activity, which have been determined by the charge amount and the current values at the maximum of the direct peak.
The P, BH, and BHC materials exhibit high tolerance to intermediate products of the methanol oxidation exceeding that of the BHA sample and the commercial PtRu/C catalyst.
It has been established that the material obtained by the polyol method is characterized by the smallest average size of NPs, their narrow size dispersion, and their uniform spatial distribution over the carbon support surface. This sample is most promising for use in LTFCs as the anodic catalyst due to the highest ESA and the higher activity in the MOR compared with the other studied materials and the commercial PtRu/C-AA catalyst. Nevertheless, due to significant losses of the precious metals during the polyol synthesis, this method requires additional steps towards optimization.


