Communication

Detection of Hemoglobin Concentration Based on Defective One-Dimensional Photonic Crystals

by
Shiju Edappadikkunnummal
1,†,
Rahul Chembra Vasudevan
1,†,
Sruthy Dinesh
1,
Sheenu Thomas
1,
Narayana Rao Desai
2 and
Sharafudeen Kaniyarakkal
3,*
1
International School of Photonics, Cochin University of Science and Technology, Kochi 682022, India
2
School of Physics, University of Hyderabad, Hyderabad 500046, India
3
Department of Physics, Kuwait College of Science and Technology, Doha 35004, Kuwait
*
Author to whom correspondence should be addressed.
These authors contributed equally to this work.
Photonics 2022, 9(9), 660; https://doi.org/10.3390/photonics9090660
Submission received: 15 July 2022 / Revised: 2 September 2022 / Accepted: 13 September 2022 / Published: 16 September 2022
(This article belongs to the Special Issue Optical Sensing)

Abstract

:
The significance of the optical biosensor is its ability to detect biomolecules in their natural form. Among them, photonic crystal-based biosensors analyze the refractive index changes due to molecular interaction, and that is correlated to the sample concentration instead of sample mass. In this paper, we report the sensing performance of a one-dimensional photonic crystal-based sensor for the detection of hemoglobin concentration using an asymmetric periodic structure with a single defect. We have used the transfer matrix method to analyze the reflectance properties of the photonic crystal. The resonant dip in the spectra and its shift with hemoglobin concentration is the basis of our sensor design. The proposed sensor is efficient in sensing hemoglobin concentration, the sensitivity and other sensor parameters were derived numerically, and the obtained parameters are comparable to the many of the reported values of photonic crystal-based sensors. The dependence of the defect layer thickness on the position of resonant dips and sensitivity is also demonstrated in our work. The numerical results prove that these photonic crystal biosensors are simple, cost effective and highly accurate for detecting the hemoglobin concentration.

1. Introduction

The detection and sensing of various diseases and biological samples with high efficiency has been a challenge for decades. Optical refractive index biosensors are a class of biosensors that can possibly render sensors of improved efficiency [1]. These are based on photonic crystals, Bragg reflectors, surface plasmon resonance and long period fiber gratings. Very often, PCs have been found useful in the biomedical field as sensing devices. Photonic crystals are a novel class of dielectric devices which have shown beneficial developments in the recent decades [2]. They have been more advantageous than many electronic devices owing to the speed of light in such media. The bandgap in PCs prevents photons with energy there from moving through the material. For the purposes of photonic information technology, this offers the chance to control and manipulate the flow of light. Absorption or emission transitions are not the basis for PC characteristics. Instead, they are totally controlled by the periodicity of the index of refraction, which is scalable from submicron dimensions (to regulate UV/VUV light) to the centimeter scale (to control microwaves). PCs do not need to be scaled down to the tens of nanometer range because the wavelengths being regulated are often of the order of hundreds of nanometers or longer (visible to infrared) [3]. Photonic crystal devices in the near IR regime have generally very small dimensions around the order of 300–400 nm. Due to this reason, photonic crystals offer the ability to control light effectively and at the same time are suitable for chip-level integration. They can also incorporate wavelength-dependent functionalities over small operational volumes. These characteristics highlight the development of next-generation optoelectronic systems using PhCs [4,5].
Photonic crystals have been of immense research interest on account of their characteristic properties. The idea of photonic crystals and bandgap materials started from the remarkable works of Yablonvitch and John [6]. The peculiar properties of these special types of structures are photonic bandgaps and photon localization. These properties are the result of periodic modulation of the dielectric functions, which significantly modifies the spectra of electromagnetic waves passing through it [7]. PC structures can be used in various configurations. Of these, one-dimensional PC structures are more appealing than two and three-dimensional structures owing to their simple fabrication, low cost, and fewer parameters for optimization. The periodic permitivity modulations in this structures result in photonic bandgaps (PBGs) [8,9]. The existence of this photonic bandgap is responsible for various properties exhibited by the photonic crystal. These properties paved the way for various sensing applications including optical, physical and biomedical [10,11].
Hemoglobin is the prime component of blood. It plays a crucial role in various physiological process due to its association with the transport of oxygen and carbon-dioxide. Owing to this, it is significant to maintain proper hemoglobin concentrations in the blood. The diagnosis of hemoglobin concentrations can be reliable in the identification of such physiological processes [12,13]. There have been many conventional methods for detecting hemoglobin levels in the blood; often, these methods have been inaccurate with high costs. Consequently, there is immense research interest in developing simple, cost-effective and highly accurate optical biosensors. The development of photonic crystal sensors has been a new light toward the realization of these [14]. The optical properties and sensor parameters of these photonic crystal-based sensors have been studied using various computational techniques such as transfer matrix method, plane wave expansion, finite element method and finite difference time domain method [15,16].
In this paper, we present a one-dimensional photonic crystal-based optical biosensor for sensing and detection of the hemoglobin concentration. We used T i O 2 and S i O 2 as the dielectric materials of the 1D periodic structure with an asymmetric periodicity around the single defect layer. Fundamentally, the dependence of hemoglobin concentration on its refractive index is considered [15,17]. Here, we have performed the studies using the transfer matrix method and analyzed the reflection spectra for calculating variations in the hemoglobin concentration.

2. Theoretical Analysis

The schematic diagram of our proposed design based on a one-dimensional defective photonic crystal is depicted in Figure 1. In our design, the periodic structure consists of two different dielectric materials labeled A and B of thickness ( d 1 and d 2 ) and refractive index ( n 1 and n 2 ), respectively. There are a total of N periods for the periodic structure. The layer D is the defect layer, which has d d thickness and n d refractive index. This defect layer is sandwiched between the two periodic structures. There is a substrate layer (S) on one end and other end is air; the surrounding media also determines the characteristics of the structure.
Theoretical analysis of the reflectance properties is derived using the transfer matrix method [18]. The whole structure can be specified by a matrix equation [19]:
M ( w ) = F ( N a ) D ( d d ) L ( N a ) = M 11 M 12 M 21 M 22
The total characteristic matrix M is the product of three matrices. The first one describes the left periodic structure, and the last one represents the right periodic structure in between a defect layer matrix, which is denoted by D. The w in M ( w ) is the lattice period of the whole structure where w = a ( N + N ) and lattice constant a = d 1 + d 2 .
According to Abeles theory, the left periodic structure can be described by the matrix [19],
F ( a ) = f 11 f 12 f 21 f 22
the elements f 11 , f 12 , f 21 and f 22 are given by,
f 11 = c o s δ 1 c o s δ 2 p 2 p 1 s i n δ 1 s i n δ 2
f 12 = i p 1 s i n δ 1 c o s δ 2 i p 2 c o s δ 1 s i n δ 2
f 21 = i p 1 s i n δ 1 c o s δ 2 i p 2 c o s δ 1 s i n δ 2
f 22 = c o s δ 1 c o s δ 2 p 1 p 2 s i n δ 1 s i n δ 2
where
δ 1 = 2 π d 1 λ n 1 c o s θ 1 , δ 2 = 2 π d 2 λ n 2 c o s θ 2
and,
p 1 = n 1 c o s θ 1 , p 2 = n 2 c o s θ 2
For N period, the matrix is given by,
F ( N a ) = F 11 F 12 F 21 F 22
the elements in F ( N a ) can be related to the single period matrix elements by,
F 11 = f 11 U N 1 ( Ψ ) U N 2 ( Ψ )
F 12 = f 12 U N 1 ( Ψ )
F 21 = f 21 U N 1 ( Ψ )
F 22 = f 22 U N 1 ( Ψ ) U N 2 ( Ψ )
where
Ψ = 1 2 ( f 11 + f 22 ) , U N ( Ψ ) = s i n ( ( N + 1 ) c o s 1 Ψ ) 1 Ψ 2
Next, the matrix of the defect (D) is given by,
D ( d d ) = c o s δ d s i n δ d i p d i p d s i n δ d c o s δ d
where
δ d = 2 π d d λ n d c o s θ d , p d = n d c o s θ d
The matrix of the right periodic structure is similar to that of the left one, which is obtained earlier in (Equation (9)). From these three matrices, we obtain the whole characteristic matrix of the structure (Equation (1)), which enables us to calculate the reflection coefficient (r),
r = ( M 11 + M 12 j s ) j 0 ( M 21 + M 22 j s ) ( M 11 + M 12 j s ) j 0 + ( M 21 + M 22 j s )
where
j 0 = ϵ 0 μ 0 n 0 c o s θ 0 , j s = ϵ 0 μ 0 n s c o s θ s
Finally, the reflectance is given by,
R = r 2

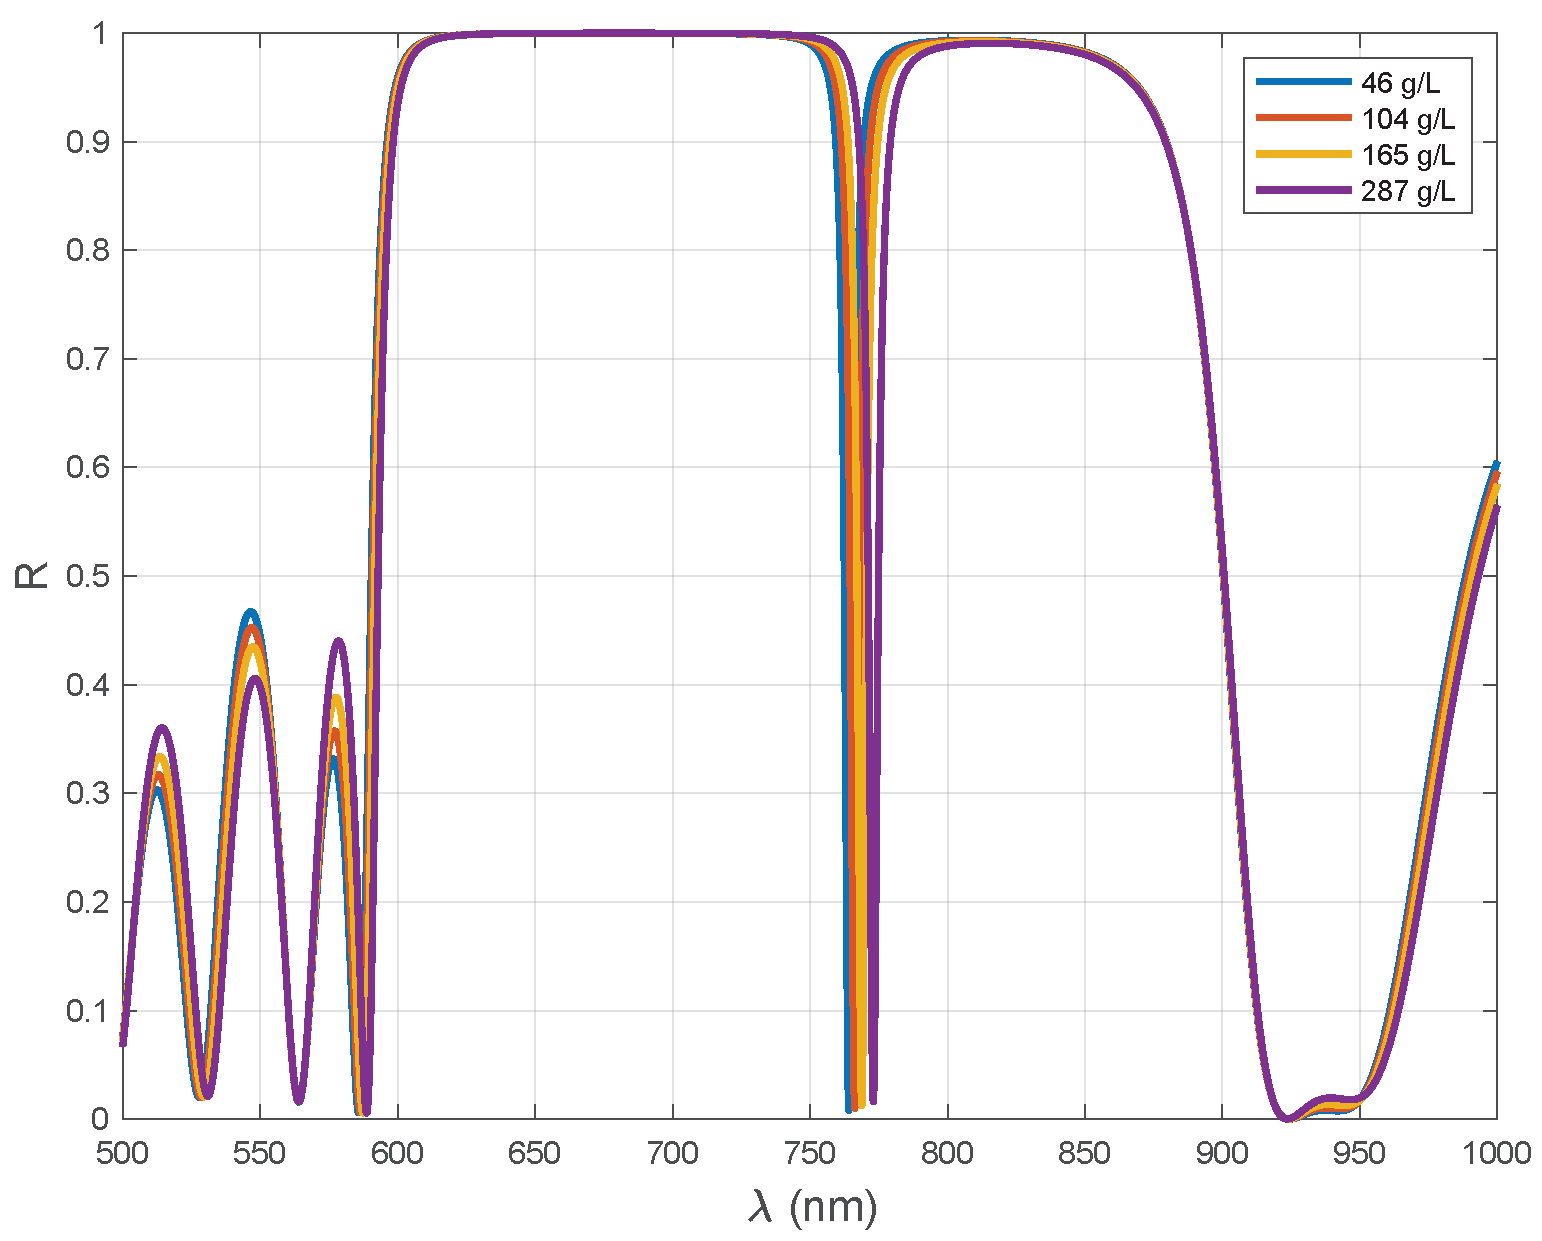
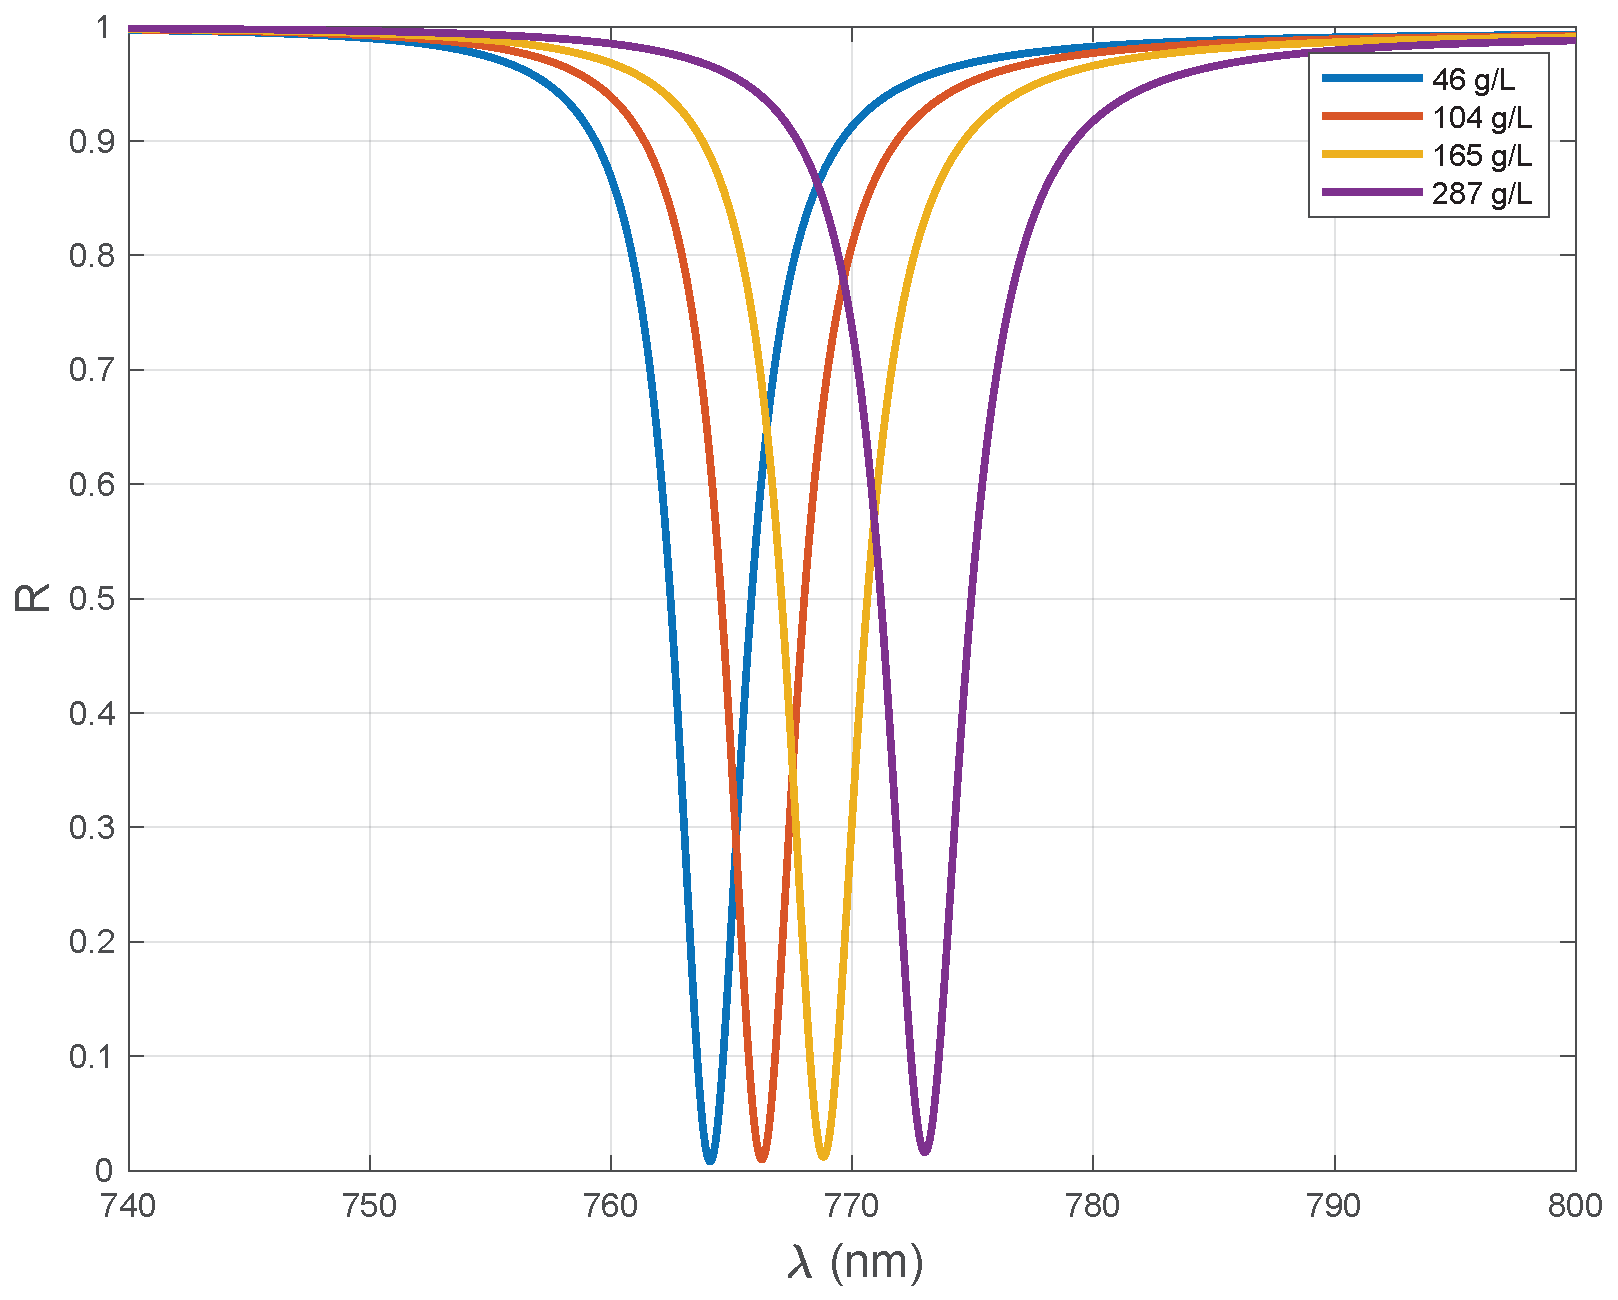
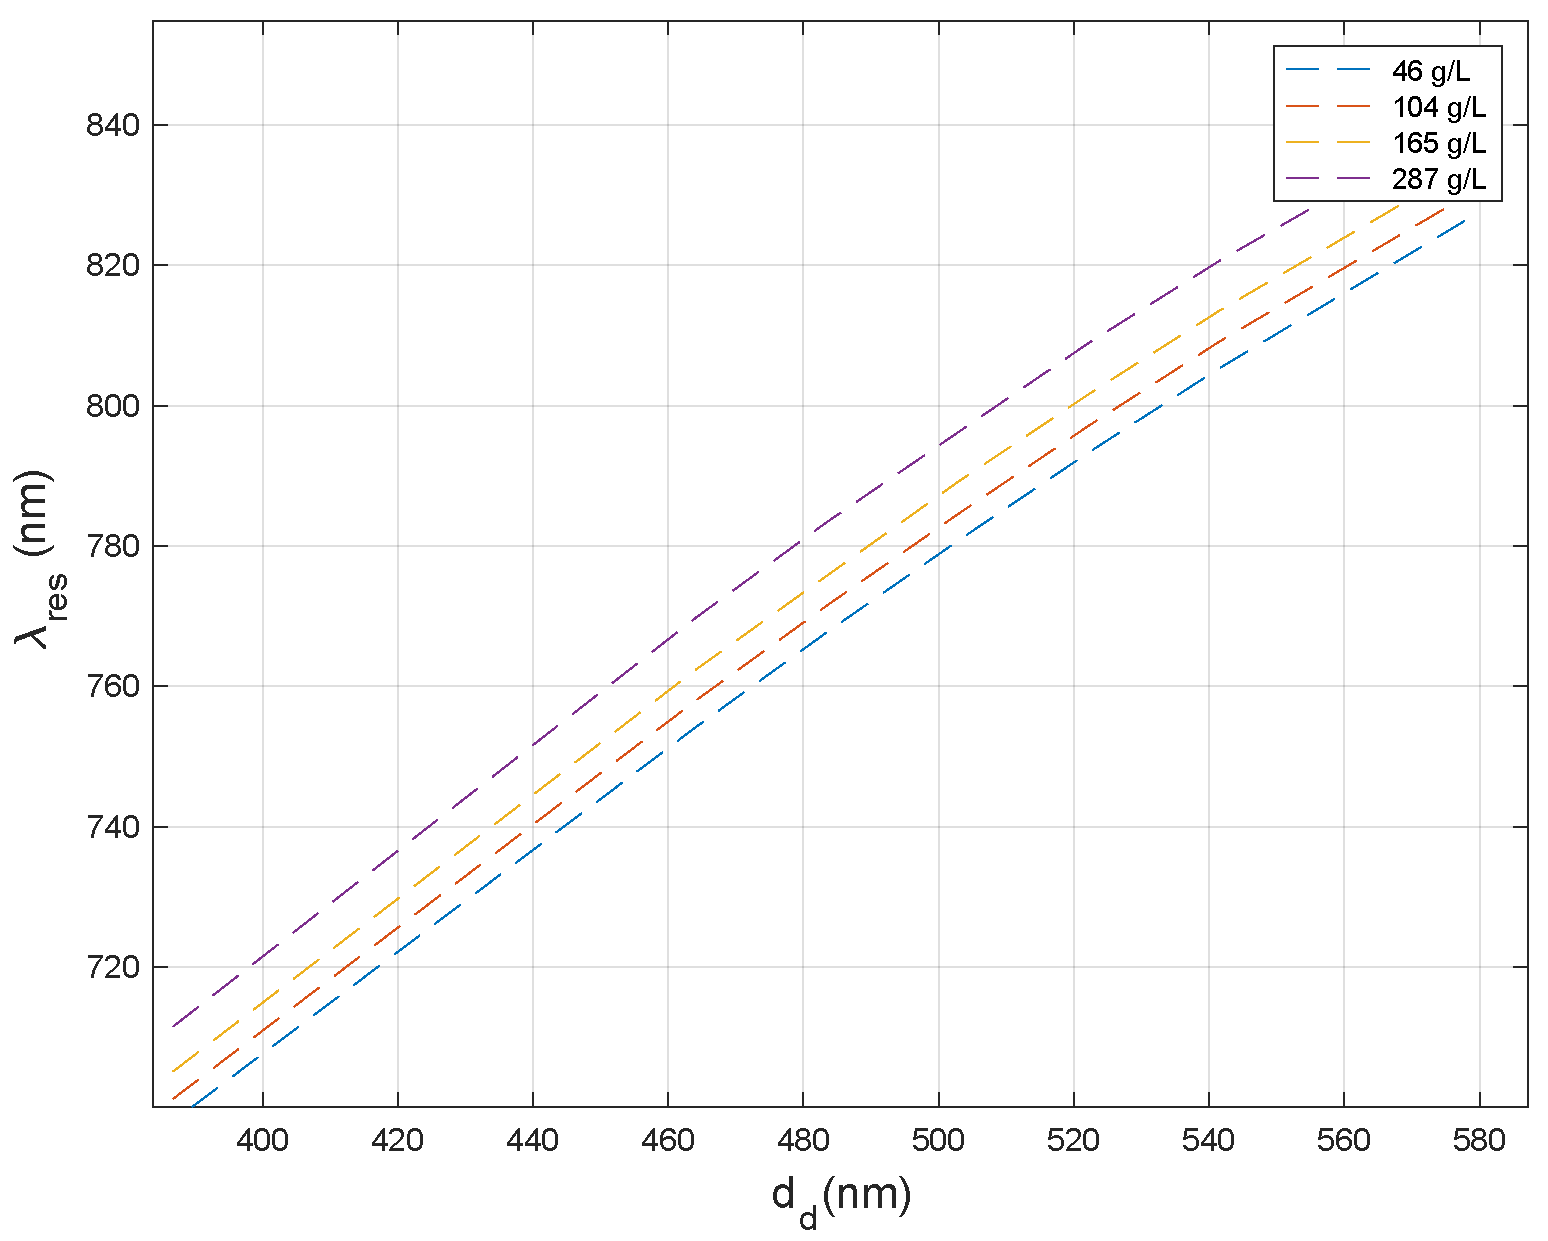
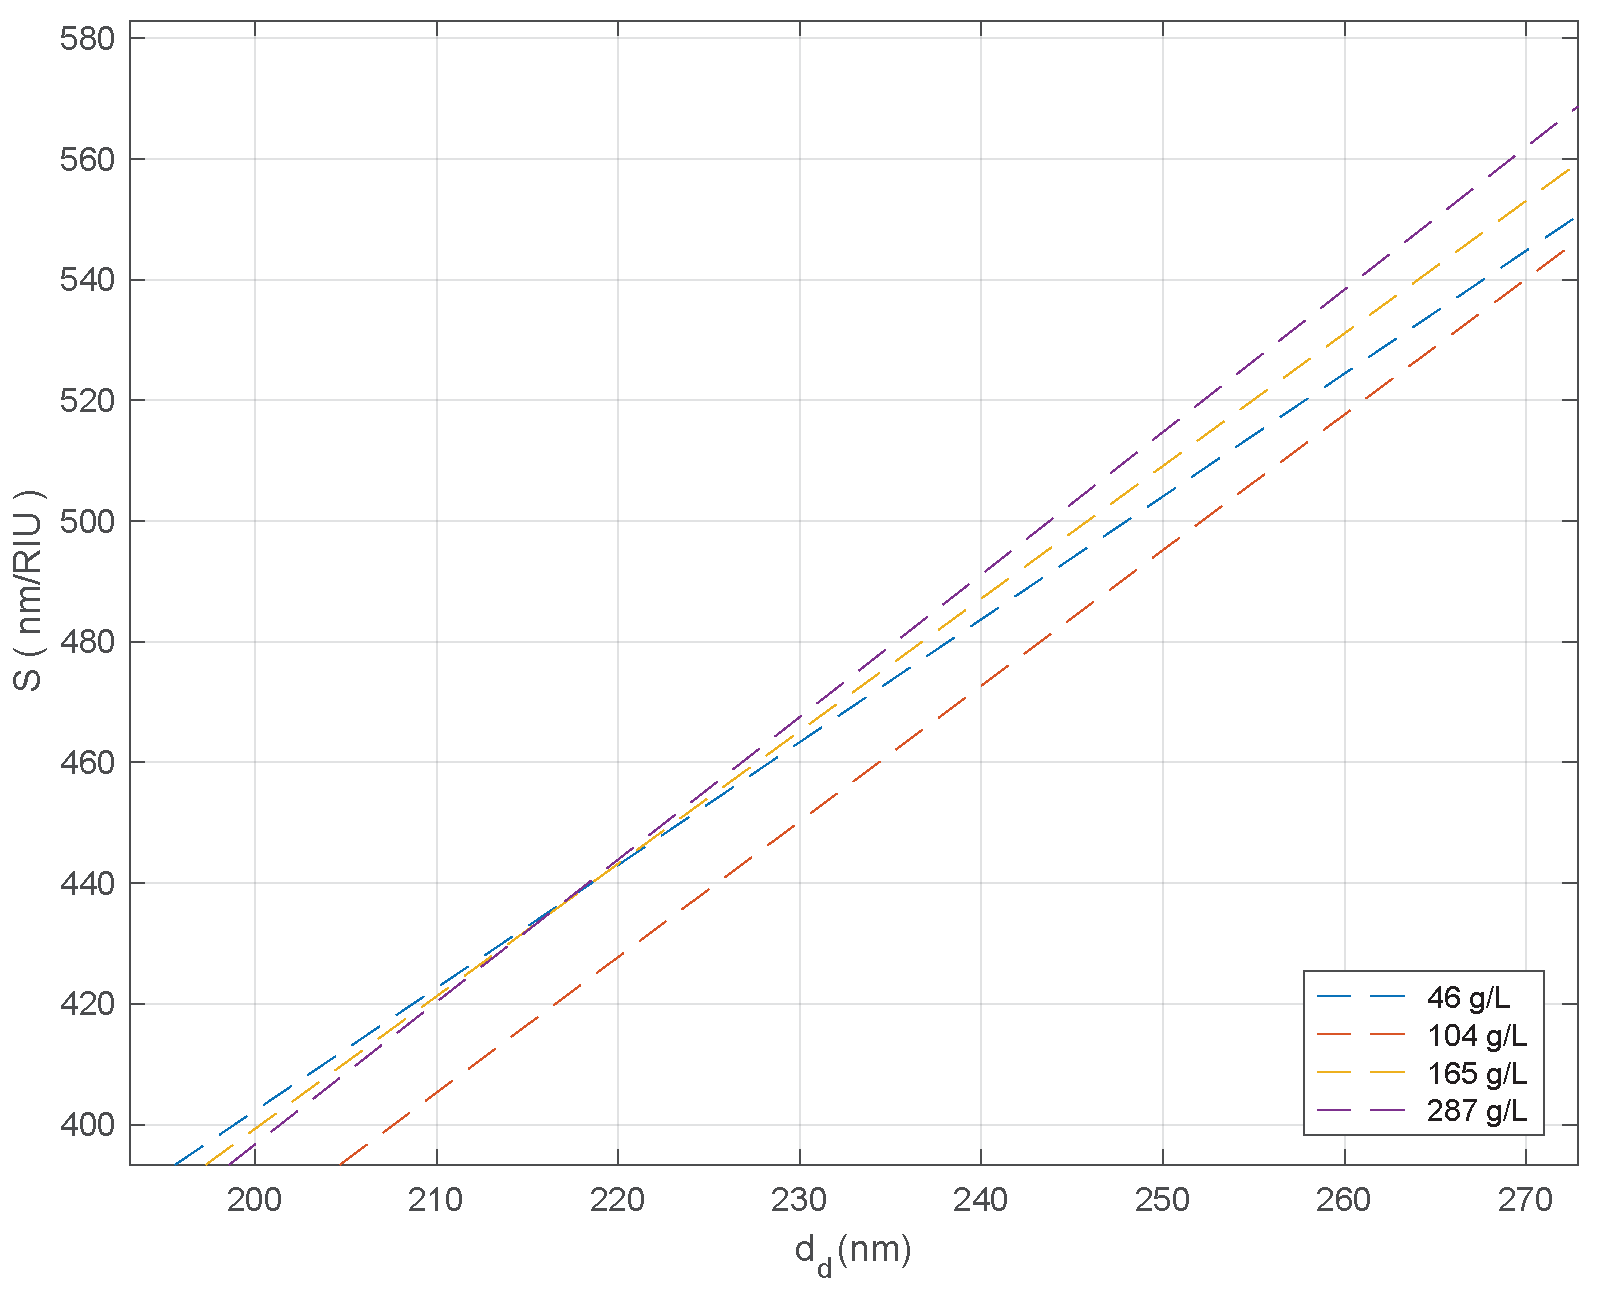
3. Results and Discussion

In this section, we had analyzed the numerical results of reflection properties of the proposed sensor design given in Figure 1. We focused on the reflectance properties in the visible light region for the normal incidence of TE mode [20]. The shift of resonant dip in the photonic bandgap due to the presence of the defect layer is measured. Based on the refractive index of the sample, there is a shift of resonant dip as well as change in its intensity, which eventually corresponds to a particular hemoglobin concentration.
In our proposed sensor structure given in Figure 1, we chose T i O 2 as layer A with a thickness of d 1 and the refractive index given [21] by the Sellmiers equation,
n T i O 2 2 = 1 + 4.6796 λ 2 λ 2 0.00400086
The layer B is of S i O 2 , with a thickness d 2 and refractive index n 2 = 1.47 . The choice of material was based on the experimnetal results obtained by Jena et al. [22]. The dispersion curves versus wavelength show that the lower band edge varies with the increase in angle of incidence, and the structure offers a huge bandwidth. We have used a quarter wavelength thickness for layers A and B ( n 1 d 1 = n 2 d 2 = λ 0 4 ) , with a design wavelength λ 0 = 700 nm. This structure is composed of N periods, where N = 5, which is the number of periodic dielectric structures on both sides of the defect. The defect layer thickness is given by d d and refractive index n d ; here, d d = k ( d 1 + d 2 ) , where k = 1 , 2 , 3 . We have used glass as a substrate with a refractive index of n s = 1.524 . In a perfect photonic crystal without defects, we observe a pure bandgap, and when the defect is introduced, it leads to localization of the defect modes, and a certain dip is obtained in the reflectance spectra. The defect sample we introduce is hemoglobin solution of different concentrations. The refractive index of hemoglobin solution depends on its concentration, and the variation is taken from a model function from ref [23].
Investigating the reflectance properties of the proposed design with samples of different hemoglobin concentrations, we observed a red shift in resonant peak with increase in concentration. For the defect layer as air, the resonant peak in Figure 2 was observed at 714.7 nm, and it shifts to 764.1 nm, 773 nm for hemoglobin solution of 46 g/L and 287 g/L concentrations, respectively.
In Figure 3, we can see the reflectance spectra of our proposed design with defect samples of various hemoglobin concentrations. Analyzing the spectra in detail in Figure 4, we can see the shift of resonant dip to a higher wavelength region with the increment in hemoglobin concentration. Apart from the shift, the intensity of the dip almost remains unchanged.
For a change in refractive index of 0.341, there is a shift of 49.3 nm in the resonant modes. This shift can be explained as the result of the central wavelength dependence on the refractive index and thickness of the defect layer. Based on quarter wavelength thickness, the change in refractive index produces the shift in the resonant dip position, resulting from the Bragg scattering of incident waves [20]. This is the key idea used in this model. From Table 1, we observed that the proposed design is very sensitive to variation in refractive index. From Figure 5, it is observed that when we vary the thickness of defect layer, there is a linear change in the position of resonant dips for different hemoglobin concentrations. This response is due to the strong dependence of the central wavelength also on the thickness of the defect layer. This inference provides a key to improve the sensitivity of the sensor by means of increasing the defect layer thickness.
Sensitivity is a significant factor that determines the efficiency of a sensor, which can be calculated from the following equation.
S = Δ λ r e s Δ n
where Δ λ r e s is the shift in resonant wavelength for a change in refractive index Δ n . In this case, we calculate the change in wavelength of resonant peak taking air as the reference. Table 2 shows the calculated sensitivity for various hemoglobin concentrations. Our calculated value of sensitivity was 144.50 nm/RIU for 44 g/L, which is much higher than the previously reported value of a one-dimensional photonic crystal-based sensor for hemoglobin detection and sensing [24].
Apart from sensitivity, we calculated some other performance parameters of our refractive index sensor [25], as shown in Table 2.
The detection limit ( δ n ) is the smallest change in refractive index that can be detected with our sensor; it is the ratio of sensor resolution to sensitivity(s) [26].
δ n = S R S
where sensor resolution (SR) is the smallest spectral shift that can be measured, and it is given by
S R = Δ λ 1 2 1.5 ( S N R ) 1 4
where Δ λ 1 2 is the spectral half width of the resonant dip, and the signal to noise ratio (SNR) is given by,
S N R = Δ λ r e s Δ λ 1 2
where Δ λ r e s is the shift in wavelength of the resonant dip. The figure of merit (FOM) is obtained by the taking the ratio of sensitivity to the spectral half width of resonant dip,
F O M = S Δ λ 1 2
From Figure 6, it is clear that sensitivity is increasing as we increase the defect layer thickness; this develops a path for improving the sensitivity of the proposed sensor. This linear increase for various defect thickness implies the novelty of our sensor structure to detect hemoglobin concentration [25].

4. Conclusions

In this paper, we theoretically explored the possibility of defective one-dimensional photonic crystal as a refractive index sensor. We focused our study on the usage of this structure to detect the hemoglobin concentration in the blood sample. Reflectance characteristics were studied using the transfer matrix method, and we obtained a sensitivity of 144.50 nm/RIU for 46 g/L hemoglobin concentration. The position of the resonant dip shifts as the concentration changes, which signifies the dependence of refractive index on the hemoglobin concentration. The defect layer thickness also plays an important role in increasing the sensitivity and other parameters, which can be utilized for improving the proposed sensor for measuring hemoglobin concentrations with higher accuracy and stability. The proposed optical biosensor design is found to be a cost effective, simple, and very effective non-invasive way for observing hemoglobin concentration in blood with an ease of sensor fabrication.

Author Contributions

Conceptualization, S.E., R.C.V., S.D., S.T., N.R.D. and S.K.; methodology, S.E., R.C.V., S.D., S.T., N.R.D. and S.K.; software, R.C.V., S.D. and S.E.; validation, S.E., S.T., N.R.D. and S.K.; formal analysis, S.E., R.C.V., S.D., S.T., N.R.D. and S.K.; resources, S.E., R.C.V., S.D., S.T., N.R.D. and S.K.; data curation, S.E., R.C.V. and S.D.; writing—original draft preparation, S.E., R.C.V., S.D., S.T., N.R.D. and S.K.; writing—review and editing, S.E., R.C.V., S.D., S.T., N.R.D. and S.K.; supervision, S.E., S.T., N.R.D. and S.K.; project administration, S.E., S.T., N.R.D. and S.K.; funding acquisition, S.E., S.T., N.R.D. and S.K. All authors have read and agreed to the published version of the manuscript.

Funding

Kuwait Foundation for the Advancement of Sciences, Kuwait, grant number PR18-14SP-11.

Institutional Review Board Statement

Not applicable.

Informed Consent Statement

Not applicable.

Data Availability Statement

Data underlying the results presented in this paper are not publicly available at this time but may be obtained from the corresponding author upon reasonable request.

Acknowledgments

S.E. acknowledges SERB, India for providing financial assistance through NPDF (PDF/2020/002494). S.K. acknowledges KFAS, Kuwait for the research grant (PR18-14SP-11). D.N.R. acknowledges the DAE, India for Raja Ramanna Fellowship.

Conflicts of Interest

The authors declare no conflict of interest.

References

  1. Joannopoulos, J.D.; Johnson, S.G.; Winn, J.N.; Meade, R.D. Photonic Crystals: Molding the Flow of Light, 2nd ed.; Princeton University Press: Princeton, NJ, USA, 2008. [Google Scholar]
  2. Pitruzzello, G.; Krauss, T.F. Photonic crystal resonances for sensing and imaging. J. Opt. 2018, 20, 073004. [Google Scholar] [CrossRef]
  3. Bouzidi, A.; Bria, D.; Akjouj, A.; Pennec, Y.; Djafari-Rouhani, B. A tiny gas-sensor system based on 1D photonic crystal. J. Phys. Appl. Phys. 2015, 48, 495102. [Google Scholar] [CrossRef]
  4. Ciminelli, C.; Dell’Olio, F.; Brunetti, G.; Conteduca, D.; Armenise, M.N. New microwave photonic filter based on a ring resonator including a photonic crystal structure. In Proceedings of the 2017 19th International Conference on Transparent Optical Networks (ICTON), Girona, Spain, 2–6 July 2017; pp. 1–4. [Google Scholar] [CrossRef]
  5. Prather, D.W. Photonic Crystals: An Engineering Perspective. Opt. Photon. News 2002, 13, 16–19. [Google Scholar] [CrossRef]
  6. Yablonovitch, E. Inhibited Spontaneous Emission in Solid-State Physics and Electronics. Phys. Rev. Lett. 1987, 58, 2059–2062. [Google Scholar] [CrossRef] [PubMed]
  7. Yeh, P.; Hendry, M. Optical Waves in Layered Media. Phys. Today 1990, 43, 77. [Google Scholar] [CrossRef]
  8. Singh, B.K.; Tiwari, S.; Chaudhari, M.K.; Pandey, P.C. Tunable photonic defect modes in one-dimensional photonic crystals containing exponentially and linearly graded index defect. Optik 2016, 127, 6452–6462. [Google Scholar] [CrossRef]
  9. El-Khozondar, H.J.; Mahalakshmi, P.; El-Khozondar, R.J.; Ramanujam, N.; Amiri, I.; Yupapin, P. Design of one dimensional refractive index sensor using ternary photonic crystal waveguide for plasma blood samples applications. Phys. E Low-Dimens. Syst. Nanostructures 2019, 111, 29–36. [Google Scholar] [CrossRef]
  10. Sreekanth, K.V.; Zeng, S.; Yong, K.T.; Yu, T. Sensitivity enhanced biosensor using graphene-based one-dimensional photonic crystal. Sens. Actuators B Chem. 2013, 182, 424–428. [Google Scholar] [CrossRef]
  11. Abadla, M.M.; Tabaza, N.A.; Tabaza, W.; Ramanujam, N.; Joseph Wilson, K.; Vigneswaran, D.; Taya, S.A. Properties of ternary photonic crystal consisting of dielectric/plasma/dielectric as a lattice period. Optik 2019, 185, 784–793. [Google Scholar] [CrossRef]
  12. Beutler, E.; Waalen, J. The definition of anemia: What is the lower limit of normal of the blood hemoglobin concentration? Blood 2006, 107, 1747–1750. [Google Scholar] [CrossRef]
  13. Hoff, C.M. Importance of hemoglobin concentration and its modification for the outcome of head and neck cancer patients treated with radiotherapy. Acta Oncol. 2012, 51, 419–432. [Google Scholar] [CrossRef] [PubMed]
  14. Ramanujam, N.; El-Khozondar, H.J.; Dhasarathan, V.; Taya, S.A.; Aly, A.H. Design of one dimensional defect based photonic crystal by composited superconducting material for bio sensing applications. Phys. B Condens. Matter 2019, 572, 42–55. [Google Scholar] [CrossRef]
  15. Guo, S.; Albin, S. Simple plane wave implementation for photonic crystal calculations. Opt. Express 2003, 11, 167–175. [Google Scholar] [CrossRef] [PubMed]
  16. Fu, Y.L.; Deng, C.S.; Ma, S.S. Design and analysis of refractive index sensors based on slotted photonic crystal nanobeam cavities with sidewall gratings. Appl. Opt. 2020, 59, 896–903. [Google Scholar] [CrossRef] [PubMed]
  17. Elsayed, H.A.; Mehaney, A. A new method for glucose detection using the one dimensional defective photonic crystals. Mater. Res. Express 2018, 6, 036201. [Google Scholar] [CrossRef]
  18. Aly, A.; Elsayed, H.; Malek, C. Defect modes properties in one-dimensional photonic crystals employing a superconducting nanocomposite material. Opt. Appl. 2018, 48. [Google Scholar]
  19. Born, M.; Wolf, E.; Bhatia, A.B.; Clemmow, P.C.; Gabor, D.; Stokes, A.R.; Taylor, A.M.; Wayman, P.A.; Wilcock, W.L. Principles of Optics: Electromagnetic Theory of Propagation, Interference and Diffraction of Light, 7th ed.; Cambridge University Press: Cambridge, UK, 1999. [Google Scholar] [CrossRef]
  20. El-Aziz, O.A.A.; Elsayed, H.A.; Sayed, M.I. One-dimensional defective photonic crystals for the sensing and detection of protein. Appl. Opt. 2019, 58, 8309–8315. [Google Scholar] [CrossRef]
  21. Bodurov, I.; Vlaeva, I.; Viraneva, A.; Yovcheva, T.; Sainov, S. Modified design of a laser refractometer. Nanosci. Nanotechnol. 2016, 16, 31–33. [Google Scholar]
  22. Jena, S.; Tokas, R.; Sarkar, P.; Misal, J.; Maidul Haque, S.; Rao, K.; Thakur, S.; Sahoo, N. Omnidirectional photonic band gap in magnetron sputtered TiO2/SiO2 one dimensional photonic crystal. Thin Solid Film. 2016, 599, 138–144. [Google Scholar] [CrossRef]
  23. Friebel, M.; Meinke, M. Model function to calculate the refractive index of native hemoglobin in the wavelength range of 250-1100 nm dependent on concentration. Appl. Opt. 2006, 45, 2838–2842. [Google Scholar] [CrossRef]
  24. Abadla, M.M.; Elsayed, H.A. Detection and sensing of hemoglobin using one-dimensional binary photonic crystals comprising a defect layer. Appl. Opt. 2020, 59, 418–424. [Google Scholar] [CrossRef] [PubMed]
  25. White, I.M.; Fan, X. On the performance quantification of resonant refractive index sensors. Opt. Express 2008, 16, 1020–1028. [Google Scholar] [CrossRef] [PubMed]
  26. Bijalwan, A.; Rastogi, V. Gold–aluminum-based surface plasmon resonance sensor with a high quality factor and figure of merit for the detection of hemoglobin. Appl. Opt. 2018, 57, 9230–9237. [Google Scholar] [CrossRef] [PubMed]
Figure 1. Schematic diagram of one-dimensional defective photonic crystal of asymmetric geometry ( A B ) N D ( A B ) N S .
Photonics 09 00660 g001
Figure 2. Reflectance spectra of our design at normal incidence with defect layer as air.
Photonics 09 00660 g002
Figure 3. Reflectance spectra of hemoglobin sample-filled structure.
Photonics 09 00660 g003
Figure 4. Reflectance spectra of the sensor for different hemoglobin concentration.
Photonics 09 00660 g004
Figure 5. Effect of defect layer thickness on resonant dip position.
Photonics 09 00660 g005
Figure 6. Variation of sensitivity with the defect layer thickness for different hemoglobin concentrations.
Photonics 09 00660 g006
Table 1. Variation of resonant dip position, wavelength shift and spectral half width with various hemoglobin concentrations.
Concentrationn λ r e s (nm) Δ λ r e s (nm) Δ λ 1 2 (nm)
46 g/L1.341764.149.33.3
104 g/L1.356766.151.33.3
165 g/L1.374768.854.03.5
287 g/L1.404773.058.23.7
Table 2. Sensitivity, signal to noise ratio, detection limit, sensor resolution, and figure of merit of proposed sensor at various hemoglobin concentrations.
c (g/L)S (nm/RIU)SNR δ n SRFOM
46144.5014.9390.007741.118443.787
104144.1015.5450.007681.107843.66
165144.3815.4280.008151.177341.251
287144.0515.7290.008591.238338.934
Publisher’s Note: MDPI stays neutral with regard to jurisdictional claims in published maps and institutional affiliations.

